
 ?Mathematical formulae have been encoded as MathML and are displayed in this HTML version using MathJax in order to improve their display. Uncheck the box to turn MathJax off. This feature requires Javascript. Click on a formula to zoom.
ABSTRACT
This study estimates progressivity of out-of-pocket (OOP) health payments and their determinants using South African Income and Expenditure Surveys. Concentration is decomposed to examine the effect of household determinants on OOP inequality, shedding light on how progressivity/regressivity is related to changes in the concentration and elasticities of the determinants over time. Our results suggest that actual OOP health expenditures are concentrated among non-poor households, although less so now than in the recent past. When OOP health payments are viewed from the perspective of affordability, which instead focuses on the share of payments relative to capacity-to-pay, they are regressive; However, they have become less concentrated amongst poor households, although still regressive, recently. These results appear to be independent of the measure of socioeconomic status employed in the analysis. The results highlight large income and education-related disparities and also suggest continued gender and ethnic differences that deserve further attention in policymaking.
KEYWORDS:
1. Introduction
When it comes to assessing health inequality and changes in it, a common approach is to follow the public finance literature, examining indexes of inequality, such as the Kakwani Index. Doing so requires tying a measure of health care (financing) to a measure of well-being. Early examples in the literature include (Klavus, Citation2001), who examines Finland from 1987 to 1996. He finds that out-of-pocket payments are regressive in both periods, while the changes in the level of regressivity was not statistically significant. The results did not incorporate decomposition, although more recent research has. For example, (Ataguba, Citation2016) assesses the progressivity of health care in South Africa using the 2005-06 and 2010-11 Income and Expenditure Surveys. He finds that the health care system is progressive, that health insurance is particularly so, while out-of-pocket payments (OOP) are regressive, having become more so. He further decomposes the changes in regressivity/progressivity into changes in the income distribution and changes in the health payments distribution. We complement that research by incorporating a wider range of controls and applying a different measure of concentration; we also find different results to what he presents.
A different, but related, strand of the literature examines the determinants of OOP. Hwang et al. (Citation2001) assesses OOP comparing people with and without chronic conditions using 1996 US Medical Expenditure Panel Survey. They find personal medical care OOP rising with the number of chronic conditions, a result that persists after controlling for insurance status and other demographic determinants. They also find that health insurance matters. The uninsured have the highest OOP and are five times more likely to see a medical care provider in a given year. In a developing country setting with free public health care, such as Sri Lanka (Fernando, Citation2000; Pallegedara and Grimm, Citation2018) assess the effect of free public care on a range of OOP types. Their main concern is whether or not free care leads to rationing in the public sector and pushes patients towards the more expensive private sector. Although they find that increased income directly correlates with increased OOP, and this increase is driven mainly by private health care, they argue that this observation is related to poor quality in the public sector. Otherwise, they find little evidence to suggest more shifting from the public sector to the private sector. There are similar worries in South Africa, especially with regard to quality of care and queuing for services (Burger et al., Citation2012; Burger and Christian, Citation2018).
Modelling OOP determinants tends to be based on regression. For example, Onwujekwe et al. (Citation2010) employs logit regression to examine the socio-economic determinants of OOP payments for health care in South-East Nigeria. They find that females are less likely than men to incur OOP, but that OOP is associated with larger household sizes, transport costs and the head's education. Oyinpreye and Moses (Citation2014) finds that age, household size and per capita consumption expenditure are major determinants of OOP payments in the South-South geographical zone of Nigeria. You and Kobayashi (Citation2011) examine OOP determinants in China using Heckman's sample selection model finding that self-reported health, age (especially for the elderly), education, residing in urban areas and perceived severity of illness all matter. On the other hand, Mwenge (Citation2010) employs Tobit using Zambian data finding that households headed by individuals younger than 25 years had lower OOP payments compared to those aged 64 years and above. Also, households residing in urban areas, married households and male-headed households had higher OOP than their counterparts.
In summary, Ataguba (Citation2016); Klavus (Citation2001) provide information on the degree of progressivity in OOP payments and whether or not progressivity has changed over time; however, they offer little evidence on the drivers of those changes. A larger literature, on the other hand, uncovers the socio-economic determinants of OOP payments (Hwang et al., Citation2001; Mwenge, Citation2010; Onwujekwe et al., Citation2010; You and Kobayashi, Citation2011; Oyinpreye and Moses, Citation2014; Pallegedara and Grimm, Citation2018), but does not consider changes and whether or not various determinants have become more or less important over time. Such information can be important. In a country like South Africa, which is working to overcome the inequality in health inherited from the apartheid regime, such information may point to successes, as well as areas in need of further scrutiny or support. Therefore, our primary contribution is to complement previous research. We assess social determinants of OOP, particularly over time, decomposing the changes in the factors explaining OOP inequality.
We make use of existing methodological developments; specifically, we employ concentration curves and indexes to examine OOP regressivity in South Africa. We further tie OOP inequality to its determinants, through regression and decomposition techniques, matching the relative change in OOP inequality to changes in the social determinants of health payments. We follow (Wagstaff et al., Citation2003), who outline an extension to Oaxaca (Oaxaca, Citation1973) decomposition, which attempts to map changes in a health variable's inequality to the inequalities and elasticities in the social determinants of that health variable – an elasticity is the percentage change in OOP or related measure arising from a percent change in the respective social determinant. Similar research focusing on ill health status, rather than OOP, is available for South Africa (Omotoso and Koch, Citation2018); thus, we offer a different focus. Our analysis covers 2005-06 (Statistics South Africa, Citation2008b), approximately one decade after the end of apartheid and user fee abolition to a select group of South Africans, to 2010-11 (Statistics South Africa, Citation2012b), the last time an Income and Expenditure Survey was undertaken in South Africa.Footnote1 Each is a nationally representative household survey collected by Statistics South Africa and were collected in the democratic era. Therefore, the analysis indirectly correlates post-apartheid policies with either a worsening, or not, of OOP-based health care inequality over time.
Our results point to reduced inequality for all of our OOP measures over the time period. In some cases, payments that were concentrated among well-off households (progressive) in 2005-06 became less so by 2010-11, while in others, payments that were concentrated among the poorest households became less so. As might be expected, household demographic variables, such as household male headship, children and adults were all concentrated in relatively poorer households, while access to income, medical aid and advanced education was concentrated in the well-off households.Footnote2 Despite those differences, the importance of those variables, as measured by their elasticities, did change, such that by 2010, a number of these determinants were less important in explaining the overall level of concentration. We do find that the minority white population, which was heavily advantaged under apartheid (and, therefore, are concentrated among the well-off), explains a similar proportion of the inequality in 2010-11 as in 2005-06, despite the fact that other variables also concentrated among the well-heeled were included in the analysis. Although such results are not surprising, given what we know about the South African income distribution, since the fall of apartheid (Leibbrandt et al., Citation2005, Citation2010; Leibbrandt and Levinsohn, Citation2011), it does remind us that more needs to be done to improve the prospects, in this case, the OOP health care prospects, of the previously disadvantaged population groups.
2. Data
Data for this analysis is obtained from two nationally representative cross-sectional Income and Expenditure Surveys (IES) collected in 2005-06 and 2010-11 among South African households (Statistics South Africa, Citation2008b, Citation2012b). As needed for the analysis we consider here, the surveys collected information on household income and consumption expenditures. Each survey is based on a two-stage stratified random sample, so the data can be weighted to the population; weights were used throughout the analysis. In 2005–06, the statistical agency switched to a a rotating diary method, which was continued in 2010–11. Thus, each of the surveys used follows a similar data collection method. Although that does not guarantee the data can be compared over time, it does imply that making such a comparison is reasonable.
In each of the survey years, the sampling units were divided into quarterly allocations, such that an equal number was interviewed each month in an effort to maintain national representivity, while potentially covering seasonal purchases more accurately (Statistics South Africa, Citation2008c, Citation2008a; Yu, Citation2008). In 2005-06, that meant that the 3 000 primary sampling units (PSUs), which were was based on the 2001 population census areas, were split into 4 groups and one-third of each quarterly group was sampled in any one month (Statistics South Africa, Citation2008c). Thus, the survey was carried out over 12 months. A systematic sample of 8 dwelling units was drawn and interviewed, resulting in 24 000 dwelling units. In the end, 22 617 of the identified 25 192 households from the 24 000 dwelling units participated in the survey. Missing information across some of the relevant variables limited the analysis to 20 994 households.
A similar approach was followed in 2010-11, but there were 3 080 PSUs obtained from the master sample, as well as a supplement of 174 urban PSUs obtained from the PSU frame, instead. Although this master sample was also drawn from the 2001 population census, it had been revised from the frame used in the 2005-06 survey. From the 3 080 PSUs and 174 urban PSUs underpinning the 2010-11 frame, 31 007 and 412 dwelling units were sampled, respectively, yielding a total sample of 31 419 dwelling units (Statistics South Africa, Citation2012a). However, data from only 25 328 households is available. As with the 2005-06 data, there was missing information for some of the relevant data, and, therefore, the analysis is based on 25 124 households.
In both surveys, respondents were asked to record their purchases (daily) for a month, while at the end of each week, a fieldworker collected the record from the respondents. One concern that does arise, when expenditure is recorded in a diary is that it does require households to vigilant. It is possible that small purchases will be missed, while other rare purchases might also not show up properly in the data (Yu, Citation2008).
2.1. Definition of variables
Total household OOP health payments included expenses on consultations, x-ray services, medicines, therapeutic appliances and equipment, dental services, hospital service fees, pharmacy fees, traditional healer fees, services received from medical auxiliaries and other related medical products and service fees (Xu, Citation2005). Importantly, these expenditures do not include any reimbursements that patients expect to receive or have received from their medical aid schemes. As we are dealing with two different survey years, we used the health consumer price index (CPI) from each of the years (90.5 in March 2006 and 126.1 in March 2011) to deflate the nominal values to make them comparable.
In addition to OOP, data on household total consumption expenditure and income were also included. Further, we separated total consumption into food and nonfood expenditure and we calculated non-subsistence expenditure. As with health expenditures, food expenditure was deflated with the food CPI (76.8 in March 2006 and 115.0 in March 2011), while non-food expenditure was deflated using the total CPI (84.3 in 2006 and 115.3 in 2011). We followed (Xu, Citation2005) to develop non-subsistence expenditure (NSE), although we used a different equivalence scale – – which has been used widely in the South African literature (Leibbrandt and Woolard, Citation1999; May et al., Citation1995). That same scale was used to adjust total household income, total household consumption and nonfood expenditure to create: adult equivalent total income, adult equivalent total expenditure (AETE) and adult equivalent nonfood expenditure (AENFE).Footnote3 OOP was divided by NSE, AETE and AENFE to get OOP shares. These shares give us a different vantage point to consider health care financing: for example ZAR100 out-of-pocket might seem small, but if it is spent from a discretionary budget of 100, it is no longer small.
According to the World Health Organization (World Health Organization, Citation2008), social determinants of health include the physical environment, access to health care, educational attainment, income level and age. These determinants are shaped by political, social and economic forces and are responsible for inequity in health care and health financing. Therefore, the choice of socio-economic determinants was based on these identified factors. However, in South Africa, prior to 1994, access to basic services such as to education, health care and employment were subject to legislated racial discrimination, while gender differences also existed (Omotoso and Koch, Citation2018). Consequently, existing empirical literature has documented the important role of gender and ethnicity in influencing health care financing (Xu and Saskena, Citation2011; You and Kobayashi, Citation2011; Oyinpreye and Moses, Citation2014; Ataguba et al., Citation2015); therefore, we also include these variables.
The explanatory variables used in this analysis cover: (i) education of the household head, divided into no schooling, some schooling, completed primary, completed secondary and completed tertiary); (ii) ethnicity of the household head (black/African, mixed – denoted by coloured in our household surveys, Asian/Indian and White); (iii) age of the household head in years;Footnote4 (iv) the total number of children as well as the number of children under the age of 5; (v) the total number of adults and elderly – over 60 – adults in the household; (vi) medical aid access in the household (whether or not someone in the household has access to a medical aid); (vii) whether the household has a flush-toilet on site; and residence, such as (viii) province (Western Cape, Eastern Cape, Northern Cape, Free State, KwaZulu-Natal, North-West, Gauteng, Mpumalanga and Limpopo) and (ix) urban locale.
3. Theoretical framework and empirical methods of estimating inequality in OOP payments
3.1. Plotting a concentration curve and estimating a concentration index
A concentration curve plots the cumulative shares of household OOP or OOP shares (On the axis) against the percentiles of socioeconomic status (on the
axis) ranked by the cumulative percentage of the population. If everyone, irrespective of their living standards, pays exactly the same proportion of their income towards health care via OOP, the concentration curve will be a 45
line (showing equality) running from the bottom left-hand corner to the top right-hand corner. However, inequality against the poor exists, if the curve lies above the line of equality; it is against the rich if the curve lies below that line (O'Donnell et al., Citation2008). However, the concentration curve does not give information on the magnitude of inequality, which is provided by the concentration index or Kakwani index Kakwani (Citation1976). The concentration (Kakwani) index is directly related to the concentration curve and it quantifies the degree of socio-economic-related inequality in OOP payments (Kakwani, Citation1976; Wagstaff, Citation2000). OOP are progressive if the Kakwani index (C) takes a positive value, and regressive if negative. However, over time, progressivity (regressivity) of OOP payments can vary, implying a shift in concentration of OOP between poor households and non-poor households (Ataguba, Citation2016). For this reason, after computing the C to quantify the degree of inequality in OOP, we examine the change and decompose the change.
The concentration index can be computed as the covariance between OOP health payments and the weighted fractional rank in the distribution of socio-economic status
(O'Donnell et al., Citation2008); in summation format, this becomes:
(1)
(1) where C is the concentration index, the measure of relative inequality. In other words, doubling everyone's health financing value leaves the C unchanged.
is household out-of-pocket health care payments or shares,
is the fractional rank of household i in the socio-economic status distribution and μ is the weighted mean of OOP (or its share). The C can either be positive or negative, suggesting the direction of the relationship between our health care payment measure and socio-economic status rank. Although conceptually clear, the rank of a household in the socioeconomic status distribution will depend on the measure of that status, although it doesn't depend on the variation in the living standards itself (Wagstaff, Citation2000). In other words, by definition, a change in income inequality should not affect the C. For computation purposes, we estimate the C from the convenience regression version in Equation (Equation2
(2)
(2) ).
(2)
(2) In (Equation2
(2)
(2) ),
is the weighted variance of the weighted fractional rank, α is the intercept, β is an estimate of the concentration index and
is the error term.
3.2. Decomposing a change in concentration index
We follow (Wagstaff et al., Citation2003) to decompose the changes in the concentration index into the contribution of individual factors to its inequality. Each contribution of the individual factor to inequality is a product of the sensitivity of the health financing variable with respect to that factor and the degree of inequality in that factor. Initially, we undertake an analysis within each year, to offer insight into the determinants of inequality in health care payments. However, we extend that to account for the changes over time.
Assuming a linear relationship between health care payments and the contributions of k determinants, ,
(3)
(3) where the X variables are described in the data section. Substituting Equation (Equation3
(3)
(3) ) into Equation (Equation1
(1)
(1) ) – results in a decomposition that assumes the overall concentration index (C) to be a linear combination of the concentration indexes of the determinants plus an error term:
(4)
(4) where μ is the weighted mean of OOP;
is the weighted mean of each determinant,
is the concentration index for the kth determinant calculated from a version of Equation (Equation1
(1)
(1) ) that replaces
with
;
is the generalised concentration index for the error term
, defined as
(5)
(5) As shown by Wagstaff et al. (Citation2003), the general approach to unravel the causes of changes in OOP payment inequality is to allow every component of the decomposition in Equation (Equation4
(4)
(4) ) to change over the time period of interest. That time difference yields:
(6)
(6) However, they further argue that this approach is uninformative, since it does not allow one to estimate to what degree changes in inequality in OOP are attributable to changes in inequality in its determinants or elasticities of those determinants. Instead, Wagstaff et al. (Citation2003) propose an application of Oaxaca-type decomposition (Oaxaca, Citation1973; Blinder, Citation1973) to Equation (Equation4
(4)
(4) ), which yields:
(7)
(7) where t refers to time period and Δ denotes the first difference.
We undertake this analysis in R (R Core Team, Citation2020). We have borrowed heavily from the source code for the IC2 package (Plat, Citation2012), which was developed to estimate extended concentration curves (O'Donnell et al., Citation2008) and indexes, but does not incorporate the decomposition.Footnote5
4. Empirical results
4.1. Data summary
Table presents descriptive statistics (weighted means) and 95% confidence intervals for our two survey years, 2005-06 and 2010-11. Although a somewhat conservative statistical test, any variables for which no overlap in the confidence intervals exists, does tell us whether or not the population mean for that variable has changed between 2005-06 and 2010-11. To oversimplify, that is true for a large number of the variables used in the analysis. In particular, there has been a change in the ethnic and urban composition of households; there has also been an increase in education completion over time, while fewer households are covered by a medical aid. We also find that there is limited evidence of improvement in the proportion of households with on-site access to a flush toilet. Despite the fact that the two tables compare real values of expenditure overall, on food and on health care OOP, we see large increases across the two surveys, although the OOP values are fairly similar.
Table 1. Summary statistics of analysis data.
In addition to the means of the variables, we have plotted concentration curves for each of our measures of OOP health care payments: actual OOP along with three different OOP share measures. Figure depicts those concentrations curves using household income per adult equivalent as the measure of socio-economic status.Footnote6 Panel (a) illustrates 2005-06, while panel (b) covers 2010-11. Although comparing concentration using the figures is not perfect, the figures suggest that all of the concentration curves are closer to the line of equality in 2010-11 than in 2005-06, which implies that concentrations have become less unequal than they were.
Figure 1. Concentration Curves for out-of-pocket payment concentration and out-of-pocket payment as a share of the capacity-to-pay for the years 2005-06 and 2010. Note: Out-of-pocket payment share denominators are determined by different capacities to pay: adult equivalent total expenditure (AETE), adult equivalent nonfood expenditure (AENFE) and non-subsistence expenditure (NSE). Socioeconomic status is determined by household income per adult equivalent, and all data is weighted. (a) Concentration in 2005. (b) Concentration in 2010.
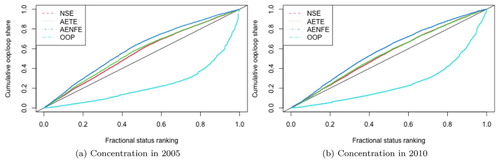
The estimated concentration indexes are in Table , and the values back-up our suppositions from the figures. OOP, on its own, is the most progressive, and matches our expectations from a health system that has eliminated user fees for a wide swath of the population, including those with lower incomes (Brink and Koch, Citation2015; Koch and Racine, Citation2016). We find health care OOP to be progressive, although we document slightly lower levels of OOP progressivity compared to Ataguba and McIntyre (Citation2012). We also find relatively more regressivity based on OOP shares, and our estimates are a bit larger (in absolute terms) than those presented by Ataguba (Citation2016), who uses the same data, but rather different methods. The most regressive curve in the figure is the one associated with the share of OOP out of adult equivalent nonfood expenditure. As shown elsewhere, OOP shares are quite low in South Africa (Setshegetso, Citation2020). Even though they are low, the results do suggest a positive change; the share of household non-subsistence spending devoted to health care OOP, among poorer households relative to richer households, has fallen.
Table 2. Estimated concentration indexes and standard errors for out-of-pocket payments and shares relative to capacity-to-pay.
4.2. Decomposition within years
Tables and present the within-year decomposition of the OOP health payments concentration index. Each table contains 16 columns, four for each of the OOP health care finance payments. Within each set, we see the concentration index: the first row is the overall OOP health payment index, while the remaining rows cover the index for the rest of the factors.Footnote7 We will briefly discuss the last four columns of each table, as there are far too many numbers to discuss succinctly.
Table 3. Concentration index decomposition (2005), where socioeconomic status is based on adult equivalent household income.
Table 4. Concentration index decomposition (2010), where socioeconomic status is based on adult equivalent household income.
In 2005-06, the largest elasticities (all positive, in this case) are for: age of the household head, adult equivalent income, white households and total children in the household. On the other hand, the concentration indexes were largest for variables that one would expect to see concentrated among the well-off: the completion of tertiary education by the household head, white households (given South Africa's apartheid history), adult equivalent income and access to a medical aid. Given the way the decomposition is determined, it is not surprising that adult equivalent income and white households are the largest contributors to inequality in OOP payments. On the other hand, the largest detractor from inequality is for the total number of children in the household, which are more concentrated among the poor and has a relatively high elasticity. In this case, since the inequality measure is pro-rich, and, therefore, OOP payments are progressive, a detractor reduces the degree of progressiveness in inequality, i.e. it pushes it towards greater equality.
In 2010-11, elasticities were the largest for white households, adult equivalent income, adults in the household and access to a medical aid. On the other hand, the concentration was largest (thus, concentrated among the well-off) for the completion of tertiary education by the head of the household, white households, adult equivalent income and medical aid status. Therefore, the largest contributors to inequality in OOP payments were white households, adult equivalent income, medical aid access and tertiary education. There was little in the way of inequality mitigation, although having a flush toilet on-site and young children in the household were associated with a small reduction in inequality. As with the 2005-06 OOP concentration index, since the inequality was progressive, the reduction in inequality made it slightly less progressive, and, therefore, more equal.
4.3. Decomposition across years
As outlined in the methods section, we decompose the changes in the health payments concentration index; see (Equation7(7)
(7) ) for details. Our focus is on the extent to which changes in OOP payments inequality over time are due to changes in inequality in the factors that explain OOP and/or changes in their elasticities. We present results that use adult equivalent household income as the measure of socioeconomic status in Table .
Table 5. Concentration index decomposition from 2005-06 to 2010, where socioeconomic status is based on a first principal component asset index.
As with the previously discussed tables, this table includes 16 columns, four for each of the four measures of OOP-related health care financing. Within each finance group, we provide two sets of decompositions, the first, measures the effect of the change in the factor's concentration index, holding the elasticity at the 2005–06 value. The second,
accounts for the change in elasticity over time, but holds the concentration index at the 2010–11 value.Footnote8
To keep the discussion simple, we focus, as before, on only the last four columns, which are based on OOP health care financing, rather than OOP shares. Between 2005-06 and 2010-11, the concentration index decreased by approximately 4 points (out of 100), falling from 0.536 to 0.498; see the first row of the last four columns of Tables and to verify. The factors contributing most to this reduction were (which means that they are working in the same direction, i.e. a reduction in this case): households with a head that had completed ether tertiary or secondary education, children under 5 and adult equivalent income. Not all factors, however, contributed to the reduction. Some worked against, including: the total number of children in the household, white households and households, whose head had not completed any schooling.
5. Discussion of results
We initially presented concentration curves and indexes for two survey years, 2005-06 and 2010-11. From these curves and indexes, we see that actual OOP payments are progressive, in agreement with (Ataguba and McIntyre, Citation2012); it is also to be expected, given the low rates of catastrophic health payments found by Koch and Setshegetso (Citation2020b). For the various OOP share measures, the concentrations were closer to zero (in absolute terms), albeit providing evidence of share regressivity. Thus, in addition to agreeing with previous findings related to the low levels of catastrophic expenditure, we are also able to show that these shares are fairly equally distributed. Thus, in terms of affordability, there is some evidence to suggest that out-of-pocket health care financing, as a share of an individual's ability to pay, is nearly equitable. The reason for that, as we also show, is that actual OOP payments are progressive; it is the better-off households that make most of these or at least most of the larger payments. Although this could be good news, as it suggests that health care financing has become less reliant on OOP payments from poor households, it may also suggest that poorer households are simply less likely to make use of health care. Either way, the results do suggest that more work is needed to further offset the budgetary effects of out-of-pocket payments. No, they do not pay much out-of-pocket; however, given how little they have, any payment is more problematic for them than for others.
We extended the analysis to examine the socio-economic factors that contribute to OOP payment concentration, decomposing the effects of these factors on the overall picture within and across years, calculating the contribution of each factor to the overall level of concentration. Since actual OOP payments were concentrated pro-rich, factors that were also concentrated among the rich contributed to OOP payment inequality. For example, medical aid access and adult equivalent income are fairly concentrated among rich households and were found to contribute to (pro-rich) inequality in OOP health payments. Education, which is pro-rich, especially for high levels of education (completed secondary and completed tertiary), also explains OOP health care payments inequalities; however, not nearly to the degree as adult equivalent income and medical aid access. Discouragingly, despite the fact that apartheid ended more than 15 years before the final data set was collected, white households are highly concentrated within the upper end of our measures of socio-economic status, and this has worsened. This small group of households, approximately 12.5% of the sample in either year, see Table , explains a large percent of the total level and the total change in OOP health payment inequality.
We included a range of additional controls in our analysis, such as: male-headship; age of the household head; young children and elderly adults in the household. We did so, because the theoretical and empirical literature finds that these variables are often related to health, and, therefore, could be expected to relate to health payments, whether or not they are OOP. With respect to theory, Grossman (Citation1972, Citation2000) highlight the importance of health capital depreciation, which worsens with age. There is extensive empirical evidence in support of increased OOP payments for the elderly and the young (Su et al., Citation2006; Barros et al., Citation2011; Akinkugbe et al., Citation2012; Rahman et al., Citation2013; Adisa, Citation2015; Brinda et al., Citation2015; Choi et al., Citation2015; Wang et al., Citation2015; Doubova et al., Citation2015; Ntuli et al., Citation2016). In our results, we did find some evidence that male-headship, as well as the age structure of the household offered some explanatory power in explaining OOP payment inequality and its change over this five-year period; however, the contribution of family structure was somewhat larger for children than for the elderly; furthermore, the decomposition effects and the change in decomposition effects did not generally work in the same direction for both young children and elderly adults in the household, as expected, given the literature.
Finally, we considered measures related to sanitation, such as a flush toilet, on-site, which is expected to matter for health, and, therefore, OOP health financing. For example, dirty and contaminated water combined with poor sanitation contributes to malnutrition and is also a leading cause of death in children, particularly those under five years of age (Ghiasvand et al., Citation2014). Furthermore, O'Donnell et al. (Citation2005) find that catastrophic health expenditure incidence is lower in households with a sanitary toilet and safe drinking water. Those results suggest that clean living conditions may offer health care financial risk protection to households. We find some evidence that access to an on-site flush toilet matters for reducing the progressivity of OOP health financing; the within year effects are rather small.
6. Conclusion
This research has examined the distribution of OOP health care payments, which offers us a partial answer to who pays for health care out-of-pocket? However, the answer is not particularly short. We find that the households who are in a stronger socioeconomic position, either in terms of income or asset wealth, are more apt to incur OOP payments. For a country like South Africa, which has adopted a number of social protection policies, such as user fee abolition for those in poorer economic circumstances, it is not surprising that out-of-pocket payments are less concentrated among the poor households.
However, the distribution of the ratio of out-of-pocket payments to (adjusted) household expenditure falls on poorer households. Fortunately, from 2005–06 to 2010–11, out-of-pocket payments and payment shares have become less regressive. The clear decrease in regressivity, however, has been matched by increases in income inequality, medical aid access inequality and educational attainment inequality, each of which is more skewed towards the well-heeled in South Africa. Such results highlight the potential inequality reduction benefits of alternatives to OOP health financing.
For the most part, the increase in inequality in education, medical aid access, income and ethnicity have worked to make OOP health financing, either as shares or in total, more regressive over time, a potentially worrisome trend. Such results suggest that health care financing policy conducted in a vacuum could yield less fruitful gains than one that is part and parcel of an over-arching human capital policy. Health and education are co-determinants of human capital, as we have known for quite some time (Grossman, Citation1972, Citation2000); therefore, improvements in both are necessary, especially if there are improvements among the poor.
This research received ethical clearance from the University of Pretoria, Faculty of Economic and Management Sciences Ethics Committee. The authors would like to thank Marie Kirsten, the editor, Ronelle Burger and two anonymous referees for their comments on an earlier draft of this manuscript. Any remaining errors rest with the authors.
Disclosure statement
No potential conflict of interest was reported by the author(s).
Notes
1 In previous research, we had made use of 1995 IES data, which gives us a longer time frame for the analysis, but raises concerns over dynamic comparability, since the two surveys are collected with different methodologies. We thank a reviewer for stressing that concern.
2 Medical aid in South Africa is similar to health insurance in much of the rest of the world. Individuals pay premiums, potentially funded by employers, and the medical aid scheme covers some portion of health care costs at the point-of-service.
3 Althought (Ataguba, Citation2016) uses , Koch (Citation2018) estimates a number of scales and notes that the choice of scale does not impact non-subsistence expenditure; its definition both multiplies and divides by that same scale during the calculation. However, it would be expected to affect adult equivalent total and nonfood expenditure, since the scale is only used in division in those calculations.
4 In the 2005-06 survey, age is only available in 5 year bands, except for the ‘85+’ group; thus, for all below the top group, the midpoint was used for the age. For those in the top group, 90 was used.
5 The analysis code is available from the authors upon request.
6 See Koch and Setshegetso (Citation2020a) for more detail, including analysis based on assets.
7 Yes, each factor's C is the same for each of the outcomes, because we use the same socioeconomic status measure.
8 As suggested by O'Donnell et al. (Citation2008), other weighting structures are possible. We present an alternative weighting structure and respective results in Koch and Setshegetso (Citation2020a).
References
- Adisa, Olumide, 2015. Investigating determinants of catastrophic health spending among poorly insured elderly households in Urban Nigeria. International Journal for Equity in Health 14(1), 79. doi:10.1186/s12939-015-0188-5.
- Akinkugbe, OluyeleMirriam Chama-Chiliba, Chitalu & Tlotlego, Naomi, 2012. Health financing and catastrophic payments for health care: Evidence from household-level survey data in Botswana and Lesotho. African Development Review 24(4), 358–70. doi:10.1111/1467-8268.12006.
- Ataguba, JE, 2016. Assessing equitable health financing for universal health coverage: A case study of South Africa. Applied Economics 48(35), 3293–306. doi:10.1080/00036846.2015.1137549.
- Ataguba, JEDay, C & McIntyre, D, 2015. Explaining the role of the social determinants of health on health inequality in South Africa. Global Health Action 8(1), 1–11. doi:10.3402/gha.v8.28865.
- Ataguba, JE & McIntyre, D, 2012. Paying for and receiving benefits from health services in South Africa: Is the health system equitable. Health Policy and Planning 27, 35–45. doi:10.1093/heapol/czs005.
- Barros, AJDBastos, JL & Damaso, AH, 2011. Catastrophic spending on health care in Brazil: Private health insurance does not seem to be the solution. Cad Saude Publica 27(2), 254–62. doi:10.1590/S0102-311X2011001400012.
- Blinder, A, 1973. Wage discrimination: Reduced form and structural estimates. Journal of Human Resources 8(4), 436–55. doi:10.2307/144855.
- Brinda, Ethel MaryKowal, PaulAttermann, Jörn & Enemark, Ulrika, 2015. Health service use, out-of-pocket payments and catastrophic health expenditure among older people in india: The WHO study on global AGEing and adult health (SAGE). Journal of Epidemiology and Community Health 69(5), 489–94. https://jech.bmj.com/content/69/5/489.long.
- Brink, AS & Koch, Steven F, 2015. Did primary healthcare user fee abolition matter? Reconsidering South Africa's experience. Development Southern Africa 32(2), 170–92. doi:10.1080/0376835X.2014.984373.
- Burger, RonelleBredenkamp, CarynGrobler, Christelle & van der Berg, Servaas, 2012. Have public health spending and access in South Africa become more equitable since the end of apartheid? Development Southern Africa 29(5), 681–703. doi:10.1080/0376835X.2012.730971.
- Burger, Ronelle & Christian, C, 2018. Access to health care in post-apartheid South Africa: Availability, affordability, acceptability. Health Economics, Policy and Law 15, 43–55. doi:10.1017/S1744133118000300.
- Choi, JWChoi, JWKim, JHYoo, KB & Park, EC, 2015. Association between chronic disease and catastrophic health expenditures in Korea. BMC Health Services Research 15, 26. doi:10.1186/s12913-014-0675-1.
- Doubova, Svetlana VPérez-Cuevas, RicardoCanning, David & Reich, Michael R, 2015. Access to health care and financial risk protection for older adults in Mexico: Secondary data analysis of a national survey. BMJ Open 5(7). doi:10.1136/bmjopen-2015-007877.
- Fernando, D, 2000. Health care systems in transition III: Sri Lanka, part I: An overview of Sri Lanka's health care system. Journal of Public Health Medicine 22(1), 14–20. doi:10.1093/pubmed/22.1.14.
- Ghiasvand, HShabaninejad, HArab, M & Rashidian, A, 2014. Hospitalization and catastrophic medical payment: Evidence from hospitals located in Tehran. Archives of Iranian Medicine 17(7), 507–13. http://www.aimjournal.ir/PDF/51_july2014_0012.pdf?t=636766826769135070.
- Grossman, M, 1972. The demand for health: A theoretical and empirical investigation. New York, Columbia University Press, https://www.jstor.org/stable/10.7312/gros17900.
- Grossman, M, 2000. Chapter 7 – the human capital model. Handbook of Health Economics 1, 348–408. doi:10.1016/S1574-0064(00)80166-3
- Hwang, WWeller, WIreys, H & Anderson, G, 2001. Out-of-pocket medical spending for care of chronic conditions. Health Affairs 20(6), 267–78. http://www.partnershipforsolutions.org/DMS/files/Out-of-pocket2002.pdf.
- Kakwani, NC, 1976. Measurement of tax progressivity: An international comparison. The Economic Journal 87, 71–80. https://www.jstor.org/stable/2231833.
- Klavus, J, 2001. Statistical inference of progressivity dominance: An application to health care financing distribution. Journal of Health Economics 20, 363–77. doi:10.1016/S0167-6296(00)00084-9.
- Koch, Steven F, 2018. Catastrophic health payments: Does the equivalence scale matter? Health Policy and Planning 33(8), 966–73. doi:10.1093/heapol/czy072.
- Koch, Steven F & Racine, JS, 2016. Health facility and user fee abolition: Regression discontinuity in a multinomial choice setting. Journal of the Royal Statistical Society, Series A 179(4), 927–50. https://rss.onlinelibrary.wiley.com/doi/pdf/10.1111/rssa.12161.
- Koch, Steven F & Setshegetso, Naomi, 2020a. Progressivity of out-of-pocket payments and its determinants decomposed over time. University of Pretoria, Department of Economics, Working Paper 2020112.
- Koch, Steven F & Setshegetso, Naomi, 2020b. Catastrophic health expenditures arising from out-of-pocket payments: Evidence from South African income and expenditure surveys. PloS One 15(8), 1–14. doi:10.1371/journal.pone.0237217.
- Leibbrandt, Murray & Levinsohn, James, 2011. Fifteen years on: Household incomes in South Africa. National Bureau of Economic Research, Working Paper 16661. http://www.nber.org/papers/w16661.
- Leibbrandt, MurrayLevinsohn, James & McCrary, Justin, 2005. Incomes in South Africa since the fall of apartheid. National Bureau of Economic Research, Working Paper 11384. http://www.nber.org/papers/w11384.
- Leibbrandt, MurrayWoolard, IFinn, A & Argent, J, 2010. Trends in South African income distribution and poverty since the fall of apartheid. OECD Social, Employment; Migration Working Papers. https://doi.org/10.1787/5kmms0t7p1ms-en.
- Leibbrandt, Murray & Woolard, Ingrid, 1999. A comparison of poverty in South Africa's nine provinces. Development Southern Africa 16(1), 37–54. doi:10.1080/03768359908440060.
- May, JCarter, M & Posel, D, 1995. The composition and persistence of poverty in rural South Africa: An entitlements approach. Land; Agriculture Policy Centre Policy Paper No. 15. Land; Agriculture Policy Centre.
- Mwenge, F, 2010. Progressivity and determinants of out-of-pocket health care financing in Zambia. Master's thesis, Health Economics Unit, School of Public Health; Family Medicine, University of Cape Town. https://open.uct.ac.za/bitstream/handle/11427/12369/thesis_hsf_2010_mwenge_f.pdf?sequence=1.
- Ntuli, MChitiga-Mabugu, MKaruaihe, SAlaba, FTsoanamatsie, T & Kwenda, P, 2016. Gender inequalities in morbidity: A south african investigation. Journal of Studies in Econmics and Econometrics 40(3), 39–64.
- O'Donnell, Owenvan Doorslaer, EddyRannan-Eliya, Ravi PSomanathan, AparnaaGarg, Charu CHanvoravongchai, PiyaHuq, Mohammed NKaran, ALeung, GMTin, K & Vasavid, C, 2005. Explaining the incidence of catastrophic expenditures on health care: Comparative evidence from Asia. EQUITAP Project, Working Paper No.5. http://www.equitap.org/publications/docs/EquitapWP5.pdf.
- O'Donnell, Owenvan Doorslaer, EddyWagstaff, Adam & Lindelow, Magnus, 2008. Analyzing health equity using household survey data: A guide to techniques and their implementation. World Bank. http://siteresources.worldbank.org/INTPAH/Resources/Publications/459843-1195594469249/HealthEquityFINAL.pdf.
- Oaxaca, R, 1973. Male-female wage differentials in Urban labor markets. International Economic Review 14(3), 693–709. https://www.jstor.org/stable/2525981.
- Omotoso, Kehinde O & Koch, Steven F, 2018. Assessing changes in social determinants of health inequalities in South Africa: A decomposition analysis. International Journal for Equity in Health 17(1), 181. doi:10.1186/s12939-018-0885-y.
- Onwujekwe, OEUzochukwu, BSCObikeze, ENOkoronkwo, IOchonwa, OGOnoka, CAMadubuko, G & Okoli, C, 2010. Investigating determinants of out-of-pocket spending and strategies for coping with payments for health care in South-East Nigeria. BMC Health Services Research 10, 67. doi:10.1186/1472-6963-10-67.
- Oyinpreye, AT & Moses, KT, 2014. Determinants of out-of-pocket healthcare expenditure in South-South geopolitical zone of Nigeria. International Journal of Economics, Finance and Management 3, 6. https://pdfs.semanticscholar.org/756c/96945352364b4413cb1117fb677b55efc30c.pdf.
- Pallegedara, A & Grimm, M, 2018. Have out-of-pocket health care payments risen under free health care policy? The case of Sri Lanka. International Journal of Health Planning and Management 33, 781–797. doi:10.1002/hpm.2535.
- Plat, Didier, 2012. Ic2: Inequality and concentration indices and curves. https://CRAN.R-project.org/package=IC2.
- R Core Team, 2020. R: A kanguage and environment for statistical computing. Vienna, Austria: R Foundation for Statistical Computing. https://www.R-project.org/.
- Rahman, Md. MizanurGilmour, StuartSaito, EikoSultana, Papia & Shibuya, Kenji, 2013. Health-related financial catastrophe, inequality and chronic illness in Bangladesh. PloS One 8(2), e56873. doi:10.1371/journal.pone.0056873.
- Setshegetso, Naomi, 2020. Financial risk protection, decomposition and inequality analysis of household out-of-pocket health payments. PhD thesis, Department of Economics, Faculty of Economic; Management Sciences, University of Pretoria, Pretoria, South Africa.
- Statistics South Africa, 2008a. Income and expenditure survey 2005/06: Statistical release P0100. Statistics South Africa. http://www.statssa.gov.za/publications/P0100/P01002005.pdf.
- Statistics South Africa, 2008b. Income and expenditure survey 2005–2006 [Dataset]. Version 2.1. Pretoria: Statistics South Africa [producer], 2008. Cape Town: DataFirst [distributor], 2013. https://doi.org/10.25828/05vp-vh12.
- Statistics South Africa, 2008c. Income and expendituresurvey 2005/2006: Metadata. Statistics South Africa, Report No P01001. https://www.datafirst.uct.ac.za/dataportal/index.php/catalog/331/download/4920.
- Statistics South Africa, 2012a. Income and expenditure of households 2010/2011: Metadata. [Report No. P01000. Statistics South Africa. https://www.datafirst.uct.ac.za/dataportal/index.php/catalog/316/download/7228.
- Statistics South Africa, 2012b. Ncome and expenditure survey 2010-2011 [Dataset]. Version 1. Pretoria: Statistics South Africa [producer], 2012. Cape Town: DataFirst [distributor], 2013. https://doi.org/10.25828/00c9-rz92.
- Su, TTKouyate, B & Flessa, S, 2006. Catastrophic health expenditures for health care in a low-income society: A study from Nouna district, burkina faso. Bulletin of the World Health Organization 84, 21–27. https://scielosp.org/scielo.php?script=sci_arttext&pid=S0042-96862006000100010&lng=en&nrm=iso&tlng=en.
- Wagstaff, Adam, 2000. Research on equity, poverty and health outcomes. https://siteresources.worldbank.org/HEALTHNUTRITIONANDPOPULATION/Resources/281627-1095698140167/Wagstaff-ResearchOn-whole.pdf.
- Wagstaff, Adam & van Doorslaer, Eddy, 2003. Catastrophe and impoverishment in paying for health care: With applications to Vietnam 1993–1998. Health Economics 12, 921–34. doi:10.1002/hec.776.
- Wagstaff, Adamvan Doorslaer, Eddy & Watanabe, N, 2003. On decomposing the causes of health sector inequalities with an application to malnutrition inequalities in Vietnam. Journal of Econometrics 112(1), 207–23. https://openknowledge.worldbank.org/handle/10986/19426.
- Wang, ZLi, X & Chen, M, 2015. Catastrophic health expenditures and its inequality in elderly households with chronic disease patients in China. International Journal of Equity in Health 14, 8. doi:10.1186/s12939-015-0134-6
- World Health Organization, 2008. Closing the gap in generation: Health equity through action on the social determinants of health. Final Report of the Commission on Social Determinants of Health. Geneva, WHO, 2008. Available at: http://www.who.int/social_determinants/thecommission/finalreport/en/index.html. http://apps.who.int/iris/bitstream/handle/10665/43943/9789241563703_eng.pdf?sequence=1.
- Xu, Ke, 2005. Distribution of health payments and catastrophic expenditures methodology. World Health Organisation, Discussion paper number 2. https://www.who.int/health_financing/documents/dp_e_05_2-distribution_of_health_payments.pdf.
- Xu, Ke & Saskena, P, 2011. The determinants of health expenditures: A country-level panel data analysis. Geneva, World Health Organization, https://www.r4d.org/wp-content/uploads/TransitionsInHealthFinancing_DeterminantsofExpenditures.pdf.
- You, X & Kobayashi, Y, 2011. Determinants of out-of-pocket health expenditure in China. Applied Health Economics and Health Policy 9(1), 39–49. doi:10.2165/11530730-000000000-00000.
- Yu, Derek, 2008. The comparability of income and expenditure surveys 1995, 2000 and 2005/2006. Stellenbosch University, Department of Economics, Working Paper 05/2008.