
 ?Mathematical formulae have been encoded as MathML and are displayed in this HTML version using MathJax in order to improve their display. Uncheck the box to turn MathJax off. This feature requires Javascript. Click on a formula to zoom.
ABSTRACT
Healthcare systems around the world are facing great challenges. This has included rising health care prices and its impact on healthcare expenditures and the concomitant effects on access to healthcare, particularly in emerging and developing countries. This study focuses on health care price developments and health expenditures in South Africa. The study identifies four major results. Firstly, South Africa’s healthcare expenditures compare quite favourably with countries at similar levels of development. However, the efficiency of these expenditures lags those in comparable countries. Secondly, it was found that South Africa’s healthcare price rises have exceeded those in advanced countries even though healthcare demand and expenditures in these countries are much higher than is the case in South Africa. Thirdly, healthcare rises exceeds those in other sectors of the South African economy. Finally, healthcare price changes adversely impact healthcare expenditures in South Africa. These results indicate that price considerations are critical to improving healthcare access in South Africa. The paper also highlights some non-price determinants of healthcare access that warrant attention by policymakers in South Africa.
1. Introduction
In 2015, the member states of the United Nations – including South Africa – reaffirmed their commitment to universal health coverage (UHC) as a means of ensuring that all citizens have access to quality healthcare (World Health Organisation, Citation2019). Healthcare and access to healthcare are even considered a basic human right with a result that this finds expression in the constitution of some countries. In such cases, the government has an obligation to ensure that citizens are provided with affordable and quality access to healthcare services (UNCTAD, Citation2019). This is certainly the case for South Africa where access to healthcare is enshrined in the Bill of Rights of the Constitution.
The government has indicated that the implementation of a National Health Insurance (NHI) for South Africa is meant to improve the provision of healthcare services for all South Africans (National Department of Health, Citation2019). More specifically, the NHI is directed at creating a health system that ensures that all South Africans have access to comprehensive quality healthcare services when needed. As part of this process, the NHI envisages the state becoming a purchaser of services from the private sector as indicated by the NHI Bill. Healthcare price movements are of significance in this regard.
There is an important signalling effect of healthcare price movements given its implication for the level of financial resources needed to deliver the requisite medical services (Barber et al., Citation2019). Thus, price effects can have an important bearing on the policy objective of improving the provision of healthcare services. The information content of healthcare price movements can be very beneficial in policy formulation directed at improving access to healthcare. This paper adds to the empirical work on this subject matter by analysing the developments, characteristics, and policy implications of healthcare price developments in South Africa.Footnote1
The next section provides an overview of the empirical and theoretical considerations of relevance to this paper. Section 3 analyses South Africa’s healthcare expenditures and price movements in an international context. A comparison of South Africa’s healthcare changes to other sectors in the domestic economy is undertaken in Section 4. Some policy recommendations and conclusions are highlighted in the penultimate and final sections.
2. Some empirical and theoretical considerations
It is generally accepted that health has an important bearing on growth and economic outcomes. Endogenous economic growth models depict human capital as an important determinant of economic growth (Romer, Citation1990; Mankiw et al., Citation1992; Benhabib & Spiegel, Citation1994; World Bank, Citation2017a, Citation2017b). Theoretically, health status is positively correlated with economic development (Oni, Citation2014; Bloom & Canning, Citation2015) through its impact on learning capabilities and labour productivity (Grossman, Citation1972; Goetzel et al., Citation2004). In fact, there is a well-established ‘health-growth nexus’ which asserts that a country’s economic development is positively correlated with its health status (Mushkin, Citation1962; Preston, Citation1975; Bloom & Canning, Citation2000; World Health Organisation, Citation2005; Cole & Neumayer, Citation2006).
The impact of healthcare investments on economic growth has also received attention in the empirical literature (Boachie, Citation2017; Rosendo et al., Citation2018), as well as the relationship between improved health status and poverty reduction (Peters et al., Citation2008). It is thus not surprising that healthcare has been elevated on the policy agenda in many countries with global leaders having recently declared that ‘health is a prerequisite for sustainable and inclusive economic growth’ (Group of 20, Citation2019:8).
International evidence indicates a steady and significant rise in the prices of healthcare products and services (Claxton et al., Citation2018). Thus, the movement in healthcare prices have attracted increasing attention in both policy and academic circles (Reichert & Cebula, Citation1999; Aaron, Citation2002; Phillips, Citation2015; Verbrugge & Garcia, Citation2015; Claxton et al., Citation2018; Deloitte, Citation2019; World Health Organization, Citation2019).
Healthcare price movements refer to the changes in the prices of medical products and medical services consumed for healthcare purposes. A key policy challenge in healthcare reform entails containing the rate of increase in the consumer price index (CPI) for healthcare goods and services without substantially reducing the quality of health care (Reichert & Cebula, Citation1999). Put simply, nominal healthcare expenditures (outlays) are a function of the price and volume of healthcare products. This implies that a given volume would require an increase in nominal expenditures (outlays) if prices were to increase. Alternatively, nominal outlays would have to exceed the increase in prices if volumes were to increase. Thus, price movements have a direct bearing on the provision of healthcare services and products.
The consumer price index (CPI) is a price index of a basket of goods consumed by the average household. The South African CPI currently comprises a weighted average of 412 products and services classified under 12 categories (Statistics South Africa, Citation2017). In the case of South Africa, the health category in the CPI is made up of two sub-categories, namely, medical products and outpatient services. Medical products primarily include the prices of pharmaceutical products while outpatient services include the prices of medical services and dental services. In addition, the CPI also includes medical aid contributions under the insurance category. For the purposes of this paper, health price movements refers to the change in the prices of medical products and outpatient services while healthcare price movements refers to the change in the prices of medical products, outpatient services and medical aid contributions.
The contribution of this paper is mainly empirical in nature. The study uses publicly available data from Organisation for Economic Cooperation and Development (OECD), World Health Organisation (WHO), World Bank, Statistics South Africa, and Council for Medical Schemes in South Africa to identify some characteristics and implications of price movements in South Africa’s health sector. Three research questions inform the analysis in this paper. Firstly, how does South Africa’s healthcare expenditures and price movements compare internationally? Secondly, how does price movements in the healthcare sector compare to the rest of the economy? Thirdly, does rising healthcare prices adversely impact healthcare expenditures in South Africa? These questions inform the analysis undertaken in the next three sections.
3. South Africa’s healthcare expenditure in an international context
reflects the relationship between healthcare expenditures and income in a global context. The horizontal axis captures the average annual current health expenditure (CHE) on a per capita basis for the period 2009–17. The vertical axis reflects the GDP per capita for the year 2017. For comparative purposes, the values (current US$) are reflected at purchasing power parity (PPP) exchange rates.
Figure 1. Per capita current healthcare expenditure (CHE) and Per capita Gross Domestic Product (GDP) at PPP exchange rate (current international US$). Source: World Development Indicators database, World Bank (available at https://databank.worldbank.org/ source/world-development-indicators#).
Notes: 1. Left-hand panel reflects the data for 217 countries. 2. The right-hand panel reflects the data for the countries with a similar per capita income as South Africa and includes Namibia, Tunisia, Nauru, Indonesia, Iraq, Egypt, Bhutan, Dominica, Mongolia, Algeria, Ecuador, Moldova, Ukraine, Armenia, St. Vincent and the Grenadines, Peru, Sri Lanka, Paraguay, Libya, Fiji, Georgia, Bosnia and Herzegovina, Azerbaijan, Turkmenistan, Colombia, China, Brazil, Iran, St. Lucia, Gabon.
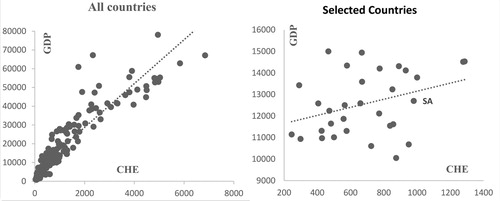
The left-hand panel reflects the healthcare expenditures for 217 countries as recorded in the World Development Indicators Database of the World Bank. As expected, there is a positive relationship between GDP and CHE. Per capita healthcare expenditures increase as per capita income rises. This aligns with the empirical evidence which shows that more developed countries have larger expenditures or outlays on healthcare costs.
The right-hand panel compares South Africa’s healthcare expenditure with 30 countries which have similar levels of per capita income.Footnote2 South Africa’s healthcare expenditure compares very favourably with the comparator group. In fact, South Africa healthcare expenditures, on a per capita basis, are much higher than many countries in the group. In fact, only 3 countries (Brazil, Iran and Bosnia and Herzegovina) spend more on a per capita basis on healthcare than South Africa.
However, what is important is the efficiency of the expenditures. The relationship between healthcare expenditures and access to healthcare services can throw some light on this issue. Access to healthcare is proxied by the universal health coverage (UHC) index which captures a country’s coverage of essential health services. It is based on tracer indicators covering reproductive, maternal, newborn and child health, infectious diseases, non-communicable diseases, service capacity and service access for the general population (World Health Organisation and World Bank, Citation2017). Larger index values depict higher access.
reflects the relationship between the universal health coverage (UHC) index and average annual per capita healthcare expenditures for year 2009–17 (US$ at PPP rates).
Figure 2. Universal Health Coverage (UHC) and per capita current healthcare expenditure (CHE) at PPP exchange rate (current international US$). source/world-development-indicators#). Source: World Development Indicators database, World Bank. (available at https://databank.worldbank.org/.
Notes: 1. The left-hand panel reflects the data for 217 countries. 2. The right hand panel consists of countries with UHC index values ranging from 65 to 75 and includes, Vietnam, Poland, Estonia, Bahamas, Greece, Dominican Republic, Venezuela, Turkey, Romania, Russian Federation, Hungary, Trinidad and Tobago, Saudi Arabia, Uzbekistan, Nicaragua, Malaysia, Antigua and Barbuda, Lebanon, Lithuania, Guyana, Grenada, North Macedonia, Iran, St. Vincent and the Grenadines, Suriname, Seychelles, Latvia, Croatia, Kyrgyz Republic, Morocco, Tunisia, Turkmenistan, Chile, Caribbean small states, Cabo Verde, Moldova, Paraguay, Armenia, South Africa, Oman, Tajikistan, Bolivia, Egypt, Ukraine, St. Lucia, Qatar, Sri Lanka, Georgia, Bulgaria, Honduras, Jamaica, Azerbaijan, Serbia.
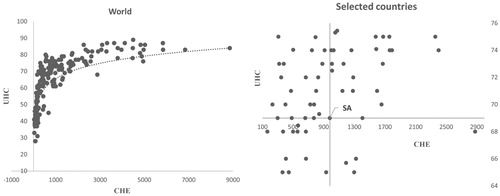
In the left-hand panel of , the relationship between healthcare expenditure (CHE) and access to healthcare (UHC) for 217 countries at different levels of per capita income are depicted. As expected, higher healthcare expenditures are associated with better access to healthcare services.
To obtain an indication of the efficiency of healthcare expenditures, we undertake a comparison of South Africa’s expenditures with 56 countries which had similar UHC levels in 2017 (, right-hand panel). The UHC index values are sourced from the World Bank Development Indicators Database. In 2017, South Africa’s UHC index measured 69 and for comparative purposes we consider all the countries having UHC index levels between 65 and 75. South Africa’s UHC index value and per capita health expenditure are used to split the sample of countries in (right-hand panel). There are many countries (top left-hand quadrant) who have better access to healthcare at similar or lower levels of per capita healthcare expenditures. This indicates that South Africa’s efficiency (price and cost) levels are worse than the comparator groups.
There are inter alia, three important characteristics associated with healthcare expenditures in South Africa that are worth noting. Firstly, there is a stark division in healthcare expenditures between the public and private sectors in South Africa. The public sector (private sector) accounted for 53.6 percent (46.4 per cent) of total healthcare expenditures in 2017 as compared to 50.5 percent (49.5 per cent) in 2009 (World Bank, Citation2020). Secondly, the number of beneficiaries covered by the private sector (through medical schemes) increased from 8.1 to around 8.8 million during the same period. However, the share of the total population being covered by the private sector through medical aid schemes has declined from 16.4 percent in 2009 to 15.6 percent in 2017 (Council of Medical Schemes, Citation2010, Citation2019). This has meant that the healthcare burden on the public sector has increased during this period.
Thirdly, healthcare expenditures in South Africa are characterised by a strong social divide with the private sector catering for people who are more affluent and educated and mainly through the provision of medical insurance (Marten et al., Citation2014). This has impacted on healthcare equity as is evident by the average spending on a member covered by medical insurance in 2017 which was approximately five times more than the average spending on an uninsured person who was reliant on public healthcare services. Thus, it is not surprising that equity considerations underpin the introduction of the NHI in South Africa.
As highlighted earlier, healthcare expenditures are influenced by price and volume effects. A key policy challenge in healthcare reform entails containing the increase in the prices of healthcare goods and services without substantially reducing the quality of health care (Reichert & Cebula, Citation1999).
Of interest is how healthcare prices in South Africa compare to those in the rest of the world. Given the data constraints the analysis is restricted to a comparison with price developments in those countries being monitored by the Organisation of Economic Co-operation and Development (OECD). In the main, these countries are members of the OECD and a few non-OECD countries (Colombia, Costa Rica, India, Russia, Saudi Arabia). Most of the countries, except for India, have higher per capita income levels than South Africa. While the difference in price developments across the group could be due to different reasons (for example, poor competition, import costs etc.), this comparison is instructive in the sense that it provides a benchmark for evaluating price developments in South Africa’s healthcare sector, particularly given that many of the medical products that are imported are sourced from these countries.Footnote3
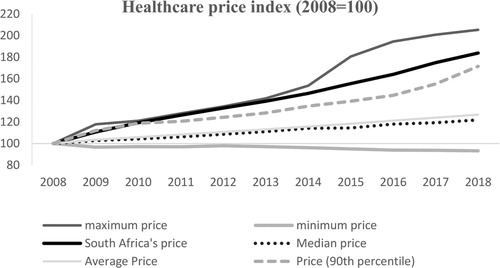
The right-hand panel of depicts South Africa’s healthcare price (depicted by the health price index in the CPI) trend relative to that of the comparator group for the period 2008–18.Footnote4 The index is based to 2008 and thus shows how prices have moved between 2008 and 2018. South Africa’s price increase has been significantly higher than the other members in the group. In fact, South Africa’s price movements (increase) have been in the 90th percentile distribution and above for the entire period under analysis. The median and average price for the group has moved in tandem with prices in 2018 being roughly 20 per cent higher than in 2008. However, the price increase for South Africa was around 80 per cent (four times) higher than the median and average price for the comparator group during the same period. This is even though the healthcare demand is much higher in comparator group (proxied by per capita healthcare expenditures) than South Africa.
Figure 3. Healthcare price movements. Source: OECD database, OECD (available at https://data.oecd.org/).
Note: 1. Calculations based on data for the following countries, namely, Canada, Argentina, Australia, Austria, Belgium, Chile, Czech Republic, Denmark, Estonia, Finland, France, Germany, Greece, Hungary, Iceland, Ireland, Israel, Italy, Japan, Korea, Latvia, Lithuania, Luxembourg, Mexico, Netherlands, New Zealand, Norway, Poland, Portugal, Slovak Republic, Slovenia, Spain, Sweden, Switzerland, Turkey, United Kingdom, United States, Colombia, Costa Rica, India, Russia, Saudi Arabia, South Africa.
In summary, the evidence indicates that while South Africa’s healthcare expenditures or outlays compare quite favourably with countries at similar levels of development, the efficiency of South Africa’s healthcare expenditures do not. It was found that South Africa’s healthcare price increases have exceeded those in more advanced countries where healthcare demand is much higher than is the case in South Africa. Of interest is how price developments in South Africa’s healthcare sector compares to those in the rest of the economy. This is undertaken in the next section.
4. South Africa’s rising healthcare prices in a domestic context
The primary objective of this section is to ascertain whether the healthcare price dynamics in South Africa differs from those of other products in the economy.
(left hand panel) reflects the year-on-year change in prices at the monthly frequency for some categories of products and services in the South African consumer price index (CPI) for the period 1990–2018. Headline inflation captures the movements in the aggregate CPI while healthcare prices reflect the changes in the prices of medical goods, outpatient services and medical insurance. Non-healthcare prices reflect the changes for all products excluding healthcare prices in the CPI. Finally, the increases for all goods prices in the CPI is reflected as goods prices while services prices capture the movements of all the services prices in the CPI.
Figure 4. Healthcare price changes vis-à-vis other sectors in South Africa. Source: Author’s calculations with data from Statistics South Africa.
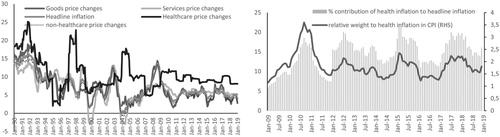
Rising healthcare prices (, left-hand panel) outstripped the rates for the other categories of goods in the South African economy for much of the period under analysis. In fact, since 2009 healthcare price rises have consistently exceeded the price increases for other products in the economy. For example, it averaged 9.6 per cent for the period January 2009 to December 2018 which was almost double the rate for the other sectors during the same period.
The significance of this development is captured in the right-hand panel of which captures the percentage contribution of healthcare price rises to headline inflation and as a share of its weight in the CPI. Healthcare price increases have made double digit contributions to the overall inflation rate for the country, averaging 14 per cent per annum for the period 2009–18 (depicted by the bars in the right-hand panel of ). The importance of this development can be gauged by relating this increase to the weight of healthcare in the CPI. The contribution of healthcare inflation to overall inflation has exceeded its weight in the CPI for much of the period under analysis (as depicted by line graph in right-hand panel of ). In fact, healthcare price increases have exceeded its CPI weight by an average 1.5 times (150 per cent) between 2009 and 2018. With overall inflation being anchored in single digit territory for much of the period, healthcare price movements have become a significant driver of inflationary pressures in the economy. As Wagstaff et al. (Citation2019:2) points out, a higher increase in healthcare prices imply a consequent reduction in expenditure on other products and hence a decline in consumer welfare.
Of interest is the drivers of healthcare prices in South Africa. As pointed out earlier, the healthcare component is made up of medical goods, outpatient services and medical insurance. captures the rate of increase of these components and the change in the headline inflation rate. Because of data constrains the analysis is restricted to the period 2009–18.Footnote5 There are two points worth noting at this stage. Firstly, the increase in the price of medical insurance is significantly higher than those of the other components. Secondly, the price increases for the services component exceeds that for the goods components. This is somewhat surprising given the stronger exchange rate impacts associated with goods components. In fact, the price increases for the goods components is either close to, or lower than, headline inflation for much of the period. However, outpatient services price rises exceed both medical goods and headline inflation for much of the period under analysis. This highlights the relevance of idiosyncratic factors related to domestic developments – rather than international factors per se – as important determinants of healthcare price movements in South Africa.
Figure 5. Headline inflation and price movements of healthcare components. Source: Own calculations.
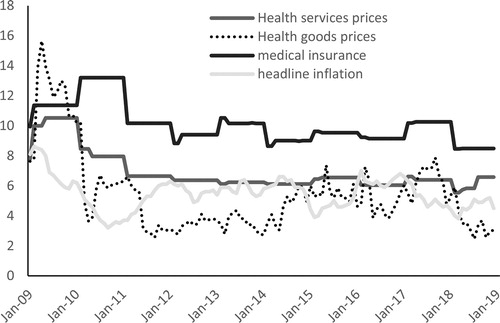
provides some descriptive statistics of the price changes for the components under analysis for the same period (2009–18). The median and mean rates for medical insurance and outpatient services are much higher than those of medical products and non-healthcare products. The volatility and persistence estimates are of interest since they provide useful information about the price dynamics prevalent in a sector. Volatility is given by the measure of standard deviation (dispersion around the mean). The volatility (standard deviation) of medical insurance (1.3 per cent), medical products (2.1 per cent) and outpatient services (2.0 per cent) is higher than that of non-medical inflation (1.06 per cent).
Table 1. Descriptive statistics of healthcare components (2009–18).
The persistence estimate on the other hand, indicates how prices react to a shock. Stated differently, the persistence estimate shows how long it takes for prices to revert to its mean value after a shock. Following Rangasamy (Citation2009) a univariate autoregressive (AR) process for inflation is considered where
and persistence is given by p, the price series (
) represents the deviation from the mean calculated by using the Hodrick-Prescott filter,
is the error term (white noise) and n is the optimal lag length based on information criteria.
The persistence score ranges from 0 to 1 with 1 indicating that price shocks are persistent while a score of 0 indicates that price shocks fade away immediately. Of note, is that the persistence estimates for the healthcare components are much higher than those for non-healthcare goods and services in the economy. In addition, the persistence estimates for the healthcare components are close to 1 indicating that a shock to these prices are persistent (long-lasting). In summary, healthcare prices are characterised by high volatility and high persistence relative to other sectors in the economy.
Further, given the higher median and mean rates for healthcare, this implies that price volatility is underpinned by upside price shocks. Thus, the large and persistent price increases is expected to adversely impact the quantity of healthcare products consumed which in turn will also have potential adverse welfare effects for consumers of these products (Wagstaff et al., Citation2019). This is borne out in a comparison of nominal and real total (private plus government) healthcare expenditures for South Africa. Total (private and government) healthcare expenditure increased by 123 per cent in nominal terms from 2009 to 2018 while the increase in real terms was only 24 per cent during the same period. Thus, most of the increase in nominal healthcare expenditure during the period has been absorbed by price rises (inflation).
The question that follows is whether the healthcare price increases have adversely impacted healthcare expenditures? The Toda and Yamamoto (Citation1995) causality test is used to ascertain the causal effects between price increases and demand for healthcare products and services. A major advantage of this procedure is that the testing procedure is robust to the integration and cointegration properties of the model. A vector autoregression (VAR) model which allows for a stochastic process to capture the linear interdependencies between the variables is used. The following bivariate VAR was estimated:
where
is healthcare inflation and
represents the increase in quantity of healthcare goods and services expenditures.
is proxied by the annual rate of change in total (consumers and government) real healthcare expenditure. Further, d is the maximal order of integration order of the variable in the system, h the optimal lag length,
and
the error terms (white noise). reflects the Granger causality test results for the relationship between healthcare demand and healthcare price changes for the period 1990–2018. The rejection of the null hypothesis (based on the significance of the MWald test statistic) implies causality between the variables.
Table 2. Toda-Yamamoto tests of Granger causality.
The results in indicate that the null hypothesis of total healthcare price rises not influencing healthcare demand (row 1) is rejected. This implies a causal effect running from health price rises to health demand. In other words, the rise in prices has impacted the demand for healthcare products and services. This implies that improving access to healthcare will require explicit attention being given to containing price increases. On the other hand, the null hypothesis of healthcare demand not influencing healthcare price increases cannot be rejected. Thus, pricing practices seem to be independent of demand influences in South Africa.
Of note is the rate of increase for medical insurance which is significantly higher than the rates of price increases for the medical products and outpatient services (see ). International evidence indicates that medical insurance can promote excessive use of services (Pauly, Citation2011). This is also the case for South Africa (Competition Commission, Citation2019). Consumers increase their health expenditures on insured services and there is also evidence of supplier induced demand prevalent in South Africa where medical professionals recommend more services than is actually required to treat the ailment (Council for Medical Schemes, Citation2018; Competition Commission, Citation2019). For example, the rate of caesarean births by South Africans with private medical cover is significantly above the international average and weakly correlated to clinical risk factors (Council for Medical Schemes, Citation2018).
5. Policy recommendations and conclusion
The analysis in this paper highlights four major results. Firstly, while South Africa’s healthcare expenditures compare quite favourably with countries at similar levels of development, the efficiency of these expenditures is not. Secondly, it was found that South Africa’s healthcare prices increases have exceeded those in advanced countries even though healthcare demand and expenditures in these countries is much higher than is the case in South Africa. Thirdly, healthcare price increases are much higher than other sectors of the South African economy. Finally, the rise in healthcare prices adversely impacts healthcare expenditures in South Africa.
In summary, these findings lend support to the view that price developments in the healthcare sector warrant attention by policymakers if the objective of the NHI to ensure that all South Africans have improved access to comprehensive quality healthcare services is to be realised.
The statistical characteristics of healthcare prices in South Africa shows that the health sector contains important idiosyncratic structural components that require attention by policymakers to contain healthcare cost increases. As Arrow (Citation1963) pointed out, information asymmetry promotes adverse selection and moral hazard in healthcare markets. The health market enquiry found that a lack of stewardship by the regulators has adversely affected efficiency and competitiveness in the private healthcare sector (Competition Commission, Citation2019). Information asymmetries have underpinned market power imbalances in South Africa’s healthcare market which need to be effectively managed to ensure that the desired policy outcomes are realised.
Since the transition to democracy in 1994, the government has prioritised healthcare reform in South Africa through the expansion of facilities and abolishment of user fees for primary health care (Burger & Christian, Citation2020). However, despite these efforts, health outcomes have remained unequal and inequitable (Sahn, Citation2012; Ataguba et al., Citation2014; Marten et al., Citation2014). Hence, the NHI objective of providing all South Africans with access to comprehensive quality healthcare services when needed is laudable. However, the international and domestic evidence indicates that medical insurance can drive up demand for healthcare services, and in some cases, unnecessarily so. This is of relevance for the roll out of the NHI given that the state will be a purchaser of healthcare services from the private sector.
The Health Market Enquiry found that South Africa’s private healthcare market is characterised by high and rising costs which are underpinned by excessive utilisation of medical services without a commensurate improvement in health outcomes (Competition Commission, Citation2019). Thus, the policy challenge is to ensure that mitigating measures directed at preventing anti-competitive practices and perverse incentives that unnecessarily drive-up demand by both patients and medical professionals are implemented. This is key to keeping government healthcare expenditures in check.
Governments have an important role to play in ensuring that healthcare prices align with policy goals (Barber et al., Citation2019). Regulatory deficiencies have not had the desired effects on South Africa’s private healthcare sector’s efficiency and competitiveness (Competition Commission, Citation2019). Given the envisaged reliance of the Government on the private sector for the provision of healthcare services under the NHI, it is imperative that the competitiveness of South Africa’s healthcare market is enhanced to ensure that costs and prices are appropriately aligned. Containing health price increases is key in this regard. Regulatory intervention will form part of the government’s effort to guide health price determination in South Africa. In this regard, the Health Market Inquiry (Competition Commission, Citation2019) recommends tariff negotiations at the multilateral and bilateral levels being supervised by a proposed Supply Side Regulator for Health. Developing a framework to better understand the cost drivers and promoting increased competition in the healthcare sector to ensure efficient outcomes are among some of the factors that warrant attention by policymakers.
Affordability considerations have dominated healthcare equity concerns in South Africa. The South African government has attempted to expand the provision of primary healthcare for the poor through the elimination of user fees (van Rensburg, Citation2014). However, Koch (Citation2017) has found that the abolition of user-fee has not improved access for the vulnerable groups while Goudge et al. (Citation2009) argue that fee abolition has to be accompanied by other interventions, if access to public healthcare is to be meaningfully enhanced.
There are important non-price factors that have a bearing on access to healthcare. In general, the availability and affordability of public health has a direct bearing on health outcomes. Burger et al indicate that travel costs have a strong bearing on affordability and availability particularly for rural households and the poor. The containment of these costs, in addition to healthcare price increases in general is fundamental to ensuring efficiency in government healthcare expenditures and improved access to healthcare for all South Africans as envisaged under the NHI.
Given the stark social divide that characterises South Africa’s healthcare sector, a social compact among all the relevant stakeholders may be key to the achievement of the desired health outcomes. Ethics, moral obligations and social norms and their interactions have a bearing on efficient market outcomes, particularly in cases where information asymmetry persists as is the case with healthcare markets (Arrow, Citation1963, Citation2017; Cato & Lutz, Citation2018). There is a role for public policy to facilitate the required actions and interactions among the stakeholders to overcome market failures. A step in this direction is the recommendation of the Health Market Enquiry that,
the HPCSA makes mandatory that curriculums for all health practitioners at both undergraduate and postgraduate level include training to ensure that graduates are aware of the cost implications of their decisions, are able to assess and use HTA findings, and best practice guidelines, and are aware of how health system financing models impact on individual health decisions and on ethics. (Competition Commission, Citation2019)
6. Conclusion
The analysis in this paper highlights four major results. Firstly, while South Africa’s healthcare expenditures compare quite favourably with countries at similar levels of development, the efficiency of South Africa’s expenditures does not. Secondly, it was found that South Africa’s healthcare price increases have exceeded those in advanced countries even though healthcare demand and expenditures in these countries are much higher than is the case in South Africa. Thirdly, rises in healthcare prices are much higher than in other sectors of the South African economy. Finally, healthcare price increases adversely impacts healthcare expenditures in South Africa. These results indicate that price considerations, more specifically, keeping health price increases in check, should be a policy priority if access to healthcare is to be improved in South Africa. This is of relevance for government health spending considering the envisaged introduction of the national health insurance. Rising healthcare prices force trade-offs in government budget allocations and priorities by reducing the funds available for other social priorities like education and housing. Thus, keeping healthcare price movements in check is imperative for the realisation of government’s healthcare and other broader social objectives.
Disclosure statement
No potential conflict of interest was reported by the author(s).
Notes
1 Some authors have argued that the term inflation should only be used to refer to a general increase in price (Humpage, Citation2008). Hence, in this paper we use the term rising healthcare prices rather than rising healthcare inflation to reflect the rising healthcare prices.
2 The comparator group includes countries with per capita income levels ranging from US$10 000 to US$15 000 (PPP, current US$) as compared to South Africa’s per capita income level of US$12 703.
3 The policy prescriptions to address the rising prices would have to give due cognisance to the underlying reasons.
4 Many of the OECD countries considered make use of public facilities, use different payment mechanisms and have regulatory measures that address many of the challenges in the South African environment. Public facility prices are often regulated and may not include all cost elements and also varies across the OECD countries.
5 Medical insurance contribution is only available as a separate category from 2009 onwards. Prior to 2009, it was included as part of the outpatient services category.
References
- Aaron, H, 2002. The unsurprising surprise of renewed health care cost inflation. Health Affairs Web Exclusive, January 23.
- Arrow, KJ, 1963. Uncertainty and the welfare economics of medical care. The American Economic Review 53(5), 941–73.
- Arrow, KJ, 2017. On ethics and economics: Conversations with Kenneth J Arrow. Routledge, Oxon.
- Ataguba, J, Day, C & McIntyre, D, 2014. Monitoring and evaluating progress towards universal health coverage in South Africa. Plos Medicine 11, e1001686.
- Barber, SL, Lorenzoni, L & Ong, P, 2019. Price setting and price regulation in health care: Lessons for advancing universal health coverage. World Health Organisation and OECD, Geneva. https://www.oecd.org/health/health-systems/OECD-WHO-Price-Setting-Summary-Report.pdf
- Benhabib, J & Spiegel, MM, 1994. The role of human capital in economic development evidence from aggregate cross-country data. Journal of Monetary Economics 34(2), 143–73.
- Bloom, DE & Canning, D, 2000. Demographic change and economic growth in Asia. Population Development Review 26, 257–90.
- Bloom, DE & Canning, D, 2015. Health and economic growth: Reconciling the micro and macro evidence. University of Stanford. http://iisdb.stanford.edu/pubs/20924/BloomCanning_42.pdf.
- Boachie, MK, 2017. Health and economic growth in Ghana: An empirical investigation. Fudan Journal of the Humanities and Social Sciences 10(2), 253–65.
- Burger, R & Christian, C, 2020. Access to health care in post-apartheid South Africa: Availability, affordability, acceptability. Health Economics, Policy and Law 15(1), 43–55. https://www.cambridge.org/core/journals/health-economics-policy-and-law/article/access-to-health-care-in-postapartheid-south-africa-availability-affordability-acceptability/559D7EAE9E98DCD5839AEF6CC85C5DAD.
- Cato, S & Lutz, A, 2018. Kenneth Arrow, moral obligations, and public policies. Working Paper 1841. Halshs=01973898. https://halshs.archives-ouvertes.fr/halshs-01973898/document.
- Claxton, G, Sawyer, B & Cox, C, 2018. How does cost affect access to care? Kaiser Family Foundation. https://www.healthsystemtracker.org/chart-collection/cost-affect-access-care/#item-start.
- Cole, MA & Neumayer, E, 2006. The impact of poor health on total factor productivity. Journal of Development Studies 42(6), 918–38.
- Competition Commission of South Africa, 2019. Health market inquiry: Final findings and recommendations report. Competition Commission, Pretoria. https://www.gov.za/sites/default/files/gcis_document/201911/42861gon1533.pdf Accessed 10 July 2020.
- Council for Medical Schemes, 2010. Annual report 2009–10. Pretoria, Council for Medical. https://www.medicalschemes.co.za/publications/#2009-2022-wpfd-2009-10-annual-report [2 June 2019].
- Council for Medical Schemes, 2018. Annual report 2017–18. Pretoria, Council for Medical Schemes. https://www.medicalschemes.com/files/Annual%20Reports/CMS_AnnualReport2017-2018.pdf [2 June 2019].
- Council for Medical Schemes, 2019. Annual report 2018–19. Pretoria, Council for Medical. file:///C:/Users/A0069875/Downloads/CMS-Annual-Report-201920_Digital.pdf [2 June 2019].
- Deloitte, 2019. Global healthcare outlook, Deloitte. Washington. https://www2.deloitte.com/global/en/pages/life-sciences-and-healthcare/articles/global-health-care-sector-outlook.html. [20 July 2019].
- Goetzel, R, Long, SR, Ozminkowski, R, Hawkins, K, Wang, S & Lynch, W, 2004. Health, absence, disability, and presenteeism cost estimates of certain physical and mental health conditions affecting U.S. employers. Journal of Occupational Environmental Medicine 46(4), 398–412.
- Goudge, J, Gilson, L, Russell, S, Gumede, T & Mills, A, 2009. The household costs of healthcare in rural South Africa with free public primary care and hospital exemption for the poor. Tropical Medicine and International Health 14(4), 458–67.
- Grossman, M, 1972. On the concept of health capital and the demand for health. The Journal of Political Economy 80(2), 223–55.
- Group of 20, 2019. G20 Osaka Leaders’ Declaration. https://www.consilium.europa.eu/ media/40124/final_g20_osaka_leaders_declaration.pdf [30 September 2019].
- Humpage, O, 2008. Rising relative prices or inflation: Why knowing the difference matters. Economic Commentary. Cleveland Federal Reserve. https://www.clevelandfed.org/en/newsroom-and-events/publications/economic-commentary/economic-commentary-archives/2008-economic-commentaries/ec-20080601-rising-relative-prices-or-inflation-why-knowing-the-difference-matters.aspx.
- Koch, S, 2017. User fee abolition and the demand for public health care. South African Journal of Economics 85, 242–58.
- Mankiw, NG, Romer, D & Weil, DN, 1992. A contribution to the empirics of economic growth. The Quarterly Journal of Economics 107(2), 407–37.
- Marten, R, McIntyre, D, Travassos, C, Shishkin, S, Longde, W, Reddy, S & Vega, J, 2014. An assessment of progress towards universal health coverage in Brazil, Russia, India, China, and South Africa (BRICS). The Lancet 384, 2164–71.
- Mushkin, S, 1962. Health as an investment. Journal of Political Economy 70(5), 129–57.
- National Department of Health, 2019. National Health Insurance Bill. National Department of Health, South Africa. https://www.gov.za/sites/default/files/gcis_document/201908/national-health-insurance-bill-b-11-2019.pdf Accessed 10 July 2020.
- Oni, LB, 2014. Analysis of the growth impact of health expenditure in Nigeria. IOSR Journal of Economics and Finance 3(1), 77–84.
- Pauly, MV, 2011. Insurance and the demand for medical care. In Glied, S & Smith, PC (Eds.), The Oxford handbook of health economics. Oxford University Press, Oxford, 354–80.
- Peters, DH, Garg, A, Bloom, G, Walker, DG, Brieger, WR & Hafizur Rahman, M, 2008. Poverty and access to health care in developing countries. Annals of the New York Academy of Sciences 1136(1), 161–71.
- Phillips, A, 2015. US Daily: Health inflation should soon begin to rise. Goldman Sachs Global Macroeconomic Research.
- Preston, SH, 1975. The changing relation between mortality and level of economic development. Population Studies 29(2), 231–48.
- Rangasamy, L, 2009. Inflation persistence and core inflation: The case of South Africa. South African Journal of Economics 77(3), 430–44.
- Reichert, UN & Cebula, RJ, 1999. A note on health care inflation. Journal of Economics and Finance 23, 193–98. doi:10.1007/BF02757704
- Romer, PM, 1990. Human capital and growth: Theory and evidence. Carnegie-Rochester Conference Series on Public Policy 32(1), 251–86.
- Rosendo, SF, Simões, M & Sousa, AJ, 2018. Health investments and economic growth: A quantile regression approach. International Journal of Development Issues 17(2), 220–45.
- Sahn, D, 2012. Meeting Africa’s health challenges. In Aryeetey, E, Devarajan, S, Kanbur, R & Kasekende, L (Eds.), The Oxford companion to the economics of Africa. 1st edn. Oxford University Press, New York, 244–51.
- Statistics South Africa, 2017. Introduction of new weights and basket for the consumer price index, Pretoria, Statistics South Africa. http://www.statssa.gov.za/cpi/documents/Introduction_of_ 2016_CPI_weights_and_basket.pdf [20 June 2019].
- Toda, HY & Yamamoto, T, 1995. Statistical inference in vector auto-regressions with possibly integrated processes. Journal of Econometrics 1995(66), 225–50.
- UNCTAD, 2019. Discussion on ‘Competition in healthcare markets: Access and affordability’. Intergovernmental Group of Experts on Competition Law and Policy, 18th SESSION, 10–12 July. UNCTAD, Geneva. https://unctad.org/meetings/en/SessionalDocuments/cicpl%2018th_%20Healthcare_Pharmas.SA.pdf.
- van Rensburg, H, 2014. South Africa’s protracted struggle for equal distribution and equitable access – still not there. Human Resources for Health 12(26). doi:10.1186/1478-4491-12-26
- Verbrugge, R & Garcia, C, 2015. Healthcare inflation and the core inflation gap. Economic Trends, Federal Reserve Bank of Cleveland.
- Wagstaff, A, Eozenou, P & Smitz, M, 2019. Out-of-pocket expenditures on health: A global stocktake. Policy Research Paper no 8808. World Bank. Washington DC.
- World Bank, 2017a. Countries commit to strong action on human capital to drive economic growth. World Bank, Washington. http://www.worldbank.org/en/news/feature /2017/10/20/countries-commit-to-strong-action-on-human-capital-to-drive-economic-growth [26 August 2019].
- World Bank, 2017b. Human capital: The greatest asset of economies on the rise. World Bank, Washington. http://www.worldbank.org/en/news/opinion/2017/04/03/human-capital-the-greatest-asset-of-economies-on-the-rise [20 July 2019].
- World Bank, 2020. World bank database. World Bank, Washington, DC. https://data.worldbank.org/indicator/SH.XPD.CHEX.GD.ZS [20 October 2020].
- World Health Organisation, 2005. The world health report. WHO, Geneva. https://www.who. int/whr/ 2005/whr2005_en.pdf [10 October 2019].
- World Health Organisation, 2019. Sustainable development goals. Goal 3. Ensure healthy lives and promote well-being for all at all ages. WHO, Geneva. https://www.who.int/sdg/targets/en [30 September].
- World Health Organisation and World Bank, 2017. Tracking universal health coverage: 2017 Global monitoring report. World Health Organisation and World Bank. WHO, Geneva.