
 ?Mathematical formulae have been encoded as MathML and are displayed in this HTML version using MathJax in order to improve their display. Uncheck the box to turn MathJax off. This feature requires Javascript. Click on a formula to zoom.
ABSTRACT
The study investigates the impact of financial literacy on risk preference and time preference choices of university students. The study collected data using a questionnaire, implemented a multiple price lists experiment, and administered a financial literacy test. A maximum of 7680 risk preference and 7680 time preference choices were elicited from the subjects. The study used a maximum likelihood joint estimation on an expected utility exponential function on homogeneous and heterogeneous preferences of students. Research results show that financial literacy significantly influenced risk and time preferences of university students with low financial literacy. The study also found significant risk aversion and impatience on homogenous preference choices of students. Structural behavioural errors were significant for the risk preference and time preference tasks choices. An increase in financial literacy is associated with risk seeking and patient attitudes among university students. These traits are associated with better life outcomes of citizens.
1. Introduction
Financial decisions involve making choices that have risk preference and time preference attitudes. Risk preference and time preference choices are influenced by cognitive ability, affection, habit formation, visceral influences, temptation, and anticipatory utility (Frederick et al. Citation2002; Frederick Citation2005; Van Rooij et al. Citation2011). Research has shown that there are variations in life outcomes of individuals with high financial literacy when compared to those with low financial literacy (Lusardi & Mitchell Citation2007). The quest to understand the difference in life outcomes that prevail between high financial literacy and low financial literacy individuals require a clear assessment of factors that influence these variations. Given that risk and time preferences choices play a pivotal in life outcomes, the prominent question that requires a behavioural experiment investigation is, ‘does financial literacy influence risk and time preferences?’ An answer to this question will provide a deeper understanding of the role financial literacy play in shaping individual life outcomes.
The aim of this study is to explore the impact of financial literacy on risk preference and time preference choices of university students. The probability of an association between financial literacy with risk and time preferences is important for a minimum of two reasons. First, the impact of financial literacy on preference choices can help authorities understand drivers of differences in life outcomes and suggest interventions to bridge the gap. Secondly, the evidence is critical in assessing short run psychological behaviour (temptation) and long-run optimisation of individuals with different levels of financial literacy (Brocas & Carillo Citation2006; Burks et al. Citation2009; Benjamin et al. Citation2013).
The evidence used in the study comes from a laboratory experiment with university students as the subjects. Ten per cent of the participants were paid the actual value of money for their choices from one of their randomly selected task that they completed. The use of money incentives restricts subjects to make choices on one good that is the amount of money stipulated in a given lottery rather than using goods which may attract biased selections (Harrison et al. Citation2005). The study focuses on lottery measured risk aversion and patience of university students. A risk parameter which has a positive value shows a risk-averse attitude while a negative value risk parameter indicates a risk-loving attitude (Kahneman & Tversky Citation1979). On the other hand, a high discount rate shows high level of impatient attitude vice versa (Andersen et al. Citation2008). The results from the maximum likelihood regression analysis show that financial literacy significantly influenced risk preference and time preference choices of students with low financial literacy after controlling for individual characteristics. The study concluded that university students were generally risk averse and impatient. An increase in financial literacy is associated with a risk-seeking attitude among university students.
Financial knowledge, numeracy, ability to make beneficial financial decision and capability to use financial skills are aspects of cognitive ability (Delavande et al. Citation2008). Risk preferences entail making choices with a chance of a gain or a loss while time preferences encompass intertemporal choices, that is, choices made over time (Frederick Citation2005). A number of studies have explored the impact of cognitive ability on risk preferences and time preferences. Benjamin et al. (Citation2013) in a study on Chilean high school students concluded that subjects with higher mathematics score exhibited comparatively more risk-loving attitude on small-stakes lotteries. There is evidence of a strong correlation between cognitive ability and risk aversion when measurement error in risk aversion is corrected for (Huck & Weizsäcker Citation1999). In addition, Dohmen et al. (Citation2010) conclude that people with lower IQs are more risk-averse and impatient. Another study found out that cognitive load increases risk aversion (Whitney et al. Citation2008). On the other hand, Frederick (Citation2005) found differences in time preferences across gender while Benjamin et al. (Citation2013) noted that students who are good in mathematics were more patient. Jacobson & Petrie (Citation2009) in an experimental study with an adult population in Rwanda that focused on how mistakes over risk preferences explain financial decisions concluded that risk aversion and inconsistent lottery choices interact significantly. The mixed outcome of results from previous researches could be due to the fact that some studies ignore background risk (Harrison et al. Citation2007). Risk aversion is an act of avoiding risk or settling for choices with less risk while patience is the ability to wait longer to earn a higher return from an intertemporal choice.
This study shares some similarities with the following studies; risk-averse subjects were found to be more likely to take up experimentally provided education on finances (Eckel et al. Citation2007). Lusardi & Mitchell (Citation2007) found out that financial education is beneficial to people with low financial literacy. Becchetti et al. (Citation2013) in an experimental study with high school students found out that receiving financial literacy education helped students who initially had low levels of financial literacy. Huck & Weizsacker (Citation1999) found a strong correlation between cognitive ability and risk aversion.
Our study is unique in that to the best of our knowledge it is the first to make use of Multiple Price List (MPL) experimental methodology to examine the impact of financial literacy on risk preference and time preference choices in South Africa. Previous studies have used cognitive instruments such as IQ tests to examine the impact of cognitive ability on risk preferences and time preferences (Huck & Weizsacker Citation1999; Parker & Fischhoff Citation2005; Dohmen et al. Citation2010; Benjamin et al. Citation2013). Studies on financial literacy in South Africa have mainly focused on the level of financial literacy among citizens and a number of the studies reported low levels of financial literacy (Shambare & Rugimbana Citation2012; Roberts et al. 2014).
The arrangement of the paper is as follows. The next section looks at the experimental procedure and summary statistics. This is followed by theoretical issues and statistical specification leading to results and findings as well as conclusion.
2. Experimental procedure and summary statistics
2.1. Sample
This study draws data from 192 students at the University of the Free State in South Africa. About 53% of the subjects were female and all the participants were pursuing some Bachelor of Commerce Degree. The data was collected on 27 July 2016. The study uses Multiple Price List (MPL) experimental procedure modified to suit South African currency and context by the Research Unit in Behavioural Economics and Neuroeconomics (RUBEN) at the University of Cape Town in South Africa (Holt & Laury Citation2002; Harrison et al. Citation2005; Andersen et al. Citation2008). Individual subjects completed (four) risk preference and (four) time preference tasks with ten choices in each game. The study elicited a maximum of 7680 time preference and 7680 risk preference choices from university students that were used for analysis.
2.2. Procedure
Subjects completed a questionnaire, which captured their personal information. The Questionnaire was adopted from the National Financial Capability Study (NFCS) (Lusardi & Mitchell Citation2011). The subjects also completed a 30-question financial literacy test. Questions in the financial literacy test were adopted from Jumpstart, Dollar sense, Knowledge Assessment Survey Questions and NFCS (Lusardi & Mitchell Citation2011; LaBorde & Mottner Citation2013; Mandell Citation2008). The participant(s) with the highest score in the test was rewarded with a prize money of R200.
The research enlisted the services of two research assistants who assisted in distributing the document that included experimental tasks, questionnaire, and a financial literacy test. Students completed the tasks and the financial literacy test under examination conditions where students were not allowed to copy each other's responses. The subjects also filled in a consent form to voluntarily participate in the study. All the tasks had written instructions and for clarity purposes, the researcher read them first before the participants completed the tasks.
Ten per cent of the participants were randomly selected and were paid for one of the eight tasks they played which were also randomly chosen. Previous studies that used the same methodology have paid 10% of the participants (Andersen et al. Citation2008). The selection process for payment was by quota random sampling where an equal number of tickets equivalent to the number of participants were put in a hat. Ten per cent of the tickets that were put in a hat were winning tickets (see Mudzingiri Citation2019). The subjects were paid the actual amount of money depicted in the row chosen according to the instructions from the task. All the subjects received 50 rands participation fee.
2.3. Measuring time preferences
The study used MPL time preferences with two lotteries A and B where choosing Lottery A represents impatient behaviour shown by choosing a small sooner (SS) choice and selecting Lottery B represents patience behaviour signified by choosing larger later (LL) choice (Andersen et al. Citation2008; Harrison et al. Citation2015) (see ) All in all one subject made 40 time preferences choices. The design of the MPL table's row 1 is as shown in (). The interest for the future period (LL) ranged from 10% in row 1 up to 100% in row 10. In short, individual discount rates given as IDR(t,) where (t) represent present time choice SS paid in a week in case of our experiment and
is future time delivery LL in our case given as 1 month, 3 months, 6 months and 12 months (see Mudzingiri Citation2019).
Table 1. Typical payoff matrix for the time preference experiments.
2.4. Measuring risk preferences
The subjects had an option to either choose lottery A or lottery B in one row. Choosing lottery B in row 1 shows a high degree of risk-loving/seeking attitude while choosing lottery A in row 9 is a reflection of the high degree of risk aversion attitude. The four risk aversion tasks had four different prizes that appear as follows in the rows; task 1 (A1: 60 rands, 50 rands; B1: 100 rands, 25 rands). Task 2 (A1:70 rands, 45 rands; B1: 110 rands, 10 rands), task3 (A1: 200 rands, 120 rands; B1: 300 rands, 50 rands), task 4 (A1: 250 rands, 150 rands; B1: 400 rands, 10 rands). The probabilities of winning in the tasks were the same for all tasks (see ). The prizes won ranged from USD 1.54 (20 rands) to USD30.80 (400 rands) on the day of data collection. This compares well with the minimum hourly wage in South Africa at the time of the experiment which stood at R20 per hour.
Table 2. Typical payoff matrix for the risk preference experiments.
The participation fee and the risk preference pay-offs were paid on the day of the experiment and all the other payments were paid following the instructions in the completed tasks. All small sooner (SS)time preferences tasks winners representing impatient choices were paid after a week to deal with present time bias (Harrison et al. Citation2004; Alan & Ertac Citation2015).
3. Theoretical issues and statistical specification
The study follows the methodology applied by Harrison et al. (Citation2015) and Andersen et al. (Citation2008). The research data is analysed using maximum likelihood structural models of unobserved choices processes (Andersen et al. Citation2008; Harrison et al. Citation2015). The risk preference and time preference models record the unobserved choice processes. Preferences analyses may involve an unobservable trade-off between short-run temptation and long-run optimisation (Benhabib & Bisin Citation2005; Fudenberg & Levine Citation2006). The study used observed choice data from risk preference and time preference tasks to estimate the discount rates and risk preference parameters using the maximum likelihood models. The strength of the maximum likelihood models is that they use all the available data on risk and time preference choices to estimate the parameters. Our analysis is premised on the canonical cases of expected utility (EU) and exponential (E) discounting.
It is always difficult to measure individual's background consumption. To simplify matters, the study set the background consumption of all subjects at zero. Background consumption is income that subjects may be holding before they participate in an incentivised experiment. Negative discount rates in our analysis showing the absence of background consumption are normal and are an indication of low discount rates for the subjects (Andersen et al. Citation2008). The research assumed a risk-neutral discounting model for the calculation of individual discount rate of subjects for the MPL time preferences games (Andersen et al. Citation2008). Equating the two lotteries indicates that the subject is indifferent on the lotteries, which allows the study to calculate the individual discount rate at the level. The study specified the following equation:
(1)
(1) where
is the monetary outcome at time t present time that provides a smaller sooner (SS) consumption,
is the monetary outcome at time
that yields a larger later (LL) future period consumption and
is the individual discount rate. The paper calculated
using the lottery prizes given in the MPL tables (see ). Discount rates can only be inferred if one knows an individual's risk attitudes, therefore discount rate experiments were not estimated separately but in conjunction with risk preference experiments. This catered for choice under risk situation in making time preference choices (Andersen et al. Citation2008).
The utility of income is given by the power utility function which shows constant relative risk aversion (CRRA) (r) as shown in (Equation (2)):
(2)
(2) where r
, and if r < 0 the utility function is convex, showing risk loving or seeking behaviour, when r = 0 the utility function is linear, showing a risk neutrality behaviour and for r > 0 the utility function is concave revealing some risk aversion attitude. The paper assumed that background consumption (ω) is zero. The shape of the utility function determines risk preferences under the EU. Risk aversion has been concluded in a number of field and laboratory experiments for small and huge amounts offered on lotteries (Holt & Laury Citation2002; Harrison et al. Citation2007). There is evidence of present biasedness when individuals are offered amounts of money in the present time, but the passion disappears over choices of amounts offered on varying dates in future (Andersen et al. Citation2008). The study implemented a front-end-delay by paying all present-day choices after 7 days for all the time preference experiments ruling the possibility of temptation and hyperbolic discounting. Subjects participating in a risk preference task are susceptible to temptation since the payments were disbursed on the day the games were played.
Our tasks have two outcomes in each lottery and the EU for each risk preference lottery is
(3)
(3) The paper assumes
, in the risk aversion task, income earned instantaneously is thought to be divided over periods of time. All risk preference tasks were paid on the day the experiment leading to the assumption that income is divided in one period. The study calculated the EU for each lottery pair for estimate r (risk parameter) using a simple stochastic specification by Holt & Laury (Citation2002) by specifying the following ratio:
(4)
(4) where EUA stands for Option A, EUB stands for Option B and u is a structural ‘noise parameter’ for the risk preference task (Wilcox Citation2011). The index
is associated with choices made by subjects, the specification
is predicted if option B is selected in the lottery. The observed choices as well as the estimate of r and u determine the likelihood of risk aversion responses, conditional on the EUT and CRRA specification being true. The conditional log likelihood for the risk preference response is
(5)
(5)
where yi = 1(−1) stands for the choice of Option B (A) lottery in the risk preference lottery task i. The individual characteristics, that is, financial literacy, age, gender, financial decision-making status, and income are represented by variable X in Equation (5).
The paper specified an index of the difference between the present values conditional on r and δ for the time preference model as follows:
(6)
(6) where v represents structural ‘noise parameter’ for the time preference choices. The conditional log likelihood for time preference is given as
(7)
(7)
where yi = 1(−1) stands for the choice of Option B (A) lottery in the time preference lottery task i. The parameter λ defines the number of periods over which the delayed monetary amounts in the discount rate choices are divided over time (Andersen et al. Citation2008).
The joint likelihood estimation of the time and risk preferences responses are specified as follows:
(8)
(8) The study ran an expected utility exponential function maximum likelihood regression analysis on homogenous preferences and then on heterogeneous preferences where the research controlled for individual characteristics.
4. Results and findings
A total of 192 students participated in the study where 53% of the subjects were female. The average score in the financial literacy test was 40%, the lowest and the highest marks scored were 3% and 80% respectively. The average income spends in a month by each subject was R1543. The average age of the participants was 22.3 years, the oldest participant was 44years and the youngest was 18 years old. Other variables that were used in the analysis are gender, race, geographical location and financial decision-making status (made up of three discrete responses). The study asked students a question which required them to indicate if they made financial decisions on their own, made the financial decisions jointly with somebody or they were non-financial decision-makers to elicit their financial decision-making status ().
Table 3. Descriptive statistics.
Majority of the students resided in the urban areas (69%) compared to 31% who came from rural areas. All subjects who scored a mark above average in the financial literacy test were categorised as high financial literacy group while those who score a mark below average were classified as low financial literacy group.
4.1. Expected utility exponential function maximum likelihood estimations
The study results are based on a set of risk preferences and time preferences expected utility models which assume a utility function to be a constant relative risk aversion (CRRA) specification. The research investigated whether financial literacy impact risk preference and time preference choices. The study focused initially on the risk preferences model then turned on to a joint estimation model with risk preference and time preference choices for the whole group, low financial literacy group and high financial literacy group. Time preferences can only be elicited if the risk aversion parameter is known, which stipulate the concavity of the utility function, hence our analysis focused on risk preferences first (Andersen et al. Citation2008).
The research did not include all the subjects that engaged in multiple switching between lottery options A or B in the analysis since they were assume to be indifferent on lottery choices. The estimate of the CRRA parameter r = 0.679 which is highly significant at 1% level shows that there is a high level of risk aversion among the total group of university students under consideration (). The results show that the subjects in the whole group chose safer choices with less risk. Our results show that university students made structural behavioural errors in the risk preference task. The estimate of structural behavioural errors
is negative and highly significant at 1% level. The behavioural errors are associated with ‘structural errors’ that happens when the subject makes choices on lotteries which could include cognitive abilities and other noises that affect decision making. The paper estimated heterogeneous preferences by controlling for individual characteristics for subjects under consideration. The maximum likelihood regression allowed us to make risk parameter r a linear function of the individual characteristics of university students ( and ).
Table 4. Expected utility theory ML estimates Homogenous risk preferences.
Table 5. Expected utility theory ml estimates heterogeneous risk preferences.
Table 6. Expected utility theory ml estimates heterogeneous risk preferences.
The linear function is made up of homogenous and heterogeneous preferences given as r where
is fixed parameter and
is a coefficient vector linked to individual characteristics (X) (Harrison et al. Citation2015). The study investigated whether financial literacy measured by the financial literacy test score significantly influence risk preferences. Our results show that the point estimate for financial literacy is −0.009 and the standard error 0.012 did not influence risk preferences (). The results show that financial literacy on its own does not significantly influence risk preferences but it is associated with risk-loving behaviour depicted by the negative risk parameter for the whole group of students.
The study controlled for race, geographical location, gender, decision-making status, financial literacy, age and income subjects (). Our results show a weak impact of financial literacy on university students. The point estimate of financial literacy is −0.007 and standard error of 0.004 with a probability value of 10.7%. Again showing that an increase in financial literacy is associated with the risk-seeking attitude. Turning on to financial decision-making status variable, being a non-decision-maker has a risk preference point estimate of −0.077, standard error of 0.046 and significantly influences risk preferences at a 10% level.
On the other hand, being a joint-decision-maker significantly influenced risk preferences at 5% level. The findings from financial decision-making status show that participation in financial decision making is generally associated with risk-seeking attitude among university students. The variable age's risk preference point estimate is −0.025 and is significant at 5%. Older university students are significantly associated with risk seeking behaviour. Turning on to the variable income, the risk preference parameter point estimate is 0.0001 and is significant at 1% level. Monthly income expenditure of the university students is significantly associated with risk aversion attitude.
Our findings on the relationship between income and risk preferences might be a reflection of income challenges faced by university students. The maximum likelihood regression analysis in shows a significant prevalence of behavioural error (μ) at 1% level. The homogenous expected utility time preference model assumes choice under risk and uses years as the time horizon, meaning monthly time horizons indicated in the time preference tasks were converted into years. The estimate of CRRA for the whole group is r = 0.674 and is highly significant at 1% level, showing that the subjects in the whole group were risk-averse. The risk preference behavioural error point estimate is highly significant at 1% level.
The point estimate of for the whole group shows a high discount rate and is significant at 1% level (). The whole group of university students is significantly impatient. They were generally more likely to choose a small sooner (SS) choices for the time preference tasks. Subjects were present biased and were not willing to wait to receive higher pay-offs that would have accrued interest. Our findings show that university students who participated in the study were less likely to save and invest their income according to the calculated discount rate. The study results are similar to research findings by Schwella & van Nieuwenhuyzen (Citation2014) who concluded that South African citizens generally save less.
Table 7. Discounting ml estimates expected utility theory and homogenous preferences.
The point estimate of the time preference behavioural error is significant at 1% level (). The study controlled for gender, race, geographical location, decision-making status, literacy, age and income in a bid to investigate heterogeneous preferences for university students. Our results show a marginal decline of CRRA estimate to r = 0.632 and is significant at 1% level, showing that subjects are generally risk averse. The risk preference behavioural error
is highly significant at 1% level. Our results show a time preference behavioural error with point estimate
is significant at 10% level (). Our findings show that the risk preference behavioural error is more significant than the time preference behavioural error. The findings show that a risk preference task requires more cognitive input in completing it than a time preference task (Andersen et al. Citation2008). All variables controlled for, including financial literacy, did not significantly influence time preferences. However, an increase in financial literacy is associated with a patient attitude for the whole group reflected by a negative coefficient on the variable financial literacy (−0.012). An increase in financial literacy is associated with choosing larger later (LL) lottery with a higher future value.
Table 8. Discounting ml estimates expected utility theory and heterogeneous preferences.
4.2. Low financial literacy, risk preferences, and time preferences
The study categorised university students by their financial literacy level. The results show that for university students with higher financial literacy only a high level of risk aversion and the behavioural error are significant (Table A1 and A2, Appendix). Other variables did not significantly influence the risk preferences of university students with high financial literacy. The study also found that increase in financial literacy is associated with risk-seeking attitude among high financial literacy university student group.
The paper ran a maximum likelihood estimates expected utility exponential function model on homogenous risk preferences for university students with low financial literacy (). The estimate of CRRA parameter r = 0.761 is significant at 1% level and shows that the subjects in the group are risk-averse. Comparatively, subjects with low financial literacy are more risk averse than those with high financial literacy. The point estimate of the risk preference behavioural error is negative and significant at 1% level (). The research investigated heterogeneous risk preference choices in an expected utility exponential function by controlling for individual characteristics of university students with low financial literacy. The point estimate of financial literacy is −0.057 and is highly significant at 1% level (). An increase in financial literacy among students with low financial literacy is associated with a risk-loving attitude. The study findings show that financial literacy significantly influenced the risk preferences of university students with low financial literacy. A risk-seeking attitude has a potential of realising a high return in a natural investment venture. The results confirm the importance of financial literacy in decision making.
Table 9. Expected utility theory ML estimates Homogenous risk preferences.
Table 10. Expected utility theory ML estimates Heterogeneous risk preferences.
The results confirm findings by Lusardi & Mitchell (Citation2007) and Becchetti et al. (Citation2013) who pointed out that financial literacy education benefits more people who lack it. Risk preferences of subjects with high financial literacy are not significantly influenced by financial literacy, which shows that if individuals have high financial literacy variation in risk preferences and time preference choices is insignificant (Table A1 and A2). Risk preference choice of individuals with high financial literacy is influenced by other factors other than financial literacy. If everyone else has high financial literacy the effect of it on risk preference choices cannot be easily determined.
Age is significantly associated with risk-seeking behaviour at the 10% level (). Experience which is normally represented by age plays a significant role in making risk preference choices. On the other hand, income is significantly associated with a risk aversion attitude amongst university students with low financial literacy at 1% level.
presents discounting model results assuming an expected utility exponential function on homogenous time preferences. University students with low financial literacy are risk averse with a risk aversion parameter estimate of r = 0.765 and it is significant at 1% level. The whole group of university students with low financial literacy has a significantly high discount rate δ = 0.824, showing a generally impatient attitude. Comparatively, students with low financial literacy exhibit a more impatient attitude than all the groups under investigation. The university students with low financial literacy were generally more present biased and opted for smaller sooner pay-offs with lower values. The study findings are comparable to Dohmen et al. (Citation2010), they concluded that subjects that were less intelligent were generally impatient. The risk preference behaviour-error is negative and highly significant at 1% level. On the other hand, the time preferences behavioural error is not significant.
Table 11. Discounting ml estimates expected utility theory and homogenous preferences.
presents discounting model results assuming an expected utility exponential function on heterogeneous time preferences. The total group of low financial literacy students is significantly risk averse at 1% level with an estimate of risk aversion r = 0.655, showing that joint estimation reduces the risk preference parameter and the discount rate (Andersen et al. Citation2008). The point estimate of financial literacy (−0.132) is negative and significant at 5% level revealing that financial literacy is associated with a patient attitude.
Table 12. Discounting ml estimates expected utility theory and heterogeneous preferences.
The results show that financial literacy significantly influences discount rates of university students with low financial literacy at a 5% level. Financial literacy is associated with a lower discount rate δ = −0.132, showing that an increase in financial literacy increases patience among university students with low financial literacy. The research findings are similar to those of Benjamin et al. (Citation2013), they concluded that students that were good in mathematics exhibited a more patient attitude. The study findings show that financial literacy influences risk preferences and time preferences of university students with low financial literacy, which explains why researchers concluded that financial literacy benefits more people with low levels of financial literacy (Lusardi & Mitchell Citation2007). The risk preference behavioural error is also significant at 1% level. All other variables do not significantly influence the risk and time preferences of university students with low financial literacy.
4.3. Financial literacy and present biasedness behaviour
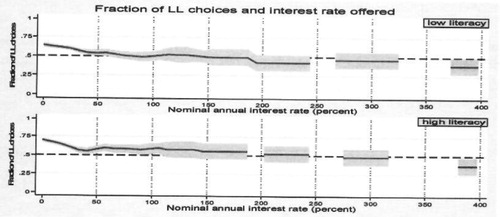
The paper plotted the Larger later choices made by university students categorised by their financial literacy level. shows a kernel-weighted local polynomial regression, with a 95% confidence interval, of the fraction of larger later (LL) choices by low financial literacy and high financial literacy university students for the nominal annual interest rates on offer in the time preference tasks. The 95% confidence intervals do overlap. shows that university students both with high and low financial literacy are generally impatient and they could not wait for a longer period to receive a higher return from their time preference choices. The students made fewer LL choices in the time preference tasks completed. This confirms that university students under investigation were less likely to invest or save their income. Saving and investment are a crucial initiative which are critical for reducing poverty among citizens. If these results provide the truthful behaviour of the subjects in real-life setting, then there is need to impart investment and saving knowledge on students.
Figure 1. Fraction of Large Later choices and the interest rate offered.
5. Conclusion
The research examined the impact of financial literacy on risk preference and time preference choices of university students using multiple price list incentivised experimental method. The data analysis, followed joint estimation methodology that was applied by Harrison et al. (Citation2015) and Andersen et al. (Citation2008), which characterises time preferences over utility flows instead of flows of money. Our analysis uses maximum likelihood estimation on expected utility exponential function focusing on homogeneous and heterogeneous preferences for the university students.
The study concluded that financial literacy significantly influences risk preferences and time preferences of university students with low financial literacy, showing that financial literacy education should be targeted more on university students with low financial literacy. An investigation by Lusardi & Mitchell (Citation2007) shows that financial literacy education benefitted more people who had low financial literacy. An increase in financial literacy is associated with risk seeking and patient attitudes amongst university students. Suggesting that financial literacy allowed students to make high risk and larger later choices with a potential of earning high returns. These traits are associated with people with successful life outcomes. Although all the university students that participated in the study were generally impatient and risk averse in their homogenous preferences choices. Comparatively, student group with low financial literacy was found to be more impatient and more risk averse. The study findings show that university students are less likely to save and invest their income as they are generally impatient. There is a need to inculcate the culture of saving and investment among university students as a way of developing prosperous citizens.
Further, the study found that risk preference behavioural error is significantly greater than time preference behavioural error in all instances showing that risk preference tasks required higher cognitive ability. Making risk preferences choices requires more knowledge and information. The research also found out that age, income and decision making status significantly influence risk preferences of university students.
This research has its own set of limitations. University students studying undergraduate commercial degrees’ financial literacy cannot be matched with the financial literacy levels of ordinary South African citizens. Comparing the results of the study findings with the total population of South Africa might not portray a true picture. It is also difficult to tell whether incentivised risk preference and time preferences rewards can elicit the true attitudes of individuals. However, this study provides a starting point to carry further research with a representative population of South Africa using the methodology and tools applied in the research.
Setting aside these limitations, this study provides an outline of ways to analyse the relationship between financial literacy, risk preferences, and time preferences. Further studies can focus on investigating the impact of financial literacy on risk preferences and time preferences, particularly on a representative South African population and other economies. If these results can be confirmed; there will be a deeper understanding of how financial literacy interacts with preferences.
4.#Ethical approval
All procedures performed in studies involving human participants were in accordance with the ethical standards of the institutional and/or national research committee and with the 1964 Declaration of Helsinki and its later amendments or comparable ethical standards. Permission to carry out the study was granted by the University of the Free State Ethics Committee (Number: UFS-HSD2016/0079).
Acknowledgements
I am grateful to Dr Edward (Tiffy) King scholarship and the University of the Free State Research Committee for funding this study. These funders were not involved in any aspect of the study nor in the preparation of this write-up. I also would like to acknowledge the assistance on data analysis that I received from Professor Glenn W. Harrison of Georgia State University and Professor Frederik le Roux Booysen for helping in conceptualising the idea and the constructive comments that I received from an anonymous reviewer from ERSA and the Development Southern Africa Journal. The impact of financial literacy on risk and time preferences and financial behavioural intentions. Doctoral Dissertation. University of the Free State. Informed consent was obtained from all individual participants included in the study.
Disclosure statement
No potential conflict of interest was reported by the author(s).
References
- Alan, S & Ertac, S, 2015. Patience, self-control and the demand for commitment: Evidence from a large-scale field experiment. Journal of Economic Behavior & Organization 115, 111–22.
- Andersen, S, Harrison, GW, Lau, MI & Rutström, EE, 2008. Eliciting risk and time preferences. Econometrica 76, 583–618.
- Becchetti, L., Caiazza, S, & Coviello, D, 2013. Financial education and investment attitudes in high schools: evidence from a randomized experiment. Applied Financial Economics, 23, 817–836.
- Benhabib, J & Bisin, A, 2005. Modeling internal commitment mechanisms and self-control: A neuroeconomics approach to consumption–saving decisions. Games and Economic Behavior 52, 460–92.
- Benjamin, DJ, Brown, SA & Shapiro, JM, 2013. Who is “behavioral”? cognitive ability and anomalous preferences. Journal of the European Economic Association 11, 1231–55. doi:10.1111/jeea.12055
- Brocas, I & Carillo, JD, 2006. The Brain as a Hierarchical Organization By The Brain as a Hierarchical Organization. Economic Policy 98, 1312–46. doi:10.1257/aer.98.4.1312
- Burks, SV, Carpenter, JP, Goette, L & Rustichini, A, 2009. Cognitive skills affect economic preferences, strategic behavior, and job attachment. Proceedings of the National Academy of Sciences 106, 7745–50. doi:10.1073/pnas.0812360106
- Delavande, A, Rohwedder, S & Willis, RJ, 2008. Preparation for retirement. Financial Literacy and Cognitive Resources. Michigan Retirement Research Center Research Paper No. WP, 2008-190. doi.org/10.2139/ssrn.1337655
- Dohmen, T, Falk, A, Huffman, D & Sunde, U, 2010. Are risk aversion and impatience related to cognitive ability? American Economic Review 100, 1238–60. doi:10.1257/aer.100.3.1238
- Eckel, CC, Johnson, C, Montmarquette, C & Rojas, C, 2007. Debt aversion and the demand for loans for postsecondary education. Public Finance Review 35, 233–62. doi:10.1177/1091142106292774
- Frederick, S, 2005. Cognitive reflection and decision making. Journal of Economic Perspectives 19, 25–42. doi:10.1257/089533005775196732
- Frederick, S, Loewenstein, G & O’donoghue, T, 2002. Time discounting and time preference: A critical review. Journal of Economic Literature 40, 351–401. doi:10.1257/jel.40.2.351
- Fudenberg, D & Levine, DK, 2006. A dual-self model of impulse control. American Economic Review, 96, 1449–76.
- Harrison, GW, Harstad, RM & Rutström, EE, 2004. Experimental methods and elicitation of values. Experimental Economics 7, 123–40.
- Harrison, GW, Lau, MI & Rutström, EE, 2007. Estimating risk attitudes in Denmark: A field experiment. Scandinavian Journal of Economics 109, 341–68.
- Harrison, GW, Lau, MI, Rutström, EE & Sullivan, MB, 2005. Eliciting risk and time preferences using field experiments: Some methodological issues. Research in Experimental Economics 10, 125–218. doi.org/10.1016/S0193-2306(04)10005-7
- Harrison, WG, Hofmeyr, A, Ross, D & Swarthout, T, 2015. Risk preferences, time preferences and smoking behaviour. CEAR Working Paper, 2015–11.
- Holt, CA & Laury, SK, 2002. Risk aversion and incentive effects. American Economic Review 92, 1644–55.
- Huck, S & Weizsacker, G, 1999. Risk, complexity, and deviations from expected-value maximization: Results of a lottery choice experiment. Psychology Journal of Economic Elsevier, 20, 699–715.
- Huck, S & Weizsäcker, G, 1999. Risk, complexity, and deviations from expected-value maximization: Results of a lottery choice experiment. Journal of Economic Psychology 20, 699–715.
- Jacobson, S & Petrie, R, 2009. Learning from mistakes: What do inconsistent choices over risk tell us? Journal of Risk and Uncertainty, 38, 143–158. doi.org/10.1007/s11166-009-9063-3
- Kahneman, D & Tversky, A, 1979. Prospect theory: An analysis of decision under risk. Journal of Social Economic 47, 263–91.
- LaBorde, PM & Mottner, SW, 2013. Personal financial literacy: Perceptions of knowledge, actual knowledge and behavior of college students. Journal of Financial Education 39, 1–30.
- Lusardi, A & Mitchell, OS, 2007. Baby boomer retirement security: The roles of planning, financial literacy, and housing wealth. Journal of Monetary Economics, 54, 205–224.
- Lusardi, A & Mitchell, OS, 2011. Financial literacy around the world: An overview. Journal of Pension Economics and Finance 10, 497–508.
- Mandell, L, 2008. Financial Education in High School. In Annamaria Lusardi (Ed.), Overcoming the saving slump: how to increase the effectiveness of Financial education and saving programs, 257–279.
- Mudzingiri, C, 2019. The impact of financial literacy on risk and time preferences and financial behavioural intentions. University of the Free State, 33–61.
- Parker, AM & Fischhoff, B, 2005. Decision-making competence: External validation through an individual-differences approach. Journal of Behavioral Decision Making 18, 1–27. doi:10.1002/bdm.481
- Schwella, E & van Nieuwenhuyzen, B, 2014. Measuring financial literacy: Developing and testing a measurement instrument with a selected group of South African military officers. Africa Education Review 11, 365–85. doi:10.1080/18146627.2014.934993
- Shambare, R & Rugimbana, R, 2012. Financial literacy Among the educated: An exploratory study of selected university students in South Africa. Feature Article, 4425, 581–590.
- Struwig, J, Roberts, B, & Gordon, S, 2014. Financial Literacy in South Africa 2013 Report. Human Sciences Research Council, 1–85.
- Van Rooij, M, Lusardi, A, & Alessie, R, 2011. Financial literacy and stock market participation. Journal of Financial Economics 101, 449–472.
- Whitney, P, Rinehart, CA & Hinson, JM, 2008. Framing effects under cognitive load: The role of working memory in risky decisions. Psychonomic Bulletin & Review 15, 1179–84. doi:10.3758/PBR.15.6.1179
- Wilcox, NT, 2011. ‘Stochastically more risk averse’: A contextual theory of stochastic discrete choice under risk. Journal of Econometrics 162, 89–104.
Appendix
High financial literacy, risk preferences and time preferences
Table A1. Expected utility theory ML estimates Homogenous risk preferences.
Table A2. Expected utility theory ML estimates Heterogeneous risk preferences.