
 ?Mathematical formulae have been encoded as MathML and are displayed in this HTML version using MathJax in order to improve their display. Uncheck the box to turn MathJax off. This feature requires Javascript. Click on a formula to zoom.
ABSTRACT
One of the biggest challenges to South African municipalities is to generate sufficient revenue to ensure that the needs of a growing population are met. The impact of population growth in terms of natural increase and net migration over time on municipal revenue generation is unknown. The assumption is that municipalities that experience rapid population growth do not receive a comparable change in revenue that would allow delivery of basic services. The aim of this research is to determine the relationship between population growth and municipal revenue. This will be achieved by analysing (1) national municipal population, household growth trends between 2001 and 2016 and its relationship to municipal revenue; and (2) analysing municipal ability to generate ‘own income’ and its relationship to indigent households in six municipalities in the Western Cape. The research found that overall municipal revenue increases at a substantially higher rate than population and indigent households.
1. Introduction
In South Africa, the local sphere of government experienced a substantial transition following democratisation. During the year 2000 a wall-to-wall local government system was established to ensure that local authorities become increasingly accountable to local constituents with the adoption of the 1996 Constitution of South Africa (SALGA Citation2014: 12). This was an important step towards establishing a developmental local government which, through the White Paper on Local Government (1998: Section B), had to commit itself to working with communities and citizens to ‘find sustainable ways to meet their social, economic and material needs to improve the quality of their lives’. The challenge for municipalities to meet the needs of a growing population is to generate sufficient revenue to ensure that basic services are delivered. The Local Government Municipal Financial Management Act 56 of 2003 prescribes that,
a municipal budget can only be funded from realistically anticipated revenues to be collected as empowered by the Constitution; borrowings for capital budgets only; cash backed accumulated funds not committed for other purpose, and donations and locations from other spheres of government commonly referred to as grants and subsidies. (SALGA Citation2014:28)
The population of South Africa increased from 40 583 573 in 1996 to 55 653 654 in 2016 (Stats SA Census Citation1996 & Citation2016: 19). During the period of 1996–2016, households (defined as abstract social constructs that shares resources) grew from 9 059 571 to 16 923 309 (Stats SA Citation2016: 55). Internal migration, which is also referred to as internal mobility patterns, resulted in some municipalities’ population increasing faster than others. This is attributed to inter provincial migration, foreigners taking part in circulatory migration or neighbouring African nationals who settle for seasonal work (Stats SA Citation2016: 28).
Municipalities’ financial responsibilities are complicated by 49.2% of adults in South Africa living below the upper bound poverty line which is R1 183 (Stats SA Citation2018: 3). Turok & Borel-Saladin (Citation2014: 676) states that ‘pent-up migration pressures were released when apartheid was abolished, but deep social inequalities and shortages of land and housing have hampered urban integration’. It can be argued that a large percentage of post-apartheid internal migrants are part of the 49.2% of adults that lives in poverty. Research on migration to the Western Cape province concluded that the majority of internal migrants had a low income or were unemployed and moderately skilled (Jacobs Citation2014:ii). In the Gauteng province, 30% of internal migrants were dependent on government grants (Ngobeni Citation2014: 16). Such poor/poorer households that receive free basic services such as water, electricity, sanitation and refuse removal are classified as indigent households by government (DPLG Citation2005:30).
The impact of population growth in terms of natural increase and net migration over time on municipal revenue generation is not known. The assumption is that municipalities that experience rapid population growth does not necessarily receive a comparable change in revenue that would allow them to deliver basic services. This could be due to the majority of population growth attributed to an increase in indigent households.
The aim of this research is to determine the relationship between population growth and municipal revenue growth. This will be achieved by analysing (1) national municipal population, household and indigent household growth trends between 2001 and 2016 and its relationship to municipal revenue growth; and (2) analysing municipal capacity to generate ‘own income’ and its relationship to indigent households in six municipalities in the Western Cape.
2. National population growth trends
Population growth is the outcome of positive population change which occurs when net migration plus live births, minus deaths is positive (Stats SA Citation2011:22). In South Africa, migration features prominently in population growth due to strict regulatory measures that removed access to urban areas by certain racial groups during the apartheid era. The ‘2001–2002 Human Sciences Research Council Migration Survey’ in Kok et al. (Citation2006:184) defines a ‘migrant’ who takes part in migration, as a person crossing the boundary of a magisterial district or moving from one rural or urban part of a district to another.
Bekker (Citation2001:1), by quoting observations from Wilson and Mayer, states that circulatory migration was a prominent migration trend for black South Africans during the second half of the nineteenth century due to regulatory measures. During the apartheid era circulatory labour migration was common because of its temporary nature.
The dominant trend of migration post-1991 as indicated in a study by Bekker (Citation2001:1) is referred to as gravity flow migration which entails migrants settling permanently in their new region/town. The regulatory measures taken between 1947 and 1991 shaped the extent and patterns of movement that followed 1991. Black Africans have greater freedom to relocate to areas and regions that were off limits prior to 1991.
Circular migration is perceived as a continuing trend that is an important survival method for households from rural areas in poorer provinces (Todes et al. Citation2010:332). The high cost of living in urban settlements is an important contributor to circular migration. Young children are placed in the care of rural households while working age parents locate to urban areas to search for employment opportunities (Posel Citation2004:279). Not all poor people migrate, the relative cost of living in the rural areas, established social networks and lack of finances and social networks in areas with greater opportunity ensure that the poorest of the poor is unable to migrate.
Migration is a complex phenomenon which is circular and gravitational in nature. The common denominator amongst reasons for migration across various magisterial districts seems to be economically driven with associated improved quality of life aspirations which can be of a non-economic nature. The areas where black people were permitted to live prior to 1991 were deprived of economic development and most still reflect lower comparative economic potential with high population densities (The Presidency Citation2006). The low economic potential of origin-areas of jobless or poor migrants could arguably explain the continuous expansion of informal settlements, although Cross et al. in Todes et al. (Citation2010:346) states that poverty also occurs within cities and spreads with migration streams that are caused by poverty dynamics at household level. Poverty is not entirely driven by rural to urban migration, however, the dominant place of accommodation for migrants upon moving to urban areas appears to be informal structures or shack accommodation because of newcomers’ inability to instantly draw sufficient income from the job market (Todes et al. Citation2010:346).
Ongoing migration, the splitting of households and declining household size, presents a challenge for municipal management as these factors drive physical growth, demand for housing and infrastructure (Todes et al. Citation2010:331). Todes et al. (Citation2010:344) argue that the splitting of households, referred to as intra urban migration and declining household size, are a result of unmarried persons and youth migration which is a recent dynamic. These have a greater impact on spreading poverty and the expansion of cities than rural to urban migration.
Statistics South Africa (Citation2001:43) reported that 5 570 461 people changed residence between provinces from 1996 to 2001. Statistics South Africa reports a slightly lower ‘1996–2001’ migration figure, 5 541 649 in the ‘Migration and urbanisation in South Africa’ publication. Between 2001 and 2011, 3 208 451 people changed residence between provinces (Stats SA Citation2011:23). Between 2011 and 2016, 3 754 260 people migrated internally (Stats Citation2016: 30). These figures represent movement of all racial groups across various socio-economic categories. It is evident, referring to , that migration rates were higher between 1992 and 2001.
Table 1. Variables used in analysis
Table 2. Population and revenue growth index, metropolitan municipalities
Table 3. Population and revenue growth index, category B municipalities
Table 4. Combined population and revenue growth index for municipalities
South African households indicated that the five leading challenges experienced within the municipal area they reside in, are lack of or inadequate employment opportunities, cost of electricity, lack of safe and reliable water supply, inadequate housing and violence and crime (Stats SA Citation2016:56). Many communities remain unserviced due to organisational failure by local government. Frustration with service delivery leading to a rise in service delivery protests is prominent amongst black African communities, factors influencing dissatisfaction are inequalities caused by apartheid, lack of responsiveness by councillors and officials, uneven access to services and unfulfilled exaggerated political promises (Masiya et al. Citation2019:33).
3. Municipal finances
National government fund basic service provision through transferring funds from the national fiscus to provinces and municipalities in the form of an unconditional equitable share of revenue and conditional grant funding (SALGA Citation2014:4). The equitable share of revenue raised nationally and distributed among provinces and municipalities is embedded as a principle in the South African Constitution (Manyaka Citation2014:132). A formula that uses objective data is applied so that the split in revenue cannot be arbitrarily manipulated to benefit an individual municipality (Local Government Equitable Share Formula Review: Citation2012:2).
The LGES formula consists of the following five components (Local Government Equitable Share Formula Review: Citation2012:10):
‘The basic services component is worth 99.4 per cent of the value of the equitable share and provides for the cost of free basic services for poor households as well as municipal health services; The development component is dormant; The institutional support component is worth 7.9 per cent of the value of the equitable share and provides a subsidy for the costs of running a basic municipal administration; The revenue-raising capacity (RRC) correction accounts for the fact that some municipalities have a much greater ability to raise own revenues than other municipalities and subtracts 7.4 per cent of the value of the equitable share, primarily from the wealthiest municipalities in order to make those funds available for poorer municipalities; The correction and stabilisation factor makes sure all of the guarantees in the formula can be met and accounts for a negligible proportion of the final equitable share allocations’.
Grant = BS + D + I – R ± C. ‘BS is the basic services component; D is the development component; I is the institutional support component; R is the revenue-raising capacity correction and C is a correction and stabilisation factor’.
The financial context of municipalities in South Africa varies substantially due to a broad range of circumstances and varying degrees of capacity which influence the quality of reporting (Verwey Citation2008:30). The ‘White Paper on Local Government’ states that, urban and rural municipalities, and even those in different metropolitan areas, have different financial circumstances, with very different prospects for providing adequate services at reasonable costs. Some municipalities, particularly those in rural areas, do not have an adequate tax base to fund the delivery of even the minimum level of basic services. Metropolitan municipalities can provide a variety of services from sufficient revenue received from property tax and service charges; these municipalities are deemed self-sufficient whereas many other municipalities, including rural municipalities with a limited revenue base, are entirely dependent on equitable share and conditional grant allocations from provincial and national government (Verwey Citation2008:30).
Self-financing is a major challenge for municipalities without an adequate tax base (DoJCD 1998). Property tax and user service charges are the main source of ‘own’ revenue generated; property tax is generated through the payment of fees by owners of properties within the administrative jurisdiction of municipalities; these fees are based on the assessed value of a property and user charges are the amount directly paid for services rendered by the municipality (Manyaka Citation2014). It is widely accepted, given the inadequate property tax base within South African municipalities, that property tax as a stand-alone source of income is not sufficient to cater for the demand and supply of public services. Municipalities must explore cost recovery charging systems to supplement property tax income (Manyaka Citation2014).
Municipalities define poor/poorer households that receive free basic services such as water, electricity, sanitation and refuse removal as indigent households (DPLG Citation2005). The adoption of the free basic services policy during 2001 gives recognition to households that are unable to pay for basic services as well as the Constitutional obligation of government to provide the minimum standard and amount of services (Verwey Citation2008:103).
The free basic services policy requires that municipalities develop indigent registers which contains records of households that meet the criteria which qualify them for free basic services (DPLG Citation2005). Verwey (Citation2008) highlights the following problems with the concept of indigency: it enhances the stigmatisation of a hopeless, helpless chronically poor group of people that are trapped in poverty; strict measurement of and migrating out of the ‘indigency’ classification are non-existent, and the administrative task that include a lack of adequate information to compile and update the indigent register is nearly impossible. An increase of indigent households is a major challenge for municipalities because it contributes to a decreased municipal property tax base as well as increased expenditure due to long-term maintenance of infrastructure that offers limited to no return of revenue (Manyaka Citation2014).
4. Methodology
The research attempts to determine the relationship between municipal population and household growth, as well as its proportional/disproportional growth in revenue. In addition, it seeks to establish what the relationship is between municipal indigent household growth, and a municipality’s ability to generate income from rates and taxes. To achieve this, two indices will be used to provide an overall analysis on the relationship between population, indigent household, municipal revenue (total) and own revenue growth.
The first index represents the relationship between total Municipal Revenue (MR) and Population Growth (PG) in all municipalities in South Africa. The index will be calculated as follows:
Where the PRI is determined by calculating the difference between compound annual MR growth rate (between 2006 and 2016) and compound PG growth rate (between 2006 and 2016):
This calculation assumes that annual growth in MR must be equal or higher to annual growth in PG in order for municipalities to be able to adequately provide services to a growing population.
The second index represents the relationship between selected municipalities in the Western Cape’s ability to generate own revenue (OR) (between 2006 and 2016) and the growth in indigent households (IH) in these municipalities (between 2006 and 2016):
Where the index is determined by calculating the difference between compound annual Own Revenue (OR) growth rate (between 2006 and 2016) and compound Indigent Household (IH) growth rate (between 2006 and 2016):
This index assumes that growth in OR must be higher or equal to IH growth in order for municipalities to maintain a viable property tax base from which to generate own revenue. defines the variables used in the analysis.
The main data source for population, household and indigent household growth was Statistics South Africa. Municipal revenue growth figures were obtained from Quantec. The availability of reliable data over comparable time periods was a significant constraint. Since the only temporal window for comparable analysis across all datasets was found between 2006 and 2016, the research was done over this time period.
5. Results
The eight metropolitan municipalities in South Africa had a combined population growth of 40.6% between 2001 and 2016 whereas the 226 category B municipalities’ population grew by 14.2% over the same period. indicates that households in the metropolitan municipalities grew by 45.4% between 2001 and 2016 whereas households in the 226 grew by 21.3%.
Figure 1. Household growth in Metropolitan vs Category B Municipalities (Quantec Citation2019).
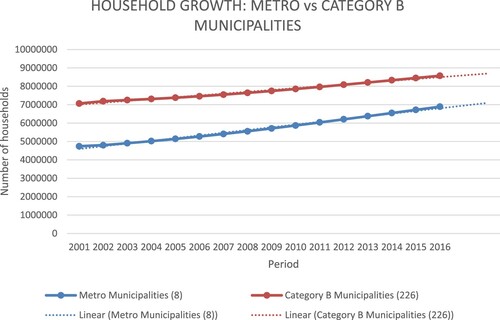
The population and household growth percentages reflect that the eight metropolitan municipalities are growing at a higher rate than the 226 category B municipalities.
Metropolitan and category B municipalities have an ‘own’ revenue source at its disposal, which makes them financially more autonomous than district municipalities and provincial governments that are fully dependent on conditional grants and equitable shares from the national fiscus (Verwey Citation2008:30). Metropolitan and category B municipalities, however, receive an equitable share and conditional grants from the national fiscus that supplements revenue generated.
reflects total metropolitan and category B municipal revenue from own revenue sources, equitable share and conditional grants transferred from the national fiscus. The figure indicates that between 2006 and 2016, metropolitan municipalities’ revenue increased by 257% whereas category B municipalities’ revenue increased by 278.5%. Metropolitan municipalities have a higher total revenue because of a more adequate property tax base (Manyaka Citation2014:131).
Figure 2. Municipal Revenue in Metropolitan vs Category B municipalities (Quantec Citation2019).
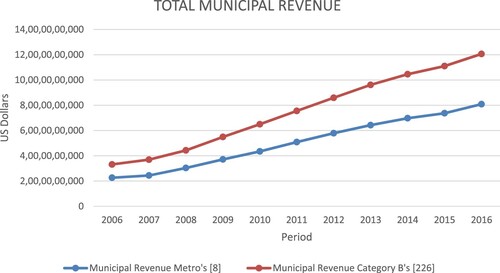
Both metropolitan (metro) and category B municipal revenue increased over time, during certain periods, quite substantially. The trajectory of revenue from 2007 onwards suggests that the gap between metropolitan (metro) and category B municipalities are increasing.
Results of the PRI are as follows:
The population and revenue growth index of 11.08 for metropolitan municipalities and 13.3 for category B municipalities suggest that between 2006 and 2016 total municipal revenue nationally increased at a higher rate than population growth. Metropolitan municipalities had a higher percentage population growth than category B municipalities between 2001 and 2016. In both metropolitan and category B municipalities, total municipal revenue is growing at a higher rate than their respective populations, which is positive considering the implications of providing free basic municipal services in both categories of municipalities.
5.1. Own revenue indigent household index
The sample size for this analysis is one category B municipality per district municipal area in the Western Cape Province. The municipalities were selected based on the highest population growth percentages per district municipal area in the Western Cape (). The Western Cape Province has one metropolitan municipality, the City of Cape Town which forms part of the study. demonstrates the population growth trends in the City of Cape Town between 2001 and 2016.
Table 5. Category B municipalities which have the highest population growth percentage per district municipal area in the Western Cape Province
Table 6. City of Cape Town Metropolitan Municipality population growth trends
For these selected municipalities, an initial analysis () indicates the total municipal revenue growth rate proportional to the population growth rate.
Figure 3. Western Cape Municipalities: Total Municipal Revenue vs Population Growth Rate (Quantec Citation2019).
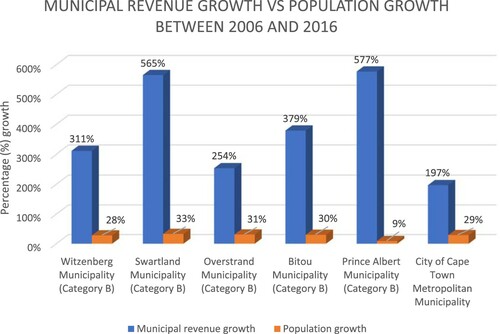
Total revenue increases reflect substantial growth compared to population growth. The substantial revenue increases could be because of conditional grants for bulk infrastructure projects/programmes transferred from the national fiscus.
The second part of the Western Cape municipality analysis investigated the growth of indigent households compared to growth in municipal own revenue. Indigent households reflect slower overall growth than total household growth. ‘Own’ municipal revenue is generated from property tax and user service charges whereas total municipal revenue consists of own revenue generated, equitable share allocations and conditional grants from the national fiscus. It is accepted that the steady increase in total households has a positive net effect on the municipal property tax base.
reflects the results of the indigent household growth compared to own revenue growth analysis in the selected Western Cape municipalities.
Figure 4. Indigent Household Growth vs Own Revenue Growth in selected Western Cape Municipalities.
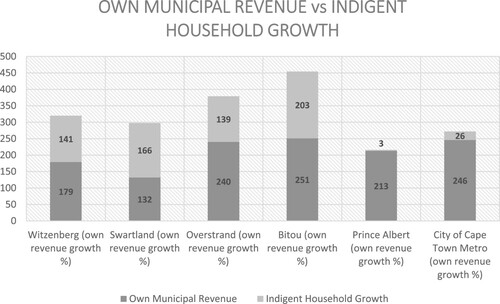
Indigent household and own revenue growth percentages vary in terms of growth between 2006 and 2016. Prince Albert and City of Cape Town Metropolitan Municipalities’ indigent household growth are low when measured across this time period, but these two municipalities exhibit proportionally high indigent household figures compared to total households.
The ‘own’ revenue and indigent households index developed for the municipalities are based on averages calculated for ‘Own Revenue’ (OR) T1, T2 and ‘Indigent Households’ (IH) T1, T2 over a period of 11 years from 2006 to 2016. indicates the individual municipal calculations of the Own revenue vs Indigent Household Index per municipality.
Table 7. Own revenue and indigent household index, selected Western Cape Municipalities
The indices calculated for each municipality reflect that own municipal revenue is increasing at a higher rate than indigent households except for Swartland Municipality, which does not generate sufficient own revenue.
Indigent household increases have an impact on overall ‘own’ municipal revenue growth. The index suggests that Witzenberg and Bitou Municipalities have the smallest margin of positive growth between own revenue and indigent households; this is reflected in the growth percentages in Table 13. Witzenberg Municipality had an ‘own’ revenue growth of 179% versus an indigent household growth of 141% over a ten-year period whereas Bitou Municipality had a 251% ‘own’ revenue growth and a 203% indigent household growth over the same period.
6. Discussion
The national trends suggest that the metropolitan municipalities in South Africa are growing at a much higher rate in terms of population, households and indigent households than the category B municipalities in the country.
Indigent household growth in the category B municipalities shows a downward trend, this could be due to the inability of most category B municipalities to report on indigent households in their area of jurisdiction, or possibly suggest that migration to metropolitan municipalities is resulting in decreased prevalence of poorer households in smaller cities and towns in South Africa (Verwey Citation2008:11).
Nationally, metropolitan and category B municipal revenue growth trends have been positive between 2001 and 2016, although metropolitan municipalities show higher revenue growth compared to category B municipalities; this is probably due to a larger property tax base (Manyaka Citation2014:131).
The population and revenue growth index for metropolitan and category B municipalities suggest that between 2006 and 2016 total municipal revenue increased nationally at a higher rate than population growth.
The analysis of City of Cape Town Metropolitan Municipality, Witzenberg, Swartland, Overstrand, Bitou and Prince Albert category B municipalities shows that population and households are growing at a higher rate than indigent households. Annual indigent households reported on, although increasing, fluctuate; this could be because it is difficult to complete indigent registers due to a lack of adequate data (Verwey Citation2008:11).
Total municipal revenue which includes ‘own’ revenue, equitable share allocations and conditional grants shows substantial growth between 2006 and 2016 for City of Cape Town Metropolitan Municipality and the five category B municipalities, Witzenberg, Swartland, Overstrand, Bitou and Prince Albert. ‘Own’ municipal revenue generated from property tax and user service charges are growing at a slower and lower rate than total municipal revenue for City of Cape Town Metropolitan Municipality and the five category B municipalities, Witzenberg, Swartland, Overstrand, Bitou and Prince Albert. In most instances, however, the own revenue growth rate still exceeded the growth of indigent households, suggesting that the accumulation of poorer households in these municipal areas has not significantly detracted from the municipality’s ability to leverage own income. This is of course different in the Swartland municipality, where Indigent Households grew at a faster rate than own income for the municipality.
7. Conclusion
The research sought to understand the relationship between the growth of a municipality’s income proportionally to the growth in population and households of the municipality. It was hypothesised that municipal income is proportionally not keeping abreast with the fast pace of population and household growth experienced nationally. The research made use of two indices in the analysis. Firstly, an index that compares the Compound Annual Population Growth Rate of all municipalities in South Africa to the Total Municipal Revenue Growth in all municipalities in South Africa. This index, The Population Revenue Index, revealed that municipal income increased at a substantially higher rate than population and households in all municipalities, most notably the metropolitan municipalities.
The second analysis compared the Compound Annual Growth in Indigent Household Growth in selected municipalities in the Western Cape, to the Compound Annual Growth in Own Income of these municipalities. The results of this analysis indicated that in all the selected municipalities, except the Swartland municipality, the growth of own revenue still surpassed the growth in indigent households. It therefore suggests that the initial hypothesis of the research, i.e. that municipal income are unable to keep abreast with fast population and household growth, appears invalid, and that despite continued migration and growth in poorer households, local municipalities still manage to grow their revenue at a faster pace. Further research should analyse the value of increased municipal own revenue on provision of basic services to the indigent cohort.
No funding acknowledgements
Disclosure statement
No potential conflict of interest was reported by the author(s).
Additional information
Funding
References
- Bekker, S, 2001-2002. Diminishing returns: circulatory migration linking Cape Town to the Eastern Cape. SA Journal of Demography 8(1), 1–8.
- Cape Winelands District Municipality, 2019. Cape Winelands District Municipal Spatial Development Framework, s.l.: Cape Winelands District Municipality.
- Department of Cooperative Governance and Traditional Affairs, n.d. How are Indigent Households Identified?. [Online] Available at: http://www.cogta.gov.za/?p=767[Accessed 5 July 2019].
- Department Provincial and Local Government (DPLG), 2005. National Framework for Municipal Indigent Policies. [Online] Available at: https://www.westerncape.gov.za/text/2012/11/national_framework_for_municipal_indigent_policies.pdf [Accessed 5 July 2019].
- Jacobs, W, 2014. Migration patterns and migrant characteristics in the Western Cape through a differential urbanisation lens.
- Kok, P, Gelderblom, D, Oucho, JO & van Zyl, J, 2006. Migration in South and Southern Africa, dynamics and determinants. HSRC Press, Cape Town.
- Manyaka, RK, 2014. Collection of municipal own revenue in South Africa: challenges and prospects. Journal of Public Administration 49(1), 127–139.
- Masiya, T, Davids, YD & Mangai, MS, 2019. Assessing service delivery: Public perception of municipal service delivery in South Africa. Theoretical and Empirical Researches in Urban Management 14(1), 20–40.
- Ngobeni, JM, 2014. Migrant characteristics and migration patterns to Gauteng (2001-2011).
- Posel, D, 2004. Have migration patterns in post-apartheid South Africa changed? The Journal of Interdisciplinary Economics 15, 277–292.
- Provincial Government Western Cape, 2017. Western Cape Integrated Waste Management Plan 2017-2022. s.l.:Provincial Government Western Cape.
- Quantec Easy Data, 2019. Easy Data by Quantec. [Online] Available at: http://www.easydata.co.za [Accessed 6 August 2019].
- Republic of South Africa Department National Treasury, Department of Cooperative Governance, South African Local Government Association, Financial and Fiscal Commission, Statistics South Africa, 2012. Local Government Equitable Share Formula Review, Discussion Paper 2: Analysis of the current Local Government Equitable Share Formula. s.l.:s.n.
- Republic of South Africa, 2011. 2011 Local Government Budgets and Expenditure Review: 2006/07-2012/13, s.l.: National Treasury.
- SALGA (South African Local Government Association) Senior Management Induction Programme, 2014. A SALGA Programme for Human Capital Development in Local Government. s.l.:LexisNexis Group.
- South Africa (Republic of), 1998. White paper on local government. Pretoria, Department of Cooperative Governance and Traditional Affairs.
- South Africa (Republic), 1995. White Paper on the transformation on public service. Government Printers, Pretoria.
- South Africa (Republic), 1996. Constitution of the Republic of South Africa, Act No.108 of 1996. s.l.:s.n.
- South Africa (Republic), 1998. Local Government: Municipal Structures Act No. 117 of 1998. s.l.:s.n.
- Statistics South Africa, 1996. Popultion census, 1996. [Online] Available at: apps.statssa.gov.za/census01/Census96/HTML/default.htm [Accessed 5 July 2019].
- Statistics South Africa, 2001. Census 2001 achieving a better life for all. progress between Census 96’ and Census 2001. Statistics South Africa, Pretoria.
- Statistics South Africa, 2011. Census 2011 statistical release. Statistics South Africa, Pretoria.
- Statistics South Africa, 2016. Community survey 2016 statistical release. Statistics South Africa, Pretoria.
- Statistics South Africa, 2017. The state of basic service delivery in South Africa: In-depth analysis of the community survey 2016 data. Statistics South Africa, Pretoria.
- Statistics South Africa, 2018. Subjective poverty in South Africa. Findings from the living conditions surveys, 2008/2009-2014/2015. Statistics South Africa, Pretoria.
- The Presidency, RSA, 2006. National Spatial Development Perspective. s.l.:Chief Policy Analyst: Plannig Policy Coordination and Advice Services.
- Todes, A, et al., 2010. Contemporary South African urbanization dynamics. Urban Forum 21, 331–348.
- Turok, I & Borel-Saladin, J, 2014. Is urbanisation in South Africa on a sustainable trajectory? Development Southern Africa 31(5), 675–691.
- Verwey, L, 2008. Key efficiency and equity aspects of providing basic local services in South Africa.