
ABSTRACT
This article presents the results of the five waves of the National Income Dynamics Study – Coronavirus Rapid Mobile Survey (NIDS-CRAM) on food security between May 2020 and May 2021. Despite significant investments in social protection, food insecurity and household and child hunger remained stubbornly high. We conclude that given the protracted nature of the pandemic, slow economic recovery, household and child hunger have stabilised at higher levels than before the pandemic. The phasing out of emergency relief coupled with the constrained economic situation, are some of the reasons why levels of food insecurity and hunger are likely to remain high in the near future. Strict lockdown regulations also reduced employment and income from informal economic activities. Social support for vulnerable individuals and households remain an urgent priority. Continuing support targeted at households with children is particularly important given the dire consequences of enduring hunger for stunting, and on children’s long-term development.
1. Introduction
The onset of the Coronavirus-19 pandemic in South Africa and the associated lockdowns brought nutrition, food security and hunger into prominence as crucial policy concerns. The pandemic and lockdowns made physical data collection through conventional household surveys impossible, but enhanced the need for regular information on socio-economic trends and conditions. This gave rise to the NIDS-CRAM (National Income Dynamics Study – Coronavirus Rapid Mobile Survey, Citation2021) initiative, a collaborative effort involving many researchers from at least seven universities, with government support. More information on the initiative and the data can be found in the introduction to this edition as well as on the NIDS-CRAM website. Throughout this paper, data reported on are at the level of households, using the household weights generated and explained by Wittenberg & Branson (Citation2021).
This paper reports our findings on trends in hunger and food insecurity during the COVID-19 pandemic between May 2020 and May 2021 as derived from the five waves of NIDS-CRAM. The nature of the survey (a telephone survey) limited the number of questions that could be asked, and thereby limited our findings to hunger and availability of money to buy food: We can only speculate how trends in stunting would have been affected.
In placing the trends during the pandemic in context, we first show that hunger trended downwards in the first decade of this century, probably largely because of the expansion of the Child Support Grant (CSG), but stunting trends were less positive. The pandemic reversed even the earlier hunger trends. The first wave of NIDS-CRAM, collected in May and June 2020, provided strong evidence of drastic increases in household and child hunger. There was some improvement following the relaxation of the first hard lockdown and the relief measures instituted. Nevertheless, the reduction in hunger did not last, and lack of money to buy food (what we will, somewhat inaccurately but for the sake of brevity, refer to as ‘food insecurity’), has not changed substantially since June 2020.
We conclude that given the protracted nature of the pandemic, slow recovery and its continuing social and economic impact, and the stabilisation of household and child hunger at higher levels than before the pandemic, support for vulnerable households remains crucial, especially support targeted at households with children, given the tragic consequences of enduring hunger for stunting and children’s long-term development.
2. Background: a brief review of hunger in South Africa
Malnutrition remains a reality for many South African households. In 2018, a quarter of South African households reported running out of money for food in the past year (General Household Survey, Citation2018). Running out of money to buy food, or food insecurity, has major implications for a child’s nutritional status. Twenty seven per cent of South African children under 5 years of age were stunted in 2016 (slightly higher than the developing country average of 25%) and 2.5% were wasted (lower than the developing country average of 9%) (General Household Survey, Citation2018). Severe malnutrition can be life threatening for South African children who are HIV positive (Saloojee et al., Citation2007). Almost a third of South African children who die are severely malnourished, though malnutrition may not be the primary cause of their death (Bamford et al., Citation2018).
The consequences of child malnutrition can stretch well into adulthood through its negative impacts on human capital formation (Ampaabeng & Tan, Citation2013; Hoddinott et al., Citation2013). Chronic malnutrition increases the risk of infection and death and is linked to poor cognitive development (Richter & Desmond, Citation2008), while improved nutrition may increase future earnings and contribute to substantial poverty reduction (Behrman & Hoddinott Citation2005; Aguero et al., Citation2006; Bailey et al., Citation2020).
Poverty often manifests in hunger or poor nutrition (e.g. unbalanced, carbohydrate rich diets). StatsSA’s annual General Household Survey (GHS) records a declining trend in child and adult hunger between 2002 and 2018, with the bulk of this occurring in the period before the ‘Great Recession’ of 2008/9, a trend largely ascribed to the expansion of the CSG.
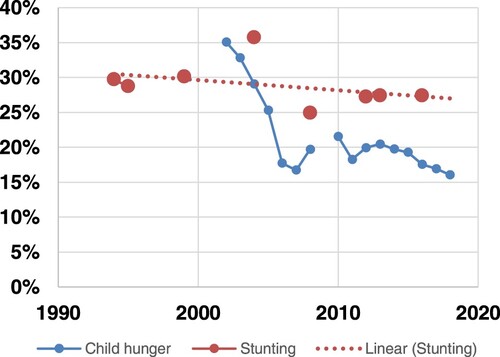
However, child hunger does not convey the full nutrition picture. Stunting of young children, a measure derived from children’s height-for-age compared to an international norm, is a better nutritional indicator and is also influenced by food quality. Poor health also contributes to child stunting, with clean water and sanitation considered to be particularly important (Aguayo & Menon, Citation2016; Bridgman, Citation2020; Fink et al., Citation2011). The downward sloping stunting trend in shows that the CSG did not reduce stunting as much as hunger, at least not as far as can be told from the different studies that have been conducted and incorporated in the UNICEF (Citation2020) report and shown in . Considering the importance of tracking nutritional outcomes to inform policymaking, we need more regular and reliable figures on child stunting.
Figure 1. Long-term trends in child hunger and stunting. Source: Stunting from various sources as summarised in UNICEF Citation2020; Child hunger calculated from StatsSA’s GHS data (the question was not asked in 2009).
Van der Berg et al. (Citation2020) compared questions in the General Household (GHS) survey with those asked in the first wave of the NIDS-CRAM survey in order to assess the impact of the pandemic and the first lockdown on child hunger and household food insecurity. They found a sharp increase in hunger and food insecurity, concluding that
twice as many households reported running out of money to buy food in a single month of lockdown (April 2020) as did report they ran out of money to buy food in the entire year of 2017. (Van der Berg et al., Citation2020: 11)
The arrival of the coronavirus pandemic in South Africa as well as the lockdown implemented on 27 March 2020 have ushered in a period of economic uncertainty in an already weak economy. It is thus no surprise that food insecurity, poverty and household hunger rose, with sobering consequences for children who experience this reality.
3. Hunger in South Africa: May 2020 to May 2021
All five waves of the NIDS-CRAM survey asked multiple questions about child and household hunger, as well as a question regarding household food insecurity (running out of money to buy food), as shown in Box 1. Since the same questions were asked in all waves, it is possible to shed light on how reported hunger and food security have changed between May/June 2020 and April/ May 2021. As Box 1 shows, if survey respondents indicated that someone in their household had gone hungry, they were then asked to indicate how often they had gone hungry or skipped a meal in the past 7 days. For those reporting hunger, the severity of hunger can be measured by answers to these questions.
• In the month of March did your household run out of money to buy food?
• In the last 7 days, has anyone in your household gone hungry because there wasn’t enough food? How often did they go hungry?
○ (Options: Never; 1 or 2 days; 3 or 4 days; almost every day; every day)
• In the past 7 days, has any child in your household gone hungry because there wasn’t enough food? How often did they go hungry?
○ (Options: Never; 1 or 2 days; 3 or 4 days; almost every day; every day)
Note: the lack of money to buy food refers to March, and the questions on hunger to the last week before the interview, which was conducted in either April or May 2021
Overall, the proportion of households who reported that their household had run out of money for food declined from 48% in Wave 1 to 38% in Wave 2. This measure increased and then remained consistent at 40% of households in Wave 3, and 37% in Wave 4. In Wave 5, there was a reduction in this measure: 35% of households reported running out of money for food in the past month, as seen in .
Figure 2. Food insecurity and hunger: NIDS-CRAM Waves 1–5. Source: Authors’ calculations from NIDS-CRAM Wave 5 data. The different dates are because the question on food money referred to the month before the survey fieldwork took place, while the questions on hunger referred to the previous week during the fieldwork period.
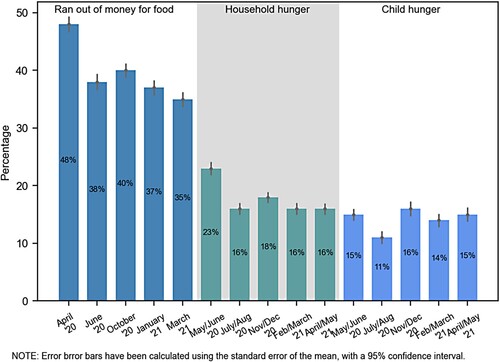
While this is encouraging, this does not seem to have translated into a reduction in household hunger, nor child hunger. In Wave 1, hunger was reported in 23% of households. This measure declined significantly in Wave 2–16%, but has since fluctuated between 18% and 16% in Waves 3, 4 and 5.
Furthermore, child hunger has also not declined. The proportion of households with children in which a child had gone hungry at least once in the past week saw a significant decline from 15% to 11% between Waves 1 and 2, before it rose sharply to 16% in Wave 3. In Wave 4, this measure declined to 14%, and it then remained steady in Wave 5–15%. Child hunger is once again at almost exactly the same level as it was during the harshest period of lockdown in South Africa and before the new grants and top-ups had been put into place.
To give perspective to these numbers, during April/May 2021, child hunger in the week before the interviews was reported in about 1.5 million households. Of those 1.5 million households, around 248 000 households reported that a child had experienced hunger almost every day or every day during the week before they were interviewed in April/May 2021.
3.1. The severity of hunger
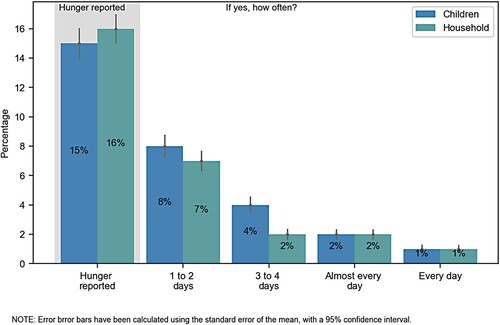
shows the results from these questions on the severity of hunger for Wave 5, for April and May 2021. About 8% of households reported that one or more children had gone hungry once or twice in the previous week, and 7% reported this for one or more adults. About 4% indicated child household hunger 3 or 4 days in the past week. In a further 3% of households, a child had gone hungry every day or almost every day in the past week, a similar proportion as for household hunger in general.
Figure 3. Severity of hunger: NIDS-CRAM Wave 5. Source: Authors’ calculations from NIDS-CRAM Wave 5 data.
The continuing reality regarding food insecurity for many households in South Africa is perhaps not quite as dire in comparison to the period during the hard lockdown, but it remains a bleak picture. While fewer households report running out of money to buy food, household and child hunger have not decreased, and furthermore, the severity of hunger in households remains worrying. These results indicate that there is a new and higher equilibrium level of hunger and food insecurity in South Africa since the start of the coronavirus pandemic, and that the amelioration of child hunger should be a source of public concern.
The picture which emerges from these statistics indicates that while food security may have improved for some households, hunger has not been reduced. While some households have managed to recover from the initial devastating effects of the pandemic and hard lockdown, a large proportion of households remains economically extremely vulnerable, with the danger of longer term consequences such as child stunting that may affect not only children’s current situation but also their future development, human capital and labour market prospects. The results across waves show that reporting hunger in the household and running out of money for food do not mirror each other very closely. Hunger in the last week is reported less frequently than running out of food money in the month before the fieldwork, so a larger share of those running out of money for food indicated that anyone in their household or a child in their household had gone hungry in Wave 5 than in Wave 4.
As we had pointed out in a previous paper (Van der Berg et al., Citation2020, especially ), stunting has consistently been measured at higher levels than child hunger in South Africa. The fact that the expansion of the CSG in the past quarter of a century enabled many households to reduce the extent of hunger suffered by children does not necessarily mean that it enabled them to offer adequate nutritious food. The wider food poverty issue and how it affects the ability of households to obtain adequate food is well placed in perspective by the Bureau for Food and Agricultural Policy (BFAP) (Citation2021:1):
For a four-member household with a dual minimum wage income, benefiting from both child grants and a school feeding program, the share of household income allocated to basic healthy eating would have amounted to ±30% in April 2021 – effectively excluding approximately half of the SA population from affording a basic healthy diet.
3.2. Food insecurity and hunger by race, household size and location
Examining trends of food insecurity and hunger by race group, it is clear that while household food insecurity has declined in each population group, household hunger and child hunger has not significantly declined for any group. Overall, hunger has been most severe in the black African population in every wave of the NIDS-CRAM study.
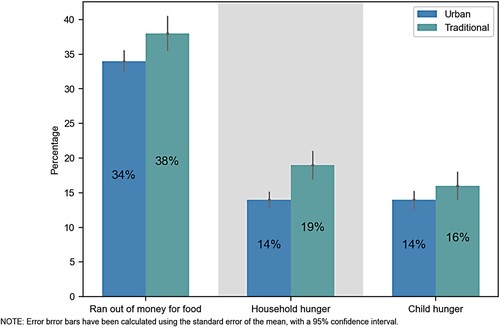
and show food insecurity, household hunger and child hunger by household size and by location respectively. Bigger households, and households in traditional areas, are more likely to run out of money for food and are also more likely to experience hunger. In South Africa, households often form around income sources, including the old age pension (OAP) and CSG. This means that households eligible for such income support measures may simultaneously be larger and more vulnerable to food insecurity and hunger because those without income are often also found in such households. It is surprising, however, that there is not a larger difference in food insecurity between households in urban and traditional areas. One possible mechanism that may account for this could be selective movement of food insecure households or household members between urban and rural areas.
Figure 4. Food insecurity and hunger by household size: NIDS-CRAM Wave 5. Source: Authors’ calculations from NIDS-CRAM Wave 5 data.
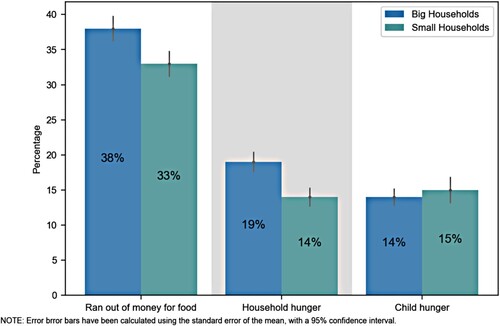
Figure 5. Food insecurity and hunger by location: NIDS-CRAM Wave 5. Source: Authors’ calculations from NIDS-CRAM Wave 5 data.
3.3. Many, particularly women, try to shield children from hunger
Since the first wave of NIDS-CRAM it has been noticeable that there are attempts to shield children from hunger, with adult hunger exceeding child hunger in households with children. The survey also consistently showed that food insecurity affects female respondents more than male respondents (Casale & Shepherd, Citation2021: 27). Given what is known about the gendered effects of poverty and food insecurity, the fact that female respondents report higher levels of food insecurity than male respondents could be explained by other factors. First, female headed households usually contain more adult females and have more dependents, and tend to be poorer. Second, female respondents are likely to exert a lower level of control over the household’s financial resources where the household head is male. That is to say, wage recipients usually have more discretion than economically non-active or unemployed household members over how money is spent, and male earners generally earn more than women.Footnote1
We investigate responses on child hunger by respondents who report that their households have run out of money for food in March and that someone in the household had gone hungry in the seven days before they were interviewed in April and May 2021. A negative response could be interpreted as a proxy for adults shielding children from hunger. In this analysis, running out of money for food can be taken as a measure of poverty; if in addition someone in the household has gone hungry, but not any child, this could be taken to indicate that children are being shielded from hunger. We find evidence of such shielding among 23% of men and 28% of women who were themselves food insecure and reported going hungry at least once, while children in the household did not go hungry that week. Even when controlling for other factors in regression analysis, whether the respondent is a woman remains a large and statistically significant factor associated with more shielding of children from hunger.
The results from previous waves of NIDS-CRAM have indicated that the CSG as well as the Social Relief of Distress (SRD) were fairly well targeted towards households who are more vulnerable to running out of money for food. Specifically, the roll-out of the CSG top-up was found to target the most food insecure households (Bridgman et al., Citation2020). For households that report running out of money for food, households who receive the CSG are most likely to also report child hunger. This indicates that the CSG continues to target the most vulnerable households. Furthermore, the likelihood that CSG-receiving, food insecure households also report child hunger was smallest in Waves 2 and 3 in which the roll-out of government support was the largest. While we cannot infer causality in our analysis, our results are consistent with the temporary top-up to the CSG and the roll-out of the SRD reducing child hunger.
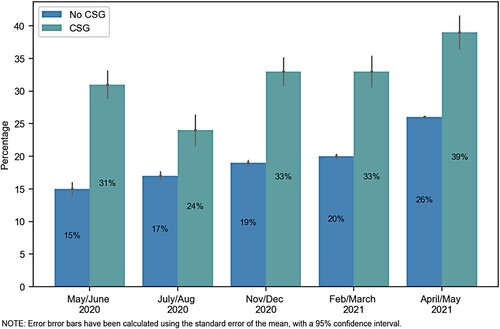
To support this finding, compares the prevalence of child hunger between households who receive the CSG and those who do not among those households who reported running out of money for food (and can be thought of as food insecure households). In May/June 2020, child hunger was far more likely in CSG-receiving food insecure households. While child hunger was not reduced in non-CSG-receiving food insecure households in July/August 2020, there is a marked reduction in child hunger in CSG-receiving households in that period. This corresponds to the period when these household would have received CSG top-ups and potentially also an SRD grant. Within this sample of households, child hunger in CSG-receiving food insecure households has risen steadily between November/December 2020 and April/May 2021.
Figure 6. Child hunger in food insecure households. Source: Authors’ calculations from NIDS-CRAM wave 5 data.
shows the weighted average which includes all successfully interviewed households, and shows that child hunger has increased in these types of households during the sample period. Furthermore, when analysing a balanced panel and applying the wave 5 balanced panel weight, child hunger in food insecure, CSG-receiving households is between 8% and 10% higher in April/May 2021 in comparison to the start of the study period. This implies that child hunger has become more severe in these households. This rise in child hunger has tracked with the reduction of the CSG top-up, as well as rising food prices in the country.
4. Support to households
After the promulgation of the State of Emergency on 27 March 2020, the initial hard lockdown caused, job loss and contributed to many households running out of money to buy food. This led the government to introduce temporary emergency social support measures These included (i) temporary ‘top-ups’ to existing social grants, (ii) establishment of a Covid-19 SRD grant, (iii) introduction of the TERS, and (iv) localised social relief (Republic of South Africa, Citation2020; for discussion in the context of NIDS-CRAM, see Bridgman et al., Citation2020). Considering the difficult economic situation, NGOs, religious institutions, communities and neighbours have all in various ways tried to assist those affected by the economic devastation brought by the pandemic and associated lockdowns. The largest form of support remains the social grant system, which has a wide reach and is well established.
4.1. Social grants
South African has long had one of the most extensive systems of publicly funded social assistance in the form of cash transfers in low or middle- income countries (World Bank, Citation2018). Yet the nature of the economic impact of the pandemic and periodic cycles of lockdown has meant that existing grants could not reach all of those in serious need. Two new grants, the Temporary Employee/Employer Relief Scheme (TERS) and the Social Relief of Distress (SRD) grant were introduced. It also gave rise to the provision of top-ups to some existing grants to provide relief to existing grant recipients severely affected by loss of other income sources, school closures that affected provision of school meals for children. These top-ups were phased out over a period and the new grants were abolished by the end of the first quarter of 2021 due to fiscal constraints, though TERS was re-introduced at the end of July 2021.
The social grant system is now exceedingly large: more than two out of every three households NIDS-CRAM indicate that someone in their household benefited from at least one grant. Official data indicate that in April 2021, a total of 18.4 million beneficiaries received a social grant; the three largest in terms of reach were the CSG with 13.4 million beneficiaries, the OAP with 2.7 million beneficiaries and the disability grant with 997 547 beneficiaries (data supplied by Department of Social Development, 2021).
The SRD payments commenced in May 2020 with 4.4 million beneficiaries, peaking in October 2020 with 6.1 million beneficiaries and ending at 31 April 2021 with 5.9 million beneficiaries (data supplied by Department of Social Development 2021). Although the amount of R350 is small, Köhler & Bhorat (Citation2020) note that the grant brought millions of people into the grants system and was well targeted at the unemployed. Without it, the authors estimate that poverty would have been 5% higher among the poorest households and household income inequality would have been 1.3% to 6.3% higher. They also find that receipt of an SRD increased the likelihood of job search by 25 percentage points. In addition, the TERS was found to provide much needed assistance to vulnerable workers with lower wage workers benefiting more relative to higher earners (Köhler & Hill, Citation2021).
The phasing out of the grant top-ups in October 2020 and below inflation increases of grant values in 2021 to contain the high budget deficit further reduced the strength of the safety net. The CSG’s value was increased from R445 in 2020/2021 to R460 in 2021/22; an increase of only 3.4% (National Treasury, Citation2021). This was not far below the Treasury estimate of 3.9% inflation in the new fiscal year, but considerably below the 5.2% year-on-year inflation actually experienced in May 2021, and even further below estimated urban food inflation of 6.7% for the same period (Statistics South Africa, Citation2021: 6). BFAP (2021:2) identifies two main drivers of higher food inflation, namely high global commodity prices and an increase in domestic manufacturing and distribution costs, neither of which are expected to abate soon. This re-emphasises the extent of vulnerability to food insecurity of large sections of the population.
4.2. Other forms of support
In addition to grants, government has also tried to provide food relief or support for accommodation and supported some wider efforts at providing such relief. Localised relief taking the form of emergency food assistance by government, non-governmental organisations (NGOs), faith-based organisations, the private sector, philanthropic initiatives and informal giving were significant channels of social provision during the early stages of the pandemic, with substantial reach (Wills et al., Citation2020).
To mitigate the impact of the phasing out of the grant top ups, in October 2020 the Minister of Finance announced additional measures to reduce food insecurity and poverty. This included an additional allocation of R6.8 billion to the Department of Social Development (DSD) to extend the SRD grant and an additional R1 billion for food relief to vulnerable households. The value of the food parcels ranged between R700 and R1 400 per month depending on the size of the household and were given once or more times depending on the availability of funds. Data supplied by the DSD indicate that 2 609 042 food parcels were distributed between April 2020 and April 2021 and these were estimated to reach 11.6 million people (assuming five people per householdFootnote2). The DSD further reports that an additional 384 912 food parcels were distributed to 1.9 million people by external partners such as the Solidarity Fund through non-profit organisations (NPOs) operating in provinces, Corporate Social Responsibility partners, Faith-Based Organisations, SASSA’s food relief programme and the Department of Environmental Affairs. The Solidarity Fund also disbursed R100 million for once-off food vouchers (R700) to 135 000 beneficiaries and a further R100 million for farming input vouchers to 47 000 subsistence farmers (Personal Communication with Wendy Tlou from the Solidarity Fund, 7 April 2021).
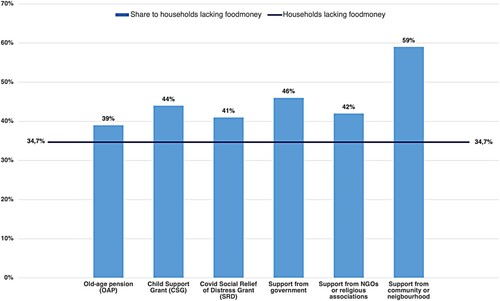
Despite efforts by government, NGOs and Faith-Based Organisations, shows that only a small share of respondents in NIDS-CRAM indicated that they benefited from such efforts and that this share declined after Wave 1. shows a proxy for the targeting of the grants and support that respondents received, expressing the share of such benefits that go to respondents that ran out of money for food.Footnote3 It is notable that with one exception, only between 39% and 44% of all grants and other forms of support shown went to the 35% of respondents whose households had run out of money for food in March 2020. This is surprising, as one would have expected assistance to go overwhelmingly to such households. The exception is support from the community and neighbours – this appears quite well targeted at those most in need, with 64% of those receiving such support also indicating that they had run out of money for food. It is particularly surprising that only 43% of recipients of the CSG are in households that have run out of money for food.
Figure 7. Respondents indicating that they received support for food or accommodation from government, NGOs/religious associations or neighbours/the community, NIDS-CRAM Wave 1, 3 and 5. Source: Authors’ calculations from NIDS-CRAM Waves 1, 3 and 5 data.
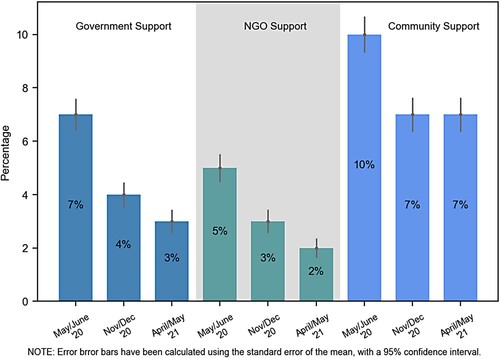
Figure 8. Targeting of grants and support: The share of grants or support going to households that ran out of money for food in Wave 5. Source: Authors’ calculations from NIDS-CRAM Wave 5 data.
5. Conclusion: policy to protect households from hunger
Earlier research papers based on Wave 1 suggested that the social grant system offered important protection from the worst economic effects of the lockdown and pandemic. The top-ups to the CSG and the OAP improved the financial situation of households with no other income sources. The results from Waves 3, 4 and 5, however, point to the fact that hunger and food insecurity in South Africa have settled at a permanently higher equilibrium level in comparison to pre-2020 levels. Whereas TERS and the SRD grant had not been fully operational during Wave 1, Wave 2 results showed that TERS lifted many out of food insecurity. The CSG and SRD have been valuable, as have been the grant top-ups. Although the smaller grants, even with top-ups, were inadequate to keep households above the food poverty line, they do ameliorate poverty.
Removal of grant top-ups in 2020, and of the COVID SRD grant of R350, is likely to have contributed to rising hunger. Given that the R350 SRD grant expired at the end of April 2021, approximately 70% of the Wave 5 data was collected while these grants were still being paid (i.e. in April). Some respondents in May still indicated that they were receiving it. The reduced availability of money from grants and the tight economic situation are reasons why levels of hunger are likely to remain stubbornly high, or may even have increased, and stricter subsequent lockdown regulations may again have further reduce employment and income from informal economic activities. Previous NIDS-CRAM research (Jain et al., Citation2020) showed that for 10% of South African households, the only government grant received by the household was the R350 SRD grant. With the removal of the SRD grant, households largely dependent on this grant fell out of the social protection system, with consequences for household hunger and child hunger. Strong public advocacy on this matter led to the (temporary) re-introduction of the SRC in July 2021.
Policy makers need to place hunger and food security at the centre of social development strategies. Failure to do so will deepen food poverty and inequality gaps and will further compromise the country’s human development situation and economic recovery. The findings provide some pointers for policy makers to consider: First, poverty relief measures should continue to be a priority in fiscal policy decisions despite budgetary constraints. Second, ongoing monitoring of household food security and household and child hunger are needed as these are important proxy indicators to track progress and assess the effectiveness of government and non-governmental responses to the crisis.
Third, the adjustment to the grant values following the phasing out of the top-ups coupled with the ending of the SRD at the end of April 2021, and the rising cost of living, are likely to have impacted negatively on household food security and household and child hunger. Additional measures are needed to strengthen the safety net through the mobilisation of government resources, but non-governmental sources including corporate social investment and private philanthropy should also be bolstered. There is much to learn from the targeting of informal relief by community and neighbourhood systems of support, which have proven to be consistently effective.
Fourth, households most vulnerable to food insecurity and hunger, such as larger households with more than four people and households in traditional and rural areas, need to be prioritised with supplementary interventions tailored to their needs. Closer monitoring of food insecurity on households with women is also indicated. Fifth, special measures are needed to address child hunger and stunting, especially among black African children and increasingly also among coloured children who are more likely to experience severe hunger. This is largely due to the low monetary level of the CSG money for food. While school meals are well targeted, uptake levels are not what they were prior to the pandemic due to rotational timetabling and the late start to the school year. This points to the importance of getting school feeding back to full scale, and of children returning to school with no rotational schedule. This was complicated by renewed restrictions due to further waves of the Covid-19 pandemic, which could lead to economic setbacks, more school closures which in turn, could deepen food insecurity and hunger. These are important factors that need to be considered by policy makers and programme implementers in the current socio-economic context.
Finally, social protection strategies are first line interventions to mitigate food poverty and hunger in a health emergency such as the COVID-19 pandemic. Protecting livelihoods could prevent people from falling deeper into poverty and can have an important stabilising effect on families and communities. Temporary relief measures are social investments in human capital and can have other multiplier effects such as the increased job search behaviours among SRD beneficiaries that could aid labour market recovery (Köhler & Bhorat 2021), prevent child stunting and improve psychosocial wellbeing. Experimentation and innovation during this period could lay the basis for new and more transformative social policies.
Acknowledgements
Evidence This research was completed as part of the NIDS-CRAM initiative: Servaas van der Berg, Leila Patel and Grace Bridgman. July 2021. Food insecurity in South Africa: Evidence from NIDS-CRAM Wave 5. NIDS-CRAM.
Disclosure statement
No potential conflict of interest was reported by the author(s).
Notes
1 Reporting differences cannot be completely ignored. Subjective measure such as these are likely to be answered relative to a reference situation that may differ across individuals. For instance, despite the black population generally being poorer than the coloured population, similar proportions of black and coloured respondents report running out of money for food.
2 The data supplied by DSD was compiled for the 2021 annual report. The monthly statistics are supplied by the provinces to the national Department of Social Development it is verified by the Monitoring and Evaluation units in the provincial and national Departments and is being audited by the Auditor General.
3 There is of course a problem in this measure of targeting, in that there may be some reverse causality (endogeneity), where some households may not lack money for food because of the grants or other support. This reverse causality should not be a large factor for the benefits considered here, as their magnitude is generally too small to pull recipient households out of poverty, unless they have additional incomes.
References
- Aguayo, VM & Menon, P, 2016. Stop stunting: Improving child feeding, women’s nutrition and household sanitation in South Asia. Maternal and Child Nutrition 12, 3–11. doi: 10.1111/mcn.12283
- Aguero, JM, Carter, MR & Woolard, I, 2006. The Impact of Unconditional Cash Transfer on Nutrition: The South African Child Support Grant. (06/08). Cape Town.
- Ampaabeng, SK & Tan, CM, 2013. The long-term cognitive consequences of early childhood malnutrition: The case of famine in Ghana. Journal of Health Economics 32(6), 1013–1027. doi:10.1016/j.jhealeco.2013.08.001
- Bailey, MJB, Hoynes, HW, Rossin-Slater, M & Walker, R, 2020. Is the Social Safety Net a Long- Term Investment? Large-Scale Evidence from the Food Stamps Program. NBER Working Paper Series Working Paper 26942.
- Bamford, L, Mckerrow, NH, Barron, P & Aung, Y, 2018. Child mortality in South Africa: Fewer deaths, but better data are needed. South African Medical Journal 108(March), 25–32. doi: 10.7196/SAMJ.2017.v108i3b.12779
- Behrman, JR & Hoddinott, J, 2005. Programme evaluation with unobserved heterogeneity and selective implementation: The Mexican PROGRESA impact on child nutrition. Oxford Bulletin of Economics & Statistics 67(4), 547–569. doi:10.1111/j.1468-0084.2005.00131.x
- Bridgman, G, 2020. Orphans and stunted growth: Investigating the potential of spatial network effects in servicedelivery for reducing stunting in orphans. (2020/154). Helsinki.
- Bridgman, G, Van der Berg, S & Patel, L, 2020. Hunger in South Africa during 2020: Results from Wave 2 of NIDS-CRAM. NIDS-CRAM Wave 2 Working Paper 3.
- Bureau for Food and Agricultural Policy (BFAP), 2021. Food inflation brief – April 2021. Pretoria. https://www.bfap.co.za/wp-content/uploads/2021/05/Food-Inflation-brief_April-2021.pdf.
- Casale, D & Shepherd, D, 2021. The gendered effects of the Covid-19 crisis and ongoing lockdown in South Africa: Evidence from NIDS-CRAM Waves 1-3. NIDS-CRAM Wave 4 Working Paper. Department of Social Development. 2021. Personal Correspondence.
- Fink, G, Günther, I & Hill, K, 2011. The effect of water and sanitation on child health: Evidence from the demographic and health surveys 1986–2007. International Journal of Epidemiology 40(5), 1196–1204. doi: 10.1093/ije/dyr102
- General Household Survey (GHS), 2018. pooled [dataset]. Statistics South Africa [distributor]. Global Nutrition Report, 2019.
- Hoddinott, J, Behrman, JR, Maluccio, JA, Melgar, P, Quisumbing, AR, Zea, MR-, Stein, AD, Yount, KM & Martorell, R, 2013. Adult consequences of growth failure in early childhood. The American Journal of Clinical Nutrition 98(5), 1170–1178. doi:10.3945/ajcn.113.064584
- Jain, R, Budlender, J, Zizzamia, R & Bassier, I, 2020. The labour market and poverty impacts of COVID-19 in South Africa. NIDS-CRAM Wave 2 Working Paper 8.
- Köhler, T & Bhorat, H, 2020. Social assistance during South Africa’s national lockdown: Examining the COVID-19 grant, changes to the Child Support Grant, and post-October policy options. NIDSCRAM Wave 2 Working Paper 9.
- Köhler, T & Hill, R, 2021. The distribution and dynamics of South Africa’s TERS policy: Results from NIDS-CRAM Waves 1 to 5. NIDS-CRAM Wave 5 Working Paper 7.
- National Income Dynamics Study-Coronavirus Rapid Mobile Survey (NIDS-CRAM), 2021. Wave 5 [dataset]. Version: Beta1. Cape Town: Allan Gray Orbis Foundation [funding agency]. Cape Town: Southern Africa Labour and Development Research Unit [implementer], 2021. Cape Town: DataFirst [distributor], 2018.
- National Treasury, 2021. Budget Review 2021. Pretoria.
- Republic of South Africa, 2020. Government Gazette No 11107, Vol 659, No. 53300, 9 May 2020. Pretoria: Government Printers. www.gpwonline.co.za.
- Richter, LM & Desmond, C, 2008. Targeting AIDS orphans and child-headed households? A perspective from national surveys in South Africa, 1995–2005. AIDS Care – Psychological and Socio-Medical Aspects of AIDS/HIV 20(9), 1019–1028.
- Saloojee, H, De Maayer, T, Garenne, ML & Kahn, K, 2007. What’s new? Investigating risk factors for severe childhood malnutrition in a high HIV prevalence South African setting. Scandinavian Journal of Public Health 35(SUPPL. 69), 96–106. doi: 10.1080/14034950701356435
- Statistics South Africa, 2021. Consumer Price Index. Statistical Release P0141. May 2021.
- UNICEF, 2020. South African Nutrition Brief. https://www.unicef.org/southafrica/sites/unicef.org.southafrica/files/2020-07/ZAF-Nutrition-brief-2020.pdf.
- Van der Berg, S, Patel, L & Bridgman, G, 2020. Hunger in South Africa during 2020: Results from Wave 3 of NIDS-CRAM.
- Van der Berg, S, Zuze, L & Bridgman, G, 2020. Coronavirus, Lockdown and Children: Some impacts of the current crisis in child welfare using data from NIDS-CRAM Wave 1. NIDS-CRAM Working Paper 11.
- Wills, G, Patel, L, Van der Berg, S & Mpeta, B, 2020. Household resource flows and food poverty during South Africa’s lockdown: Short-term policy implications for three channels of social protection. NIDS-CRAM Working Paper 12.
- Wittenberg, M & Branson, N, 2021. Creating Household Weights for NIDS-CRAM. (WAVE 5: technical report D). Cape Town.
- World Bank, 2018. South Africa poverty and inequality assessment 2018. Overcoming Poverty and Inequality in South Africa: Drivers, constraints and opportunities. World Bank, Washington, DC.