
ABSTRACT
This study analysed the 2020 first quarter to 2022 second quarter waves of the Quarterly Labour Force Survey (QLFS) data and all five waves (2020–21) of the National Income Dynamics Study – Coronavirus Rapid Mobile Survey (NIDS-CRAM) data to examine the South African labour market outcomes during the COVID-19 lockdown period. The QLFS data showed that low-educated Africans aged 25–44 years and those involved in low skilled occupation categories were most vulnerable to job loss. The NIDS-CRAM data indicated that for those who still worked in February 2020, 51% worked all five waves, 14% worked in four waves and 9% worked in three waves. Only 0.5% and 1.8% turned out to be unemployed and inactive in all waves, respectively. For the February 2020 employed who lost their jobs and became unemployed in April 2020 (wave 1), 60% of them worked again but 22% remained unemployed in March 2021 (wave 5).
1. Introduction
The South African labour market has been characterised by persistently high levels and rates of unemployment since the advent of democracy, especially amongst the youth population. Already suffering from a stagnant annualised real gross domestic product growth rate of only 1.7% during the 2010s (it was even lower at 0.9% in 2015–19) (South African Reserve Bank, Citation2023), the economy and unemployment rate are negatively affected by the coronavirus (COVID-19) pandemic. According to Statistics South Africa (StatsSA), the Quarterly Labour Force Survey released in early 2023 found that the national unemployment rate increased by over five percentage points from 30.1% in the first quarter of 2020 to 35.2% in the last quarter of 2021, before gradually declining to 32.9% in the first quarter of 2023 (StatsSA, Citation2023). Young jobseekers aged 15–34 years accounted for nearly 60% and 50% of all unemployed and the youth unemployed, respectively.
The pandemic further cripples the ability of the economy to create employment opportunities at enough pace to absorb the new and returning labour force participants, not to say abrupt job losses and under-employment took place during the COVID-19 crisis period. The implementation of various lockdown levels and employment regulations (e.g. vaccinated staff within the office space) further constrained the labour market by limiting mobility and business activities. At the time of writing, nearly 40 million vaccinations in total have taken place with approximately half of the adult population being partially or fully vaccinated. It is no longer mandatory to wear face masks in public and there are no longer any lockdown levels or restrictions imposed. Nonetheless, the damages caused by the past lockdowns on the labour market remain serious.
While the lockdown aimed to reduce the spread of the virus, restrictions on mobility have a direct and often negative impact on employment. These restrictions have also negatively affected potential employment prospects of destitute jobseekers who are already facing tough labour market conditions. Also, the restrictions were more likely to seriously negatively impact the operations of small franchises and micro businesses. The negative impact on small business operations (in particular youth entrepreneurial activities) has dire consequences in the labour market, because permanent retrenchments or temporary lay-off of existing staff have taken place.
The study helps fill the existing research gap in Labour Economics literature, to conduct a comprehensive investigation on labour market outcomes of the working-age population during the 2020–22 COVID-19 crisis period. The specific research objectives are as follows: (1) Analyse the 2020–22 Quarterly Labour Force Survey (QLFS) data to investigate what happened to the country’s labour supply and demand between the first quarter of 2020 (just before the start of lockdown) and second quarter of 2022 (when all lockdown restrictions were lifted); (2) Analyse the 2020–21 National Income Dynamics Study – Coronavirus Rapid Mobile Survey (NIDS-CRAM) panel data to investigate what happened to the 2020–21 labour market status of those who were still employed in February 2020.
2. Literature review
2.1. Theoretical framework
Before the pandemic started and subsequent lockdown restrictions were imposed, structural unemployment has been the most serious type of unemployment in South Africa, as skills mismatch is an ongoing problem. However, it is apparent demand-deficient or cyclical unemployment took over as the most dominant type of unemployment in 2020–22, when there was a decrease in aggregate business activities and overall decline in business output, and subsequently a reduction in aggregate labour demand (Ehrenberg & Smith, Citation2012). The consequences of lockdown and effects of the COVID-19 pandemic are reflected in the initial shocks to South Africa’s real GDP which showed a quarter-on-quarter annualised 51.0% decline in the second quarter of 2020 (StatsSA, Citation2020). Overall, annual real GDP decreased by 6.4% in 2020 (it increased by 4.9% between 2020 and 2021, but the 2021 real GDP level was only close to the 2017 level), while employment declined by almost two million between the first quarter of 2020 and last quarter of 2021.
Low-educated and skilled people are more the first ones to bear the brunt of unemployment, whereas high skilled and educated workers could somehow weather the impact of the pandemic. Even after the pandemic and lockdown are over, further structural changes would still take place, as demand for unskilled labour continues to decrease whereas demand for skilled labour increases further (Department of Communications, Citation2013; Dumasi, Citation2020). For example, there is an increase in demand for skilled workers with information technology skills who can design and launch apps such as Zoom and online shopping app, and improve the capabilities of existing applications such as Microsoft Teams, to facilitate virtual meetings. There are also an expected increase in demand for skilled labour in finance (e.g. online banking services) and even somewhat for some semi-skilled jobs (e.g. online shopping delivery drivers).
Human capital conceptualises workers as it embodies a set of skills that can be ‘rented out’ to employers (Coulson, Citation2009). More specifically, it consists of knowledge and skills which come from education, training and work experience, and help improve productivity and efficiency (Dias & Posel, Citation2007). A person decides to pursue further education because the incremental earnings during his/her time at the labour market exceeds both the direct expenses (e.g. study fees, textbooks) and foregone earnings, in net present value terms (Ehrenberg & Smith, Citation2012).
However, this standardised human capital theory should be revisited when it comes to the COVID-19 pandemic lockdown period, because there is no longer guarantee that workers enjoy a continuous upward earnings stream, especially amongst the low-educated and skilled workers. For the highly educated and skilled ones, they may survive the effects of the pandemic, as they are of greater demand during the pandemic.
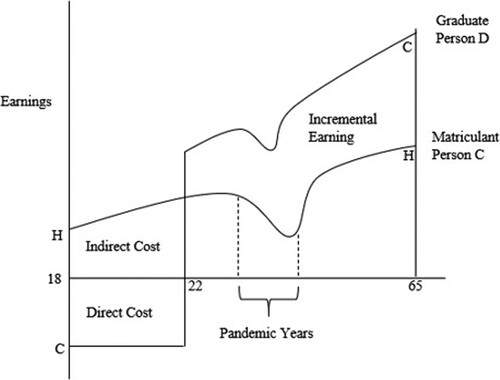
shows a modified human capital theory framework which considers the effects of the pandemic. Both persons C (with Matric) and D (with a Bachelor Degree) experienced temporary declines in earnings during the pandemic, for example, their employment changed from full-time to part-time for a while. The earnings curve of Person C declined considerably before gradually increasing to pre-COVID levels. Person D initially experienced a subtle decrease in his earnings but returned to pre-COVID levels relatively quicker. Moreover, the difference of incremental earnings between persons D and C increases further while the effects of the pandemic are still being felt even after the pandemic period is over. The figure can even include a person E who somehow benefitted right at the beginning of the pandemic, and never suffered an abrupt decline in his earnings. This person may always experience an upwards-sloping and steep earnings stream.
Figure 1. Modified human capital theory framework considering the COVID-19 pandemic. Source: Adapted from Yu & Roos (Citation2018).
2.2. South African labour market interventions
To curb the effects of the pandemic, governments worldwide expanded their social protection systems to provide relief to vulnerable individuals and workers. Similarly, South Africa expanded their non-contributory social assistance system on both the intensive and extensive margins from May to October 2020 (Kohler & Bhorat, Citation2020). On 15 March 2020, a National State of Disaster was declared, and the government introduced a risk-adjusted approach to a national lockdown which included five levels; physical restrictions were imposed to limit movement of people to reduce the spread of the virus.
The highest national lockdown level 5 was implemented for five weeks from 27 March 2020 to 1 May 2020, when almost all activities were suspended except for the production and sale of essential goods and services which were predominantly found within food, medical and security sectors. All schools, early childhood development centres and childcare facilities were closed, while domestic workers were prohibited from working. There was little difference in the level of business and economic activities allowed under lockdown levels 4 and 5.
Lockdown level 3 was implemented 1 June 2020–17 August 2020; there were fewer restrictions but more mobility was allowed at this level. Lockdown level 1 took place in the last few months of 2020, before the lockdown levels varied at numerous times in 2021, as the country experienced the second and third COVID-19 waves and vaccination campaign commenced early in the year. Towards the end of November 2021, the Omicron variant was detected; South Africa, however, remained on adjusted alert level 1. It was only until May 2022 that the remaining lockdown restrictions were alleviated.
The government allocated an additional R40 billion to social assistance in June 2020. This expansion of social assistance took place by means of an increase in the amount of existing non-conditional cash transfers and a special COVID-19 Social Relief of Distress (SRD) grant. Moreover, the President announced that the existing social grants would be increased overall and SRD grant would cater for those people who were unemployed, did not receive any income, unemployment insurance fund (UIF) nor any other social grant. The government also implemented other initiatives to safeguard workers and soften the effects of the pandemic. For example, the government increased the child support grant to R300 per child in May 2020, by R500 per caregiver for five months, while the old-age pension and disability grants were increased by R250 for six months (Skinner et al., Citation2021).
The South African Economic Reconstruction and Recovery Plan was also launched in October 2020 (South African Government, Citation2022). It consisted of three phases: ‘Engage and Preserve’ which aimed at saving lives and reducing the spread of the pandemic; ‘Recovery and Reform’ which entailed interventions to restore the economy while minimising health risks; ‘Reconstruct and Transform’ which aimed to build a robust and strong economy. The plan was underpinned by the necessity to shield vulnerable workers, households and firms; foster confidence; deepen industrialisation through localisation; pursue environmental sustainability while continuing to provide aid to lessen the burden of the COVID-19 pandemic. Overall, the plan is geared towards reducing unemployment, alleviating poverty and inequality, and revert economic activities back to the pre-pandemic levels.
2.3. Review of past empirical studies
Since the advent of democracy, there are studies that comprehensively examined the South African labour market activities during a particular period, most notably Oosthuizen (Citation2006) (who investigated what happened in 1995–2004), Festus et al. (Citation2016) (focusing on 1995–2013) as well as Yu & Adams (Citation2022) (they examined the 2010–19 ‘lost decade’). The long-term labour market trends derived from these studies were highly similar; the extent of job creation was not rapid enough to absorb the net entrants to the labour force. Moreover, female Africans, low-educated individuals and those from the youth cohorts remained most vulnerable to unemployment. Since these studies were not relevant to the lockdown period. In the following sub-sections, local and international studies relating to the lockdown period are reviewed.
2.3.1. South African studies
Kohler et al. (Citation2021) compared the 2020 first and second quarter QLFS data, and reported a 14% share or 2.2 million decrease in employment. The authors also noted the sharp 40% drop in discouraged workseekers between the two quarters. The reduction in employment was unevenly distributed; youth represented 50.6% share of employment loss (or 1.1 million in absolute terms); blacks accounted for 78% share of employment loss. Employment loss was also mainly concentrated amongst persons with low levels of education, urban residents, those working in the formal private sector and non-unionised workers.
Ranchhod & Daniels (Citation2020) found that there was an unparalleled drop in employment between February and April 2020 upon analysing the first wave of NIDS-CRAM data. Women, Blacks, youth and low-educated were unduly affected by the pandemic. Also, one third of the survey participants who were employed in February 2020 had either lost their job, were no longer employed, or did not receive any income in April 2020. In fact, only less than half of the adult labour force were employed in April.
Jain et al. (Citation2020) used the NIDS-CRAM wave 2 data to examine economic and labour market recovery from April to June 2020. During this period, there was some recovery in employment whereby about 50% of jobs lost between February and April were recovered by June (note that some lockdown restrictions were lifted in May). Most of this recovery was accounted for by the significant decrease in adults who were previously classified as ‘temporarily laid-off’ or ‘on paid leave’ in April. Moreover, 79% of workers who were actively employed in April remained so in June, whilst 15% of them were no longer employed in June.
Espi-Sanchis et al. (Citation2022) analysed all five waves of NIDS-CRAM data, and found that the 2020 March lockdown resulted in colossal job losses between February and April 2020, with the brunt of the impact being borne primarily by the youth, women, Blacks and low-income workers. In addition, the results indicated that by March 2021, 23% of those who were still employed in February 2020 had lost work whereas 30% of non-employed successfully found work. Lastly, the study found that youth (18–24 years) experienced the greatest increase in employment-to-population ratio whereas older adults (55–64 years) endured the greatest decline in employment.
Daniels et al. (Citation2022) compared the labour market estimates between QLFS and NIDS-CRAM data. It was found that the two surveys did not generate comparable estimates during the same period; in particular, employment estimates were relatively higher in NIDS-CRAM during the February 2020 to March 2021 period. The empirical findings also showed that while the QLFS narrow unemployment rate increased from 24% in June 2020 to 33% in March 2021, the corresponding NIDS-CRAM rate rather declined marginally from 25.5% to 24.5% during the same period. The authors argued that the two surveys used different reference periods and job attachment information. In particular, NIDS-CRAM distinguished labour force outcomes in a specific month that can be strongly correlated with a specific lockdown level. On the other hand, the QLFS ascertained labour outcomes in the week preceding the respondent’s interview, with respondent interviews spreading over each month of the quarter. Hence, the two data series are not entirely comparable but rather complementary.
2.3.2. International studies
According to Danquah et al. (Citation2020), the harsh lockdown restrictions along with a global decrease in commodity prices and foreign investment had a devastating impact on the income of workers in Sub-Saharan Africa. Survey data collected in Senegal, Mali and Burkino Faso suggested that on average, by the end of April 2020, one out of four workers found themselves unemployed and 50% of workers suffered income losses. The findings also indicated that informal workers were more at risk (Blade et al., Citation2020; Danquah et al., Citation2020). This gave rise to pressing concerns as an estimated 89.2% of total employment in Sub-Saharan Africa takes place in the informal sector.
It is argued that the COVID-19-driven economic lockdown had a more severe and long-lasting negative impact on the economies of developing countries, due to the governments’ struggles to cushion the negative impact by executing contingency measures to boost economic recovery. In fact, Hossain and Hossain (Citation2021) found that employment dropped between 5% and 49% in developing countries during the pandemic. The authors further examined what happened in Nigeria by analysing both the 2018–19 Nigerian Living Standard Survey and 2021–22 COVID-19 National Longitudinal Phone Survey data. The study found that female employment dropped by eight percentage points more than males, and women were unemployed for longer periods. Lastly, since June 2020, employment rebounded in all industries except the primary sector.
Schotte et al. (Citation2021) investigated changes in labour market outcomes since the start of the pandemic in Ghana. Lockdown rules were imposed only in two of its largest cities (Greater Accra and Greater Kumasi Metropolitan Areas). The authors found that severe lockdown restrictions brought the country’s major metropolitan centres to a standstill, thereby inducing a significant decline in employment in the affected areas. Workers in the affected areas suffered a 63.4% risk of being unemployed in April 2020 compared to only 28.3% in the non-affected areas. This great 35.1-percentage-point difference suggests the harsh and immediate effects of the lockdown restrictions. Nonetheless, the authors found evidence of a sturdy recovery in employment, even though employment probability remained 11.6 percentage points lower than the corresponding February 2020 rate, whereas labour earnings and work hours remained below pre-COVID levels. Lastly, the study found that women and informal self-employed workers were most negatively affected.
The 2021 study by Crossley, Fisher and Low focused on the United Kingdom (UK). The authors used data from the first two waves of the Understanding Society COVID-19 Study collected in April and May 2020 to study the effects of the first wave of the pandemic and how households dealt with these effects. The UK government implemented various schemes to mitigate the effects of the pandemic; however, these initiatives only benefited some workers. The lockdown rules were implemented from 23 March 2020 and the economy resultantly contracted substantially in March and April. Thereafter, the economy started growing again but by the end of May, GDP was still 24% lower than the pre-COVID level. In addition, Blacks, Asians, youth and women were most affected as they experienced relatively greater declines in work hours and earnings. Nonetheless, by the end of May 2020, employment, work hours and earnings had partially rebounded, primarily due to the effectiveness of government initiatives to preserve employment.
Adams-Prassl et al. (Citation2020) examined what happened in the United States of America (USA), the UK and Germany. It was found that in early April 2020, 18%, 15% and 5% of workers lost their jobs in each country, respectively. On the other hand, the workers’ subjectively perceived likelihood of losing their jobs within the next few months was 37% in the USA, 32% in the UK and 25% in Germany. Lastly, female workers and those without tertiary qualifications were significantly more likely to lose their jobs while younger employees were more likely to suffer decline in their earnings, across all three countries.
3. Methods and data
Two datasets are analysed in this study, namely QLFS and NIDS-CRAM. The primary aim of QLFS, which was introduced in 2008 to replace the biannual Labour Force Survey, is to capture information about labour market status of people, work activities of the employed as well as job-seeking activities (if any) of unemployed (Yu, Citation2009). On the other hand, NIDS-CRAM collects data relating to the effects of COVID-19 on employment and various other socio-economic outcomes. The same individuals were contacted every few months and asked a wide range of questions regarding their labour market status, household wellbeing, receipt of social grants, income and their knowledge about the pandemic. At the time of writing, five waves of NIDS-CRAM took place (April, June and October 2020; January and March 2021).
To examine what happened to the labour market in 2020–22, six waves of QLFS data from 2020 first quarter (prior to the start of lockdown) to 2022 second quarter (when the remaining lockdown restrictions were lifted in May) are analysed to examine what happened to the labour market trends during the two years and three months’ lockdown period. Descriptive statistics are derived to determine the personal (e.g. race, gender, education) characteristics of the labour force, employed and unemployed, as well as work characteristics of employed.
One drawback of the QLFS data is that it is impossible to track the changes, if any, of the labour market status and activities of individuals over time as QLFS is not panel data. To complement the QLFS findings, this study also takes all five available waves of the NIDS-CRAM panel data into consideration. Unless stated otherwise, those who reported in wave 1 that they were still employed in February 2020 (just before lockdown happened) are included, before we investigate the labour market transitions (if any) of these people in all five waves.
Lastly, this study does not intend to compare the labour market estimates of QLFS and NIDS-CRAM, as it was already conducted before (e.g. the Citation2022 Daniels et al. study as reviewed earlier). This study rather aims to find out who were hardest hit by the economic downturn and lockdown policies that took place due to the emergence of COVID-19, with specific focus on how the working-age population who were still employed in February 2020 fared in the labour market in the subsequent months of the year as well as early 2021 with the aid of NIDS-CRAM data. Thus, this study does not attempt to separately identify the impact of any one policy.
4. Empirical findings
4.1. Findings using the QLFS Data
shows that the labour force participation rate (LFPR) increased from 47.7% at the time of the 1995 October Household Survey (OHS) to 59.9% in the first quarter of 2020, whereas unemployment rate nearly doubled from 17.6% to 30.1% during the same period. From this point onwards, we would focus on what happened in 2020–22.
Figure 2. Labour force participation rates and unemployment rates, 1995–2022. Source: Authors’ own calculations using the 1995–1999 OHS, 2000–07 LFS September and 2008–22 QLFS data.
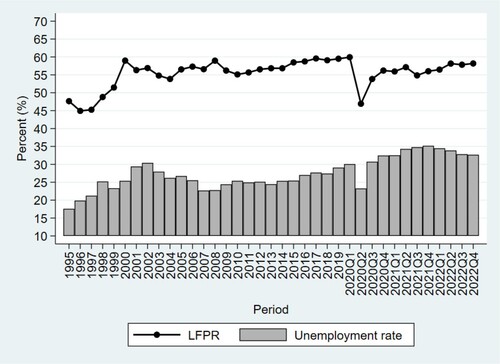
The LFPR experienced a swift decline from 59.9% in the first quarter of 2020 to 46.9% in the second quarter of 2020. In fact, the latter quarter marked the first time since 1999 that the LFPR was lower than 50%. Nonetheless, this rate gradually increased and even returned to the pre-COVID level, reaching 58.2% in both the second and fourth quarters of 2022. It may be argued that the initial punitive impact of the pandemic on the LFPR was attributed to the government’s decision to impose restrictions on businesses and movement of people, thereby limiting people’s labour force participation. As the government eased lockdown regulations, LFPR was able to return to pre-COVID levels as the working-age population actively sought work again.
Unemployment rate experienced an abrupt seven-percentage-point decline between the first two quarters of 2020, dropping from 30.1% to 23.3%. This decline was attributed to the harsh lockdown regulations which only allowed essential workers to work, effectively having a larger effect on the labour force than the number of unemployed. Unemployment rate thereafter increased to 30.7% in the third quarter of the year due to the slight ease of lockdown restrictions. This rate increased further to 35.2% in the last quarter of 2021, before graduating declining to 33.9% in the second quarter of 2022 and 32.7% in the last quarter of the same year.
shows that the number of employed increased from 9.5 million in 1995 to 16.4 million in the first quarter of 2020. However, there was an abrupt 2.3 million decline in employment number in the second quarter of 2020. Employment hovered in the 14.3–15.1 million range until the first quarter of 2022, before it increased to 15.6 million in the second quarter and 16.0 million in the last quarter of the year. The latter estimate suggests that employment has yet to return to the pre-COVID level (16.4 million). In fact, the 2022 fourth quarter employment number was only at a similar level as in 2016 fourth quarter (around 16 million).
Figure 3. Number of employed and unemployed (millions), 1995–2022. Source: Authors’ own calculations using the 1995–1999 OHS, 2000–07 LFS September and 2008–2022 QLFS data.
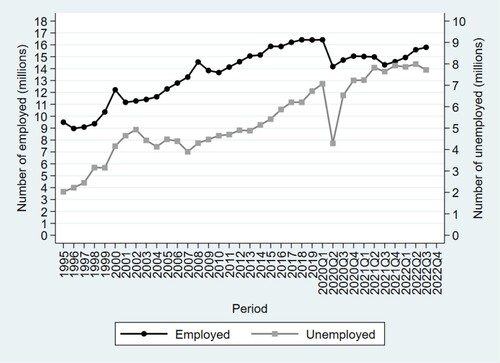
also shows the number of unemployed increased from 3.9 million in 1995 to 7.1 million in the first quarter of 2020. This number dropped to 4.3 million in the second quarter of 2020, before increasing to 6.5 million in the third quarter (as lockdown restrictions eased, people returned to the labour market to seek work, but a lot of them failed to find employment). This number showed an alarming upward trend and reached an all-time high of 8.0 million in the second quarter of 2022, before slightly dropping to 7.8 million in the last quarter. These findings concur with the argument of Allen (Citation2023) that the huge costs of lockdown (in particular lost output and employment disruptions) far outweighed the benefits in terms of preventing the healthcare system from being overrun.Footnote1
Whilst not the labour market status category under thorough investigation in this study, in the Appendix shows the demographic composition of the inactive working-age population between the first quarter of 2020 and second quarter of 2022. The majority of inactive were female Africans aged 15–24 years without Matric. Moreover, the number of inactive increased by over 600 000; in relative terms, African Gauteng residents aged 55–64 years with only Grades 8–11 represented the majority of the increase.
shows the demographic composition of the labour force. The labour force participants remained predominantly African men aged 25–54 years with Grade 8–12 qualification. Focusing on the results shown in the last two columns of the table, it can be seen that the labour force number increased marginally by 102 000 during the period, that is, the labour force number eventually returned to the pre-lockdown level. In fact, upon analysing the relative changes, it can be seen that males, Africans, 45–54-year olds, Limpopo residents as well as individuals with Matric (Grade 12) accounted for the bulk of the increase of labour force.
Table 1. Absolute and relative changes in labour force by personal characteristics.
Moving on to , the results imply that the profile of employed during the period under study remained the same. In fact, the characteristics of employed were almost identical to those of labour force as discussed above. In addition, in absolute terms, the number of employed dropped by over 0.8 million during the period under study, and the majority of such decrease was accounted for by males, Africans, people aged 25–44 years, Gauteng residents as well as those without Matric. These findings are in line with the local and international studies reviewed earlier with regards to the characteristics of people who suffered job losses during lockdown, such as Kohler et al. (Citation2021), Ranchhod & Daniels (Citation2020), Hossain & Hossain (Citation2021) and Crossley et al. (Citation2021). The latter finding is important as it suggests the low-educated ones were most vulnerable to retrenchment or closing of their own businesses under the lockdown restrictions and economic downswing. In fact, employment of degree holders increased by 187 000 during the period under investigation, despite the fact degree holders ‘only’ accounted for 13% of total employed in 2022.
Table 2. Absolute and relative changes in employed by personal characteristics.
shows the broad occupation and industry categories of the employed. The majority of employed still worked in the same occupation (elementary occupations, service and sales workers, craft and related trades, clerks) and industry (community, social and personal services, trade, finance, manufacturing) categories. However, craft and related trades occupation experienced the greatest decline in employment between 2020 first quarter and 2022 second quarter (267 000) whereas professionals was the rare occupation category that enjoyed a big gain in employment (222 000) during the same period. Furthermore, manufacturing and private households were the two industry categories suffering the greatest decline of employment (about 0.2 million each), followed by the construction and trade industry categories (approximately 0.16 million each). Nonetheless, in 2022, the trade industry still represented 20% of total employment.
Table 3. Absolute and relative changes in employment by occupation and industry.
presents the profile of unemployed, and the results suggest that the characteristics of unemployed remained the same pre- and post-COVID-19 lockdown, as they were predominantly Africans (90% share), males (slightly over 50% share), aged 15–44 years (i.e. youth unemployment remained serious) and without post-Matric qualifications (over 90% proportion). The last two columns show the absolute and relative changes of unemployment by the same characteristics. In absolute terms, unemployment increased by almost one million (924 000) during the period. Moreover, the unemployment increase was the greatest amongst males (579 000), Africans (860 000), 35–44-year-olds (358 000), Limpopo residents (362 000) and those with Grade 12 only (570 000). In relative terms, males and Africans represented over 60% gender share and 90% of racial share of unemployment increase.
Table 4. Absolute and relative changes in unemployed by personal characteristics.
People aged 35–44 years accounted for the greatest age cohort share of unemployment increase (38.71%), despite the fact that it was rather the 25–34 years cohort representing the greatest share of total unemployment. Furthermore, Limpopo accounted for the greatest provincial share of unemployment rise (39.16%), followed by Western Cape and KwaZulu-Natal (24% each). Finally, people with Grade 12 only represented over 60% of unemployment increase during the period under study. These findings concur with the results of local studies such as Ranchhod & Daniels (Citation2020) and Espi-Sanchis et al. (Citation2022) as reviewed earlier.
To conclude the QLFS data analysis, in the Appendix shows the results of the Heckprobit regressions on employment likelihood, conditional on labour force participation. The results show that, between 2020 first quarter and 2022 second quarter, after controlling for differences in other characteristics, highly educated Coloureds, Indians and white individuals aged 45–64 years who were married or lived with their partners in urban areas, were associated with a significantly greater probability of finding employment.
4.2. Empirical findings using the NIDS-CRAM data
The study now proceeds to focus on those people who claimed at NIDS-CRAM wave 1 that they were still employed in February 2020 and took part in all five waves of the survey. Only these individuals would be included in the forthcoming empirical analysis. First, shows the personal characteristics of these people employed in February 2020. The results suggest that females were slightly more dominant (55% share) over males. Moreover, nearly 90% of them were Africans, youth individuals aged 25–34 years represented about two-thirds of the employed, about 70% of them were urban residents and lastly, they were fairly highly educated, as the mean years of education were slightly over 12. In fact, the percentage of people with post-Matric qualifications increased from 30% in wave 1 to 38% in wave 5. This finding is not surprising as the employed are expected to have higher educational attainment and the youth (being the majority of the employed) are more likely to invest in education.
Table 5. Profile of the people who were still employed in February 2020.
shows the labour market status of these February 2020 employed individuals across all five waves. Between April 2020 (wave 1) and March 2021 (wave 5), there has been consistently over 70% of them reporting they still worked to some extent (whether they worked in all five waves will be examined later). One concerning finding is that the proportion of these February 2020 workers who later became unemployed increased from 7.2% in wave 1 to 11.6% at wave 5, while the proportion becoming inactive almost doubled from 3.9% to 7.0%. Nonetheless, one encouraging finding is that the percentage of them reporting to be discouraged workseekers more than halved, dropping from 12.8% to 5.7% during the same one-year period. These findings suggest that as lockdown restrictions eased, those who lost their jobs at the start of the pandemic eventually felt more encouraged or in need to seek work again.
Table 6. Labour market status of NIDS-CRAM participants who were employed in 2020 February.
shows that for the February 2020 employed individuals, slightly over half of them (51.4%) worked across all five waves, while 11% had their labour market status transitioning between employed and unemployed in all waves (this result means they always remained part of the labour force, despite not working in all five waves). Two promising findings were that only 0.5% and 1.8% of the February 2020 workers ended up being unemployed and inactive, respectively. Lastly, the remaining 35% were labour force for fewer than five waves. In other words, this finding implies that 35% individuals left the labour force at some time between April 2020 and March 2021 (e.g. they became either discouraged workseekers or inactive).
Table 7. Changes in labour market status (if any) of NIDS-CRAM participants who were employed in 2020 February.
Whilst not shown in , individuals who worked in all five waves were predominantly African urban residents with at least Matric. In addition, it was earlier mentioned that 51.4% of the February 2020 employed worked in all five waves; the respective proportions of them working in any four waves, three waves, two waves and only one wave were 14.1%, 9.5%, 9.7% and 8.9%, regardless of the number of waves they were in the labour force.
Looking at other results, shows that number of times these February 2020 employed people worked in the labour market in all five waves under study, by the number of times they were in the labour force. For those who were labour force only in one wave, only 59% ended up finding work. For people who were labour force in any two waves, 63% found work in both waves while about 21% failed to find work in both waves. Next, for people who were labour force participants in any three waves, 40% ended up working in all three waves, whereas 28% and 23% worked in any one or two of these three waves (9% were unemployed in all three waves). Moving on to those who were jobseekers in any four waves, 57% of them worked in all four waves, 41% worked in one to three waves and only 2% failed to find work in all four waves. Finally, for those who remained in the labour force in all five waves, 82% worked in all of these waves, while only 0.8% failed to find work in all waves.
Table 8. Number of times employed by number of times in the labour force.
shows the labour market status transition of the February 2020 employed workers between wave 1 and wave 5. For those who were still employed at the time of wave 1, 82% of them had their status unchanged as employed in wave 5. About 44% of inactive in wave 1 still remained inactive in wave 5, but 39% of them found work in the latter wave. Lastly, it is encouraging to see that 63% of discouraged workseekers at the time of wave 1 found work in wave 5, while 59% of unemployed in wave 1 also found work in wave 5.
Table 9. Labour market status transition between waves 1 and 5 of NIDS-CRAM participants who were employed in 2020 February.
shows the mean work days per week abruptly increased from 3.61 days in wave 1 to 4.73 days in wave 2, before slightly increasing to 4.87 days at the time of wave 5. Moreover, mean daily work hours abruptly increased from 6.47 to 8.28 h between waves 1 and 2, before hovering at 8.30 h in the next three waves. Nonetheless, the results need to be interpreted with some caution because of the relatively higher proportion (over 15%) of respondents with unspecified answers.
Table 10. Weekly work days and daily work hours of employed in each NIDS-CRAM wave.
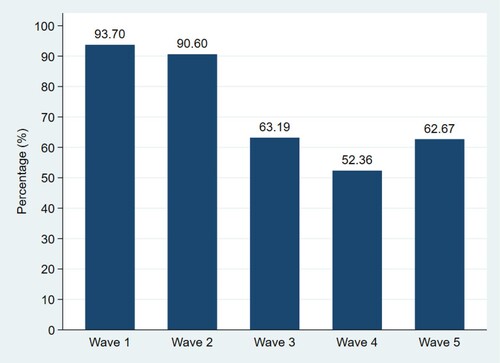
To conclude the NIDS-CRAM analysis, the survey asked the unemployed (who still worked in February 2020) in each wave to report the primary reason of them not working in the past month. shows that despite ‘lockdown’ being the most dominant answer in all five waves, the proportion of unemployed giving this response dropped from 93.7% in wave 1 to 62.7% in wave 5.
Figure 4. Primary reason of unemployed (who still worked in February 2020) not working in the past four weeks at the time of each NIDS-CRAM wave. Source: Authors’ own calculations using the NIDS-CRAM waves 1–5 data.
5. Conclusion
This study used the QLFS and NIDS-CRAM data to examine the state of South African labour market in the 2020–22 COVID-19 crisis period. The empirical findings derived from the QLFS data suggest both labour force and employment experienced an abrupt decline in the second quarter 2020, before gradually increasing again. However, they have not yet returned to their respective pre-COVID levels. The low-educated Africans and those involved in low skilled occupations were most vulnerable to retrenchment. Furthermore, unemployment increased by almost one million, most borne by low-educated African males aged 35–44 years.
On the other hand, the results derived from the NIDS-CRAM data showed that, for those who were still employed in February 2020, slightly over 50% of them worked in all five waves between April 2020 and March 2021. Two encouraging findings are that both the mean daily work hours and weekly work days of employed immediately rebounded in wave 2, whereas there was an obvious decline in the proportion of unemployed who reported economic lockdown as the primary reason for them not working in the past four weeks.
To conclude, the empirical findings derived from both datasets suggest the labour market fluctuations took place strongly in response to lockdown restrictions. In particular, the policy responses (e.g. harsh lockdown restrictions) were associated with severe costs in the labour market in terms of job losses, being disproportionately borne by the most vulnerable groups.
Lastly, Whilst it is not certain if NIDS-CRAM survey will take place again in future (after wave 5 took place in March 2021, there is not yet any wave 6 data released), it is strongly recommended that the ongoing NIDS national panel survey would include few questions relating to the COVID-19-driven lockdown (e.g. questions such as ‘have you ever lost your job during the 2020 March to 2022 May lockdown period?’), so that in future it is be possible to conduct research by comparing the labour market outcomes of those who were affected and unaffected by the lockdown, in particularly whether the affected individuals have improved their outcomes back to the pre-COVID-19 levels, by benchmarking the post-lockdown labour market estimates against historical (pre-lockdown) estimates, to better understanding what happens to the South African labour market since economic and labour activities return to close to (if not fully) normal.
Disclosure statement
No potential conflict of interest was reported by the author(s).
Notes
1 Whilst this study focuses on what happened to the labour market during the lockdown period, Giesecke (Citation2020) asserted that lockdown might only delay severely ill cases for a while but would not prevent them from happening, whereas Herby (Citation2021) found that, on average, mandated behaviour changes during the lockdown period only represented 9% of the total effect on the growth of the virus stemming from behavioural changes, but the remaining 91% of the effect was attributed to voluntary behavioural changes.
References
- Allen, DW, 2023. Why did jurisdictions repeatedly use inefficient lockdowns during the COVID-19 pandemic? Fraser Institute, Vancouver.
- Adams-Prassl, A, Boneva, T, Golin, M & Ruah, C, 2020. Inequality in the impact of the Coronavirus shock: Evidence from real time surveys. Iza Working Paper 13183. Institute of Labor Economics, Bonn.
- Balde, R, Boly, M & Avenyo, E, 2020. Labour market effects of COVID-19 in sub-Saharan Africa: An informality lens from Burkino Faso, Mali and Senegal. UNU-MERIT Working Paper No. 1871-9872. Maastricht Economic and Social Research Institute on Innovation and Technology (UNU-MERIT), Maastricht.
- Coulson, L, 2009. An exploration of the correlates of long-term unemployment in South Africa using national survey data, 2001–2007. Unpublished Masters thesis. University of KwaZulu-Natal, Durban.
- Crossley, TF, Fisher, P & Low, H, 2021. The heterogeneous and regressive consequences of COVID-19: Evidence from high quality panel data. Department of Economics Working Paper 919. Department of Economics, University of Oxford, Oxford.
- Daniels, RC, Ingle, K & Brophy, TSL, 2022. Employment uncertainty in the era of COVID-19: Evidence from NIDS-CRAM and the QLFS. Southern Africa Labour and Development Researh Unit, University of Cape Town, Rondebosch.
- Danquah, M, Schotte, S & Sen, K, 2020. COVID-19 and employment: Insights from the Sub-Saharan African experience. The Indian Journal of Labour Economics 63(1), 23–30.
- Department of Communications, 2013. In Postal market review. Department of Communications, Pretoria.
- Dias, R & Posel, D, 2007. Unemployment, education and skills constraints in post-apartheid South Africa. DPRU Working Paper 07/120. Development Policy Research Unit, University of Cape Town, Rondebosch.
- Dumasi, M, 2020. SAPO – SA post office keeping up with the times. https://enterprise-africa.net/sapo-sa-post-office-keeping-up-with-the-times Accessed 16 May 2023.
- Ehrenberg, RG & Smith, RS, 2012. Modern labor economics: Theory and public policy. 11th edn. Pearson Education, Boston.
- Espi-Sanchis, G, Leibbrandt, M & Ranchhod, V, 2022. Age, employment and labour force participation outcomes in COVID-era South Africa. Development Southern Africa 39(5), 664–688.
- Festus, L, Kasongo, A, Moses, M & Yu, D, 2016. The South African labour market, 1995–2015. Development Southern Africa 33(5), 579–599.
- Giesecke, J, 2020. The invisible pandemic. The Lancet 395(10238), e98.
- Herby, J, 2021. A first literature review: Lockdowns only had a small effect on COVID-19. Available at Social Science Research Network: https://papers.ssrn.com/sol3/papers.cfm?abstract_id=3764553 Accessed 16 May 2023.
- Hossain, M & Hossain, MA, 2021. COVID-19, employment and gender: Evidence from Nigeria. Available at Social Science Research Network: https://ssrn.com/abstract=4113069 Accessed 19 January 2023.
- Jain, R, Bassier, I, Budlender, J & Zizzamia, R, 2020. The labour market and poverty impacts of Covid-19 in South Africa: An update with NIDS-CRAM wave 2. Saldru Working Paper 272. Southern Africa Labour and Development Researh Unit, University of Cape Town, Rondebosch.
- Kohler, T & Bhorat, H, 2020. COVID-19, social protection, and the labour market in South Africa: Are social grants being targeted at the most vulnerable? DPRU Working Paper 202008. Development Policy Research Unit, University of Cape Town, Rondebosch.
- Kohler, T, Bhorat, H, Hill, R & Stanwiz, B, 2021. COVID-19 and the labour market: Estimating the employment effects of South Africa's national lockdown. Dpru Working Paper 202107. Development Policy Research Unit, University of Cape Town, Rondebosch.
- Oosthuizen, M, 2006. The post-apartheid labour market: 1995–2004. DPRU Working Paper 06/103. Development Policy Research Unit. University of Cape Town, Rondebosch.
- Ranchhod, V & Daniels, RC, 2020. Labour market dynamics in South Africa in the time of COVID-19: Evidence from wave 1 of the NIDS-CRAM survey. Saldru Working Paper 265. Southern Africa Labour and Development Research Unit, University of Cape Town, Rondebosch.
- Schotte, S, Danquah, M, Osei, RD & Sen, K, 2021. The labour market impact of COVID-19 lockdowns: Evidence from Ghana. IZA Working Paper 14692. Institute of Labor Economics, Bonn.
- Skinner, C, Alfers, JBL & Rogan, M, 2021. Informal work in South Africa and COVID-19: Gendered impacts and priority interventions. WIEGO Policy Brief 22. Women in Informal Employment: Globalizing and Organizing (WIEGO), Manchester.
- South African Government, 2022. The South African economic and reconstruction and recovery plan. Government Printers, Pretoria.
- South African Reserve Bank, 2023. Quarterly bulletin data. https://www.resbank.co.za/en/home/publications/quarterly-bulletin1/download-information-from-xlsx-data-files Accessed 20 January 2023.
- Statistics South Africa, 2020. Gross domestic product: Second quarter: 2020. Statistics South Africa, Pretoria.
- Statistics South Africa, 2023. Quarterly labour force survey: First quarter 2023. Statistical release. Statistics South Africa, Pretoria.
- Yu, D, 2009. The comparability of Labour Force Survey (LFS) and Quarterly Labour Force Survey (QLFS). Stellenbosch Economic Working Papers 08/09. Stellenbosch University, Stellenbosch.
- Yu, D & Adams, C, 2022. Labour market trends in South Africa between 2009–2019: A lost decade? Stellenbosch Working Paper Series No. WP03/2022. Stellenbosch University, Stellenbosch.
- Yu, D & Roos, P, 2018. Frans Barkers’ The South African Labour Market. 6th edition. Pretoria: Van Schaik Publishers.
Appendix
Table A1. Absolute and relative changes in the inactive by personal characteristics.
Table A2. Heckprobit regressions on employment likelihood, conditional on labour force participation.