
 ?Mathematical formulae have been encoded as MathML and are displayed in this HTML version using MathJax in order to improve their display. Uncheck the box to turn MathJax off. This feature requires Javascript. Click on a formula to zoom.
ABSTRACT
While the South African labour market showed some signs of improvement in the 2000s with unemployment rate gradually dropping to as low as 22.7% at the end of 2007, things unfortunately turned downhill in 2009–19 (sometimes referred to as the ‘lost decade’). Using the 2009 and 2019 Quarterly Labour Force Survey data, this study derived descriptive statistical estimates on labour force, employment and unemployment; the empirical findings suggested strongly that patterns in the labour market outcomes deteriorated during this decade. Unemployed individuals were largely black Africans and concentrated amongst the less educated individuals. They remained out of work for longer and, on average, spent more time seeking employment. The data also indicated the presence of hysteresis in unemployment. Key ameliorating policies in this scenario are skills development and structural reform in the labour market. The former is difficult to achieve, even in the long-term, while the latter is politically challenging.
1. Introduction
Unemployment has always been one of South Africa’s most pressing socio-economic problems. In fact, over the past two decades it has also proved to be one of the most intractable policy challenges in the country. A plethora of policy proposals and interventions have failed to continuously and drastically reduce unemployment level and rate. While significant growth in employment took place in the initial years of the post-apartheid period, since 2009 employment growth has slowed but unemployment has increased substantially.
Economic policies in general aim to improve societal welfare by promoting full employment of a country’s human (and other) resources. Theoretically, a sustained period of resource underutilisation would inevitably result in welfare loss through reduced output. High unemployment may also manifest in various social pathologies, such as high crime rate, poor health, low educational attainment and, in the extreme, political instability. Simply put, it is hard to overstate the potential negative consequences of South Africa’s high unemployment.
A particular feature of the country’s unemployment is its persistence over time, and this observed stubbornness has given rise to the notion that the underlying ‘equilibrium unemployment rate’ or ‘natural rate’ may itself be high and increasing – a phenomenon known as ‘hysteresis’ (Blanchard & Summers, Citation1987). Taking this notion seriously, negative shocks should portend adverse long-term outcomes in the labour market’s absent structural changes that ‘ratchet down’ the theoretical equilibrium unemployment rate.
In addition, the recent COVID-19 pandemic further bodes ill for the country’s labour outcomes. While the medium – and longer-term effects of the COVID-19 crisis on the labour market will become clearer over time, short-run effect of the pandemic was that the unemployment problem was starkly exacerbated (Jain et al., Citation2020). Horn & Donaldson (Citation2021) found that recovery in employment has been lagging behind income recovery since the start of the pandemic, thereby lending support to the notion that hysteresis in unemployment may be at work in South Africa. Testing this hypothesis, Dadam & Viegi (Citation2021: 14–19) estimated an insider-outsider hysteresis model and found that unemployment did not respond meaningfully to positive demand shocks, a rise in prices resulted in a persistently higher unemployment rate, while positive shocks to wages had a significant negative initial impact on unemployment.
These findings suggest the potential presence of hysteresis via the insider-outsider mechanism and human capital mechanism. The former implies that the employed (insiders) negotiate higher wages in post-shock recovery periods at the expense of labour demand for the unemployed (outsiders), given institutional arrangements and power-distributions in wage setting. On the other hand, the human capital mechanism suggests that the unemployed have become unemployable through the loss of skills and subsequently perpetuated high unemployment rates (Arora & Ricci, Citation2006). Furthermore, in a labour market with characteristically high unemployment combined with an underperforming education system, ‘ability signalling’ among the unemployed is distorted, thereby reducing the demand for labour while simultaneously raising wages of the employed.
The structural unemployment in South Africa is naturally a multi-causal, if not complex, phenomenon. The hysteresis theory suggests two often emphasised policy responses, namely skills upgrade and liberalisation of the labour market; however, both policy options appear to be somewhat hard problems in recent history. Despite some improvement over time, South Africa’s primary and secondary educational outcomes have compared unfavourably to peer countries in international tests over the last two decadesFootnote1 (Van der Berg & Gustafsson, Citation2019). On the other hand, structural reforms are likely to face formidable resistance from unions, particularly reforms that relate to amendments of labour legislation; yet, the present circumstance demands a policy response.
Confronted with these suppositions, some mix of two possibilities in the policy space may be considered: first, diagnoses of the underlying causes of unemployment have been accurately identified and countervailing policy proposals have not been implemented for various reasons; secondly, effective interventions that can be implemented are yet to be proposed. In either case, a high-level disaggregation of labour market trends may shed some light on narrower target areas for employment generation.
This study presents the next iteration of decadal analyses of labour market trends by primarily using data from the 2009 and 2019 Quarterly Labour Force Survey (QLFS). By reporting on a range of labour-market indicators disaggregated by demographic and geographic characteristics, we indirectly present an accounting of the relative success of any employment increasing strategies/policies implemented over the past decade. We conclude the study by offering some perspective on various policy options in response to growing unemployment.
2. Literature review
This section reviews the recent local empirical studies that examined the state of the South African labour market since the advent of democracy. Arora & Ricci (Citation2006), Bhorat (Citation2009), Burger & Woolard (Citation2005), Oosthuizen (Citation2006), Yu (Citation2008) as well as Festus et al. (Citation2016) are the studies that examined the labour market levels and trends over a relatively long period of time.
The first five studies focused on the first decade in the labour market post-apartheid (1995–2001, 1995–2005, 1995–2002, 1995–2004 and 1995–2006, respectively). In general, these studies found that even though employment increased, the extent of unemployment increase was greater because not all net entrants to the labour market successfully found work. In particular, Arora & Ricci (Citation2006: 23) pointed out that economic growth was not high enough to keep up with the more rapid increase of the labour force, whereas Bhorat (Citation2009: 3) showed that South Africa’s unemployment rate was much higher (over 25% in 2006) compared with other middle-income countries such as Argentina and Turkey (only about 10%).
These studies found that middle-aged white individuals with post-Matric qualifications enjoyed greater employment likelihood. On the contrary, much of the rise in unemployment fell on female black Africans with low educational attainment. Oosthuizen (Citation2006: 22) ascribed the rise in unemployment to the rapidly increasing labour force participation rate – especially among black females – in the initial post-apartheid period. Sectors with reductions in employment levels included primary sectors and Community, Social and Personal (CSP) services. These studies also found that unemployment rates were the highest in the Limpopo and North West provinces. In addition, upon examining all waves of the 2000–06 Labour Force Survey data, Yu (Citation2008) found that the labour market trends during the 6-year-period did not suggest the significant presence of feminisation of labour force.
Festus et al. (Citation2016) thoroughly analysed the 1995 October Household Survey (OHS), 2005 Labour Force Survey (LFS) and 2015 QLFS data to examine the state of the country’s labour market in 1995–2015. Their findings reflected a continuation of numerous adverse trends found in the earlier discussed studies. In particular, the authors (Citation2016: 593) found that unemployment rate actually declined between 2005 and 2015 (from 26.7 per cent to 25.4 per cent), but the burden of high unemployment number was again largely borne by less educated blacks. Festus et al. (Citation2016: 595) also found that larger firms were the major employers and the number of workers employed in smaller firms (with fewer than 10 employees) increased very modestly between 2000 and 2015. These results imply that larger firms not only employed more workers than smaller firms, but were also responsible for most of the job creation that took place over the 15 years.
Festus et al. (Citation2016) also concurred with Oosthuizen (Citation2006) that skills mismatch was a salient correlate and possible cause of the country’s high unemployment. In addition, both Arora & Ricci (Citation2006) and Bhorat (Citation2009) provided a comprehensive summary on the key factors causing the persistently high unemployment in South Africa. They ranged from stagnant real economic growth rate and skills mismatch, to wage rigidities, employment rigidities, and lack of strong correlation between labour productivity and real wages.
Burger & Woolard (Citation2005) identified three groups of unemployed: the first group consists of youth individuals with complete secondary or some post-secondary education; the second group primarily comprises middle-aged African females with very low education and no prior work experience, while the last group is represented by older people with incomplete education and some work experience. Out of the three groups, the authors asserted that demand-side policies to stimulate economic growth and supply-side measures such as vocational training and skills upgrading might help boost the employment likelihood of the first and third groups, but people from the second group are most difficult to deal with because they could be long-term unemployable.
Lastly, whilst not highly relevant to this study, some recent studies analysed panel data (National Income Dynamics Study), such as Essers (Citation2017) and Wakefield et al. (Citation2022). These studies found that African females with incomplete secondary education were more likely to remain unemployed for a long duration, whereas the highly educated ones with past work experience broke through the entry barriers more easily to find high-pay jobs in the formal sector.
3. Methods and data
This study conducts a comprehensive analysis of labour market trends in South Africa, with specific focus on the 2010s decade by deriving a wide range of descriptive statistical estimates to document trends related to the demographic, geographic and educational attainment characteristics of the labour force, employed and unemployed. We further examine the employed’s work activities, such as occupation, industry and whether they worked in the formal or informal sector. Changes (if any) in the characteristics of unemployed are also analysed with consideration to previous work experience and job-seeking behaviour. These trends are important as they present evidence on the performance of the labour market and, implicitly, the relative success of various labour market policies aimed at reversing the country’s high unemployment rate.
The analysis takes a long-term perspective relating to the 2009–19 quarter four period; however, some broader trends will be explored over the two-decade period spanning 1999 quarter four to 2019 quarter four. Throughout the study, youth individuals are distinguished as those aged 15–34 years. In addition, unless stated otherwise, the narrow definition of unemployment is implied when discussing labour market status so as to remain consistent with the official definition used by StatsSA. According to this narrow definition, a jobseeker in the working age (15–65 years) is classified as unemployed if he/she did not work in the last seven days, wanted work and was available to start work or open a business during the reference period (it was one week in the QLFS), and had taken steps to look for work or try to launch a business in the past four weeks (Yu & Roos, Citation2023: 191).
All data used in the analyses are drawn from various Statistics South Africa (StatsSA) labour market surveys, including the OHS, LFS and QLFS. During the main period under consideration (from 2009 fourth quarter to 2019 fourth quarter), StatsSA utilised the same sampling method for all surveys, obviating any comparability concerns that afflict earlier periods (detailed discussions on the main changes to survey design, sampling method and weighting techniques across these three labour surveys fall beyond the scope of this study, but can be referred to Yu (Citation2013: 705–707)). Lastly, unless stated otherwise, all empirical findings are derived with use of the person weight variable.
4. Descriptive data
4.1. Employment and unemployment trends since 1995
The long-term trends in labour market statistics tell a consistent story: employment grew faster during the first decade of the century when compared to the second decade, whereas unemployment declined from 2003 but increased shortly before the great recession of 2008/9. The relatively high-growth period of 2000–07 saw a reduction in the absolute number of unemployed to as low as 3.9 million in 2007 (see ). Nonetheless, unemployment steadily increased for almost the entire 2010s decade, reaching 6.7 million in the last quarter of 2019. In addition, whilst not being the focus period of this study, the COVID-19 crisis period saw unemployment number increasing abruptly and even peaking at 8.0 million in the second quarter of 2022, before declining slightly to 7.8 million in the last quarter of the year. Whilst not shown in the figure, unemployment remained at 7.8 million in the third quarter of 2023, from the most recently released QLFS at the time of writing (StatsSA, Citation2023).
Figure 1. Number of employed and unemployed (millions), 1995–2022. Source: Authors’ own calculations using the OHS 1995–1999, LFS 2000–2007 September and QLFS 2008–2022 fourth quarter data.
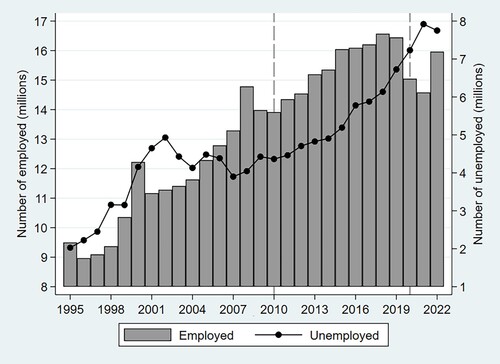
The figure also shows that employment gradually increased to 14.8 million at the end of 2008, before an abrupt decline of nearly one million took place following the 2008/9 great recession. During the 2010s decade, employment initially enjoyed a steady increase of 3.2 million from 2010 (13.9 million) to 2015 (16.1 million); this level was stagnant at around 16.0 million in the last half of the decade, before unstable fluctuations took place in 2020–22 due to the COVID-19-related lockdowns which constrained economic activities.
compares labour market statistics for the three points in time spanning two decades: 1999, 2009 and 2009. The working-age population grew by 6.5 million during the 1999–2009 period and 6.3 million during the 2009–19 period. Proportionally, the labour force grew more rapidly during the early period (36%) when compared to the past decade (26%). Similarly, employment growth was more rapid in 1999–2009 (35%) when compared to the 2009–19 period (18%). Since labour force growth outpaced employment growth in both 10-year periods, unemployment increased significantly as a result (growth of 40% in 1999–2009 and 52% in 2009–19).
Table 1. Key labour market characteristics in the 2000s and 2010s decades.
Notably, the youth share of the total employed decreased by 8.5 percentage points, from 28.6% to 20.1% over the two decades. In absolute terms the number of youths employed also decreased between 2009 (3.5 million) and 2019 (3.3 million). While there may be several factors explaining this decline, the rise in the number of youths not in education, employment or training is one of the more concerning factors. Furthermore, employment grew faster in the formal sector relative to the informal sector during the first decade of the century, but the trend was reversed during the second decade. In 1999–2009, informal sector employment grew by 27% whereas between 2009 and 2019 informal employment grew by 29%. In contrast, formal sector employment grew by 37% during 1999–2009 and then by only 17% up to 2019.
Another useful labour market performance metric is the target growth rate (TGR) which estimates the employment growth rate needed for the labour market to absorb all net entrants into the labour market between two given periods.Footnote2 shows both the TGR and actual growth rate (AGR) for the two decades under consideration. Notably, the AGR in employment came closer to the TGR during the 1999–2009 period when compared to what happened in 2009–19. As shown by the employment absorption rate (EAR) – which is the ratio of the AGR to TGR – actual growth in employment was only half of what was required to absorb net entrants during the last decade, whereas the EAR was relatively higher at 74% in the preceding decade.
The employment elasticity (given by the ratio ) was estimated at 0.83 in 1999–2009, before it increased to 0.97 in 2009–19. However, the greater elasticity estimate in the latter period should be interpreted with great caution, as the results in clearly show that the annualised real GDP growth rate (1.7%) more than halved, compared with the corresponding growth rate in 1999–2009 (3.6%). Similarly, the annualised employment growth rate in 2009–19 (1.6%) was also much lower compared with what happened in the previous decade (3.0%).
4.2. Labour force participation
Turning to the personal characteristics of labour force, we restrict our analysis to the last decade spanning 2009–19. shows changes (in both absolute and proportional terms) in various characteristics of the labour force. First of all, African naturally made up the largest ethnic share of the labour force and accounted for the most of the growth in the labour force. In contrast, the number of whites in the labour force, perhaps owing to emigration,Footnote3 declined by 10% over the 10-year period. Labour force participation rate (LFPR) among Africans appears to be slowly converging on that of other population groups, but the LFPR remained the highest among whites (nearly 70%). Looking at results by gender, females in 2019 made up 45% of the labour force and accounted for half of the growth in the size of the labour force of the past decade. Nonetheless, LFPR remained higher among males (15 and 12 percentage points above the female LFPR, in 2009 and 2019 respectively).
Table 2. Labour force under the narrow definition: 2009 and 2019.
The number of young adult labour force aged 15–24 years remained nearly the same between 2009 and 2019 (about 2.7 million). The 35–44 years age cohort accounted for 35% of the growth in the labour force while the 45–54 year cohort represented 28% growth share. Also, labour force participation likelihood was the highest within the 35–44 years age cohort (80% in 2019). With respect to the geographic distribution of labour force, Gauteng remained the most dominant province as it represented 32% of the total in 2019, followed by KwaZulu-Natal (15.3%) and Western Cape (13.8%). The proportional makeup of labour force across provinces was quite similar at the end of the decade relative to the start, with marginal decreases in the net in-migration provinces like Gauteng and Western Cape and marginal increases in some net out-migration provinces like Eastern Cape and Mpumalanga. Still, the three largest provinces accounted for 60% of the labour force, which aligns closely to their share of the overall population (57%) (StatsSA, Citation2019). There was also large variation in LFPR across the provinces, ranging from 47.5% in Limpopo to 70% in Gauteng, in 2019.
also shows that the average education level of the labour force increased over time. Despite this, nearly half (47%) of labour force attained less than Matric in 2019. Labour force participants with Matric accounted for a majority share of the growth in the labour force (46.5%). The number of labour force with a degree more than doubled, from just over 1 million to 2.1 million over the period. Lastly, the LFPR increased across the higher educational attainment categories: in 2019, this rate was the highest (87%) amongst jobseekers with a degree but the lowest (36%) amongst those with no education.
4.3. Employment and work activities
examines the characteristics of employed individuals and breaks down the AGR, TGR and EAR by demographic and geographic factors. The EAR was the lowest for coloureds (42.5%), followed by Africans (55.3%). Looking at results by gender, female share of total employment increased slightly by 0.5 percentage points (rising from 43.5% to 44.0%) over the 10-year period, while the extent of labour absorption was higher among males (55%) than females (49%).
Table 3. Employment: 2009 and 2019.
EAR increased across the older age cohorts. Notably, the youngest cohort 15–24 years had a positive TGR but negative AGR thus resulting in a negative EAR. This result implies a net positive entry into the labour market by young adults, yet fewer such persons were employed in 2019 than it was the case in 2009. With regard to persons aged 25–34 years, they had an EAR of 27.1%, which means that only about three out of 10 net entrants into the labour market from this age cohort were able to find employment over the 2009–19 period. Looking at other results by age cohort, the EAR was the highest in the 55–65 years age cohort (85.3%). Moreover, the 33 percentage-points gap in EAR between the 25–34 years (27.1%) and 35–44 years (59.8%) cohorts reflects a substantial divergence in the labour market’s capacity to absorb youth jobseekers in contrast to adult jobseekers into employment.
Employment varied significantly across the provinces. Free State is the only province that saw no employment growth over the 10-year period, although it had positive net entrants into the labour market and thus a positive TGR. Limpopo had the highest EAR at 85.4%, even though it had one of the highest TGRs. This outcome should be evaluated with the consideration to base number which was relatively low in this province, in particular its very low LFPR as shown in earlier. Among the three provinces with the largest proportion of the labour force, Western Cape had the highest EAR at 79.8%, followed by Gauteng at 47.5% and KwaZulu-Natal at 45.6%. Of these provinces, Western Cape was the only one that experienced an increase in its provincial share of total employment over the 10 years. The high growth in employment in Limpopo is also notable as it grew at almost double the rate of the next highest-growing province, which was the Western Cape.
Education is often regarded as one of the most important determinants of employment status, and the results in bear this out. Degree holders enjoyed the highest EAR of 86.5% while individuals with incomplete secondary school had an EAR of only 35.8%. Persons with incomplete secondary education made up the largest proportion of total employed in 2019 (36% share) although matriculants and degree holders grew as proportion of total. The latter two categories also saw the greatest employment growth compared to other education categories. The results also reflected stark differences in the employment likelihood by educational attainment. In particular, youth with an education level less than Matric were being absorbed by the labour market at much lower rates than highly educated adults. To conclude the discussions of , it is apparent the findings are highly similar to what was found by the recent empirical studies as discussed in Section 2, as older and highly educated whites were associated with a greater employment likelihood.
shows that employment increased in most occupation categories with Technicians (14% decline) and Skilled Agriculture (11.6% drop) workers being the only exceptions. The fastest growing occupation categories over the 10-year period were Service and Sales workers (38.5%), Professionals (37.9%) and Managers (35.8%). The latter two categories, however, grew off a very low base and, when combined, comprised less than 15% of the total number of employed in 2019 – merely a two-percentage-point increase during the 10-year period (2009: 12.6%; 2019: 14.7%). Also, elementary occupations remained the category with the highest share in 2019 (22.9%).
Table 4. Work activities of employed, 2009 and 2019.
Grouping the occupation categories by skills levels, semi-skilled employment experienced the highest growth over the 10-year period (20.1%), followed by low-skilled (18%), with high-skilled employment showing the slowest growth at 12.4%. In addition, high-skilled employment represented about a quarter of total employment (2009: 24.3%; 2019: 23.2%).
At industry level, the results show that CSP Services was one of the fastest growing industries (35.1%), adding the highest number of jobs (987 000) when comparing 2019–09. The Finance industry category, which grew at a similar rate (34.6%), employed 661 000 more workers in 2019 relative to 2009. Other high growing industries were Agriculture (37%) and Mining (33.6%), although this growth stems from a low base, with these two industry categories altogether employing only an additional 347 000 people in 2019 when compared to 2009. Notably, Private Household employment was nearly the same in 2019 as was the case in 2009. When aggregating up to sector level, the Tertiary Sector represented the greatest share of employment (slightly over 70% in both years) and accounted for the greatest growth share (85%).
Looking at the remaining results in , about 85% of employed worked in the private sector. Moreover, public sector employment increased by 584 000 over the 10 years, while private sector employment increased by 1.9 million. Lastly, formal sector (including agriculture) accounted for 74% of total employment.
Moving on to , the results show that the in the two youngest age cohorts, more than 50% of them involved in semi-skilled occupations in both years under study. In addition, the share of workers engaged in low skilled occupations was the highest in the 15–24 years age cohort (about 31–32%). Furthermore, high skilled employment has an older age skew: the oldest cohort had a 30% share employed as high skilled in 2019, whereas the youngest cohort 15–24 years had only 14.4% share employed as high skilled workers.
Table 5. Proportion of employed in each skills level of occupation category, by age cohort and educational attainment, 2009 and 2019.
Looking at other results in the table, high skilled occupations favour workers with higher educational attainment, as evidenced by the finding that more than three quarters of degree holders involved in high skilled occupations. In contrast, about two-thirds of employed with no education worked in low skilled occupations, while the corresponding share was also a fairly high 60% for employed with incomplete primary education.
Disaggregating employment by sector category, age and education, shows a slight age sector gradient in 2019 that was absent in 2009. Across all age cohorts, employment in the tertiary sector industries was dominant. Primary sector employment as proportion of total employment increased for all cohorts except for the 55–65 years cohort. Education categories with lower achievement had a higher proportion of workers in the primary and secondary sectors. On the other hand, for the two most educated categories, more than 80% of employed were involved in tertiary sector work activities (Matric plus Certificate/Diploma category: 81%; degree: 86%).
Table 6. Proportion of employed in each industry sector category, by age cohort and educational attainment, 2009 and 2019.
plots the annual growth in Gross Value Added (GVA) against annual employment growth for each broad industry category over the 10-year period. The figure reinforces the importance of the tertiary sector industries for both economic growth and job creation. One notable result is that the finance industry reflects the highest average annual real GVA growth which also translated in high employment growth in this industry. Agriculture and mining, although growing at negligible rates over the two decades, had relatively high average annual employment growth in 2009–19, with agriculture surprisingly having the highest employment growth of all industries.
Figure 2. Annual percentage growth of employment versus annual percentage growth of real gross value added (2010 prices) by industry, 2009–2019. Source: Authors’ own calculations using the QLFS 2009 fourth quarter, QLFS 2019 fourth quarter and the South African Reserve Bank Quarterly Bulletin data.
Note: The size of the circle represents the employment share of the industry category in 2009.
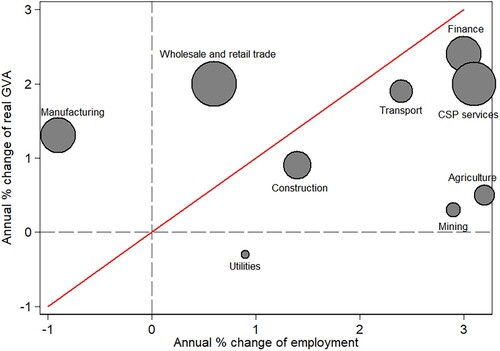
CSP services, which includes public sector workers, added the most employment over the two decades in absolute numbers and had the second highest average annual growth rate in employment. The trade industry had an employment annual growth rate below 1% although the industry experienced 2% average real GVA annual growth rate over the last two decades. Employment loss in the manufacturing industry perhaps offers some evidence of deindustrialisation in South Africa during the twenty-first century. With a negative average annual growth of 1%, manufacturing has shed jobs over the last two decades and averaged just above 1% in real GVA growth per annum.
Within the private sector, larger firms accounted for most employment. As shows, larger firms (with 50 or more workers) also accounted for the highest growth in employment between 2009 and 2019 (41.3% in proportion terms or 843 000 in absolute terms). Notably, employment in all firm size categories below 50 workers shrunk as a share of total employment between 2009 and 2019. This finding is alarming as small and medium-sized enterprises are expected to play an important role to generate jobs in the economy. It is possible that the earlier-mentioned labour market rigidities issues as well as numerous difficulties in forming, sustaining and growing the small businesses (South Africa performed particularly poorly in areas such as getting electricity, registering a property and getting credit, as found by World Bank (Citation2020)) discouraged the businesses’ growth and subsequently job creation prospects.
Table 7. Total number of workers at the firms where the employees worked, 2009 and 2019.
The importance of temporary work has received greater policy focus over the last two decades, while the related notion of ‘under-employment’ has also received some attention in the labour research literature. shows the changes in employment by sector, skills level and tenure status. Around 80% of the total employed were in full-time employment in both 2009 and 2019. The listed category in which employment grew fastest was informal non-full-time employers (4.9% annualised growth rate). Such persons, however, accounted for only 3.7% of the total employed in 2019.
Table 8. Employment by sector, skills level and full-time/part-time status, 2009 and 2019.
In absolute terms, most of the growth in employment occurred in formal, full-time employment – particularly in semi-skilled work (5.6 million or 34.8% share in 2019). Lastly, it is concerning that all three categories that represented the greatest share of total employed (i.e. full-time formal employees in skilled, semi-skilled and unskilled occupations, respectively) only experienced an annualised growth rate of between 1.4% and 1.9%. These low growth rates would mean that the extent of job creation was not rapid enough to keep up with the pace of increase of jobseekers in the labour force.
4.4. Unemployment
shows that the unemployment rate increased by five percentage points over the 2009–19 period (2009: 24%; 2019: 29%). In absolute terms total unemployment increased by 2.3 million people, reaching 6.7 million in 2019. Africans accounted for 90.5% of the increase in the total number of unemployed.
Table 9. Unemployed under the narrow definition: 2009 and 2019.
The unemployment rate increased over the last decade for all population groups. Africans and coloureds remained much more likely to be unemployed than their white and Indian counterparts. Females also had a higher unemployment rate relative to males, while the gender gap in this rate has slightly widened, as female unemployment rate was 2.8 and 4.2 percentage points higher in 2009 and 2019, respectively.
The youngest 15–24 years age cohort suffered a significantly higher unemployment rate (58.1%) when compared to the 25–34 years age cohort (35.6%). Moreover, in 2019 the 25–34 years cohort had the largest absolute number of unemployed persons (2.67 million), which reflects an increase of 836 000. In the 35–44 years cohort, the number of unemployed increased by 673 000 between 2009 and 2019. Lastly, unemployment rates decreased across older age cohorts, even though it is noteworthy that for the two oldest cohorts, unemployment more than doubled in absolute terms between 2009 and 2019.
The provincial results again reflect high variability in unemployment rates, ranging between 21% (Western Cape) and 39.5% (Eastern Cape) in 2019. Gauteng, the most populous province, accounted for one-third of the total unemployed South Africans and experienced a 50% increase in the number of unemployed over the last decade. The province with the second highest proportional share of the unemployed was Eastern Cape, which saw a near doubling of unemployed persons (446 000 additional unemployed) in the 2009–19 period. In juxtaposition to the 125 000 additional employed added over the same period, this presents a stark figure for labour market dynamics in the Eastern Cape province.
To conclude the discussion of results in , those with incomplete secondary education accounted for the greater share of unemployment (about 50%), represented the greatest unemployment growth share (49.6%) and endured the highest unemployment rate (36.2%). In addition, unemployment rate was the lowest for degree holders (9.2% in 2019), but it is alarming that unemployment rate increased between 2009 and 2019 across all educational attainment categories with the exception of the no schooling category.
Matching employees and employers in practice takes place in myriad ways, and inefficiencies in this process could have significant implications for the functioning of the labour market. The QLFS asked respondents about their work seeking activities. shows that across age cohorts, a minority of the unemployed utilised employment agencies when seeking employment. The results also shows the importance of networks in seeking employment: ‘assistance from relatives and friends’ was the only option chosen by a majority of respondents across all age cohorts. Educational attainment seems to mitigate the importance of networks as only 31.4% of people degree holders relied on this method of job-seeking, whereas this proportion was close to 60% for job-seekers without Matric. The results in also show some generational differences in behaviour when it comes to seeking employment, as younger jobseekers were more likely to search for work by looking at advertisements when compared to older jobseekers. In addition, a higher proportion of degree holders (about 70%) used job advertisements as a means of seeking employment in contrast to individuals with low educational attainment (incomplete secondary: 30%; no schooling or incomplete primary: 16%).
Table 10. Proportion of unemployed involved in each job-seeking action by age cohort and educational attainment, 2019.
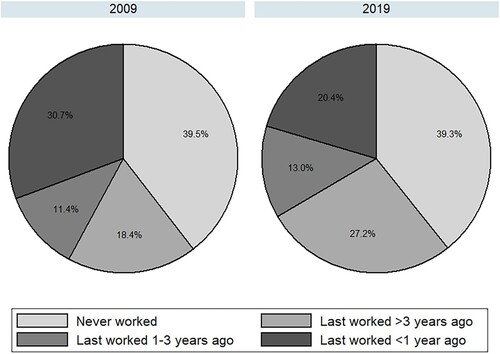
Churn is not necessarily an undesirable feature of the labour market. Structural unemployment, on the other hand, demands a policy response as it is associated with longer term unemployment and attendant social pathologies. shows the past work experience of unemployed and the results show that the proportion of unemployed who have never worked remained the same over the decade (39%). However, the graph shows a trend towards longer spells of unemployment, as the share of unemployed who last worked more than three years ago increased from 18.4% to 27.2%.
Figure 3. Past work experience of unemployed, 2009 and 2019. Source: Authors’ own calculations using the QLFS 2009 and 2019 fourth quarter data.
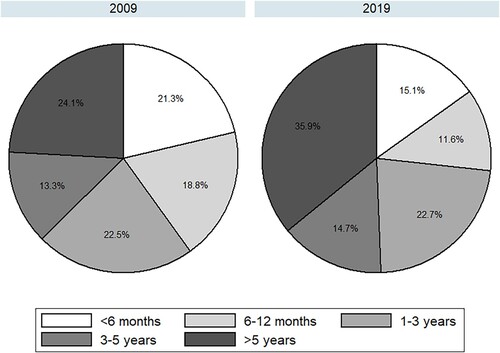
shows the duration that unemployed individuals spent seeking employment. The proportion who spent more than five years seeking employment increased from 24.1% to 35.9% over the 2009–19 period, while the share of unemployed who spent fewer than six months seeking employment decreased from 21.3% to 15.1%. in the Appendix disaggregated these data by various demographic characteristics. Unemployed Africans (41–42%) were much more likely to have never worked than other population groups. The proportion of unemployed Africans who worked within the previous three years was also significantly lower than was the case for other population groups and declined substantially between 2009 (19.3%) and 2019 (7.4%). Unemployed females appear to remain unemployed for longer periods than males. Geographically, the Western Cape appears to be an outlier, in the table as it was the only province in which the largest proportion of unemployed individuals have worked within the previous three years. Nonetheless, this proportion decreased by 10 percentage points over the decade for the Western Cape and has worsened, on average, across the provinces. Strikingly, higher education levels did not seem to offer immunity to long-term unemployment, as nearly half of unemployed with degrees reported they have never worked before.
Figure 4. Unemployed individuals’ duration of seeking work, 2009 and 2019. Source: Authors’ own calculations using the QLFS 2009 and 2019 fourth quarter data.
To conclude the discussion on unemployment, it is obvious that what happened during the 2010s was almost identical to findings derived by the recent empirical studies that examined the South African labour market in the first 20 years since the advent of democracy until the mid-2010s. That is, young female Africans without post-Matric qualifications remained most vulnerable to unemployment; they were also more likely to be chronically unemployed who struggled to find their first job in the labour market.
5. Conclusion
This study examined the state of the South African labour market in the 2010s. The findings suggested strongly that 2009–19 indeed was a ‘lost decade’, characterised by much slower pace of economic growth and job creation. As what happened in the previous decades, the extent of employment increase failed to keep up with the more rapid increase of labour force entrants, thereby resulting in further increase of both unemployment number and rate. Furthermore, lowly educated youth Africans remained most vulnerable to unemployment, as they either struggled to find their first job or became jobless for a long duration since the last employment. The 2020s decade could be even more challenging for the labour market to recover before having any chance to experience rapid growth, due to the COVID-19-driven economic crisis in 2020–22.
The empirical findings derived in this study provide some support for the notion of hysteresis in unemployment in South Africa. Skills development has proven to be a challenge for policymakers, while the prospect of labour market reform remains a contentious political-economy matter. It would be tempting to suggest that disproportional union power is a significant factor in explaining the labour market outcomes found in this study, particularly if advancing the insider-outsider framework for South Africa’s labour market.
The capacity for employed (insiders) to negotiate higher wages for themselves is often done at the expense of the unemployed (outsiders), who have a more difficult transition to employment as a result of the relatively high wages coupled with limited capacity to signal their skills or ability. Bhorat et al. (Citation2015: 659) argued that the impact of South Africa’s labour unions on the economy has been ‘relatively benign’, but they concluded that ‘political economy of wage formation and economic activity in South Africa, … , are central to appreciating the economy’s current domestic labour market disequilibria’.
De Lannoy et al. (Citation2020) focused on factors explaining the persistence of youth unemployment. The dislocation between training and employment opportunities is one area where policy may gain some traction. The problem they foreground is the poor signalling value of educational attainment as a proxy for productivity. The suggestion that training programmes may have some merit as a policy response seems reasonable in theory. However, such responses have in practice not resulted in meaningful improvements as measured by employment growth. A logical next step is to understand which training practices may better serve to both prepare youth for the labour market and signal productivity to employers.
An often-discussed intervention focuses is small business development – as a focus of policymakers, it is instantiated in the Department of Small Business Development, established in 2014. However, Kerr et al. (Citation2014) found that it is mainly large firms that are responsible for employment growth in South Africa. The relatively low level of entrepreneurial activity is also manifested in the comparatively small informal sector in South Africa (Kingdon & Knight, Citation2004).
Although the current fiscal position in South Africa precludes the imminent rollout of a universal basic income grant, the emergency introduction of incomes to unemployed individuals during COVID-19 evidences its feasibility, at least administratively. It has been suggested that the structural impediments to low-skilled employment growth are insurmountable for the foreseeable future. Taking seriously this prospect means entertaining policies that mitigate against a reality in which labour markets are unable to absorb supply, as argued by Marais (Citation2020). Despite its lack of popular or political support (Seekings, Citation2020), the obvious candidate policy in theory is a universal basic income grant. While the case for the implementation of this grant has been presented on grounds of anti-poverty, the practical feasibility of this grant has not been rigorously tested in the economics literature – perhaps due to it being viewed as patently infeasible.
Declaration
This research study was previously released as a conference paper and working paper respectively as follows: (1) Adams, C. & Yu, D. (2021). Labour market trends in South Africa in 2009–2019: A lost decade? Paper presented at the (online) Economic Society of South Africa (ESSA) Conference 2021, September 14–16; (2) Adams, C. & Yu, D. (2022). Labour market trends in South Africa in 2009–2019: A lost decade? Stellenbosch Economic Working Papers 03/2022. Stellenbosch: Stellenbosch University.
Disclosure statement
No potential conflict of interest was reported by the author(s).
Notes
1 It should be noted that schooling outcomes are notoriously unequal. Education researchers often distinguish between at least two ‘sub-systems’ in the education system where one of these is well-functioning and performs in line with peer countries, while the other sub-system is largely dysfunctional and exhibits weak performance.
2 The formula for calculating the TGR is given by , with the numerator representing change of labour force between the two periods and the denominator indicating employment level in the initial period. See Oosthuizen (Citation2006: 16) for an application of the TGR.
3 StatsSA (Citation2020: 3) suggests that over the 2011–2021 period, approximately 207 000 whites emigrated from South Africa.
References
- Arora, V & Ricci, LA, 2006. Chapter 3: Unemployment and the labour market. In Nowak, M & Ricci, LA (Eds.), Post-apartheid South Africa: The first ten years. International Monetary Fund, Washington, DC, 23–47.
- Bhorat, H, 2009. Unemployment in South Africa: Descriptors and determinants. Proceedings of the IZA (Institute for the Study of Labor)/World Bank Conference on Employment and Development, 4–5 May, Bonn.
- Bhorat, H, Naidoo, K & Yu, D, 2015. Chapter 35: Trade unions in South Africa. In Monga, C & Lin, J (Eds.), The Oxford handbook of Africa and economics. Volume 2: Policies and practices. Oxford University Press, Oxford, 641–62.
- Blanchard, O & Summers, S, 1987. Hysteresis in unemployment. European Economic Review 31(1–2), 288–95.
- Burger, R & Woolard, I, 2005. The state of the labour market in South Africa after the first decade of democracy. Journal of Vocational Education & Training 57(4), 453–76.
- Dadam, V & Viegi, N, 2021. Hysteresis without hope: Investigating unemployment persistence in South Africa. MPRA Paper No. 108129. Munich Personal RePEc Archive, Munich.
- De Lannoy, A, Graham, L, Patel, L & Leibbrandt, M, 2020. Why is youth unemployment so intractable in South Africa? A synthesis of evidence at the micro-level. Journal of Applied Youth Studies 3(2), 115–31.
- Essers, D, 2017. South African labour market transitions since the global financial and economic crisis: Evidence from two longitudinal datasets. Journal of African Economies 26(2), 192–222.
- Festus, L, Kasongo, A, Moses, M & Yu, D, 2016. The South African labour market, 1995–2015. Development Southern Africa 33(5), 579–99.
- Horn, A & Donaldson, A, 2021. Labour market effects of the great lockdown in South Africa: Earnings and employment during 2020-2022. SALDRU Working Paper No. 279. Southern Africa Labour and Development Research Unit, University of Cape Town, Rondebosch.
- Jain, R, Budlender, J, Zizzamia, R & Bassier, I, 2020. The labor market and poverty impacts of Covid-19 in South Africa. Saldru Working Paper No. 264. Southern Africa Labour and Development Research Unit, University of Cape Town, Rondebosch.
- Kerr, A, Wittenberg, M & Arrow, J, 2014. Job creation and destruction in South Africa. South African Journal of Economics 82(1), 1–18.
- Kingdon, G & Knight, J, 2004. Unemployment in South Africa: The nature of the beast. World Development 32(3), 391–408.
- Marais, H, 2020. The crisis of waged work and the option of a universal basic income grant for South Africa. Globalizations 17(2), 352–79.
- Oosthuizen, M, 2006. The post-apartheid labour market: 1995–2004. DPRU Working Paper No. 06/103. Development Policy Research Unit, University of Cape Town, Rondebosch.
- Seekings, J, 2020. Basic income activism in South Africa, 1997–2019. In Caputo, R & Liu, L (Eds.), Political activism and basic income guarantee: Exploring the basic income guarantee. Palgrave Macmillan, Cham, 253–72.
- Statistics South Africa, 2019. Mid-year population estimates 2019. Statistics South Africa, Pretoria.
- Statistics South Africa, 2020. Mid-year population estimates. Statistics South Africa, Pretoria.
- Statistics South Africa, 2023. Quarterly labour force survey quarter 3: 2023. Statistical release. Statistics South Africa, Pretoria.
- Van der Berg, S & Gustafsson, M, 2019. Educational outcomes in post-apartheid South Africa: Signs of progress despite great inequality. In Spaull, N & Jansen, J (Eds.), South African schooling: The enigma of inequality. Springer, Geneva, 25–45.
- Wakefield, H, Yu, D & Swanepoel, C, 2022. Revisiting transitory and chronic unemployment in South Africa. Development Southern Africa 39(2), 87–107.
- World Bank, 2020. Doing business 2020. World Bank, Washington, DC.
- Yu, D, 2008. The South African labour market: 1995–2006. Stellenbosch Economic Working Papers: 05/08. Stellenbosch University, Stellenbosch.
- Yu, D, 2013. Revisiting unemployment levels and trends in South Africa since the transition. Development Southern Africa 30(6), 701–23.
- Yu, D & Roos, P, 2023. Frans Barker’s the South African labour market. 7th edn. Van Schaik Publishers, Pretoria.
Appendix
Table A1. Proportion of unemployed who never worked or last worked more than three years ago: 2009 and 2019.