
 ?Mathematical formulae have been encoded as MathML and are displayed in this HTML version using MathJax in order to improve their display. Uncheck the box to turn MathJax off. This feature requires Javascript. Click on a formula to zoom.
ABSTRACT
We derived 2015 wildlife-based tourism multipliers for the rural area of Zambia where input-output tables (I-OT) are unavailable. To estimate multipliers in a data-poor environment, the national direct requirements coefficients were first derived from the country’s 2010 I-OT. These direct requirements coefficients were re-scaled to rural area region by multiplication with the rural area production percentage shares, while the total requirements coefficients were computed through an inverse matrix conversion (Leontief inverse matrix). This procedure is particularly useful for rural area regions with active wildlife-based tourism, where input-output tables are unavailable, with time and financial resource constraints. The ranges of the derived direct multipliers for output, income, employment and value-added multipliers were 1.10–1.27, 0.04–0.20, 6.01–35.81 and 0.52–0.71, respectively. These estimated multipliers can be used in economic models for measurement of the economic impacts of protected areas is vital for planning and management purposes and for public understanding of wildlife resource values.
1. Introduction
In southern Africa, several countries such as Zimbabwe, Namibia, Botswana, Zambia and Mozambique have been practicing Community-Based Natural Resource Management (CBNRM), an institution aimed at promoting and empowering communal people with economic and social developments through sustainable use of wildlife (Mbaiwa & Darkoh, Citation2006; Stone & Rogerson, Citation2011). Typically, the economic impact assessment of PAs from these countries is assessed through costly alternatives such as the income generated and employment and business opportunities created by tourism. In countries where the economic impacts of PAs are well documented, the values of PAs are not only effectively used in planning and management of wildlife resources, but are vital in lobbying for budget support from governments (Eagles, Citation2014; Chidakel et al., Citation2021).
In Zambia, CBNRM programmes are generally practiced in PAs categorised as Game Management Areas (GMAs). Unlike in NPs, rural communities hold customary rights to land and are permitted to settle in GMAs. Both consumptive (trophy-hunting) and non-consumptive (photographic) tourisms are operative in GMAs, while in NPs only non-consumptive tourism is permitted (Simasiku et al., Citation2008; Lubilo & Child, Citation2010; Lindsey et al., Citation2014). Currently, tourism incomes generated in GMAs are shared between local communities and Department of National Parks and Wildlife (DNPW). Local communities’ income from tourism has been the basis for determining the socioeconomic contribution of NPs (Mupeta-Muyamwa, Citation2012; Simuchimba, Citation2022). Current sharing of tourism revenue provides 45% to Community Resource Boards (CRBs), 5% to CRB patrons (traditional chiefs), 40% to DNPW (formerly Footnote1ZAWA) and 10% to Zambia Revenue Authority. Hunting concession fees were allocated at 20% to GMAs and 80% to DNPW (Fernández, Citation2010; Lubilo & Child, Citation2010).
Zambian government identified tourism sector, which contributed approximately 3.0% to the Gross Domestic Product (GDP) in 2015, as an important strategic area for diversifying and developing the economy (MNDP, Citation2017). Despite the important role of tourism, and hence the importance of NPs, several analytical tools have been missing in various resource assessments that have been conducted in the past (Chidakel et al., Citation2021). Therefore, the main question for this study was how to estimate multipliers for wildlife-based tourism in the rural area of Zambia.
2. Methods
2.1. Research materials
To derive national tourism multipliers, we used data from Zambia’s I-O table for 2010 (Appendix-1), published by the Central Statistics Office (CSO) of Zambia (CSO, Citation2017). Included is a simplified version of 2010 I-O table, with only rows and columns of tourism-related sectors, rows for value-added and columns for final demand sections (Appendix-1). We have identified five out of 19 economic sectors that capture the use and supply of goods and services (products) as well as income generated from production related to wildlife-based-tourism. These sectors are as follows:
‘Wholesale-and-retail-trade;-repair-of-motor-vehicles-and-motorcycles’: Visitors’ spending on products and services from wholesale and retail shops, souvenir shops, roadside sales, etc. was particularly captured in this sector.
‘Transportation-and-storage’: Visitors’ spending on products and services related to all kinds of transportation means to and from their destinations was captured in this sector.
‘Accommodation-and-food-service-activities’: Visitors’ spending on products and services related to temporary homes for visitors to NPs was captured. Accommodation and food services ranged from simple places for eating and sleeping to deluxe suits (hotels, lodges, motels/motor hotels, resort hotels, campgrounds, hostels and guesthouses, as well as bars and restaurants).
‘Arts,-entertainment-and-recreation’: Visitors’ spending related to recreation, culture, and entertainment such as game viewing, tour guiding, boat cruises, trophy-hunting, etc., was captured in this sector.
‘Other-service-activities’: All other visitor spending on products and services which were not included in any of the above-mentioned sectors, were captured in this sector.
Other main sources of data are CSO publications (CSO, Citation2017) and include Zambia’s production percentages (p) for rural-areas (Appendix-2), Zambia’s labour-input coefficients, Zambia’s employment-output ratios and Zambia’s value-added output ratios (Appendix-3).
2.2. Research methods
Here, we re-scaled derived direct-coefficients, from Zambia’s I-O tables for 2010, to rural-area direct-coefficients by multiplying coefficients with a scalar vector of Zambia’s 2015 production percentages for rural-areas. We then estimated the converted wildlife-based output multiplier by summation of total-requirement-coefficients. Income-multipliers, employment-multipliers and value-added-multipliers were estimated as products between the derived total-requirements-coefficients and the respective sector-specific ratios. We then contextualised the estimated multipliers in terms of regional and economic levels and then discussed the meaning of our findings.
2.2.1. Economic frameworks for constructing multipliers
Economic frameworks for constructing multipliers include I-O models, SAM (Social Accounting Matrix) models, CGE (Computable General Equilibrium) models, TSA (Tourism Satellite Account) and Keynesian multiplier model. Studies apply these multi-sectoral models in assessments of tourism economic impacts, have been on an increase since the 1990s (Saayman et al., Citation2013; Frechtling, Citation2013; Van Wyk et al., Citation2015; Matilainen et al., Citation2016; Kronenberg et al., Citation2018; Tohmo, Citation2018). Relationships exist among some of these multi-sectoral models because their data are based on the System of National Accounts (Babatunde et al., Citation2017; Ferrari et al., Citation2018; Lin et al., Citation2020; Pedauga et al., Citation2022). Although some of the multi-sectoral models may play different roles in provision of insights into the economics of tourism to policy makers, they are all-important and complementary in policy making (Pham & Dwyer, Citation2013). Below we give brief descriptions of these multi-sectoral models and discuss their limitations in measuring the economic contributions of tourism (Frechtling, Citation2013; Van Wyk et al., Citation2015; Tohmo, Citation2018; Ferrari et al., Citation2022).
I-O model is useful for analysis of interdependencies between different sectors of the economy. However, it is limited in its ability to capture dynamic changes over time (Frechtling, Citation2013; Ivandić & Šutalo, Citation2018; Kronenberg et al., Citation2018; Tohmo, Citation2018; Lin et al., Citation2020). This model was chosen for this study because its ability to provide details of direct, indirect and induced effects for output-multipliers, income-multipliers, employment-multipliers and value-added-multipliers. It is also among the popular methods available for calculating tourism economic impacts (Saayman & Saayman, Citation2006; Miller & Blair, Citation2009; Van Wyk et al., Citation2015; Ferrari et al., Citation2018). Above all, during the study, it was the only national economic framework we could find.
CGE models capture economical interactions among different sectors, households and the government to determine what is produced. Its limitation, however, is that it requires massive amounts of data input and computational resources to represent all the sectors and their relationships for a single year (Frechtling, Citation2013; Van Wyk et al., Citation2015; Babatunde et al., Citation2017; Ghaith et al., Citation2021).
TSA is an analysis tool designed to measure direct economic contributions of tourism demand for a national economy. In this tool, there are a sets of inter-related tables that show different forms of tourism consumption in a country. Also, it shows their sizes and distributions, direct contributions to employment, GDP and other national macroeconomic measures. However, TSA’s secondary effect elements are not captured and also TSA fails to include most natural assets within capital accounts (Frechtling, Citation2010, Citation2013; Li et al., Citation2019; Odunga et al., Citation2020; Karim et al., Citation2021).
SAM models comprehensively provide frameworks that analyse the entire economies by capturing factors of production and flows of goods and services among different institutions, such as, business firms, households and the governments. The model can be elaborate on institutions’ purchase or supply of goods and services. However, there is no standard way of elaborating the models and the results are complicated and difficult to interpret (Frechtling, Citation2013; Muchapondwa & Stage, Citation2013; Ferrari et al., Citation2018; Phoofolo, Citation2018; Xue et al., Citation2019; Tchouamou Njoya, Citation2023).
2.2.2. Deriving national coefficients from I-O table
We derived wildlife-based-tourism economic multipliers from Zambia’s 2010 I-O table since it was the only comprehensive source of data available. The eventual applications of derived multipliers in economic analyses need to consider the conceptual limitations of I-O multipliers. Generally, applications of I-O multipliers in economic analyses are perceived to be affected by factors of production in economies. These factors of production include the following: (i) dependence on availability of appropriate labour, capital and or productive inputs; (ii) relative price changes, changes in production technologies, and income changes; and (iii) budget constraints (Gretton, Citation2013).
To construct I-O multipliers, we first derived technical or direct-coefficients from Zambia’s I-O tables (). A matrix of national direct-coefficients (‘matrix A’) represents a structure of production for an economy. This means that production functions of each productive sector, i.e. tourism-related sector, are represented by columns of direct coefficients matrix. The total-requirements-coefficients, type-I coefficients (open Leontief-inverse-matrix), were computed through an inverse matrix conversion (Cassar, Citation2015). On the other hand, type-II coefficients (closed Leontief inverse matrix) were calculated with an extra row and column added, into the direct requirements matrix, for ‘compensation of employees’ and for ‘final consumption expenditure by households’, respectively (d’Hernoncourt et al., Citation2011).
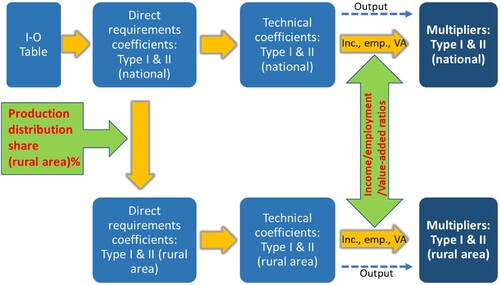
Figure 1. Flow diagram showing steps taken to estimate rural-area multipliers.
2.2.3. Deriving rural-area coefficients
We used Zambia’s production contribution percentages for rural-areas (p) (CSO Citation2016a, Citation2016b) to re-scale national direct-coefficients to rural-area level () according to a method described by Saayman & Saayman, (Citation2006) and Miller & Blair (Citation2009). In the absence of evidence of production in rural-areas, an assumption was made that producers in rural areas used same production technologies as producers at the national level. This assumption was based on the reason that national economic coefficients are averages of rural-area and urban area economic coefficients and nearly all the wildlife-based tourism activities in Zambia are in rural-area region. The Zambian economy is also largely agrarian by nature. More than two-thirds of rural population engage in small-scale farming activities as their main occupation and, farming alone stands at more than 70%, on average, compared to other livelihood activities (Kapesa et al., Citation2015; Mulungu & Ng’ombe, Citation2017; Phiri et al., Citation2020).
Although the mining and quarrying sector in Zambia contributes between 13% and 15% to GDP, which is more than the agriculture sector’s contribution (Unceta, Citation2021), most major copper mining companies are located in urban towns of Copperbelt province (Mwitwa et al., Citation2012). This means that production percentage share of mining is accounted for on the urban area share of the national I-O table. However, relatively new large-scale copper mining companies have been established in rural-areas of North-western province such as Lumwana and Kalumbila Mines (Mhone, Citation2019). In these rural-area mining towns, the production percentage share towards I-O table is expected to be relatively higher than the national rural-area average.
The derived national direct-coefficients matrix (matrix A) was modified to matrix to reflect production matrix for rurally produced goods and used to translate rural-area final demands into outputs of rural-area firms (
) (). In Equationequation 2
(2)
(2) below, subscript i, denoted ‘sector i’, was used in same way as superscript r to designate ‘rural-area’ (Miller & Blair, Citation2009):
(1)
(1)
(2)
(2) where
is rural-area direct-coefficients,
is proportion of total amount of good i available in region r was produced in r (rural-area production contribution percentage of good i) (Miller & Blair, Citation2009).
With all its diagonal elements equal to 1 and all its other elements equal to 0, a matrix ‘I’ of same number of rows and columns as -matrix was developed, and a new matrix (
) was calculated (Khanal, Citation2011; Raabová, Citation2014). Matrix inversion function was applied to calculate the open Leontief-inverse-matrix
. The closed (truncated) Leontief-inverse-matrix
, with an extra row and column on
-matrix, was calculated in a comparable way. The open and the associated closed Leontief-inverse-matrices are shown below (Miller & Blair, Citation2009):
(3)
(3)
(4)
(4) The open and closed Leontief-inverse-matrix models are the basis for deriving type-I and type-II multipliers, respectively.
2.2.4. Estimating output, income, employment and value-added-multipliers
With reference to , we found type-I output-multipliers () by aggregating type-I total-requirements-coefficients of Leontief-inverse-matrix across rows (Raabová, Citation2014):
(5)
(5) The type-II output-multipliers (
) were estimated by aggregating type-II total-requirements-coefficients of the Leontief-inverse-matrix across the rows:
(6)
(6) We obtained type-I and II income-multipliers by multiplying labour-input coefficients (Appendix-4) – in monetary terms – with rural-area type-I and type-II total-requirements-coefficients of Leontief-inverse-matrix, as shown below:
(7)
(7)
(8)
(8)
(9)
(9) where
represents row vector of Zambia’s labour-input coefficients (Appendix-4) such as salaries or wages which are earned per unit of output (d’Hernoncourt et al., Citation2011). The elements of the vector of labour-input coefficient reflect initial direct-effect on labour income which is generated in response to an additional dollar (or other currency) of final demand for each sector (Cassar, Citation2015; CSO, Citation2016b).
To obtain physical employment-output-multipliers we assumed that levels of employment within a sector were proportional to the amount of its gross output generated (Raabová, Citation2014; Cassar, Citation2015). By multiplying employment-output ratios with type-I and II Leontief-inverse-matrices, employment or jobs multipliers (e) were obtained as shown below (Cassar, Citation2015):
(10)
(10)
(11)
(11)
(12)
(12)
Where represents the row vector of Zambia’s employment-output ratios (Appendix-4). These ratios were derived by dividing number of people (average) in employment per sector during year of 2015Footnote2 by amount of gross output generated by sector (Cassar, Citation2015; CSO, Citation2016b). The elements of the vector of employment-output ratios reflect the initial direct-effect for jobs created due to an additional million dollar (or other currency) of final demand for each sector.
We obtained type-I and II value-added-multipliers by multiplication of value-added coefficients with open and closed Leontief-inverse-matrices, as shown below:
(13)
(13)
(14)
(14)
(15)
(15)
Where represents the row vector of Zambia’s value-added output ratios (Appendix-4). The value-added output ratios were derived by dividing average value-added per sector during the year of 2015Footnote3 by total output generated (Cassar, Citation2015; CSO, Citation2016b).
2.2.4. Limitations of the methodology
Study limitations included non-availability of rural-area I-O tables and the asymmetry between year 2010 (year with available I-O table) and year 2015 (year with more other data sources). Therefore:
− The mismatch between availability of data for I-O table (2010) and other data sources (2015) may introduce potential inaccuracies due to temporal differences.
− The adjustment of I-O table may not fully reflect economic changes over these five years.
− The rescaling of rural coefficients from national multipliers could introduce conversion errors.
− The assumption that rural-areas use same production technologies as national average might not capture regional disparities.
3. Results
3.1. Derived direct-coefficients
The direct-requirements coefficients for Zambia’s wildlife-based-tourism derived from Zambia’s I-O tables for 2010 are shown in and . shows a simplified derived type-I direct-coefficients (matrix A) while shows a simplified derived type-II direct-coefficients (matrix A). Close observation indicates that the sector with the highest values for direct-coefficients was ‘Other-service-activities’ output with input from ‘Transportation-and-storage’ sector (0.1512). And the sector with the lowest value was ‘arts, entertainment’ output with inputs both from its own sector (0.0000) and from ‘Other-service-activities’ sector (0.0000).
Table 1. Type I direct requirements coefficients (A – matrix) derived from Zambia’s 2010 I-O Table – a simplified format showing only tourism related sectors on both rows and columns.
Table 2. Type II direct requirements coefficients (A – matrix) derived from Zambia’s 2010 I-O Table – a simplified format showing only tourism related sectors on both rows and columns.
3.2. Derived rural total-requirements-coefficients and estimated 2015 output-multipliers
We re-scaled the national 2010 direct-coefficients (matrix A) for both type-I and type-II ( and ) into rural-area 2015 equivalent direct-coefficients (matrix). We then converted the re-scaled rural-area type-I and type-II direct-coefficients to total-requirement-coefficients (open and closed Leontief-inverse-matrices) ( and ). The aggregation of total-requirement-coefficients across the rows gives values of 2015 equivalent rural-area output multipliers for respective sectors.
Table 3. Type I Total requirements coefficients for rural area – a simplified table showing only tourism related sectors on both rows and columns.
Table 4. Type II Total requirements coefficients for rural-area – a simplified table showing only tourism related sectors on both rows and columns.
shows estimated wildlife-based 2015 rural-area output-multipliers as type-I (including direct and indirect-effects), type-II (including direct, indirect and induced-effects) and induced-effects (difference between type-I and type-II multipliers). The derived data indicate that, for example, ‘Other-service-activities’ sector had higher type-I and type-II output-multipliers than other sectors at 1.269 and 1.328, respectively. The induced-effects were higher than other sectors in ‘arts, entertainment’ sector at 0.077.
Table 5. Zambia’s 2015 rural area Type I and Type II output multipliers – a simplified table showing only tourism related sectors on rows.
3.3. Estimated 2015 income, employment and value-added multipliers
shows estimated wildlife-based 2015 rural-area income-multipliers as type-I, type-II, direct-effects, indirect-effects and induced-effects. For example, indicates ‘accommodation and food’ sector had higher type-I and type-II income-multipliers than other sectors at 0.20 for both and the induced-effects were calculated at 0.002. Similarly, also shows estimated wildlife-based 2015 rural-area employment-multipliers. For example, the ‘Other-service-activities’ sector had higher type-I and type-II income-multipliers at 35.8 and 38.1 jobs per million kwachas of increased final demand, respectively, giving a higher induced-effects than other sectors at 2.2 jobs per million kwachas of increased final demand. And also, shows estimated wildlife-based 2015 rural-area value-added-multipliers. The ‘wholesale and retail’ sector had higher type-I and type-II value-added-multipliers than other sectors at 0.71 and 0.72, respectively, giving a relatively lower induced effects than other sectors at 0.01.
Table 6. Zambia’s 2015 rural area Type I and Type II income, employment, and value-added multipliers for tourism economy.
A summary of the estimated rural-area wildlife-based-tourism multipliers of Zambia for 2015 is outlined in .
Table 7. Estimated Zambia’s rural-area wildlife-based tourism multipliers for 2015.
3.4. Examples of other multipliers from Zambia and other countries
A literature review was conducted to seek more information on multipliers published previously from other sectors and regions of the world. The data obtained in the period ranging between 1967 and 2010 showed output-multipliers, income-multipliers, employment-multipliers and value-added-multipliers for tourism and ‘general’ (average of all sectors) sector ranging between 0.458 and 5.112 (). The output multipliers (sales) and value-added-multipliers were generally found to be within the range of Zambia’s multipliers, while employment-multipliers and income-multipliers were out of range.
Table 8. Examples of other multipliers from Zambia and other countries.
4. Discussion
As a way of performing an economic impacts analysis of tourism in rural Zambia, one could use generic multipliers developed from other countries. The inherent errors could, however, be large because of differences in economic attributes between Zambia and the country of origin for generic multipliers (Muhanna, Citation2007). One could also consider conducting regional surveys on tourism economic activities to obtain multipliers for a specific geographic region, but cost involved and time requirement are always prohibitive (Stynes et al., Citation2000; Huhtala et al., Citation2010; d’Hernoncourt et al., Citation2011; Chidakel et al., Citation2021). For example, the study conducted by Chidakel et al., (Citation2021) applied direct-effects, in economic impact analysis, which are considered as more reliable than multiplier effects, especially when multiplier effects are model-based. However, generalisation of results from this type of approach is necessarily limited in respect of tourism outlays and attributes of local populations’ support level of economic activity in a specific local area. The derivative methodology in this study, however, was done at a relatively low cost since it was a desktop study using existing information. The results obtained through this methodology can be applied to any PA within rural area region of the country. Also, the inherent errors could be as small as possible given that the study used the latest Zambian I-O table published in 2010.
4.1. National direct-requirement-coefficients
The national direct-requirements-coefficients in and , derived first, outlined the difference between type-I and type-II with the inclusion of the households’ column and compensations’ row within the matrix of technical coefficients of type-II. A direct coefficient may be described in dollars (or other currency e.g. kwacha) as value of input required to produce $1 (or kwacha-equivalent) worth of a particular output from sources within the region (d’Hernoncourt et al., Citation2011). In this study, derived direct coefficient values in the ‘compensation’ row and in ‘household’ column were varied but with the highest coefficients falling in ‘arts, entertainment’ sector and ‘wholesale and retail’ sector, respectively. This difference in coefficients between type-I and type-II provides the basis for determining induced-effects of tourism businesses that are captured as wages and salaries, proprietor’s income and employee benefits.
4.2. Total-requirements-coefficients
The total-requirements-coefficients (type-I and type-II) for rural Zambia were adjusted to 2015 because of more supporting data (). Type-I and II coefficients () served as basis for calculation of our first derived type-I and II output-multipliers with consideration of direct and indirect-effects of multipliers.
4.3. Rural output-multiplier
A closer observation of showed type-I output-multipliers ranging between lowest value in ‘wholesale and retail’ sector with 1.102 and highest value in ‘Other-service-activities’ sector with 1.269. The results also showed, both type-I and type-II, output-multiplier was higher in ‘Other-service-activities’ sector than in other four tourism-related-sectors. Values for both type-I and II rural-area output-multipliers ranged between 1.102 and 1.328 (), a range, which was within the range of other output-multipliers applied in other southern African countries (). For example, a study conducted in South Africa on domestic tourist expenditure applied a slightly higher output-multiplier of 1.96 (Kirchner et al., Citation2000). In a study by Bocoum & Labys (Citation1993), recreation and cultural output-multipliers, which they adapted from mining multipliers, ranged between 1.7 and 2.3. These multipliers were found to be slightly higher than the average of our derived rural output-multipliers but within the range of our derived national output-multipliers. also showed a combination of direct, indirect and induce effects of tourism activities (for Zambia) captured much more in ‘Other-service-activities’ sector than other tourism-related-sectors. However, the induced-effects alone are higher in ‘arts, entertainment’ sector than other tourism-related-sectors, which also means that more tourism benefits to rural region of Zambia are accrued in this sector than any other. As already observed, when difference between direct-effects and indirect-effects of tourists’ spending activities is comparatively small, then it is more likely more visitor spending could be escaping local region as leakage (Stynes, Citation2001; Saayman et al., Citation2013; Cook, Citation2013; Cullinane Thomas & Koontz, Citation2016). This does not conflict with other studies, which suggest that vast majority of secondary effects of tourism in rural-areas is accounted for by induced-effects (Stynes, Citation1997b).
4.4. Rural income-multipliers
Rural income-multipliers was the second set of type-I multipliers we derived ( and ) among other multipliers, and it ranged between lowest value in ‘Transportation-and-storage’ sector with 0.04 and highest value in ‘accommodation and food’ sector with 0.20. Though slightly higher, type-II rural income-multipliers ranged similar to type-I multipliers ( and ). This range, including range for derived national income-multipliers (Appendix-5), was lower than income-multipliers adapted from Zambia’s mining multipliers () (Bocoum & Labys, Citation1993). The difference between our deduced multipliers and the mining multipliers could be attributed to the fact that these two sets of multipliers represented different economic sectors and also the construction of the mining multipliers borrowed processing coefficients from the US national I-O table. Another attribute could be the possibility of an impact of error in the process of adapting multipliers from the US coefficients to Zambia’s coefficients due to differences in economies (Miller & Blair, Citation2009). However, the average range of our derived income-multipliers was also found to be within the range applied in a study from Namibia on recreational shore-angling fishery (), which used crude income-multipliers ranging between 0.7 and 1.1 (Kirchner et al., Citation2000). The values of the income-multipliers () show most of visitor spending in rural Zambia captured under ‘accommodation’ sector while at national level (Appendix-5), was captured under the ‘arts’ sector. With reference to direct, indirect and induced-effects (), it is also clear that most of tourism income in rural Zambia, captured as wages and salaries, proprietor’s income and employee benefits, is not much but in ‘accommodation’ sector for tourism businesses and in ‘arts’ sector for households. Ultimately, not much of income from tourists spending is being translated into personal income, jobs and creation of tourism value-added for households among rural-area regions of Zambia because of the possibility of leakage.
4.5. Rural employment multiplier
The third set of multipliers we derived was type-I rural employment or jobs multipliers, which ranged between lowest value under ‘arts, entertainment’ sector with 6.0 and highest value under ‘Other-service-activities’ sector with 35.8. Though slightly higher, type-II rural employment-multipliers ranged similarly to type-I multipliers as shown in and . Again, using the Zambia’s mining multiplier study by Bocoum & Labys (Citation1993) for comparison, we find mining sector employment-multipliers ranged between 1.0 and 2.0 (), which was much lower than the range of values we derived for both rural and national tourism-sectors. These differences in the ranges of values for the two sets of employment-multipliers could be attributed to the fact jobs from the mining sector in Zambia were generally higher paying than jobs from the tourism-sector, giving us a logical understanding of why tourism-sector created more additional jobs per million Zambian kwacha of output. However, and also show more direct tourism jobs in rural Zambia are in ‘other service’ sector, while at national level it is in ‘accommodation’ sector, which is same sector with more indirect jobs in rural Zambia. and again indicate the economic sector impacting households with most jobs in rural Zambia is the ‘arts’ sector followed by ‘other service’ sector. Conventionally, induced-effects multiplier computations assume jobs created by additional spending in a local area are new jobs and involve new households (Stynes, Citation1997b; d’Hernoncourt et al., Citation2011).
4.6. Rural value-added multiplier
Subsequently, type-I value-added multiplier of rural Zambia was estimated and it ranged between lowest value under ‘Transportation-and-storage’ sector with 0.52 and highest value under ‘wholesale and retail’ sector with 0.71. Though slightly higher, type-II rural value-added-multipliers ranged similarly to type-I multipliers as shown in and . For example, in 2001 a study on tourism and income distribution in East Africa reported value-added-multipliers in Tanzania ranging between 0.458 and 0.785 for direct multipliers and between 0.154 and 0.468 for indirect multipliers () (Blake, Citation2008). The results confirm that our derived value-added-multipliers were within range of multipliers from other African countries. Again, it is clear that at rural-area level, higher value-added is obtained under ‘wholesale’ sector while at national level it is obtained under ‘accommodation’ sector ( and ). The value-added multiplier is the commonly used measure of sector contribution to gross national or gross state product – through personal income plus rents and profits, plus indirect business taxes (Stynes et al., Citation2000). In the analysis, both at rural-area level and national level (Appendix-5), there was not much clear difference between the derived type-I and type-II multipliers for all the tourism-related-sectors. This means that households as induced-effects at local levels capture not much of tourism spending activities.
Generally, benefits of rescaled rural-area multipliers quantify economic impacts at a local rural-area rather than national multipliers that quantify impacts at a national level. It is known fact that our adjustment of I-O table from 2010 to 2015 may not fully reflect economic changes over these five years. For example, annual visitor arrivals to national parks in Zambia between 2010 and 2015 were increasing at an average percentage of 8.9%, above global growth rate, but there was a 13.8% reduction of tourist arrivals from 2010 to 2011 which could be attributed to world economic recession experienced at time (Papatheodorou et al., Citation2010; Eugenio-Martin & Campos-Soria, Citation2014; MoTA, Citation2015). However, this adjustment seemed appropriate given that Miller & Blair (Citation2009) and Stynes (Citation1997a) argued that such adjustment over a five-year period would still produce sufficiently accurate I-O tables (Stynes, Citation1997a). And, some other studies have shown that I-O tables that are more than five years old have been used, for example, I-O table employed by Bocoum & Labys (Citation1993) was seven years old ().
By application of the derived tourism multipliers, internal and external leakage of tourism income, jobs, value-added, taxes, etc., from the tourism destinations, can be estimated (Stynes et al., Citation2000). The economic leakage of tourism revenue is broadly concerned with failure of tourists’ spending to remain in the destination economy (Sandbrook, Citation2010; Narangajavana et al., Citation2016; Simuchimba, Citation2022). Often, revenue generated by the tourism-sector is lost or leaked from the destination economy through several channels that may include: paying for goods-and-services outside the region, taxes or salaries of executives are not residents in the local region (Crompton, Citation2010; Chirenje et al., Citation2013). Generally, least developed countries and developing countries, like Zambia and small island countries, are more exposed to leakage than developed ones because of their local economies’ dependence on large number of imports (Supradist, Citation2004; Krause, Citation2012). Large-scale leakage is also perceived to be associated with externally controlled high-end, mass and luxury tourism impacting local economies with insignificant positive benefits (Sandbrook, Citation2010; Chirenje et al., Citation2013; Hampton, Citation2013).
5. Conclusion
Wildlife-based multipliers were estimated as products between derived total-requirements-coefficients and sector-specific ratios for output, income, employment and value-added respectively. This methodology is particularly useful for rural-area regions with active wildlife-based-tourism economy but the rural I-O tables are unavailable. This is also applicable to situations where time and financial resources necessary to conduct regional surveys on tourism activities are prohibitive. The estimated output, income, employment and value-added multipliers for rural Zambia ranged from: 1.10–1.27, 0.04–0.20, 6.01–35.81 and 0.52–0.71, respectively. The obtained results can be treated as estimates only and not as exact values of rural-area multipliers because their accuracy could have been impacted during the process of converting and adapting 2010 I-O table. This is a recommendation to the governments to update economic frameworks every five years if accurate estimates of wildlife-based multipliers have to be derived. In this view, this paper offers a methodological contribution only rather than using derived multipliers for actual gross economic impact assessments. However, the developed methodological is a contribution towards the improvement of economic models for impact assessments of protected areas (PAs) in several developing countries practicing CBNRM programmes.
Disclosure statement
No potential conflict of interest was reported by the author(s).
Additional information
Funding
Notes
1 ZAWA: Zambia Wildlife Authority
2 Labour-related data per sector for the year 2015 were provided by the Central Statistics Office (CSO) of Zambia.
3 The figures for the value-added per sector for the year 2015 were provided by the Central Statistics Office (CSO) of Zambia.
References
- Babatunde, KA, Begum, RA & Said, FF, 2017. Application of computable general equilibrium (CGE) to climate change mitigation policy: A systematic review. Renewable and Sustainable Energy Reviews 78, 61–71.
- Blake, A, 2008. Tourism and income distribution in East Africa. International Journal of Tourism Research 10(6), 511–24. doi:10.1002/jtr.702
- Bocoum, B & Labys, WC, 1993. Modelling the economic impacts of further mineral processing: The case of Zambia and Morocco. Resources Policy 19(4), 247–63.
- Cassar, IP, 2015. Estimates of output, income value added and employment multipliers for the Maltese economy. CBM Working Papers. https://www.econstor.eu/handle/10419/210811.
- Chidakel, A, Child, B & Muyengwa, S, 2021. Evaluating the economics of park-tourism from the ground-up: Leakage, multiplier effects, and the enabling environment at South Luangwa National Park, Zambia. Ecological Economics 182, 106960.
- Chirenje, LI, Chitotombe, J, Gukurume, S, Chazovachii, B & Chitongo, L, 2013. The impact of tourism leakages on local economies: A case study of nyanga district, Zimbabwe. Journal of Human Ecology 42(1), 9–16. doi:10.1080/09709274.2013.11906576
- Cook, PS, 2013. Impacts of visitor spending on the local economy: Big South Fork National River and Recreation Area, 2012. US Department of the Interior, National Park Service, Natural Resource, Fort Collins, CO.
- Crompton, JL, 2010. Measuring the economic impact of park and recreation services. National Recreation and Park Association. Texas A&M University, Texas.
- CSO, 2015. 2014 Labour force survey report. Central Statistics Office, Lusaka.
- CSO, 2016a. 2015 Living conditions monitoring survey (LCMS) report. Central Statistics Office, Lusaka.
- CSO, 2016b. National accounts gross domestic product (GDP) report 2014 & 2015. Central Statistics Office, Lusaka.
- CSO, 2017. 2010 supply, Use and input and output tables. Central Statistics Office, Lusaka.
- Cullinane Thomas, C & Koontz, L, 2016. 2015 National Park visitor spending effects: Economic contributions to local communities, states, and the nation. https://hero.epa.gov/hero/index.cfm/reference/details/reference_id/3449170.
- d’Hernoncourt, J, Cordier, M & Hadley, D, 2011. Input-output multipliers–specification sheet and supporting material, Spicosa project report [PhD Thesis, Université Libre de Bruxelles (ULB), Belgium; University of East Anglia]. https://hal.science/hal-03233439/document.
- Eagles, PFJ, 2014. Research priorities in park tourism. Journal of Sustainable Tourism 22(4), 528–49. doi:10.1080/09669582.2013.785554
- Eugenio-Martin, JL & Campos-Soria, JA, 2014. Economic crisis and tourism expenditure cutback decision. Annals of Tourism Research 44, 53–73.
- Fernández, A, 2010. Wildlife conservation in Zambia: Impact of game management areas on household welfare. Michigan State University, Michigan. https://search.proquest.com/openview/c9fba22a9348b700fbad44e5a98e004c/1?pq-origsite=gscholar&cbl=18750.
- Ferrari, G, Jiménez, JM & Secondi, L, 2018. Tourists’ expenditure in Tuscany and its impact on the regional economic system. Journal of Cleaner Production 171, 1437–46.
- Ferrari, G, Jiménez, JM & Zhao, Y, 2022. The statistical information for tourism economics. The National Accounts perspective. National Accounting Review 4(2), 204–17.
- Frechtling, DC, 2010. The tourism satellite account: A primer. Annals of Tourism Research 37(1), 136–53.
- Frechtling, DC, 2013. Issue Paper Series – The Economic Impact of Tourism: Overview and Examples of Macroeconomic Analysis. (World Tourism Organization (UNWTO), Ed.). World Tourism Organization (UNWTO), Madrid.
- Ghaith, Z, Kulshreshtha, S, Natcher, D & Cameron, BT, 2021. Regional computable general equilibrium models: A review. Journal of Policy Modeling 43(3), 710–24.
- Gretton, P, 2013. On input-output tables: Uses and abuses. https://apo.org.au/node/35866.
- Hampton, MP, 2013. Backpacker tourism and economic development: Perspectives from the less developed world. Routledge, Abingdon. https://www.taylorfrancis.com/books/mono/10.4324/9780203547304/backpacker-tourism-economic-development-mark-hampton.
- Huhtala, M, Kajala, L & Vatanen, E, 2010. Local economic impacts of national park visitors spending: The development process of an estimation method. https://jukuri.luke.fi/handle/10024/536058.
- Ivandić, N & Šutalo, I, 2018. The contribution of tourism to the Croatian economy: An IO approach. Ekonomski Pregled 69(1), 20–42.
- Kapesa, R, Mwitwa, J & Chikumbi, DC, 2015. Social conflict in the context of the development of New mining concessions in Zambia. Southern African Peace and Security Studies 4(2), 41–62.
- Karim, R, Shah, A, Ali, G, Ali, K, Ali, A & Shah, GM, 2021. Estimating the economic contributions of tourism sector by using tourism satellite account (TSA) in hunza-nager district of gilgit baltistan-Pakistan. Intern. J. Sci. Tech. Res 10(2), 216–29.
- Khanal, BR, 2011. An economic analysis of the Lao PDR tourism industry: A thesis submitted in partial fulfilment of the requirements for the Degree of Doctor of Philosophy in Economics at Lincoln University [PhD Thesis, Lincoln University]. https://researcharchive.lincoln.ac.nz/handle/10182/4487.
- Kirchner, CH, Sakko, AL & Barnes, JI, 2000. An economic valuation of the Namibian recreational shore-angling fishery. African Journal of Marine Science 22(1), 17–25. https://www.ajol.info/index.php/ajms/article/view/67600.
- Krause, L, 2012. The Economic Impacts of Fair Trade in Tourism.
- Kronenberg, K, Fuchs, M & Lexhagen, M, 2018. A multi-period perspective on tourism’s economic contribution – a regional input-output analysis for Sweden. Tourism Review 73(1), 94–110.
- Li, L, Li, J, Tang, L & Wang, S, 2019. Balancing tourism’s economic benefit and CO2 emissions: An insight from input–output and tourism satellite account analysis. Sustainability 11(4), 1052.
- Lin, P-P, Li, D-F, Jiang, B-Q, Yu, G-F & Wei, A-P, 2020. Evaluating the comprehensive impacts of tourism in Hainan by intergrating input-output model with MCDM methods. Technological and Economic Development of Economy 26(5), 989–1029.
- Lindsey, PA, Nyirenda, VR, Barnes, JI, Becker, MS, McRobb, R, Tambling, CJ, Taylor, WA, Watson, FG & t’Sas-Rolfes, M, 2014. Underperformance of African protected area networks and the case for new conservation models: Insights from Zambia. PLoS One 9(5), e94109.
- Lubilo, R & Child, B, 2010. The rise and fall of community-based natural resource management in Zambia’s Luangwa Valley: An illustration of micro-and macro-governance issues. In Community Rights, Conservation and Contested Land: The Politics of Natural Resource Governance in Africa. Routledge, Abingdon. pp. 202–226.
- Matilainen, A, Keskinarkaus, S & Törmä, H, 2016. The economic significance of hunting tourism in east Lapland, Finland. Human Dimensions of Wildlife 21(3), 203–22.
- Mbaiwa, JE & Darkoh, MK, 2006. Tourism and environment in the Okavango Delta, Botswana. Pula Press, Gaborone.
- Mhone, P, 2019. Socio-economic impacts of mining on local communities: The case of the Kansanshi mine in Zambia [PhD Thesis, University of Zambia]. https://dspace.unza.zm/handle/123456789/7191.
- Miller, RE & Blair, PD, 2009. Input-output analysis: Foundations and extensions. Cambridge university press, New York. https://books.google.com/books?hl=en&lr=&id=viHaAgAAQBAJ&oi=fnd&pg=PR24&dq=Miller,+R.+E.+and+P.+D.+Blair+(2009).+Input-output+analysis:+foundations+and+extensions&ots=gsAifAj-c_&sig=2VYmN5QbjuVnxnFTCJHsYLTcE2M.
- MNDP, 2017. 7th national development plan 2017–2021. Ministry of National Development Planning, Lusaka.
- MoTA, 2015. 2015 tourism statistical digest. Ministry of Tourism and Arts, Lusaka.
- Muchapondwa, E & Stage, J, 2013. The economic impacts of tourism in Botswana, Namibia and South Africa: Is poverty subsiding? Natural Resources Forum 37(2), 80–9. doi:10.1111/1477-8947.12007
- Muhanna, E, 2007. The contribution of sustainable tourism development in poverty alleviation of local communities in South Africa. Journal of Human Resources in Hospitality & Tourism 6(1), 37–67. doi:10.1300/J171v06n01_03
- Mulungu, K & Ng’ombe, JN, 2017. Sources of economic growth in Zambia, 1970–2013: A growth accounting approach. Economies 5(2), 15.
- Mupeta-Muyamwa, PC, 2012. Democratization of wildlife management: A comparative study of the community based natural resource management (CBNRM) programs in Botswana and Zambia. University of Florida. UMI Dissertation publishing, UMI 3585211, ProQuest LLC (2014), Parkway. https://search.proquest.com/openview/0d32ac15218270269865ad077c2d50fa/1?pq-origsite=gscholar&cbl=18750.
- Mwitwa, J, German, L, Muimba-Kankolongo, A & Puntodewo, A, 2012. Governance and sustainability challenges in landscapes shaped by mining: Mining-forestry linkages and impacts in the Copper Belt of Zambia and the DR Congo. Forest Policy and Economics 25, 19–30.
- Narangajavana, Y, Gonzalez-Cruz, T, Garrigos-Simon, FJ & Cruz-Ros, S, 2016. Measuring social entrepreneurship and social value with leakage. Definition, analysis and policies for the hospitality industry. International Entrepreneurship and Management Journal 12, 911–34.
- Odunga, PO, Manyara, G & Yobesia, M, 2020. Estimating the direct contribution of tourism to Rwanda’s economy: Tourism satellite account methodology. Tourism and Hospitality Research 20(3), 259–71. doi:10.1177/1467358419857786
- Papatheodorou, A, Rosselló, J & Xiao, H, 2010. Global economic crisis and tourism: consequences and perspectives. Journal of Travel Research 49(1), 39–45. doi:10.1177/0047287509355327
- Pedauga, LE, Pardo-Fanjul, A, Redondo, JC & Izquierdo, JM, 2022. Assessing the economic contribution of sports tourism events: A regional social accounting matrix analysis approach. Tourism Economics 28(3), 599–620. doi:10.1177/1354816620975656
- Pham, TD & Dwyer, L, 2013. Tourism satellite accounts and their applications in CGE modelling. In CA Tisdell (Ed.), Handbook of tourism economics (pp. 493–521). World Scientific, Singapore.
- Phiri, J, Malec, K, Majune, SK, Appiah-Kubi, SNK, Gebeltová, Z, Maitah, M, Maitah, K & Abdullahi, KT, 2020. Agriculture as a determinant of Zambian economic sustainability. Sustainability 12(11), 4559.
- Phoofolo, ML, 2018. Analysis of the economic impact of a disaggregated agricultural sector in South Africa: A social accounting matrix (SAM) multiplier approach [PhD Thesis, Stellenbosch: Stellenbosch University]. https://scholar.sun.ac.za/handle/10019.1/103492.
- Raabová, T, 2014. Economic Impact Calculator: Do It Yourself! Instituto de Arte y Teatro, Praga (Txekiar Errepublika). Eskuragarri Hemen: Https://Editorialexpress. Com/Cgibin/Conference/Download. Cgi. https://thinkcityinstitute.org/wp-content/uploads/2022/08/Czech-impact-model.pdf.
- Saayman, M, Rossouw, R & Saayman, A, 2013. The socio-economic impact of the Kruger National Park. Journal of Economic and Financial Sciences/JEF 6(2), 439–458.
- Saayman, M & Saayman, A, 2006. Estimating the economic contribution of visitor spending in the kruger national park to the regional economy. Journal of Sustainable Tourism 14(1), 67–81. doi:10.1080/09669580608668592
- Sandbrook, CG, 2010. Putting leakage in its place: The significance of retained tourism revenue in the local context in Rural Uganda. Journal of International Development 22(1), 124–36. doi:10.1002/jid.1507
- Simasiku, P, Simwanza, HI, Tembo, G, Bandyopadhyay, S & Pavy, J-M, 2008. The impact of wildlife management policies on communities and conservation in Game Management Areas in Zambia: Message to policy makers. Edited by CL Buus, World Bank, Lusaka. https://www.researchgate.net/profile/Sushenjit-Bandyopadhyay/publication/265448373_The_Impact_of_Wildlife_Management_Policies_on_Communities_and_Conservation_in_Game_Management_Areas_in_Zambia_Message_to_Policy_Makers/links/55140d2d0cf2eda0df303d8e/The-Impact-of-Wildlife-Management-Policies-on-Communities-and-Conservation-in-Game-Management-Areas-in-Zambia-Message-to-Policy-Makers.pdf.
- Simuchimba, G, 2022. Economic Valuation and Geographical Settlement Analysis of Protected Areas: Cases of Kafue and South Luangwa National Parks. https://scholar.sun.ac.za/bitstream/handle/10019.1/125931/simuchimba_economic_2022.pdf?sequence=1.
- Stone, MT & Rogerson, CM, 2011. Community-based natural resource management and tourism: Nata bird sanctuary, Botswana. Tourism Review International 15(1–2), 159–69.
- Stynes, DJ, 1997a. Economic impacts of tourism. https://citeseerx.ist.psu.edu/document?repid=rep1&type=pdf&doi=b070decac01b37f59fd1645bcd0fbc1f365329c2.
- Stynes, DJ, 1997b. Economic impacts of tourism: A handbook for tourism professionals. University of Illinois, Tourism Research Laboratory, Urbana, IL, 1–32.
- Stynes, DJ, 2001. Economic impact concepts. Michigan State University.[Online.] Available: Https://Msu. Edu/User/Stynes/Mirec/Concepts. Htm.[Accessed: 22-Apr-2016.].
- Stynes, DJ, PROPST, D, Chang, W-H & Sun, Y, 2000. Estimating National Park visitor spending and economic impacts. The MGM2 Model.(4.12. 2009) Available at: Http://Web4. Canr. Msu. Edu/MGM2/MGM2. Pdf.
- Supradist, N, 2004. Economic leakage in tourism sector. https://lup.lub.lu.se/student-papers/record/1329250/file/1329251.pdf.
- Tchouamou Njoya, E, 2023. Assessing the poverty impact of the COVID-19-induced tourism crisis in Tanzania: A social accounting matrix microsimulation analysis. Journal of Sustainable Tourism 31(3), 801–20. doi:10.1080/09669582.2021.2024552
- Tohmo, T, 2018. The economic impact of tourism in Central Finland: A regional input–output study. Tourism Review 73(4), 521–47.
- Unceta, RA, 2021. The economic and social impact of mining-resources exploitation in Zambia. Resources Policy 74, 102242.
- Van Wyk, L, Saayman, M, Rossouw, R & Saayman, A, 2015. Regional economic impacts of events: A comparison of methods. South African Journal of Economic and Management Sciences 18(2), 155–76.
- Xue, M-M, Liang, Q-M & Wang, C, 2019. Price transmission mechanism and socio-economic effect of carbon pricing in Beijing: A two-region social accounting matrix analysis. Journal of Cleaner Production 211, 134–45.
Appendices
Appendix 1: Zambia’s 2010 industry by industry input-output table (I-O) (in K millions) with only selected sectors included
Appendix 2: Production percentages for rural area sectors (rural-area share) in the national economy of Zambia for 2015
Appendix 3: Income, employment and value-added ratios for rural area sectors in the national economy of Zambia for 2015
Appendix 4: Direct requirements matrix with only selected sectors included (simplified)
Table