
ABSTRACT
In March 2019, the first ever act of terrorist violence in New Zealand was live-streamed on social media, making many social media users unwitting witnesses to the massacre on their devices. The Christchurch mosque attacks revealed a particular digital and emotional vulnerability embedded in the digital media infrastructure. The last words of the first victim soon transmorphed into #hellobrother that, as a digital artefact, participated in shaping the emotional landscape. Combining real-time digital media ethnography on Twitter with data science and computational tools, this multi-method study has two aims: first and foremost, to develop and apply new methodology for the study of unexpected, mediated events as they unfold in real time; second, to explore post-death digital artefacts through the concept of digital afterlife that we approach through two complementary perspectives, data afterlife (the technological) and data as afterlife (the emotional). Adopting a relational perspective, we further develop the concept, and highlight the constitutive role of data in the emotional dimension of digital afterlife arising from its capacity to enter affective arrangements. The methodological contributions include development of a conceptual and technological framework for conducting data science as ethnography and the introduction of Tweetboard, a novel artefact for investigating digital afterlife.
Introduction
In March 2019, New Zealand saw its first act of terrorist violence as two mosques in Christchurch were attacked. Using a portable GoPro camera, the perpetrator utilised the live-streaming technology of Facebook Live to broadcast the massacre in real time. Shot with a first-person camera angle familiar from first person shooter (FPS) games (see Hrehorová, Citation2019), the video shows the heavily armed perpetrator walking up to the Al Noor mosque where he is greeted with the welcoming words of ‘Hello, brother’. These were the last words of Haji Daoud Nabi, the first victim of the 51 people killed in the attacks. As the video circulated different platforms, the hashtag #hellobrother emerged as a solidarity symbol (Collins, Citation2004). While initially commemorating the first victim, #hellobrother soon stood to convey solidarity to the whole Muslim community.
Typically expressed by artistic illustrations, memes, and hashtags, solidarity symbols utilise the affordances and fluidity of digital spaces. They serve as tools of mourning (Mielczarek, Citation2018), bonding icons (Harju, Citation2019), and visual expressions of solidarity used to mobilise collective support (Pearce, Citation2020). Not restricted to violent death, solidarity symbols also emerge in the context of other tragedies where death is unexpected. However, contrary to many other solidarity symbols, #hellobrother presents as a unique instance as they represent the final words uttered and recorded at the time of violent death, shared live with the world.
The Christchurch massacre instantly turned into a hybrid media event (Sumiala et al., Citation2018; Sumiala & Valaskivi, Citation2018), and while terrorist violence seeks media attention (Cui & Rothenbuhler, Citation2018), newsrooms play a significant role in generating this attention (Valaskivi & Uusitalo, Citation2020) and in framing and recognising singular moments of violence as exceptional (Nossek, Citation2008). The formulaic representation of terror utilises established mnemonic schemes, situating these events within a larger temporal flow; these representations of terror contribute to the collective memory of how we understand terror (Zelizer, Citation2018). At the same time, public solidarity plays a role in co-constructing, negotiating and contesting the collective memory in the making (Giglietto & Lee, Citation2017; Harju, Citation2019; Payne, Citation2016).
In Christchurch, the temporality of livestreaming served to banalise the horror of the massacre, ‘enacting terror as a joint enterprise, co-produced through live audience interaction in the sharing economy’ (Ibrahim, Citation2020, p. 811). Not only did the everyday sharing practices contribute to turning terror into a media spectacle (and this includes the perpetrator), sharing has far-reaching material and affective consequences (Kennedy, Citation2018) that, in this case, exposed the inherent digital and emotional vulnerabilities of the networked digital media.
Visible in the logics governing social media (Klinger & Svensson, Citation2018; van Dijck & Poell, Citation2013), connectivity, speed, and algorithmic content curation (e.g. Kitchin, Citation2017) are favoured, and intrinsically linked to the re-organisation of social life at the service of capitalism (Couldry & Mejias, Citation2019). Newness and virality are valued as they elicit more engagement (and revenue), and emotionally charged content spreads rapidly (Goldenberg & Gross, Citation2020), including violent material (Sumiala et al., Citation2018). This is also the hallmark of the age of digital witnessing (Duncombe, Citation2020); the Christchurch massacre shows how the networked nature of social media not only helps disseminate and scale up terrorist violence, but also contributes to the construction of terrorist massacres as sites of spectacular death (Morse, Citation2020).
In this paper, we turn our gaze to data in exploring #hellobrother; moving beyond the representational, we approach solidarity symbols and other post-death data as digital artefacts (Ekbia, Citation2009; Leonardi, Citation2010, Citation2012) that in their socio-technical constitution depend on the platform-based digital communication infrastructure (Plantin et al., Citation2018; Plantin & Punathambekar, Citation2019) for their very existence, circulation, and meaning(s). The predetermined design choices (for example, algorithms) embedded in the infrastructure not only speak to specific ideologies and power structures, but also shape the flows of data and affects, and thus contribute to hierarchies and conditions of visibility (Bucher, Citation2012; Geboers & Van De Wiele, Citation2020). This has important consequences for the constitution of the emotional landscape surrounding disruptive events and the affective encounters that are made possible.
This study begins on the day of the attack, 15 March 2019, when the digital media ethnography on Twitter commenced together with the computational data collection as the event was still unfolding. In exploring the empirical data, we adopt the kind of network sensibility that foregrounds flow and movement in and around data, placing importance on the various entanglements and connections between data and people (Markham, Citation2017; Markham & Gammelby, Citation2018; Markham & Lindgren, Citation2014), encompassing the emerging relational affective arrangements (Slaby et al., Citation2019) that digital artefacts enter into and give rise to. Drawing inspiration from Lindgren’s (Citation2020) proposition of re-envisioning data science as a kind of ethnography, the two approaches intermingle in all research phases with close collaboration between the ethnographer and the data scientist. In line with the principles of digital methods, we make use of methods and data that are natively digital (Rogers, Citation2019).
The present study makes use of the large dataset of 12M tweets collected in the context of the Hybrid Terrorizing research project. The analysis draws on the combination of computational tools and visual analytics (Huhtamäki et al., Citation2015; Sumiala et al., Citation2016) with computationally augmented digital media ethnography, presented in this paper. We also introduce a particular computational visualisation of the Twitter data that was developed for this study: an interactive and ‘live’ Tweetboard. The empirical analysis of #hellobrother tweets serves an illustrative role that helps showcase the methodological contributions of this study, including the Tweetboard. The Tweetboard also functions as a facilitative boundary object (Fox, Citation2011; see also Star & Griesemer, Citation1989) between team members, bridging the different disciplinary traditions by representing the dataset as ‘live’ retrieved from the Twitter Application Programming Interface (API).
The aim of this multi-method study is two-fold: first and foremost, to develop and illustrate new methodological tools for the study of mediated, unexpected events in real time as they unfold; and second, to further develop the notion of digital afterlife by exploring post-death data from two complementary perspectives, data afterlife and data as afterlife, translating into the technological and the emotional dimension constituting digital afterlife. In addition to the methodological contributions, the study also has a theoretical contribution that highlights the integral role of data in enabling the emotional dimension of digital afterlife that arises from their capacity to enter affective arrangements.
Afterlife as digital traces of the emotional
In developing our conceptualisation of digital afterlife, we adopt a relational perspective to better capture the complexity of what essentially is a social phenomenon where the technological and the emotional intertwine. We draw on death studies in the fields of sociology and media studies, and bring this into dialogue with a data sciences perspective on the nature of data and digital artefacts. Death, data, and digital media have a complicated yet fascinating relationship that is not without research (e.g. Arnold et al., Citation2018; Christensen & Sandvik, Citation2014b; Christensen & Willerslev, Citation2016; Cumiskey & Hjorth, Citation2017; Hviid Jacobsen, Citation2020; Kasket, Citation2019; Mason-Robbie & Savin-Baden, Citation2020; Moreman & Lewis, Citation2014; Morse, Citation2018a; Sumiala, Citation2013). The multidisciplinary research field is rich in different approaches from post-mortem data privacy and data governance to explorations of digital memorials and symbolic immortality. This shows a growing interest in the inevitable and increasing relationship between death and data, between technology and human mortality.
Yet, the notion of digital afterlife (Mason-Robbie & Savin-Baden, Citation2020; see also Graham et al., Citation2013) nevertheless tends to refer to possibilities of extended memorialisation and the managing of grief in ways that offer continued presence in digital settings (Brubaker et al., Citation2013; Christensen & Sandvik, Citation2015; Harju, Citation2015; Wright, Citation2014), thus mainly focussing on the bereaved and the role of data and digitality in post-death social processes with little research on ‘the sociocultural and sociopolitical impacts’ (Mason-Robbie & Savin-Baden, Citation2020, p. 20) of digital afterlife. We argue, furthermore, that the socio-technical aspects of digital afterlife likewise remain undertheorised.
In our theorisation on digital afterlife, we draw on insights gained during the methodological development work and examine post-death data that emerges after terrorist violence; namely, data produced after and because of death, instead of existing, pre-death data, like inherited data (Eriksson & Hansen, Citation2017) or digital legacy or digital assets one leaves behind in death (Harbinja, Citation2017). The notion of digital afterlife as a continued ‘digital presence that may or may not continue to exist’ (Mason-Robbie & Savin-Baden, Citation2020, p. 12) makes no reference to the duration or persistence of digital presence (Savin-Baden, Citation2019). Building on this view, we propose a new approach that takes ‘data’ as the point of departure, and provide a more nuanced understanding of digital afterlife that, in addition to the socio-technical dimension, captures the emotional dimension through exploration of the affective potential of data and digital artefacts.
Emotion is significant in organising social life, and after terrorist violence, in the production of solidarity (Collins, Citation2004; Döveling et al., Citation2018) as well as boundaries between alignment and disalignment (Harju, Citation2019; Johansson & Laippala, Citation2020). In our view, there is no sharp division between emotion and affect (see also Ahmed, Citation2014), and like Fox (Citation2015, p. 302), we see emotion as being on ‘a continuum of affectivity that links human bodies to their physical and social environment’. Similarly, Slaby et al. (Citation2019, p. 5) emphasise affective relatedness; where emotion concerns the ‘consolidated patterns of affective relatedness viewed from the perspective of persons’ and how they articulate these, relational affect refers to the ‘dynamic situatedness and processes of becoming’ formative of people’s emotional orientations. Relational affect thus flows through social life, arising in various sociomaterial environments between and among people and things, producing affective arrangements.
Developed by Slaby et al. (Citation2019), affective arrangements are ‘heterogeneous ensembles of diverse materials forming a local layout that operates as a dynamic formation, comprising persons, things, artifacts, spaces, discourses, behaviors, and expressions in a characteristic mode of composition and dynamic relatedness’ (Slaby et al., Citation2019, p. 4). Digital afterlife, as we see it, is not only affectively charged, but also crucially linked to digital artefacts with roots in social life: as material constructs, artefacts become meaningful when embedded in social practices that are themselves infused with affects (see Reckwitz, Citation2012, Citation2016), for example, death-related rituals (Sumiala, Citation2013). Thus, the concept of affective arrangement is particularly useful for the examination of the affective dynamics between data and people in fluid digital spaces, more specifically, the mechanisms of its emergence and expansion.
Adopting this view, we see that digital artefacts do not simply mediate the emotional, but rather, are co-constitutive of the affective dynamics in the relational formations they enter into; our interest thus lies more with how digital artefacts are implicated in these affective arrangements productive of the emotional dimension of digital afterlife than what these emotions are. To illustrate, a #hellobrother tweet with an image of Haji Daoud Nabi functions as a solidarity symbol and a tool for mourning, having political meanings and socio-cultural relevance. As a digital artefact, however, it both constitutes and is constituted by its environment, it is relational to the point of being processual (see Ekbia, Citation2009), it is productive of affective relationality, embodying the modulating digital traces of the emotional landscape that surfaces after terrorist violence as well as actively shaping it.
The nested nature of digital artefacts
The data-driven approach of this paper turns our attention to data in the relational flows of digital afterlife and its affective dynamics. Despite ‘afterlife’ implying eternal existence, data have a life cycle and are not permanent or forever lasting, but like all material things, are subject to disappearance and decay (Pink et al., Citation2018). Conceptualising data, for example tweets and videos, as socio-technical artefacts helps seeing them as material constructs (Leonardi, Citation2010, Citation2012). The material properties (Pink et al., Citation2016), for example code, make them malleable, replicable and circulable, but also open to manipulation, erasure and deletion. Contrary to physical objects, digital artefacts are ambivalent and incomplete by design, and not stable (Kallinikos et al., Citation2013). Referring to their constructed nature, Kitchin (Citation2014, p. 4) notes how ‘data are not simply natural and essential elements that are abstracted from the world in neutral and objective ways and can be accepted at face value; data are created within a complex assemblage that actively shapes its constitution’. The technological, informational and social (see Lee et al., Citation2015) are thus different, yet co-constitutive dimensions of digital artefacts.
The platform ecosystem can be seen as an assemblage of nested digital artefacts; the ability of digital artefacts to enter into a relational matrix with other artefacts manifests in cross-platform relationality, as a tendency for nested arrangements between and among other digital artefacts. This can be observed very concretely when an image posted on Instagram is shared on Facebook before entering circulation on Twitter through sharing. Importantly, not only exhibiting functional relations, digital artefacts figure in relational formations with people by providing meeting points, where they also participate in the production of affective dynamics; post-death digital artefacts are thus crucial in producing conditions of possibility for the diverse affective arrangements forming after terrorist violence, mediated solidarity a case in point. Nestedness allows affective arrangements to expand through the platform-based digital communication infrastructure.
Digital artefacts, being embedded in socio-cultural practices, have the capacity to shape the process of organising (Leonardi, Citation2010). Linked to the structuring power of digital media platforms, the enabling role of digital artefacts extends to interaction (see Barns, Citation2019), thus organising sociality on a more fundamental level. Yet, digital artefacts also have political properties (see Winner, Citation1980) in the form of design choices that reflect the power structures governing their design and use, extending to the consequences of their deployment. In the context of digital media platforms, this is seen in the interlinkage of algorithms and the rise of ‘trending’ hashtags or dissemination of violent content, where the promotion of certain content over others (Gillespie, Citation2014) also shapes our social reality (e.g. Beer, Citation2017).
The same mechanisms drive affective responses among the audience as the circulation of emotional content is enhanced by the platforms, leading to ‘an amplification of the frequency and intensity of user exposure to emotions, and therefore of emotion contagion’ (Goldenberg & Gross, Citation2020, p. 318). It is thus crucial to recognise the political dimension in the design and use of technological artefacts (Lindgren, Citation2020) rather than treating these as merely neutral systems with only functional properties.
Methodology
There has been a growing interest in multi-method approaches that make use of data scientific methods and computational tools to enrich digital ethnographic analysis (Airoldi, Citation2018; Caliandro, Citation2018; Eriksson Krutrök & Lindgren, Citation2018; Ford, Citation2014; Joost Beuving, Citation2020; Lindgren, Citation2020; Marres, Citation2017; Marres & Gerliz, Citation2016; Rogers, Citation2019). Computational tools are versatile and offer valuable resources for qualitative analysis; for example, the multi-method approach for researching hybrid media events (see Sumiala et al., Citation2016) combines digital media ethnography with computational data collection, query, analysis, and visualisation.
In his recent book, Data Theory: Interpretive Sociology and Computational Methods, Lindgren (Citation2020, p. 149) notes that ‘computational techniques can be (re-)construed as new forms of ‘ethnographic’ methods’, referring to the difficulty of the notions of both ‘field’ and ‘data’ as these are continually shifting in contemporary datafied settings. Lindgren goes on to make a valuable point about data science as ethnography, and the need to re-envision computational methods as part of ethnographic enquiry. In the present study, the computational data collection was informed by ethnography, with the computational approach fully integrated also in the analysis.
When integrating ethnography with data science, it is particularly important to problematise the concept of data and which meanings become privileged when we use the terms ‘data’ or ‘big data’ (Markham, Citation2013), or ‘big social data’ (Olshannikova et al., Citation2017) when elaborating on the social dimension and purpose of big data. As argued by Vis (Citation2013), researchers become part of the process of making data when using APIs and computational data collection tools. With this in mind, both the collection and analysis of data in this study benefited from an iterative, back-and-forth process between different methodological traditions. The resulting methodological toolkit offers a fruitful window to the empirical case, and as Markham (Citation2017) notes, the ethnographer's understanding of the complexity of social life both counters and strengthens the computationally gathered data.
Research readiness
When researching suddenly erupting events, research readiness plays an essential role in the success of the research project. The somewhat grim research objective of the research group was to prepare for a terrorist attack. Researching unexpected events poses several methodological challenges; thus, the research infrastructure for data collection was set up in advance to ensure the team’s research readiness, the ability to begin the empirical phase at any given time.
As ‘a first draft of the present’ (Bruns & Weller, Citation2016), Twitter lends itself for early reporting (Murthy, Citation2011, Citation2012) of ‘massively shared experiences’, such as disasters and events (see Sarno, Citation2009, on Jack Dorsey). Therefore we developed a tailor-made collector software for collecting Twitter data, testing its earlier version in the context of the Strasbourg Christmas Market attack 2018 (see Sumiala & Tikka, Citation2020). The collector registers a set of search terms with Twitter that then feeds the collector a sample of the tweets (Wang et al., Citation2015) matching the search terms. The collector saves each tweet into our raw dataset for post hoc querying and analysis.
The preparatory process included the allocation of tasks among the research team as well as situation room exercises simulating a real event. This was done to ensure a smooth and continuous interaction and feedback between the ethnographer and the data scientist (see Joost Beuving, Citation2020), crucial in the frantic, real-time data collection phase, although equally essential in the subsequent phases of analysis and documentation. To further facilitate the interaction, we organised a series of applied data sprints (Munk et al., Citation2019; Venturini et al., Citation2019). In these intensive workshops, the research team worked together to meet collaboratively defined objectives. One of the data sprint streams focussed on #hellobrother. Jupyter Notebook and Tweetboard development was also conducted through data sprints, allowing the ethnographic identification of requirements beyond the #hellobrother investigation. In sum, research readiness involves putting in place practices and resources needed when the event suddenly breaks out.
Empirical material
Due to the nature of terror attacks, there was no prior warning as to when the data collection would commence. The time difference between Christchurch and Finland (where the research team is based) implied a delay in starting the collection of tweets. The attack began at 13.38 on Friday, 15 March 2019 local NZ time, when in Finland it was only 02.38. We started the collector around 8 o’clock in Finland with the first search terms, including the catch-many ‘christchurch’. The collector continued running until 17 September 2019.
The complete dataset consisting of 12M tweets was collected in conjunction with the larger research group. The 11,884,723 live-captured tweets include a total of 461,000 original tweets in various languages. The Twitter streaming API filters in tweets that include at least one of the search terms in either the live or original tweet. Due to the fast pace of real-time data collection, search terms were added ‘on the go’ as they emerged in the ethnographic field data.
To construct as complete a timeline as possible, we make use of the original tweets collected through retweets that were captured live. That is, a post hoc query is created to extract all the tweets, either live-captured or original, from the collected tweetset. The extracted tweetset includes the metadata found relevant for ethnographic investigation (timestamp, hashtags, users mentioned, user bio, user follower count). The inclusion of visual images and videos is made possible by the Tweetboard view. In addition to the query, preprocessing includes removing tweets that were sent before the attack. Repurposing (Rogers, Citation2019) original tweets allows us to build a proverbial time machine to circumvent both Twitter’s algorithms and its access mechanism when investigating content that has since been deleted. The final #hellobrother tweetset includes 43,659 tweets from 30,842 different Twitter users.
Digital media ethnography
In the digital era, ethnography can be viewed as ‘the study of cultural patterns and formations brought into view as we ask particular questions about the intersection of technology and people’ (Markham, Citation2017, pp. 5–6). In this study, digital media sites are not seen only as socio-cultural constructions or discursive spaces, but as what we call ethnographic data fields, relational arrangements of intersecting socio-technical artefacts, affective practices and people, and where #hellobrother acts as ‘the material propping and staging instrumental to the unfolding of affect’ (Slaby et al., Citation2019, p. 10) in specific, and varying, affective arrangements. These ethnographic data fields, as research sites, are products of computationally augmented ethnography (see also Postill & Pink, Citation2012). In mapping the digital flows around #hellobrother, we follow Markham and Lindgren’s (Citation2014, p. 6) thinking of ‘moving with and through the data’.
Tracing flows, the ethnographer moves between sites and platforms via links and embedded material that form nested structures. As noted by Lindgren (Citation2020), accepting the messiness and the complexities of cross-platform digital research (see Mäkelä et al., Citation2020) might yield unexpected details otherwise missed. Indeed, the tweetFootnote1 that first brought #hellobrother to the ethnographer’s attention did not contain the hashtag, but an illustration with ‘Hello brother’, shared by someone with low follower and tweet count residing in Canada (illustrating algorithmic curation):
The first victim of the terrorist attack in #Christchurch, New Zealand is seen standing by the door of the masjid. He is heard saying “Hello brother” to the gunman before he is brutally gunned down. His last word to his killer was “brother” #NewZealandTerroristAttack
Intensive ethnographic work on Twitter was carried out for four days, continuing in a more intermittent fashion for two weeks after the attack. Field notes include screenshots and hand-written notes. Collective ethnographic documentation using Facebook Messenger chat was updated continuously; as a PDF, it amounts to some 100 pages spanning the period of 15 March to May 2019, the notes for the first day alone comprising some 300 messages.
Computational data collection
While it might be tempting to believe that with computational tools it is possible to collect ‘complete’, or ‘all’, of the data, this is of course not true (boyd & Crawford, Citation2012; Marres, Citation2017; Wang et al., Citation2015). Computational methods are what we make of them, reflecting the choices and interpretations of the researcher (Vis, Citation2013); however, the different perspectives on data expand what the ethnographer is able to see, complementing the ethnographer’s subjective position in mapping the phenomenon (Markham & Lindgren, Citation2014).
In this study, based on a real-time (vis-à-vis the terror attack) and simultaneous digital media ethnography, search terms were added to the computational collector as they emerged on Twitter. Defining the query is a core part of doing digital methods (Rogers, Citation2019), particularly important when constructing large tweetsets: at the time of this research, saving tweets in real time was the only ‘free of charge’ option.Footnote5
Adding technical lingo, the tailor-made tweet collector was built in Python using the Twython package (version 3.7.0). The collector connects to the Twitter Streaming API. Streaming refers to a filtering-based data processing paradigm where the collector registers a set of query terms to the data source (here, Twitter) to receive a real-time flow of data (here, tweets) for processing and analysis. The collector saves the tweet stream to a database for post hoc querying, processing, and analysis. Twitter Streaming API provides up to 180,000 tweets per hour. We used a document-based database MongoDBFootnote6 to manage the collected data because it allows storing and expressive querying of data in hierarchical JavaScript Object Notation (JSON) format that Twitter uses to represent tweets for computational consumption.
To ensure the running of the collector, a dedicated cloud server instance was created and tested as part of ensuring research readiness, and the status of the collector service was constantly monitored by the data scientist. On the day of the attack, the collected stream constantly hit the hourly 180,000 tweet limit, further highlighting that our tweetset does not contain all the relevant data. The final tweetset was collected using several search terms; those spelled together also pick up hashtags. Using words as search terms allows collecting tweets that include the search term without being a hashtag. In particular, ‘christchurch’ served as a broad search term that allows collecting tweets for more specific post hoc querying.
By the end of the day (15 March 2019) in Finland, we were collecting data with the following search terms: christchurch, christchurchmosqueattack, christchurchshooting, christchurchattack, JeSuisChristchurch, PrayForChristchurch, Al Noor, mosque shooting, mosque massacre, BrentonTarrant, NewZealandShooting, JeSuisHuman, JeSuisMuslin, HelloBrother, NewZealandTerroristAttack and NewZealandStrong, including a human error (a typo) in JeSuisMuslin. Search terms were based on the simultaneous ethnographic fieldwork on Twitter. Organically emerging hashtags and those trending were included. The ethnographer first noticed #hellobrother 15 March 2019, at 22.17 (local Finnish time) and informed the data scientist at 22.22 via Messenger chat, upon which this was added as a search term.
To cope with the delay between the event and the time we were able to define the first search criteria and start the collector, we make use of the Twitter retweeting mechanism. Each retweet includes detailed metadata about the retweet itself, but also about the original tweet. This metadata includes a full set of details (the text, sender, number of likes and retweets) for the original tweet. To make the most of these original tweets and the live-captured tweets, we compiled the final #hellobrother dataset by aggregating original and live-captured tweets. After computational collection, the empirical data needs to be sorted, organised, and cleaned. These steps amount to more than simple sorting of data, and configure in the analysis.
Computational data analysis
We use computational data analysis to refer to the use and development of code for collecting, refining, transforming, querying, sorting, and (re)representing data (see Flyverbom & Murray, Citation2018). We draw inspiration, techniques, and methods from information visualisation (Card et al., Citation1999), visual analytics (Keim et al., Citation2010), and data science (Halford & Savage, Citation2017; Lindgren, Citation2020; O’Neil & Schutt, Citation2013) to develop the computational data analysis framework for this study. All of these approaches stress the importance of an exploratory and iterative process that allows for creating a shared understanding of the objectives of the inquiry and the transparency of the decision that are embedded in the computational processes.
Before visualisation, data must be brought into a suitable format that enables the analysis and the creation of visual representations. This preprocessing is referred to as data wrangling (Kandel et al., Citation2011; Mäkelä et al., Citation2020). In addition to developing code for producing tailor-made views into the data – importantly, the Tweetboard that represents the #hellobrother tweets in the order we define with authentic appearance – we were forced to spend a lot of time and effort in building our own digital infrastructure for the analysis.
Strategies to take turns between visual and ethnographic inquiry include ‘overview first, zoom and filter, then details-on-demand’ (Shneiderman, Citation1996) and ‘start with what you know, then grow’ (Heer & boyd, Citation2005). In terms of enriching the ethnographer’s qualitative inquiry, using tailor-made code for querying (Rogers, Citation2019) the dataset of collected tweets, we were able to bypass Twitter’s algorithms and represent the data in meaningful ways by sorting and refining the data in accordance to research questions. As research team members see different, algorithmically curated content when following the same event on the Twitter platform, computationally collected data provides a complementary view on the empirical phenomenon. Ultimately, interpretation still lies in the hands of the researcher; if anything, moving through data and analysing the different elements of networks ‘generate more data, more directions, and more layers of meaning’ (Markham & Lindgren, Citation2014, p. 37).
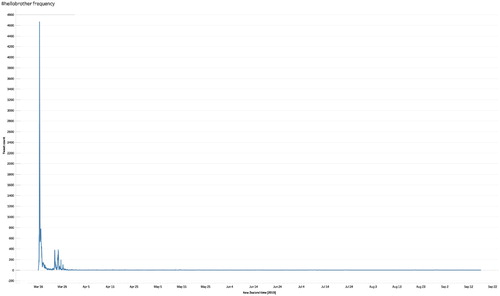
The representations retrieved from the Twitter API serve the data ‘as it is’ at the time of retrieval. Moreover, collecting data in real-time means that the deleted data (tweets or user accounts) is also available for investigation later on. This allows us to augment the ethnographic analysis with exploratory data visualisations (Procter et al., Citation2013) that include timelines (), bar charts for exploring distributions, and network views enabling the exploration of actors and their interaction-based connections that accumulate into a sociogram of actors (Freeman, Citation2000; Huhtamäki et al., Citation2015) that appear in the #hellobrother dataset.
Figure 1. The hourly frequency of #hellobrother shows the acceleration and disappearance (i.e. death of the signal) of the symbolic artefact. The great majority of tweets (more than 25,000) were sent on 16 March 2020.
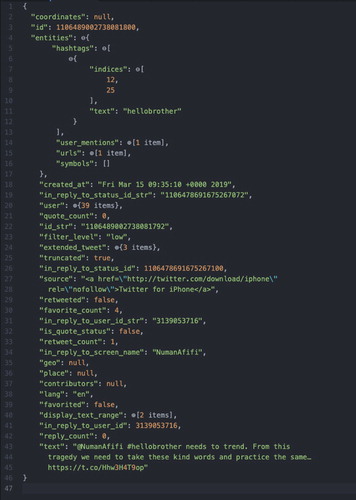
To manage the dataset of 12M tweets, each represented as a JSON object with detailed metadata (), we make use of MongoDB’s aggregation pipeline that allows the creation of data extracts including the necessary tweet metadata fields. For compiling the #hellobrother dataset, we make use of two types of aggregation mechanisms, one implemented in MongoDB and the other in Python using the Pandas library. The former creates an extract of the 12M tweets with key metadata fields (the time the tweet was sent, sender, tweet text, users mentioned, hashtags). These details are extracted both for live-captured tweets and the original tweets they potentially include, and indexed to enable keyword search. This data extract is then queried as part of a Jupyter Notebook that takes care of the compilation of the #hellobrother tweetset. Finally, the original tweets and live-captured tweets are separated in the notebook with Pandas, forming the final set of tweets.
Figure 2. The JSON representation of the ‘#hellobrother needs to trend’ tweet demonstrates that the majority of data is not present at the surface, highlighting the importance of increasing data understanding as means to identify opportunities to elaborate and extend the investigation.
Four main (re)representations were used to provide an overview of the #hellobrother dataset and access to individual tweets. First, the Python code produced for the analysis and its outputs are presented as Jupyter Notebooks. Notebooks are assemblages of regular text, code, data listings, and visualisation views (Perez & Granger, Citation2015). Second, data was transformed into tabular representations and exported as spreadsheets for row-by-row scrutiny. Third, a tailor-made visual interface was developed to support ethnographic analysis; the Tweetboard, a novel artefact, emerged as the main view to the #hellobrother tweetset. Fourth, a notebook was created to construct a network representation based on user mentions in individual tweets (Huhtamäki et al., Citation2015).
Python package NetworkX was used to create the network data that was exported to network exploration and visualisation platform Gephi (Bastian et al., Citation2009) for further analysis. Tweetboard representing a timeline of the first 100/1000 tweets turned out to be the most useful view supporting ethnographic analysis. The network view augmented the ethnographic analysis by offering a helicopter view that allowed observing structural patterns in the network as well as providing the means to navigate the data with a social lens.
Analysing data
The computationally augmented digital media ethnography essentially includes various visualisations, one of which is the analytical tool, Tweetboard (see ). Much of the analytical power of Tweetboard lies in its capacity to expand the scope and reach of data for qualitative analysis that includes access to data beyond the collected dataset of tweets, in addition to representing the data in a user-friendly manner, thus facilitating qualitative analysis. We will next offer a formative analysis of the #hellobrother tweets that illustrate the suitability of the method for a detailed empirical study; due to space restrictions, the empirical examples serve an illustrative role, also in terms of theorising digital afterlife later on in the paper, and the role of digital artefacts in its constitution.
Augmenting the ethnographic analysis of data flows with computation: exploring data as digital afterlife
Visualisations of data are an important part of the analysis as they represent the data in different ways allowing the augmentation of investigators’ knowledge (Keim et al., Citation2010), the observation of patterns in the social structures, and the sharing of findings with others (Freeman, Citation2000). Going into the investigation, the data scientist anticipated that Jupyter Notebooks would serve as the primary augmentation tool and a boundary object between members of the team (see Knuth, Citation1984; Perez & Granger, Citation2015; Rule et al., Citation2018). However, Tweetboard, a seemingly simple visualisation of the #hellobrother tweetset, emerged as the most useful option (see Sein et al., Citation2011) to support the ethnographer in ‘moving with and through the data’ (Markham & Lindgren’s, Citation2014, p. 6), illustrating the potential of boundary objects ‘to both analyse and facilitate adoption of an innovative idea, product or technique’ (Fox, Citation2011, p. 72).
Whereas the two other main data (re)representation options, Jupyter Notebooks and spreadsheet-based listings, are very data centric (showing the individual details of each tweet, thereby increasing data understanding), Tweetboard presents the tweets ‘live’, in a similar fashion as they appear on Twitter. Moreover, we are able to query, filter, and order the tweets in a way that best supports the ethnographic investigation and bypass Twitter when compiling different views. The computational approach allows us to augment individual tweets, too, by adding contextual details (user’s bio and image, follower count, and number of retweets).
The Tweetboard compilation process was conducted in two parts. First, to enable the re-representation of each tweet in their ‘live’ form, we repurposed Twitter’s oEmbed APIFootnote7 to collect tweet representations that allow embedding them (Henderson et al., Citation2020) into a hypertext document. Second, tweets were sorted into two different Tweetboards, chronological order and descending retweet count order. The Tweetboard displays the tweetset as an interactive interface, showing tweets that are still ‘live’ in the form of embedded tweets along with a host of other information: this way, Tweetboard allows accessing Twitter in real time to support tracing flows (Markham & Lindgren, Citation2014) of data and affects. Given the tweet is still available, Tweetboard allows reading tweets on Twitter and access the other material via live links. We can also see the changes in the RT account or follower base. Moreover, using our live-captured dataset, we are also able to show the deleted or moderated tweets and make sense of the reasons for their removal ().
Figure 3. Tweet #8 before resurrection, missing contextual information needed in the analysis with black question mark symbols indicating minor glitches in the data pipeline to be fixed.
Developing the Tweetboard came with some issues. Making sense of timestamps and time zones required a lot of effort as the time difference of 11 h between the place of the attack and its analysis implied constant transformation processes when making sense of the data. To mitigate the issue, we converted the tweetset to New Zealand time by default. However, as the resurrected live tweets on Tweetboard automatically adjust to the time zone of the ethnographer’s browser, we decided to convert the dead tweets to Finnish time in the Tweetboard for consistency. Also, the decoupling logic of live-captured and original tweets required our attention; for retweets, #hellobrother can appear either in the live-captured or the original tweet.
As we repurposed the original tweets (captured through retweets) to implement our ‘time machine’, we decided to treat both live-captured and original tweets as separate tweets and filtered in only those that explicitly included #hellobrother. The computationally created Tweetboard allows conducting a deeper ethnographic analysis where the design process of the user interface during data sprints already served as preliminary research as we tested several iterations with the interface (i.e. scope of information, which shapes the data visualisation). Imperatively, Tweetboard creation builds on readiness that ensures the availability of a relevant tweetset.
The data-centric representation in notebooks and spreadsheets focus on text and numbers; an important affordance of the ‘resurrected’ tweets is contextual information lacking in the data-centric views. Together, these different views and perspectives allow moving between the qualitative and the computational. The computational approach allowed us to take over the sorting and organisation of the data per requirements, adding an augmenting layer to the ethnographic field where augmenting provides multiple different entry points to the data, as well as the construction of complex, multi-layered, and multi-dimensional ethnographic field (or, ethnographic data field) that is informed by ethnographic fieldwork and observation of the empirical phenomenon.
Tweetboard of chronologically ordered tweets
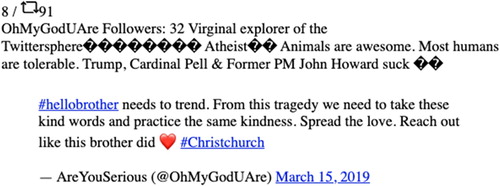
As a novel methodological tool, Tweetboard allows zooming into local arrangements of affective dynamics around #hellobrother. To better illustrate the process of computationally augmented ethnography, we will discuss a particular thread (of Numan Afifi) in our #hellobrother dataset (see ). In addition to aptly illustrating the benefits of computationally augmented ethnography in exploring complex social phenomena, this single thread also beautifully shows the nested nature of digital artefacts and their cross-platform relationality. Initially, it was not obvious why the tweet appeared in the dataset, repeatedly appearing on the Tweetboard (displaying the first 100 tweets) as it did not contain #hellobrother, but ‘hello brother’ written separately (not included in search terms). The tweet included a screenshot of a public Facebook post (see ) discussing the final act of kindness of the first victim. Through the Tweetboard, it is also possible to explore the affective flows as they unfold in these relational settings.
Figure 4. Tweetboard re-representing the resurrected ‘live’ versions of #hellobrother tweets. The live version of tweet #8 (‘#hellobrother needs to trend’) includes the tweet it was a response to, a defining example of nested digital artefacts flowing through the platform ecosystem.
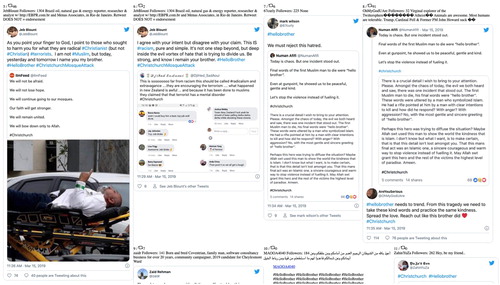
Analysing the thread, it became clear it was the emotive Facebook message (one digital artefact nested in another) that evoked the likes, replies, and reshares of this tweet, illustrating cross-platform affective flows. Paraphrasing the Facebook message, ‘today is chaos’, the tweeter (like so many others in our material) makes appeals to stop the violence and hatred, inviting others to imagine a better future where people reach out to each other with love. As the tweet was not among the first tweets nor among the popular ones, it did not appear on either Tweetboard views as its own instance, only in a nested configuration, showing how nestedness allows both affective arrangements to be formed, but also expand and invite new participants. Appearing first as a retweet, the textual framing enforces the original call to solidarity:
#hellobrother We must reject this hatred.
#hellobrother needs to trend. From this tragedy we need to take these kind words and practice the same kindness. Spread the love. Reach out like this brother did ❤ #Christchurch
Following the development of #hellobrother from Facebook Live to ‘Hello brother’ and again to #hellobrother across platforms, two things are important to note here: first, the contextualising affordance of resurrection (see ) helps identify why a tweet was included in the dataset, and second, how data flows around #hellobrother, how it disappears, and how it moves in the cross-platform space resulting in complicated data fields infused with relational affect (Slaby et al., Citation2019).
Tweetboard of the most retweeted tweets
The most retweeted view on Tweetboard provides yet another perspective into the data. Unsurprisingly perhaps, athletes, celebrities, political personas and media outlets were among the most retweeted ones. The RT count is, however, an indication of attention (see ) in the context of disruptive hybrid media events (Sumiala et al., Citation2018). It also provides a window to actors and how the story becomes framed, what kind of content gains more attention and what content is removed.
Most of the tweets in this Tweetboard are in Arabic, contrary to the temporal Tweetboard where roughly two thirds of tweets are in English. Interestingly, a significant portion of the data has since been removed and thus cannot be resurrected (the textual content is still visible). The RT count quickly drops to under 10,000, the 6th most retweeted tweet (by athlete Mesut Özil) having 8784 RTs and the 100th most retweeted one only 621 RTs.
The most retweeted #hellobrother tweet with 14,853 RTs (the tweet has since suffered a drop in RTs due to data death elsewhere) is a commemorative tweetFootnote8 celebrating the life of the first victim, with a image of Daoud Nabi smiling:
Daoud Nabi”, a 71-year-old Afghan refugee who escaped death in his country to cite in New Zealand where he received the terrorist at the mosque door with the words “welcome brother” but the terrorist killed him directly #HelloBrother #NewZealandTerroristAttack
The second most retweeted #hellobrother tweet (13,721 RTs upon collection, 10,600 RTs at the time of writing) was tweeted a week later by the Turkish president Erdogan, who on 23 March 2019, tweeted a very similar videoFootnote9 to that of TRT World, writing ‘Selam kardeşim … ‘ (hello brother in Turkish), including a #HelloBrother hashtag. The core message is a call to community. As we rehydrated the dataset, we noticed the third most retweeted #hellobrother tweet no longer exists on Twitter due to a suspended account; as we cannot access the tweet via the Twitter API to resurrect it, it appears on the Tweetboard as text only (similar to #10 in ). However, collected ‘live’, the tweet remains in our dataset (text and metadata). This is where we locate the rupture, between that which was visible as the event unfolded (and thus potentially observable during ethnography) and what exists or does not exist in the current moment of rehydration; this is where data afterlife can be explored and intervened with as the more technical process of rehydration comes in, conceptualised as a process of data resurrection.
The fourth most retweeted messageFootnote10 with 11,691 RTs comes from the Muslim leader Mufti Menk of Zimbabwe, who had 41,95,567 followers at the time (and 7,3 M at the time of writing). Mufti Menk is a notable figure, and his message comes in the form of a prayer, expressing compassion to the families in grief. Directed toward comforting the victims families and for praying with them, this message differs from the most retweeted one featuring the first victim, and the thread it is in, where the focus is on portraying each of the victims. After terrorist violence the loss is felt by the whole community, and collective remembering has socio-culturally important functions that go beyond the initial grieving, in building solidarity and solidifying community (Sumiala, Citation2013).
Importantly, #hellobrother managed to disrupt the hegemonic culture of mourning after terror where the dominant figure that elicits empathy is the white Western victim and the subjectivity allocated for the Muslim subject is that of a perpetrator. We find that #hellobrother was succesful in channelling solidarity to the Muslim community, making it a unique case in the context of mediated solidarity. The collective, public grieving in New Zealand together with the recognition of the violence as an act of terror, and its prompt condemnation, played a crucial role in including the marginalised into the wider community, in recognising the victims as grievable subjects (Morse, Citation2018b).
The attention-based Tweetboard provides intricate insights into popular content and which Twitter users gained the most attention (according to metrics made available by Twitter) that can be used to adjust the relevance or relative significance of ethnographic observations. Material prominent during ethnography does not necessarily figure prominently in the empirical data. For example, Sonny B. Williams tweetedFootnote11 a video of himself expressing his disbelief and shock, sending his condolences to the victims’ families; this tweet appeared repeatedly during the intensive phase of ethnographic observation, yet does not stand out in the empirical data (and is captured via a retweet or a reply). Williams’ tweet was retweeted over 50,000 times at the time of data collection (has lost some RTs since) and attracted over 84,000 likes.
Being a nationally known athlete with more than 8,24,000 followers (at the time of data collection), it is not surprising Twitter would serve this content during the ethnography. At the time of writing, the video has gained 2,5 million views. This highlights the usefulness of complementary perspectives in exploring complex social phenomena as content prominent in the researcher’s Twitter stream might be assigned more significance due to high visibility, whereas with the added augmenting layer it is possible to assess the relative importance of individual tweets.
Exploring the emergent patterns of interaction
To complement the temporal and attention-based Tweetboard views with an overview of interactions, we applied visual network analytics to observe patterns in the interaction structure, to make sense of these patterns, and to share them with others (Freeman, Citation2000; Huhtamäki et al., Citation2015). We used a mention-based approach to transform the tweet data to a network representation (Hansen et al., Citation2019). That is, each time a Twitter user mentions another user account in the tweet content, a directed connection is formed, pointing toward the mentioned user. Each new interaction between a pair of users increases the weight of the connection.
Following the Ostinato Model for visual network analysis (Huhtamäki et al., Citation2015), a set of network metrics were calculated to quantify the structural positions of individual actors. Indegree refers to the amount of connections pointing toward an actor and outdegree is the number of connections the actor has initiated by mentioning others (Wasserman & Faust, Citation1994). Degree is the total amount of connections. The weighted versions of the degree values take into consideration the weight of the connections. That is, an individual actively mentioning another user increases the value of the mentioned user’s indegree by one and weighted indegree by the number of tweets a particular user is mentioned.
Once the metrics are available, the visual network analysis process moves to define the visual properties of the network. In , node size shows the weighted indegree of the actor. Node colour indicates the cluster structure of the network. That is, each node is assigned to a cluster in which it has the most interconnections with other nodes in. The Force Atlas 2 algorithm was used to lay out the network, that is, to position the nodes in a way that allows the observation of the emergent structure of the interaction network. Metric calculation, visual property definition, and layout processing were all implemented in Gephi (Bastian et al., Citation2009).
Figure 5. The main component of the #hellobrother mention network. Node size shows weighted indegree (i.e. the number of mentions in the tweetset) and colour shows the network cluster (i.e. groups of interconnected actors).
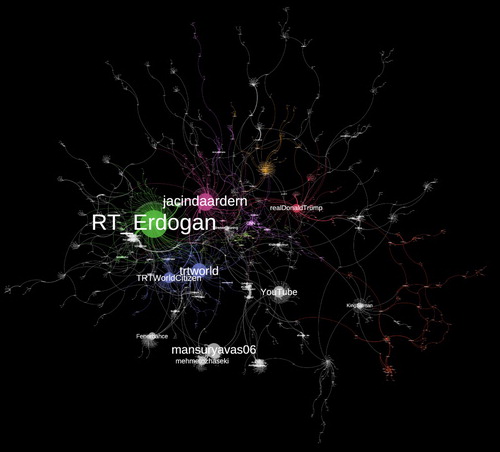
The interaction network in further highlights the prestige stemming from the popularity of the tweets of athletes, celebrities, political personas, and media outlets. The attention that Erdogan’s tweet (‘Selam kardeşim … ‘) gained places him in a prestigious position in the interaction network. Other prestigious actors include Twitter handles jacindaardern, trtworld, mansuryavas06, and YouTube (see ), each surrounded by a flock of actors agreeing, disagreeing, or otherwise interacting with them, increasing attention (Valaskivi & Uusitalo, Citation2020). The outdegree values among the most mentioned actors are zero, indicating they are not active participants in the discussions.
Table 1. Top 20 mentioned Twitter users in the #hellobrother network according to their weighted indegree.
Discussion: re-thinking digital afterlife through data
The methodological development work presented in this study provides new perspectives and new tools to how to research suddenly erupting events, but reflecting on ‘data’ and tracing the affective flows at the site of #hellobrother also shapes how we think of digital afterlife. In (re)conceptualising digital afterlife, we draw on these insights and shift the focus from ‘continued digital presence’ (Mason-Robbie & Savin-Baden, Citation2020) to that which makes it possible, data. Here, we want to pay special attention to the materiality of data, not least because digital afterlife is realised through digital artefacts that rely on this very materiality, but also because this allows us to see how these artefacts figure in affective arrangements embedded in social practices that make up the emotional dimension of digital afterlife. The technological and the emotional are thus mutually shaping, co-constitutive dimensions of digital afterlife. At the same time, focussing on materiality reminds us of the impermanence and fragility of data that has direct consequences for digital afterlife and the meanings embedded in it, discussed next.
Data afterlife – rupture, rehydration and resurrection
Data afterlife refers to the technological dimension of digital afterlife. As a platform, Twitter mediates and controls the afterlife of tweets as data, and causes a rupture between the tweets that circulated at the time of the event and the current state of existence and recoverability of said tweets, something akin to data death. Twitter is thus a poor repository of historical information (Bruns & Weller, Citation2016) as both the content and user base are affected by constant erasure and change; tweets are affected by deletion by user and removal through moderation by platform (Gillespie, Citation2018; Timberg & Dwoskin, Citation2017).
However, while Tweetboard will show if an account has been suspended, the reason remains unclear (even more so with deleted tweets), so conclusive links between data death and platform intervention cannot be drawn. However, the relative high degree of data death is indicative of sensitive content in the dataset. To add to data death, accessing historical data through the Twitter APIs comes with a fee. Finally, using Twitter’s search functionality as part of ethnographic research comes with the rules and mechanisms of algorithmic governance that are in practice impossible to decipher, whereas Tweetaboard allows circumventing this.
From the research perspective, the process of rehydration is an important part of data afterlife. Rehydration, or recollecting (Rogers, Citation2019; Zubiaga, Citation2018), refers to a practice for sharing Twitter data among researches. Twitter Terms of Service deny the sharing of tweetsets, allowing only the sharing of tweet id lists between research teams. Once a research team receives the list of tweets, they have to recollect the tweets from the Twitter API, reproducing and extending the rupture between the time of the event and its investigation. The tweetset collected in real time during the event, like in this study, gave a conducive starting point for investigating #hellobrother. The streaming-based real-time data collection method enabled circumventing the main ruptures of Twitter data, including user-deleted and platform-removed tweets and user-deleted, user-hidden, and platform-suspended accounts.
After exploring the dataset in the form it presents to us ‘as data’, as line after line of letters and numbers filling the screen, we turned our gaze to resurrected tweets, that is, tweets that were brought back to life as they are presented in the Twitter user interface, including fully operational hashtags, user mentions, links, pictures, videos, and other modalities. The unexpected emergence of Tweetboard as the main re-representation of the tweetset required the repurposing of the Twitter oEmbed API for tweet resurrection. The computational sorting, organising and exploration of data is not only a preprocessing step in the analysis pipeline, but a method of analysis of its own. We see tweet resurrection as a perfect example of doing digital methods (Rogers, Citation2019) with digitally native data and method, together with repurposing platform affordances to support research. Computational method as used in this study is thus not only a method of collecting data, but very much part of the analysis. In addition to mechanically sorting the data, the computational approach allows circumventing Twitter as a platform. Twitter is, however, present in Tweetboard as the inclusion of a tweet comes with Javascript to be downloaded from Twitter in runtime, adding the operational features to complement the structured content downloaded through the oEmbed API.
Data as afterlife – affective arrangements of emotional life
Zooming out from particularised details to thinking more theoretically about data as afterlife, or, the emotional dimension of digital afterlife, we return to relational affect and how affective arrangements (Slaby et al., Citation2019) bring ‘multiple actors into a dynamic, orchestrated conjunction, so that these actors’ mutual affecting and being affected is the central dimension of the arrangement from the start’ (Slaby et al., Citation2019, p. 5, emphasis added). The affect at the core of arrangement establishes what kind of formation, what kind of sociality is in question. In our empirical material, we observe qualitative differences between different kinds of post-death artefacts that speak directly to the emotional; for example, the affective contours around #hellobrother tweets of solidarity are quite different compared to those affective arrangements where the video artefact is celebrated because the affects at the core resonate with different audiences. Affective arrangements, then, present as kind of affective affordances (Slaby et al., Citation2019) of a given formation where the digital artefact plays an essential part in the coming together of a suitable relational context for one’s potential for affective resonance to become realised in relations (Mühlhoff, Citation2015).
Relational affect, as it flows at the site of the artefact, invites others via appeals to the emotional, and the nested nature of digital artefacts provides the perfect infrastructural setting for a cross-platform expansion of affective relationality. We see this in the #hellobrother threads resurrected on the Tweetboard (see ). In addition to affective staging, digital artefacts have a contextualising capacity vis-à-vis the social and discursive space in which they appear, setting the scene of interaction. The affective interactions between participants are ‘a defining component of what these constellations actually are’ (Slaby et al., Citation2019, p. 5), which we can access via the Tweetboard. Tweetboard thus offers a gateway to affective arrangements that formed around the collected #hellobrother tweets at the time, that is, access to tweets not in our dataset. This gives data afterlife an added nuance; as a kind of ‘time machine’, Tweetboard allows including into the analysis tweets that were not collected in real time, but which were part of the conversation at the time.
Situated, affective arrangements afford multiple, drastically different, modes of attachment as they ‘work by targeting and harnessing the domain of personal and affective relations between individuals’ (Slaby et al., Citation2019, p. 6), and thus even the same artefact allows both relational affirmation and relational tension. The FPS aesthetics in the video of the massacre construct Muslim lives as ungrievable through the perpetrator's gaze (see also Ibrahim, Citation2020). The individual(ised) gaze (Ibrahim, Citation2007) not only participates in the construction of the event, but also contributes to and remains in the artefact’s affective layers. Viewers of the video are implicated as sharing the perspective of the perpetrator, a position they either accept or reject. As a form of post-death data, the video artefact gives rise to affective arrangements of varying kinds: those viewers, whose potential for affective resonance becomes realised upon engagement with this content in an affirmative way figure in a very different constellation from those centering on solidarity and compassion toward the victims.
Witnessing the mediated suffering of others (Geboers, Citation2019; Mortensen & Trenz, Citation2016) makes appeals to the viewers’ moral and emotional sensibilities (Chouliaraki et al., Citation2019) that demand action; in the context of death where the living sufferer is missing, the moral response to death is to grieve (Morse, Citation2018b, p. 245). However, due to individuals’ different affective dispositions that shape the way they are affected (and how they affect others), encounters with post-death artefacts do not always lead to affective resonance with those dead, the victims, but with the perpetrator (see Zelenkauskaite et al., Citation2020; see also Sumiala, Citation2017). At best, post-death artefacts offer consolation and relational affordances for the grieving (see e.g. Christensen & Sandvik, Citation2014a; Mielczarek, Citation2018) and play an important role in keeping those who have passed with the living; at worst, they expose those no longer with us at their most vulnerable.
Research considerations for future research
The investigation presented in this article covered a lot of new ground both for the investigative team and their respective disciplines. Due to boundary objects to be discovered and shared concepts and language to be established in the process, we made several mistakes and took suboptimal decisions. Here, we seek to guide researchers with similar intentions to build on our learnings.
First, when creating search criteria, always include both the hashtag and phrase version for each criterion. For this investigation, collecting both ‘hello brother’ and #hellobrother would have allowed better tracing of the emergence of the artefact. However, our decision to not include the hashtag enabled collecting a broad set of data (the 12M tweets) that enables post hoc queries and invites further methodological work, for example, on using distant reading to support the identification of latent themes, patterns, and structures in the data.
Second, we recommend establishing a protocol to validate and spell-check the new search criteria. In our case, the data scientist’s tacit decision to avoid errors by copying the suggested search terms from Facebook Messenger (while the ethnographer assumed the data scientist would check the terms) led to the inclusion of JeSuisMuslin as one of the search terms. Further, explore methods to expand search terms either with automated (Kumar & Carley, Citation2019) or systematic means (Rogers, Citation2019).
Third, start analysing and exploring the collected data in real-time to create a feedback cycle to augment early ethnographic inquiry, search term refinement, and spotting and tracking errors that are unavoidable when working fast under pressure. Consider using complementary data collection and analysis tools for real-time analysis while constructing the final dataset.
Fourth, when investigating disruptive events of global scale, be aware that Twitter streaming API provides a maximum of 180,000 tweets per hour. Therefore, we recommend creating a dedicated collector instance for each search term if possible. The use of dedicated collectors adds further support for the management of the collection process.
Fifth, and finally, seek to build on existing research infrastructure and tools. Here, we built a tailor-made infrastructure and data analysis pipeline to support the analysis. Although the setup was tested beforehand, the majority of the analysis processes was implemented as the ethnographic research advanced and identified new requirements. Fortunately, going forward, the code-based analysis processes are reproducible and therefore may be re-used and altered to facilitate future efforts. We plan to share the main parts of the processes and related research recipes as open source.
Conclusion
As we set out to explore the digital and emotional afterlife of terrorist violence, the study had two aims. The first was methodological; to develop a multi-method approach that would make use of data science and computational tools for advancing social enquiry (see Lindgren, Citation2020), and we thus developed and applied several data visualisations as tools for augmenting ethnographic analysis, for example, the interactive Tweetboard, a novel methodological tool introduced in this paper. Tweetboard allows zooming into local arrangements of affective dynamics around #hellobrother for qualitative inquiry, as well as providing the means to intervene in data afterlife. Furthermore, to enable the creation of the visualisations, we developed an extensive data pipeline for constructing a manageable dataset, as well as designed and experimented with methods to support collaboration in this multi-method setting, including situation room exercises and data sprints. Finally, we elaborated on the means to improve research readiness, a prerequisite for a successful study of unexpected events using computational methods, and we present considerations to support further research.
The second aim was more theoretical, while still drawing on our empirical material and findings, that is, to examine post-death digital artefacts, like #hellobrother tweets, through the concept of digital afterlife. Using data as the point of departure, we further developed the concept through two complementary lines of inquiry as to the constitution of digital afterlife, namely, data afterlife (corresponding to the digital, technological dimension) and data as afterlife (the emotional dimension). By conceptualising digital artefacts as relational, socio-technical artefacts with material properties and affective potentialities, we theorised how they figure in various affective arrangements (Slaby et al., Citation2019) in the sociomaterial setting of Twitter. We elaborated on how digital artefacts do more than mediate the emotional, how they are constitutive of the mediated emotional afterlife in fundamental ways.
As a theoretical contribution, the paper offers a more nuanced understanding of the concept of digital afterlife that better captures its multifaceted character by showing how the technological and the emotional are mutually shaping. While our discussion has been more theoretical regarding the emotional landscape of mediated violence, the methodological tool developed in this study, Tweetboard, offers access to data in a way allowing a more detailed empirical analysis.
The new concepts introduced in this paper embrace the data-driven approach of this multi-method study, and highlight the interdependence of the social, technological and the emotional in datafied settings; the conceptual repertoire of data death, data afterlife, and data resurrection, as well as data as afterlife, each capture unique points in the lifespan and capacity of data, reflecting shifts in the modality of existence. The concept of data as afterlife helps us think about death as a change in the modality of being rather than the end of existence, resonating with continuing bonds (Klass et al., Citation1996; see also Kasket, Citation2012) and the kind of affective relatedness that continues beyond death (see Christensen & Sandvik, Citation2014a, Citation2015), while data afterlife reminds us about the impermanent and vulnerable nature of data. Not only theoretically relevant, these newly introduced concepts are useful in both methodological description and application, particularly when conducting research on and of Twitter where the life expectancy of data is unpredictable and beyond the researcher’s control.
Methodological reflection relates to the question of the kind of results the researcher is able to generate with the chosen method. In this study, it has become obvious that the division is not only between qualitative analysis and data scientific methods, but also the variety of ways different data scientific methods can be applied and what types of results these yield, what new insights we gain from looking at the data differently. For example, as we resurrected the data collected ‘live’ of the Christchurch attacks, it became evident that the data is also broken (Pink et al., Citation2018) as not all tweets were resurrectable. The visualisations (the Tweetboard) created with the resurrected data offered a completely different view; while the more traditional form (lines and lines of numbers and letters) retains all the collected data, the resurrected data shows the current ‘live’ situation, including what has happened to the data since its collection.
Regarding the affordances of computational tools in qualitative analysis, we propose that computational analysis serves three main purposes. First, computation allowed us to construct the tweetset of 12M starting only hours after the attack and refine the search criteria on the fly as we gained a better ethnographically informed understanding of the nuances of the event. Second, computation enabled the querying and sorting of the tweetset and the creation of different types of (re)representation that allow augmenting ethnographic analysis. Third, by approaching data science as ethnography (Lindgren, Citation2020), the study contributes to alleviating concerns about ‘big data’ not being suitable for social inquiry by showing ‘big data’ to be a human construction like any other (Vis, Citation2013). We have thus demonstrated how big datasets do not have to be approached as meaningless numerical data; on the contrary, we have shown how data visualisations are highly insightful, and rather than reduce the data, offer valuable perspectives and insights perhaps otherwise lost (e.g. Joost Beuving, Citation2020; Markham & Lindgren, Citation2014).
Importantly, developing the computational process (the notebooks for querying and preprocessing data, Tweetboard for representing and visualising it) served as an important boundary object facilitating discussion between the ethnographer and the data scientist as well as the larger research consortium. A key insight that we gained is that for the ethnographer, a tweet equals 280 characters with related multimodal artefacts, whereas for the data scientist, it equals ‘280 lines’ of JSON data; assembling the Tweetboard thus allowed us to exchange views, and make sense of the data.
From an ethnographic viewpoint, the computational approach gave us means to intervene in data afterlife, offering greater access to the empirical material through the sorting and organisation of the data per requirements, adding an augmenting layer to the ethnographic data field, Tweetboard being the main example. Moreover, relating to the unpredictable life expectancy of data, we were able to include tweets removed since. An ethnographer not working in collaboration with a computational scientist would have to rely on Twitter or some third-party analytical tools to perform similar research tasks.
To conclude, when violent death disrupts the mundane flow of social media, there is an impending emotional risk to media users who are suddenly faced with unexpected violence. The risk of emotional trauma extends to mediated experience (Pinchevski, Citation2016), live-streamed massacre served to us by digital media platforms being an extreme case. We thus need to take a critical look at how emotional life is organised in the digital realm, and the ways in which the platform society (van Dijck et al., Citation2018) with the underpinning economic rationale has direct consequences for the creation, dissemination and reception of violent content. The Christchurch mosque shootings illustrate the ways in which the global platform ecosystem, ‘driven by algorithms and fueled by data’ (van Dijck et al., Citation2018, p. 4), opens up a particular digital media infrastructure for an instantaneous dissemination of terrorist violence, revealing the digital and emotional vulnerabilities of the networked system.
Disclosure statement
No potential conflict of interest was reported by the authors.
Additional information
Funding
Notes on contributors
Anu A. Harju
Anu A. Harju, Ph.D., is a Postdoctoral Researcher at the Faculty of Social Sciences, University of Helsinki. With focus on digital media and culture, her research interests include affect and mediated participation, death and terrorist violence, particularly practices of collective commemoration and politics of remembering. She is also involved in developing new methods for the study of suddenly erupting events in digital settings that draw on the ethnographic tradition. She is currently co-editing a Special Section on Encounters between Violence and Media for International Journal of Communication with Dr. Noora Kotilainen.
Jukka Huhtamäki
Jukka Huhtamäki, D.Sc. (Tech.), is a Postdoctoral Researcher Fellow at the Unit of Information and Knowledge Management at Tampere University and a founding member of the Innovation Ecosystems Network. He specialises in computational methods, visual analytics, and social network analysis. Drawing both from data science and ethnographic tradition, Jukka’s current research focuses on developing methodologies for investigating the hybrid media system, hybrid organizations and designing and evaluating Professional Social Matching systems. He is a co-author of the book Hybrid Media Events: The Charlie Hebdo Attacks and the Global Circulation of Terrorist Violence (2018) with Johanna Sumiala, Katja Valaskivi, and Minttu Tikka. His research has appeared in leading conferences and journals including Communications of the ACM, First Monday, ACM Transactions on Management Information Systems, Journal of Big Data, and Computers in Human Behavior. Dr. Huhtamäki is an Associate Editor of Behaviormetrika.
Notes
1 Tweet dated 15 March 2019 https://twitter.com/nafe_3/status/1106631234954784768.
References
- Ahmed, S. (2014). The cultural politics of emotion. 2nd ed. Edinburgh University Press.
- Airoldi, M. (2018). Ethnography and the digital fields of social media. International Journal of Social Research Methodology, 21(6), 661–673. https://doi.org/10.1080/13645579.2018.1465622
- Arnold, M., Gibbs, M., Kohn, T., Meese, J., & Nansen, B. (2018). Death and digital media. Routledge.
- Barns, S. (2019). Negotiating the platform pivot: From participatory digital ecosystems to infrastructures of everyday life. Geography Compass, 13(9), e12464. https://doi.org/10.1111/gec3.12464
- Bastian, M., Heymann, S., & Jacomy, M. (2009, May 17–20). Gephi: An open source software for exploring and manipulating networks. Proceedings of the Third International AAAI Conference on Weblogs and Social Media, San Jose, California, USA.
- Beer, D. (2017). The social power of algorithms. Information, Communication & Society, 20(1), 1–13. https://doi.org/10.1080/1369118X.2016.1216147
- boyd, danah, & Crawford, K. (2012). Critical questions for Big Data. Information, Communication and Society, 15(5), 662–679. https://doi.org/10.1080/1369118X.2012.678878
- Brubaker, J. R., Hayes, G. R., & Dourish, P. (2013). Beyond the grave: Facebook as a site for the expansion of death and mourning. The Information Society, 29(3), 152–163. https://doi.org/10.1080/01972243.2013.777300
- Bruns, A., & Weller, K. (2016). Twitter as a first draft of the present – and the challenges of preserving it for the future. Websci ‘16: Proceedings of the 8th ACM Conference on Web Science May 2016 (pp. 183–189). https://doi.org/10.1145/2908131.2908174
- Bucher, T. (2012). Want to be on the top? Algorithmic power and the threat of invisibility on Facebook. New Media & Society, 14(7), 1164–1180. https://doi.org/10.1177/1461444812440159
- Caliandro, A. (2018). Digital methods for ethnography: Analytical concepts for ethnographers exploring social media environments. Journal of Contemporary Ethnography, 47(5), 551–578. https://doi.org/10.1177/0891241617702960
- Card, S., Mackinlay, J. D., & Shneiderman, B. (1999). Readings in information visualization: Using vision to think. 1st ed. Morgan Kaufmann.
- Chouliaraki, L., Orwicz, M., & Greeley, R. (2019). The visual politics of the human [Special Issue]. Visual Communication. https://doi.org/10.1177/1470357219846405
- Christensen, D. R., & Sandvik, K. (2014a). Death ends a life, not a relationship: Objects as media on children’s graves. In D. R. Christensen, & K. Sandvik (Eds.), Mediating and re-mediating death (Vol. II, pp. 251–271). Ashgate.
- Christensen, D. R., & Sandvik, K. (Eds.). (2014b). Mediating and remediating death. Studies in death, materiality and time Vol. II. Routledge.
- Christensen, D. R., & Sandvik, K. (2015). Death ends a life not a relationship: Timework and ritualizations at Mindet.dk. New Review of Hypermedia and Multimedia, 21(1-2), 57–71. https://doi.org/10.1080/13614568.2014.983561
- Christensen, D. R., & Willerslev, R. (Eds.). (2016). Taming time, timing death: Social technologies and ritual. Routledge.
- Collins, R. (2004). Rituals of solidarity and security in the wake of terrorist attack. Sociological Theory, 22(1), 53–87. https://doi.org/10.1111/j.1467-9558.2004.00204.x
- Couldry, N., & Mejias, U. A. (2019). The costs of connection: How data is colonizing human life and appropriating it for capitalism. Stanford University Press.
- Cui, X., & Rothenbuhler, E. (2018). Communicating terror: Mediatization and ritualization. Television & New Media, 19(2), 155–162. https://doi.org/10.1177/1527476417715685
- Cumiskey, K. M., & Hjorth, L. (2017). Haunting hands: Mobile media practices and loss. Oxford University Press.
- Döveling, K., Harju, A. A., & Sommer, D. (2018). From mediatized emotion to digital affect cultures: New technologies and global flows of emotion. Social Media+Society, 4(1). https://doi.org/10.1177/2056305117743141
- Duncombe, C. (2020). Social media and the visibility of horrific violence. International Affairs, 96(3), 609–629. https://doi.org/10.1093/ia/iiaa055
- Ekbia, H. R. (2009). Digital artifacts as quasi-objects: Qualification, mediation, and materiality. Journal of the American Society for Information Science and Technology, 60(12), 2554–2566. https://doi.org/10.1002/asi.21189
- Eriksson, S., & Hansen, P. (2017). Heartbeats: A speculative proposal for ritualization of digital objects. DIS ‘17 Companion: Proceedings of the 2017 ACM Conference Companion Publication on Designing Interactive Systems (pp. 218–222). https://doi.org/10.1145/3064857.3079149
- Eriksson Krutrök, M., & Lindgren, S. (2018). Continued contexts of terror/ analyzing temporal patterns of hashtag co-occurrence as discursive articulations. Social Media+Society, 4(4). https://doi.org/10.1177/2056305118813649
- Flyverbom, M., & Murray, J. (2018). Datastructuring—organizing and curating digital traces into action. Big Data & Society. https://doi.org/10.1177/2053951718799114
- Ford, H. (2014). Big Data and small: Collaborations between ethnographers and data scientists. Big Data & Society, 1(2). https://doi.org/10.1177/2053951714544337
- Fox, N. J. (2011). Boundary objects, social meanings and the success of new technologies. Sociology, 45(1), 70–85. https://doi.org/10.1177/0038038510387196
- Fox, N. J. (2015). Emotions, affects and the production of social life. The British Journal of Sociology, 66(2), 301–318. https://doi.org/10.1111/1468-4446.12119
- Freeman, L. C. (2000). Visualizing social networks. Journal of Social Structure, 1(1). http://www.cmu.edu/joss/content/articles/volume1/Freeman.html.
- Geboers, M. (2019). ‘Writing’ oneself into tragedy: Visual user practices and spectatorship of the Alan Kurdi images on Instagram. Visual Communication. https://doi.org/10.1177/1470357219857118
- Geboers, M. A., & Van De Wiele, C. T. (2020). Regimes of visibility and the affective affordances of Twitter. International Journal of Cultural Studies, 23(5), 745–765. https://doi.org/10.1177/1367877920923676
- Giglietto, F., & Lee, Y. (2017). A hashtag worth a thousand words: Discursive strategies around #JeNeSuisPasCharlie after the 2015 Charlie Hebdo shooting. Social Media+Society, 3(1), 1–15. https://doi.org/10.1177/2056305116686992
- Gillespie, T. (2014). The relevance of algorithms. In T. Gillespie, P. J. Boczkowski, & K. A. Foot (Eds.), Media technologies: Essays on communication, materiality, and society (pp. 167–194). MIT Press.
- Gillespie, T. (2018). Custodians of the internet: Platforms, content moderation, and the hidden decisions that shape social media. Yale University Press.
- Goldenberg, A., & Gross, J. J. (2020). Digital emotion contagion. Trends in Cognitive Sciences, 24(4), 316–328. https://doi.org/10.1016/j.tics.2020.01.009
- Graham, C., Gibbs, M., & Aceti, L. (2013). Introduction to the special issue on the death, afterlife, and immortality of bodies and data. The Information Society, 29(3), 133–141. https://doi.org/10.1080/01972243.2013.777296
- Halford, S., & Savage, M. (2017). Speaking sociologically with Big Data: Symphonic social science and the future for Big Data research. Sociology, 51(6), 1132–1148. https://doi.org/10.1177/0038038517698639
- Hansen, D., Shneiderman, B., Smith, M., & Himelboim, I. (2019). Analyzing social media networks with NodeXL: Insights from a connected world. Morgan Kaufmann.
- Harbinja, E. (2017). Post-mortem social media: Law and Facebook after death. In D. Mangan, & L. E. Gillies (Eds.), The legal challenges of social media (pp. 177–200). https://doi.org/10.4337/9781785364518.00023
- Harju, A. (2015). Socially shared mourning: Construction and consumption of collective memory. New Review of Hypermedia and Multimedia, 21(1-2), 123–145. https://doi.org/10.1080/13614568.2014.983562
- Harju, A. A. (2019). Mediated commemoration, affect alienation, and why we are not all Charlie: solidarity symbols as vehicles for stance-taking. Thanatos Journal, 8(2), 165–202.
- Heer, J., & boyd, danah. (2005). Vizster: Visualizing online social networks. Proceedings of the 2005 IEEE Symposium on Information Visualization (INFOVIS ‘05) (pp. 32–39). https://doi.org/10.1109/INFVIS.2005.1532126
- Henderson, C., Malone, M., Culver, L., & Crowley, R. (2020). oEmbed. Oembed.Com. https://oembed.com/.
- Hrehorová, M. (2019). The ethics of first-person shooter aesthetics. The 13th International Philosophy of Computer Games Conference, St Petersburg 2019. https://gamephilosophy.org/wp-content/uploads/confmanuscripts/pcg2019/Mark%C3%A9ta%20Hrehorova%20-%20The%20Ethics%20of%20FPS-Aesthetics.pdf.
- Huhtamäki, J., Russell, M. G., Rubens, N., & Still, K. (2015). Ostinato: The exploration-automation cycle of user-centric, process-automated data-driven visual network analytics. In S. A. Matei, M. G. Russell, & E. Bertino (Eds.), Transparency in social media: Tools, methods and algorithms for mediating online interactions (pp. 197–222). Springer International Publishing Switzerland. https://doi.org/10.1007/978-3-319-18552-1_11
- Hviid Jacobsen, M. (Ed.). (2020). The age of spectacular death. Routledge.
- Ibrahim, Y. (2007). The technological gaze: Event construction and the mobile body. M/C Journal, 10(1). https://doi.org/10.5204/mcj.2594
- Ibrahim, Y. (2020). Livestreaming the ‘wretched of the Earth’: The Christchurch massacre and the ‘death-bound subject’. Ethnicities, 20(5), 803–822. https://doi.org/10.1177/1468796820926746
- Johansson, M., & Laippala, V. (2020). Affectivity in the #jesuisCharlie Twitter discussion. Pragmatics. Quarterly Publication of the International Pragmatics Association (IPrA), 30(2), 179–200. https://doi.org/10.1075/prag.18066.joh
- Joost Beuving, J. (2020). Ethnography’s future in the big data era. Information, Communication & Society, 23(11), 1625–1639. https://doi.org/10.1080/1369118X.2019.1602664
- Kallinikos, J., Aaltonen, A., & Attila, M. (2013). The ambivalent ontology of digital artifacts. MIS Quarterly, 37(2), 357–370. https://doi.org/10.25300/MISQ/2013/37.2.02
- Kandel, S., Heer, J., Plaisant, C., Kennedy, J., van Ham, F., Riche, N. H., Weaver, C., Lee, B., Brodbeck, D., & Buono, P. (2011). Research directions in data wrangling: Visualizations and transformations for usable and credible data. Information Visualization, 10(4), 271–288. https://doi.org/10.1177/1473871611415994
- Kasket, E. (2012). Continuing bonds in the age of social networking: Facebook as a modern-day medium. Bereavement Care, 31(2), 62–69. https://doi.org/10.1080/02682621.2012.710493
- Kasket, E. (2019). All the ghosts in the machine: Illusion of immortality in the digital age. Robinson.
- Keim, D., Kohlhammer, J., Ellis, G., & Mansmann, F. (2010). Mastering the information age - solving problems with visual analytics. Eurographics Association. http://www.vismaster.eu/book/.
- Kennedy, J. (2018). Theorising sharing practice in relation to digital culture. Media International Australia, 168(1), 108–121. https://doi.org/10.1177/1329878X18783035
- Kitchin, R. (2014). Big Data, new epistemologies and paradigm shifts. Big Data & Society. https://doi.org/10.1177/2053951714528481
- Kitchin, R. (2017). Thinking critically about and researching algorithms. Information, Communication & Society, 20(1), 14–29. https://doi.org/10.1080/1369118X.2016.1154087
- Klass, D., Silverman, P. R., & Nickman, S. (Eds.). (1996). Continuing bonds: New understandings of grief. Routledge.
- Klinger, U., & Svensson, J. (2018). The end of media logics? On algorithms and agency. New Media & Society, 20(12), 4653–4670. https://doi.org/10.1177/1461444818779750
- Knuth, D. E. (1984). Literate programming. The Computer Journal, 27(2), 97–111. https://doi.org/10.1093/comjnl/27.2.97
- Kumar, S., & Carley, K. M. (2019). What to track on the Twitter streaming API? A knapsack bandits approach to dynamically update the search terms. Proceedings of the 2019 IEEE/ACM International Conference on Advances in Social Networks Analysis and Mining, ASONAM 2019 (pp. 158–163). https://doi.org/10.1145/3341161.3342919
- Lee, A. S., Thomas, M., & Baskerville, R. L. (2015). Going back to basics in design science: From the information technology artifact to the information systems artifact. Information Systems Journal, 25(1), 5–21. https://doi.org/10.1111/isj.12054
- Leonardi, P. M. (2010). Digital materiality? How artifacts without matter, matter. First Monday, 15(6), 6. https://doi.org/10.5210/fm.v15i6.3036
- Leonardi, P. M. (2012). Materiality, sociomateriality, and socio-technical systems: What do these terms mean? How are they related? Do we need them? In P. M. Leonardi, B. A. Nardi, & J. Kallinikos (Eds.), Materiality and organizing: Social interaction in a technological world (pp. 25–48). Oxford University Press.
- Lindgren, S. (2020). Data theory: Interpretive sociology and computational methods. Polity.
- Lomborg, S., & Kapsch, P. H. (2020). Decoding algorithms. Media, Culture & Society, 42(5), 745–761. https://doi.org/10.1177/0163443719855301
- Mäkelä, E., Lagus, K., Lahti, L., Säily, T., Tolonen, M., Hämäläinen, M., Kaislaniemi, S., & Nevalainen, T. (2020, October 21–23). Wrangling with non-standard data. Proceedings of the Digital Humanities in the Nordic Countries 5th Conference, Riga, Latvia (pp. 81–96).
- Markham, A. (2013). Undermining ‘data’: A critical examination of a core term in scientific inquiry. First Monday, 18(19). https://doi.org/10.5210/fm.v18i10.4868
- Markham, A. N. (2017). Ethnography in the Digital Internet Era: from fields to flow, descriptions to interventions. In N. Denzin, & Y. Lincoln (Eds.), The sage handbook of qualitative research (5th ed., pp. 650–668). Sage.
- Markham, A. N., & Gammelby, A. K. (2018). Moving through digital flows: An epistemological and practical approach. In U. Flick (Ed.), The SAGE handbook of qualitative data collection (pp. 451–465). SAGE. https://doi.org/10.4135/9781526416070
- Markham, A. N., & Lindgren, S. (2014). From object to flow: Network sensibility, symbolic interactionism, and social media. Symbolic Interaction and New Social Media. https://doi.org/10.1108/S0163-2396_2014_0000043012
- Marres, N. (2017). Digital sociology: The reinvention of social research. Polity.
- Marres, N., & Gerliz, C. (2016). Interface methods: Renegotiating relations between digital social research, STS and sociology. The Sociological Review, 64(1), 21–46. https://doi.org/10.1111/1467-954X.12314
- Mason-Robbie, V., & Savin-Baden, M. (Eds.). (2020). Digital afterlife: Death matters in a digital age. CRC Press.
- Mielczarek, N. (2018). The dead Syrian refugee boy goes viral: funerary Aylan Kurdi memes as tools of mourning and visual reparation in remix culture. Visual Communication, 19(4), 506–530. https://doi.org/10.1177/1470357218797366
- Moreman, C. M., & Lewis, A. D. (Eds.). (2014). Digital death: Mortality and beyond in the online age. Praeger.
- Morse, T. (2018a). Mourning news: Reporting violent death in a global age. Peter Lang.
- Morse, T. (2018b). The construction of grievable death: Toward an analytical framework for the study of mediatized death. European Journal of Cultural Studies, 21(2), 242–258. https://doi.org/10.1177/1367549416656858
- Morse, T. (2020). Now trending: #Massacre. On the ethical challenges of spreading spectacular terrorism on new media. In M. Hviid Jacobsen (Ed.), The age of spectacular death (pp. 126–143). Routledge.
- Mortensen, M., & Trenz, H. J. (2016). Media morality and visual icons in the age of social media: Alan Kurdi and the emergence of an impromptu public of moral spectatorship. Javnost - The Public, 23(4), 343–362. https://doi.org/10.1080/13183222.2016.1247331
- Mühlhoff, R. (2015). Affective resonance and social interaction. Phenomenology and the Cognitive Sciences, 14(4), 1001–1019. https://doi.org/10.1007/s11097-014-9394-7
- Munk, A. K., Madsen, A. K., & Jacomy, M. (2019). Thinking through the databody: Sprints as experimental situations. In A. Mäkitalo, T. Nicewonger, & M. Elam (Eds.), Designs for experimentation and inquiry: Approaching learning and knowing in digital transformation (1st ed., pp. 110–128). Routledge.
- Murthy, D. (2011). Twitter: Microphone for the masses? Media, Culture & Society, 33(5), 779–789. https://doi.org/10.1177/0163443711404744
- Murthy, D. (2012). Towards a sociological understanding of social media: Theorizing twitter. Sociology, 46(6), 1059–1073. https://doi.org/10.1177/0038038511422553
- Nossek, H. (2008). ‘News media’-media events: Terrorist acts as media events. Communications, 33(3), 313–330. https://doi.org/10.1515/COMM.2008.020
- Olshannikova, E., Olsson, T., Huhtamäki, J., & Kärkkäinen, H. (2017). Conceptualizing big social data. Journal of Big Data, 4(1), 19. https://doi.org/10.1186/s40537-017-0063-x
- O’Neil, C., & Schutt, R. (2013). Doing data science: Straight talk from the frontline. O’Reilly Media.
- Payne, R. (2016). ‘Je suis Charlie’: Viral circulation and the ambivalence of affective citizenship. International Journal of Cultural Studies, 21(3), 277–292. https://doi.org/10.1177/1367877916675193
- Pearce, J. S. (2020). Instagram’s affordances and the visual construction of solidarity after a mass shooting. Illness, Crisis and Loss. https://doi.org/10.1177/1054137320906405
- Perez, F., & Granger, B. E. (2015). Project Jupyter: Computational narratives as the engine of collaborative data science. Project Jupyter. https://blog.jupyter.org/project-jupyter-computational-narratives-as-the-engine-of-collaborative-data-science-2b5fb94c3c58.
- Pinchevski, A. (2016). Screen trauma: Visual media and post-traumatic stress disorder. Theory, Culture & Society, 33(4), 51–75. https://doi.org/10.1177/0263276415619220
- Pink, S., Ardevol, E., & Lanzeni, D. (2016). Digital materiality: Configuring a field of anthropology/design? In S. Pink, E. Ardevol, & D. Lanzeni (Eds.), Digital materialities: Anthropology and design (pp. 1–26). Bloomsbury.
- Pink, S., Ruckenstein, M., Willim, R., & Duque, M. (2018). Broken data: Conceptualising data in an emerging world. Big Data & Society. https://doi.org/10.1177/2053951717753228
- Plantin, J.-C., Lagoze, C., Edwards, P. N., & Sandvig, C. (2018). Infrastructure studies meet platform studies in the age of Google and Facebook. New Media & Society, 20(1), 293–310. https://doi.org/10.1177/1461444816661553
- Plantin, J., & Punathambekar, A. (2019). Digital media infrastructures: Pipes, platforms, and politics. Media, Culture & Society, 41(2), 163–174. https://doi.org/10.1177/0163443718818376
- Postill, J., & Pink, S. (2012). Social media ethnography: The digital researcher in a messy web. Media International Australia, 145(1), 123–134. https://doi.org/10.1177/1329878X1214500114
- Procter, R., Vis, F., & Voss, A. (2013). Reading the riots on Twitter: Methodological innovation for the analysis of big data. International Journal of Social Research Methodology, 16(3), 197–214. https://doi.org/10.1080/13645579.2013.774172
- Reckwitz, A. (2012). Affective spaces: A praxeological outlook. Rethinking History, 16(2), 241–258. https://doi.org/10.1080/13642529.2012.681193
- Reckwitz, A. (2016). Practices and their affects. In A. Hui, T. Schatzki, & E. Shove (Eds.), The nexus of practices: Connections, constellations, practitioners (pp. 114–125). Routledge.
- Rogers, R. (2019). Doing digital methods. Sage.
- Rule, A., Tabard, A., & Hollan, J. D. (2018, April 1–12). Exploration and explanation in computational notebooks. Conference on Human Factors in Computing Systems – Proceedings. https://doi.org/10.1145/3173574.3173606
- Sarno, D. (2009, February 19). Jack Dorsey on the Twitter ecosystem, journalism and how to reduce reply spam. Part II. Los Angeles Times. https://latimesblogs.latimes.com/technology/2009/02/jack-dorsey-on.html.
- Savin-Baden, M. (2019). Postdigital afterlife? Postdigital Science and Education, 1(2), 303–306. https://doi.org/10.1007/s42438-019-00056-9
- Sein, M., Henfridsson, O., Purao, S., Rossi, M., & Lindgren, R. (2011). Action design research. MIS Quarterly, 35(1), 37–56. https://doi.org/10.2307/23043488
- Shneiderman, B. (1996). The eyes have it: A task by data type taxonomy for information visualizations. Proceedings of IEEE Symposium on Visual Languages, Boulder, Colorado, USA (pp. 336–343).
- Slaby, J., Mühlhoff, R., & Wüschner, P. (2019). Affective arrangements. Emotion Review, 11(1), 3–12. https://doi.org/10.1177/1754073917722214
- Star, S. L., & Griesemer, J. R. (1989). Institutional ecology, ‘translations’ and boundary objects: Amateurs and professionals in Berkeley’s Museum of Vertebrate Zoology, 1907-39. Social Studies of Science, 19(3), 387–420. https://doi.org/10.1177/030631289019003001
- Sumiala, J. (2013). Media and ritual: Death, community and everyday life. Routledge.
- Sumiala, J. (2017). “Je Suis Charlie” and the digital mediascape: The politics of death in the Charlie Hebdo mourning rituals. Journal of Ethnology and Folkloristics, 11(1), 111–126. https://doi.org/10.1515/jef-2017-0007
- Sumiala, J., & Tikka, M. (2020). Digital media ethnographers on the move – an unexpected proposal. Journal of Digital Social Research, 2(1), 39–55. https://doi.org/10.33621/jdsr.v2i1.37
- Sumiala, J., Tikka, M., Huhtamäki, J., & Valaskivi, K. (2016). #Jesuischarlie: Towards a multi-method study of hybrid media events. Media and Communication, 4(4), 97–108. https://doi.org/10.17645/mac.v4i4.593
- Sumiala, J., & Valaskivi, K. (2018). Introduction: Toward hybrid media events of terrorist violence. Television & New Media, 19(2), 128–135. https://doi.org/10.1177/1527476417747653
- Sumiala, J., Valaskivi, K., Tikka, M., & Huhtamäki, J. (2018). Hybrid media events: The Charlie Hebdo attacks and the global circulation of terrorist violence. Emerald. https://doi.org/10.1108/9781787148512
- Timberg, C., & Dwoskin, E. (2017, October 12). Facebook takes down data and thousands of posts, obscuring reach of Russian disinformation. The Washington Post. https://www.washingtonpost.com/news/the-switch/wp/2017/10/12/facebook-takes-down-data-and-thousands-of-posts-obscuring-reach-of-russian-disinformation/.
- Valaskivi, K., & Uusitalo, N. (2020). The attention apparatus: Conditions and affordances of news reporting in hybrid media events of terrorist violence. Journalism Practice. https://doi.org/10.1080/17512786.2020.1854052
- van Dijck, J., & Poell, T. (2013). Understanding social media logic. Media and Communication, 1(1), 2–14. https://doi.org/10.17645/mac.v1i1.70
- van Dijck, J., Poell, T., & de Waal, M. (2018). The platform society: Public values in a connective world. Oxford University Press.
- Venturini, T., Munk, A., & Meunier, A. (2019). Data-sprinting. In Routledge Handbook of interdisciplinary research methods (pp. 158–163). Routledge. https://doi.org/10.4324/9781315714523-24
- Vis, F. (2013). A critical reflection on Big Data: Considering APIs, researchers and tools as data makers. First Monday, 18(10). https://doi.org/10.5210/fm.v18i10.4878
- Wang, Y., Callan, J., & Zheng, B. (2015). Should we use the sample? Analyzing datasets sampled from Twitter’s stream API. ACM Transactions on the Web, 9(3), 1–23. https://doi.org/10.1145/2746366
- Wasserman, S., & Faust, K. (1994). Social network analysis: Methods and applications. Cambridge University Press.
- Winner, L. (1980). Do artifacts have politics? Daedalus, 109(1), 121–136. http://www.jstor.org/stable/20024652.
- Wright, N. (2014). Death and the Internet: The implications of the digital afterlife. First Monday, 19(6). https://doi.org/10.5210/fm.v19i6.4998
- Zelenkauskaite, A., Toivanen, P., & Huhtamäki, J. (2020). Shades of hatred online: 4chan duplicate circulation surge during hybrid media events. First Monday, 26(1). https://doi.org/10.5210/fm.v26i1.11075.
- Zelizer, B. (2018). Seeing the present, remembering the past: Terror’s representation as an exercise in collective memory. Television & New Media, 19(2), 136–145. https://doi.org/10.1177/1527476417695592
- Zubiaga, A. (2018). A longitudinal assessment of the persistence of Twitter datasets. Journal of the Association for Information Science and Technology, 69(8), 974–984. https://doi.org/10.1002/asi.24026