
ABSTRACT
Climate change poses additional risks for natural and human systems including the hydrological cycle, leading to altered temporal and spatial variation of hydroclimatic conditions. This work assessed the current understanding of the dryness and wetness conditions in Sweden over the last two millenniums based on proxy and instrumental data, as well as climate model simulations and projections until the end of the twenty-first century. The assessment represents a summary of the existing literature concerning analysis of four selected indices for dry/wet conditions relating to precipitation, potential evapotranspiration (PET), and soil moisture (SPEI, PDSI [including scPDSI], SPI, and AI). SPEI considers both precipitation and PET and can show hydroclimatic conditions at different time scales. Therefore, it was chosen to summarize the past and future changes. A focus is put on dry conditions, as drought has strong influences on groundwater which is an important freshwater resource for Sweden. The millennium historical perspective reveals that the current climate is relatively wet and the future would become even wetter as a general wetting trend started some 120 years ago. However, there have been and will be large variations of both dry and wet conditions on short time scales, especially on decadal and interannual time scales. Further, the changes since the 1950s show a regional pattern with most significant wetting in the north, a slightly overall wetting in the south but a drying in central-eastern part including the island of Gotland since 1981. This pattern is broadly consistent with climate model projections for the future.
1. Introduction
Water availability acts as the primary natural constraint regulating vegetation growth (Nemani et al. Citation2003), food security (Chartres and Noble Citation2015) and public water supply (Stahl et al. Citation2016). Therefore, quantification of anomalously dry conditions becomes one of the key scientific issues, especially against the background of global warming. Drought is a natural phenomenon defined as sustained and extensive occurrence of below-average water availability, which can occur in nearly all types of climates. Hence, it is different from aridity, which is a long-term average feature of a dry climate.
One of the most important challenges facing humanity is climate change. It is directly related to dynamics of the hydrological cycle, resulting in temporal and spatial variation of dryness and wetness conditions. This is threatening freshwater resources worldwide, critical for human livelihoods and vital for nature conservation (Liu et al. Citation2018a). Understanding the causes behind and impact of the modified hydrological cycle has become one of the significant scientific issues and societal concerns.
Long-term trends, shifts in seasonality and short-term variabilities of climate variables, especially precipitation, can induce extreme situations such as floods and droughts, having both devastating impacts on ecosystems and regional water resources. Particularly, droughts as a complex climate-related phenomenon, may critically alter important processes, i.e. infiltration or runoff generation, directly and indirectly affecting freshwater ecosystems (e.g. Holden and Burt Citation2002; Fang and Pomeroy Citation2007; Gimbel et al. Citation2016). Direct key impacts include reduced river flow, lowered lake level, and habitat degradation, whereas indirect impacts include water quality deterioration and changes in food resources (e.g. Pasho et al. Citation2011; Stagge et al. Citation2015). Periods of prolonged water deficit can propagate through the hydrological cycle, leading to reduced freshwater availability for extended periods (Park et al. Citation2018).
Around 96% of the world’s usable freshwater resources are groundwater (Shiklomanov Citation1993). In contrast to surface systems, there is a lack of understanding regarding direct and indirect climate impacts on groundwater (Taylor et al. Citation2013). Due to the high complexity of groundwater systems, drought impacts can vary on a variety of scales (Bloomfield and Marchant Citation2013). Therefore, the assessment of the vulnerability of groundwater systems to droughts is challenging. For example, both the total and rate of change in freshwater supply are significant factors for the sustainability of freshwater-reliant ecosystems and humans (Grafton et al. Citation2013). Considering the uncertainties and the high risks with diminishing freshwater reserves in a future warmer climate, management needs to adopt conservative approaches to ensure sustainability.
Supported by the Swedish research Council FORMAS, a project entitled ‘Safe and Sustainable groundwater-based water supply in Swedish cities and countryside’ was carried out during 2017 and 2020. In Sweden, 80% of all municipalities use groundwater as a source of drinking water and in addition around 1.2 million habitants use groundwater from private wells. This roughly accounts for 60% of the national water supply (Kløve et al. Citation2017). The main objective of the project was to collect, analyze and summarize existing knowledge of the vulnerability of groundwater-based water supply in relation to drought, with a special focus on Sweden. As a first step to achieve the goals of the project, an assessment of the hydroclimatic conditions over Sweden in the last 2000 years with a focus on the last 120 years (i.e. since the 1900s) and future projections until the end of the twenty-first century is needed. This work aims at providing a long overdue summary of the existing information, and in the process filling some of the identified knowledge gaps.
A central part of the project is the development of a knowledge base on groundwater resource sustainability and vulnerability to drought. Over the recent years, several serious droughts occurred, which have had sizable impacts. One such example is the drought that occurred in summers 2016/17 where locally groundwater levels dropped to an all-time low. Especially in the southern part of the country, many municipalities issued warnings, restricted water use or applied emergency measures. In fact, the problem started to be seen already in spring 2016 when much less-than-normal precipitation was observed. In some parts of the country the dry conditions continued over the winter season into 2017, followed by a hot and dry summer 2018. Over this long period, anomalous winter snow, precipitation, and evapotranspiration over summer all played a role and need to be considered. Specifically, this project has examined (i) the past occurrence of wet and dry periods from paleoclimatic and historical data analysis, and (ii) future projections of hydroclimatic conditions based on global and regional climate model simulations. The overall purpose of this paper is to summarize our current understanding on dryness and wetness changes and variations in Sweden with a focus on drought in the past and what future changes we could expect. The review is based on peer-reviewed papers published in renowned international journals with the keywords relevant for this work, as well as reports published by the Swedish Meteorological and Hydrological Institute (SMHI).
2. The definition of drought and structure of the review
Since water availability of a system is mainly regulated by the systems’ input and output which are mainly dependent on meteorological conditions, dry (and wet) conditions are usually defined based on the following variables: precipitation and evapotranspiration (ET) or potential evapotranspiration (PET). Precipitation and PET are only determined by meteorological conditions, while ET depends on soil moisture (SM) which also involves processes below the surface.
As the main component of the water cycle, precipitation itself serves as a useful and in many cases the most important indicator for drought conditions. Various drought indices based on precipitation, ET, and PET have been developed to study drought variations at different scales. The most frequently used indices for the so called meteorological drought analysis include standardized precipitation index (SPI), a precipitation probabilistic approach (McKee et al. Citation1993); aridity index (AI), generally defined as the ratio of precipitation to an evaporation-related climate variable (e.g. Nastos et al. Citation2013); and Standardized precipitation-Evapotranspiration Index (SPEI), based on precipitation and PET (Vicente-Serrano et al. Citation2010).
The meteorological drought signal may propagate through the system affecting SM and the hydrological system. These types of drought can be defined by SM, river runoff and groundwater level. The selection of standardized indices describing these types of hydrological droughts is smaller compared to meteorological droughts, which is most likely due to the complexity of the involved processes and the lack of these non-meteorological data.
Due to the importance of SM to agriculture and ecosystem, drought described by SM based index can be considered agriculture or ecosystem drought. One such index is the Palmer Drought Severity Index (PDSI) that is based on the supply and demand concept of the water balance equation (Palmer Citation1965) and represents a proxy for SM.
River runoff and groundwater level are important components of the hydrological cycle and often have a direct link to water resources used by human society. Drought based on these two variables are often termed hydrological drought. Two standardized indices frequently used in Hydro(geo)logy are SGI – Standardized groundwater level index (Bloomfield and Marchant Citation2013) and SRI – Standardized runoff index (Shukla and Wood Citation2008). However, no regional application of these indices in Sweden can be found in literature.
SPI is the most applied index to analyze meteorological drought, which is determined by precipitation accumulation over a certain period of time, solely dependent on precipitation amount during the period (McKee et al. Citation1993).
AI is commonly used for the evaluation of long-term dry/wet status of climate in a region (Ahmed et al. Citation2019). There are various definitions for calculating AI (Huang et al. Citation2016; Ma et al. Citation2017; Liu et al. Citation2019). However, the ratio of precipitation to PET (or reference evapotranspiration, ET0; UNESCO Citation1979; UNEP Citation1992) has been most frequently used (Bannayan et al. Citation2010; Wang et al. Citation2014; Pour et al. Citation2020).
PDSI is one of the most widely used indices for detecting droughts. PDSI determines the magnitude of drought by quantifying the cumulative departure in surface water balance. It incorporates antecedent and current moisture supply (precipitation) and demand (PET) into a hydrological accounting system, which includes a two-layer bucket-type model for SM calculations using variables of recharge to soils, runoff, and water loss to the soil layers, and their potential values (Palmer Citation1965). PDSI is a standardized index. To facilitate comparison at a large spatial scale, a self-calibrating PDSI (scPDSI) was proposed by Wells et al. (Citation2004). A key parameter for calculating scPDSI is PET, which is an important source of demand in surface water balance. Two methods are commonly used to calculate the PET: the Thornthwaite method (Thornthwaite Citation1948) and the Penman-Monteith method (PM equation, Burke et al. Citation2006). The former equation only uses temperature, latitude and month as inputs to calculate PET, which is easy to use, but the calculated PET is over dependent on temperature compared to the PM equation which accounts for the effects of temperature, radiation, humidity, and wind speed (Chen et al. Citation2005; Xu et al. Citation2008).
SPEI is a newly developed drought index which quantifies surface dry/wet status using climatic water balance: the difference between precipitation and potential/reference ET (PET/ET0) (precipitation-PET or precipitation-ET0; Vicente-Serrano et al. Citation2010). The procedure for calculating SPEI is similar to that for SPI, except that the latter only uses precipitation as input, while the former uses precipitation and PET as inputs. Like PDSI/scPDSI, SPEI considers the effect of PET on drought severity, but due to application of climate water balance model in SPEI instead of surface water balance model (more for long-term memory of soil hydrological condition, Dai Citation2011a) in PDSI/scPDSI, the multi-scalar nature of SPEI enables identification of different surface drought types (e.g. from short-term 1-month drought to long-term 48-month drought) and drought impacts on diverse systems (Vicente-Serrano et al. Citation2012a, Citation2012b, Citation2013). SPEI is commonly used together with SPI to assess regional or global drought variability (Spinoni et al. Citation2015a, Citation2017; Stagge et al. Citation2017). Since both indices have the similar multi-scalar nature, and can detect drought variability from precipitation-only (SPI) or precipitation-and-water-demand (SPEI) perspectives, they are sometimes even applied as a combined index (Vicente-Serrano et al. Citation2010).
In what follows we will summarize published studies on dry/wet conditions for Sweden with a focus on drought in the past 2000 years and future 100 years, using precipitation, SPI, AI, PDSI (including scPDSI), and SPEI as indicators due to the facts that (1) they are widely available over a long period of time, (2) there are many previous studies using them which can be summarized, (3) there are future projections for them by global climate models (GCMs). The review is structured according to time period and source of information. Specifically, Sections 3 and 4 focus on the past 1000 years using tree-ring data (Section 3) and recent decades using instrumental records (Section 4), while Section 5 presents climate projections for the future years until 2100. Since some of these studies cover Fennoscandia, northern hemisphere or even global land, this summary will inevitably touch upon features outside Sweden, although our focus is on Sweden.
3. The last millennium
In order to determine the possible magnitude of future droughts in Scandinavia, the climate systems’ response to human-induced forcing and the natural drought variability that underlies it has to be known. However, while instrumental records are able to provide spatially and temporally highly resolved data for many types of meteorological and hydrological parameters, the records are problematically short. In Sweden, these data sets rarely exceed ∼150 years and are hence too short to include the full range of natural climate variability, and to contextualize contemporary climate changes. Natural climate proxy archives provide an opportunity for retrospective analysis of past drought events by extending climate information into the pre-industrial past. These records can be used to estimate the historical recurrence interval for droughts that are too rare to be evaluated in the brief instrumental period or to understand the severity of recent droughts in a long-term perspective. They could, although not yet tested in Fennoscandia, be directly employed in water resource management and planning (Woodhouse and Lukas Citation2006; Rice et al. Citation2009; Woodhouse et al. Citation2016). In Fennoscandia, the paleoclimate community has been active in developing regional estimates of Holocene hydroclimate variability from a number of proxies, including, but not limited to, tree-rings, depositional histories of subfossil trees, estimates of peat humification, sediment grain size, and varve thickness (Ljungqvist et al. Citation2016; Linderholm et al. Citation2018; Ljungqvist et al. Citation2020). These quantitative paleoclimate reconstructions can broadly be categorized into two classes of data:
Proxy records with a coarse temporal resolution (centennial scale or longer), yet with a long temporal coverage (typically the entire Holocene); and
Proxies that have a high temporal resolution (seasonal to decadal), but are restricted to the last 2000 years (the Common Era).
Paleoclimate records falling into the latter category are particularly useful for water resource planning and management, providing a historical constraint to the present-day statistical characteristics of hydrology (e.g. the mean state, the range of variability, and the long-term persistence of hydrologic phenomena). This and the fact that this review focuses on the drought concept but not aridity, will limit the review in the following subsections to high-resolution hydroclimatic studies over the Common Era. Moreover, only studies that provide a quantitative estimate of the drought indicators defined previously will be listed. In Fennoscandia, this is mostly limited to tree-ring based reconstructions. Although there are a number of high-resolution hydroclimate reconstruction available based on other types of proxies (e.g. sedimentological data, Saarni et al. Citation2015), these reconstructions are not quantitative per se, and thus will not be included herein.
Tree-ring is one of the most important sources of high-resolution (seasonal to inter-annual), absolutely dated information about the hydroclimate of the Common Era. It is one of the few proxies that are able to provide annually-resolved information on past climate variability dated to the exact calendar year, thus enabling quantitative and precise calibration and verification. This provides the possibility of precise quantification of past hydrological extremes not possible using lower-resolution, less temporally well-constrained archives. Depending upon site-ecology and local climate conditions, variations in tree-ring width, wood density and isotopic composition can be used to quantitatively reconstruct temperature, precipitation, or drought variations. In general, trees growing close to their latitudinal or altitudinal limit of distribution are sensitive to warm-season temperature, while information on long-term natural hydrologic variability (e.g. precipitation, streamflow, snowpack, drought index and other moisture-related variables) over several centuries can be gained from tree rings in moisture-sensitive trees growing in semi-arid to arid regions (e.g. trees whose growth correlate well with variations in moisture availability). Consequently, most tree-ring chronologies in Sweden, as well as other northern high-latitude regions, have been used to reconstruct past variations in temperature. Since moisture availability rarely is the dominant limiting factor for tree-growth in the region, comparatively little effort has traditionally been directed towards tree-ring based hydroclimate reconstructions (Linderholm et al. Citation2018; Ljungqvist et al. Citation2020). However, by sampling trees from carefully selected sites (e.g. sites with thin well-drained soil layers) it is possible to develop chronologies that have recorded past changes in moisture conditions (e.g. Jönsson and Nilsson Citation2009; Seftigen et al. Citation2013). Moreover, there is a considerable potential to improve the quality of tree-ring based hydroclimate reconstructions in these cool and moist high-latitude environments by considering alternative tree-ring parameters (e.g. wood density) to the commonly used ring-width proxy (Rocha et al. Citation2020; Seftigen et al. Citation2020). Tree-ring based efforts to better understand past regional hydroclimate conditions include both point reconstructions of summer (Helama and Lindholm Citation2003; Helama et al. Citation2009; Jönsson and Nilsson Citation2009; Rocha et al. Citation2020) or winter (Linderholm and Chen Citation2005) precipitation, or drought (scPDSI, SPEI, SPI, or other) (Drobyshev et al. Citation2011; Seftigen et al. Citation2013; Seftigen et al. Citation2017), as well as regional gridded so-called ‘drought atlases’ covering Fennoscandia (Seftigen et al. Citation2015a; Seftigen et al. Citation2015b) or extending over the full European domain such as the Old World Drought Atlas (OWDA) by Cook et al. (Citation2015). These high-latitude reconstructions are in general able to explain between c. 20% and 55% of the inter-annual variability in the target hydroclimate variable over the calibration period. However, the fidelity of the estimates at lower frequencies (>centennial) are much more uncertain, and are commonly not explicitly evaluated. This is because the overlap between the proxy and instrumental data is temporally limited. Moreover, sample replication is usually robust in the overlap with instrumental data and diminishes substantially further back in time.
Tree growth (in terms of tree-ring width) generally occurs over the whole growing season, but the speed of the growth within the growing season varies depending on climate conditions during the time (Dannenberg and Wise Citation2016). There is usually a particular time interval (e.g. specific months) within the growing season (but may also be extended to outside of growing season [e.g. Linderholm and Chen Citation2005]) when climate conditions (such as dry/wet) can contribute most to the tree growth, which is generally identified based on linear correlation approach. As long as the statistical relationship was built for specific months, analysis will be based on the assumption that tree growth will be mainly influenced by the mean climatic state of the time interval (e.g. seasonal mean). Thus, tree-ring width for each year, after scaling, is expected to be comparable to the long-term (e.g. seasonal but for particular time interval) mean from a climate model or from observational data. However, it would be difficult to distinguish the impacts of single or multi extreme dry/wet conditions on tree growth from the impacts of the mean condition, since the former also contribute to the variability of the mean dry/wet state.
3.1. Precipitation and SPI
The temporally longest tree-ring record of past precipitation variability currently available in Fennoscandia comes from south-eastern Finland, and provides annual estimates of May-June precipitation from 660 CE to present (Helama and Lindholm Citation2003; Helama et al. Citation2009). The reconstruction is particularly valuable in that it is one of few Fennoscandian high-resolution hydroclimate records that cover the ‘Medieval Climate Anomaly’ (MCA) period. The MCA represents the closest natural analogue to anthropogenic post-industrial warming, and thus provides a key benchmark by which the recent changes in both temperature and hydroclimate can be compared. However, while there are still uncertainties concerning the characteristics of temperature variability during MCA, hydroclimatic conditions are even more poorly constrained. The Helama et al. (Citation2009) reconstruction shows that southern Finland was subjected to a prolonged period of warm-season precipitation deficit during parts of the MCA (here early ninth-early thirteenth century), only occasionally interrupted by periods of wetness (). According to Helama et al. (Citation2009), the medieval drought coincided with several other ‘mega-droughts’ occurring in a number of regions around the globe (specifically, in North America (Cook et al. Citation2004; Ault et al. Citation2013), eastern South America (Stine Citation1994) and part of equatorial East Africa (Verschuren et al. Citation2000)). Although still poorly understood, these evidences may suggest a common driving mechanism behind the globally widespread droughts of the MCA, possibly linked to the coinciding anomalies in the El Niño/Southern Oscillation (ENSO) and the North Atlantic Oscillation (NAO) (Helama et al. Citation2009). Furthermore, joint information from the Scandinavian and other paleoclimate records of the MCA provide strong evidence that the twentieth century hydroclimate variability does not appear unprecedented in amplitude or trend, but rather that droughts in the MCA were more severe, extensive and long-lasting over much of the Northern Hemisphere. In contrast to what the MCA shows, the south-eastern Finnish record shows that the cool period in the early part of the Little Ice Age (LIA; in Helama et al. Citation2009 defined as the period between 1220 and 1650 CE) was characterized by markedly wetter conditions than the MCA (Helama et al. Citation2009). The Helama et al. (Citation2009) reconstruction agrees generally well (r = 0.366, n = 343, p < 0.01) with the fully independent summer SPI reconstruction from Southeast Sweden from 1650s to present (Seftigen et al. Citation2013), signifying a number of region-wide anomalies in warm-season wet and dry spells in the last ∼350 years (also reinforced by the millennium long, gridded paleo-drought product available for Fennoscandia [Seftigen et al. Citation2015a]). The temporal coherency between available tree-ring based hydroclimate reconstructions from Fennoscandia is further presented in and . It should be noted that a number of the reconstructions (Cook et al. Citation2015; Seftigen et al. Citation2015a, Citation2017) share common predictors with the Helama et al. (Citation2009) record, which makes the tree-ring estimates not fully independent. The collective comparison nevertheless reveal that droughts were not restricted to just the MCA; distinct regional-wide pre-modern drought conditions striking southern Sweden and Finland are evident in the early decades of the nineteenth century (c. 1800–1850), also identified in the SPI series reconstructed from early instrumental and historical climate information from east-central Sweden (Linderholm et al. Citation2004; Linderholm and Molin Citation2005). This dry spell appears not only to have been restricted to Scandinavia, but have also been reported in England and Wales (Marsh et al. Citation2007). Other anomalous periods include 1694–1751 CE, evident in the spring/early summer precipitation estimates from Mideast Sweden (Jönsson and Nilsson Citation2009). The period, characterized by low variability and precipitation below mean (a), is in part overlapping with the Late Maunder Minimum (LMM) (Eddy Citation1976). Anomalous climatic conditions in Europe during this period have been linked to both external forcing (solar irradiance and volcanic forcing) as well as internal oscillations in the North Atlantic (Luterbacher et al. Citation2001; Wang et al. Citation2017).
Figure 1. (a) Selected hydroclimate reconstructions from Fennoscandia, including the May-June precipitation reconstructions from southeast Finland (Helama et al. Citation2009) and mideast Sweden (Jönsson and Nilsson Citation2009); the 2-month June SPEI estimates from central Fennoscandia (Seftigen et al. Citation2017); the OWDA scPDSI reconstruction (Cook et al. Citation2015) averaged over the region bounded by the latitude/longitude coordinates 55–70° N/5–25° E (outlined in [b]); the September-April precipitation estimates from central Sweden (Linderholm and Chen Citation2005). Observed average June-August precipitation from 86 homogenized meteorological stations in Sweden is added for comparison. The time-series have been transformed into standard normal deviates with respect to the common 1901–1993 period, and smoothed with a 30-year low-pass filter to highlight decadal variability. A cross-correlation matrix showing the coherency between the warm-season reconstructions over their common period is provided in . (b) The gridded OWDA scPDSI reconstruction averaged over the MCA, LIA and modern periods. (c) Time-series (raw and 30-year low-pass filtered) of OWDA (averaged over region 55–70° N/5–25° E) over the MCA, LIA and modern periods.
![Figure 1. (a) Selected hydroclimate reconstructions from Fennoscandia, including the May-June precipitation reconstructions from southeast Finland (Helama et al. Citation2009) and mideast Sweden (Jönsson and Nilsson Citation2009); the 2-month June SPEI estimates from central Fennoscandia (Seftigen et al. Citation2017); the OWDA scPDSI reconstruction (Cook et al. Citation2015) averaged over the region bounded by the latitude/longitude coordinates 55–70° N/5–25° E (outlined in [b]); the September-April precipitation estimates from central Sweden (Linderholm and Chen Citation2005). Observed average June-August precipitation from 86 homogenized meteorological stations in Sweden is added for comparison. The time-series have been transformed into standard normal deviates with respect to the common 1901–1993 period, and smoothed with a 30-year low-pass filter to highlight decadal variability. A cross-correlation matrix showing the coherency between the warm-season reconstructions over their common period is provided in Table 1. (b) The gridded OWDA scPDSI reconstruction averaged over the MCA, LIA and modern periods. (c) Time-series (raw and 30-year low-pass filtered) of OWDA (averaged over region 55–70° N/5–25° E) over the MCA, LIA and modern periods.](/cms/asset/6a752f6c-1b3b-40a3-9b2a-730fe9ac5e43/tgaa_a_1841410_f0001_oc.jpg)
Table 1. A cross-correlation matrix showing the coherency between selected tree-ring based warm-season hydroclimate reconstructions over their common 1590–1993 period.
While the majority of existing tree-ring reconstructions have focused on warm-season precipitation, relatively few attempts have been made to infer information about the cold season hydroclimate dynamics in the region. Linderholm and Chen (Citation2005) presented so far the only such attempt, showing that Scots pine tree-ring data from west-central Scandinavia may contain information about regional winter (September-April) precipitation, especially on semi-decadal time scales. The resulting reconstruction shows that winters from the mid-eighteenth century to the mid-nineteenth century were predominantly wet, and the last half of the twentieth century seems to have been the wettest in the past four centuries (a).
In addition to the individual site records, a number of gridded precipitation reconstructions are available from the region (Pauling et al. Citation2006; Casty et al. Citation2007). These do not explicitly target Sweden, but are rather European wide datasets where Fennoscandia is included. The seasonally-resolved product provided by Pauling et al. (Citation2006) extends back to the 1500s over European land areas (30°W–40°E/30–71°N, 0.5°x0.5° resolution). The reconstruction is derived using a multiproxy approach, where historical archives, long instrumental records, and a number of natural proxy archives were used to produce the reconstruction fields. The predictor dataset from Fennoscandia, however, almost exclusively consists of a rather sparse network of long instrumental precipitation series. Hence, the skill over this region degrades back in time and the early part of the reconstruction should therefore be taken with caution. Nevertheless, when averaging the reconstruction over the full European domain, the precipitation variability over the last half millennium shows large interannual and decadal fluctuation. Yet when turning to Sweden, the authors (Pauling et al. Citation2006) find no significant agreement between their spring precipitation (March-May, 13–16°E/62–64°N region mean) estimates and the winter precipitation reconstruction provided by Linderholm and Chen (Citation2005). A mismatch in the seasonality of the two reconstructions is proposed as a contributing factor to the poor agreement between the timeseries.
Gridded datasets of seasonal European (30–80°N to 50W–40°E) precipitation, in addition to temperature and fields of the 500 hPa geopotential height, are provided by Casty et al. (Citation2007). These spans between 1766 and 2000, and were developed from only long instrumental data. The precipitation reconstruction correlates significantly and strongly (r > 0.8 for all seasons) with the one presented in Pauling et al. (Citation2006). Assessment of the long-term variability shows that both winter and spring precipitation anomalies are generally higher in the twentieth century compared to the early parts of the record. The summer precipitation variability is low compared to the other seasons, and no clear long-term trend is evident. For the autumn precipitation, a cyclic oscillation on the scale of 40–60 years appears throughout the whole reconstruction. However, no significant relationship between this cyclic variability and the Atlantic Multidecadal Oscillation (AMO) with a similar periodicity, is established. A collective analysis of detrended precipitation and temperature over the past 235 years, provided in Casty et al. (Citation2007), shows a positive coupling over Fennoscandia mainly in the winter and spring, but also to some extent in the autumn (indicating the importance of advective processes). In the summer however, the two variables are negatively correlated, most strongly in the southern parts of Sweden (suggesting that convection plays a dominant role). Furthermore, Empirical Orthogonal Function analysis is applied to the combined fields of pressure, temperature, and precipitation to investigate the leading modes of pressure patterns affecting the long-term climate variability (Casty et al. Citation2007). For winter, the leading spring and autumn pressure patterns closely resemble the NAO-structure, showing an increasing trend in the latter half of the twentieth century. The pattern is associated with wet conditions in Sweden and the rest of northern Europe. The leading summer pressure pattern, on the other hand, reveals a blocking-like structure, and is connected to warm and dry conditions in Sweden. No detectable effect of natural radiative forcing (solar and volcanic) on the annually averaged patterns of pressure, temperature or precipitation for Europe are found (Casty et al. Citation2007).
3.2. PDSI
A significant recent advancement in the assessment of the pre-industrial drought variability include the development of the ‘Old World Drought Atlas’, a tree-ring reconstruction of gridded (0.5° × 0.5° resolution) warm-season (June-July-August) scPDSI (Cook et al. Citation2015). The atlas, covering the Common Era, extends over Europe and the Mediterranean Basin. The northern limits of the OWDA domain also include the Fennoscandian region, providing a longer and spatially more complete picture of past droughts and pluvials in Sweden compared to previously available estimates based on instrumental, historical, and natural proxy archives.
The OWDA product gives insight into the spatial dimensions of a number of known historic extreme hydroclimate events recorded in various documentary sources across central Europe and the British Isles, and demonstrates that many of these extremes, in fact, also affected parts of central and southern Sweden. Some of these events include the great drought of 1893, 1741, 1616 and 1540 (see Figure 2 in Cook et al. [2015] for the spatial details of these droughts). The OWDA also provides support for the extreme hydroclimatic conditions that have been linked to the ‘Great Famine’ that struck parts of Europe in 1315–1317 (Campbell Citation2016). This famous historical catastrophe in late medieval European history was caused by a prolonged period of anomalously wet and cold conditions, leading to crop failure, growing food prices and eventually starvation, disease spread, and millions of deaths. Although less severe than in western Europe, OWDA shows that also part of southern Sweden and Norway were experiencing wet conditions in 1315–1317.
Moreover, OWDA greatly expands our understanding of the spatial pattern and extent of the dryness during the MCA period, first detailed in Helama et al. (Citation2009). While a widespread drought affected central Europe and parts of southern and central Scandinavia during this period, generally wetter conditions prevailed over Northern Fennoscandia and Russia (b). Moreover, the MCA period was shown to be significantly drier in large portions of continental Europe and southern Fennoscandia than both the LIA and the modern period. Notably, the most recent period (1998–2012) appears to be anomalously wet in the context of the past 2000 years, and it is necessary to go back to 1721–1739 to find a wetter period of comparable duration (a–c).
Several recent studies have used the OWDA product to more closely assess the dynamics and drivers of hydroclimate variability across the European domain, Fennoscandia included (Baek et al. Citation2017; Markonis et al. Citation2018; Ljungqvist et al. Citation2019). Markonis et al. (Citation2018) showed that Northern Europe including Scandinavia has experienced an increase in wetness over the recent decades, in line with the changes seen in the instrumental data. By aggregating OWDA over 30-year time windows (climatic scale), the last 30 years (1983–2012) emerged as the wettest in Scandinavia over the last millennium. Moreover, while northern Europe is experiencing a recent increase in wetness, a shift towards dryer conditions, in some regions unique in terms of duration and spatial extent for the last 1000 years, are seen across southern Europe. Ljungqvist et al. (Citation2019) examined the co-variability patterns across timescales between the temperature reconstruction of Luterbacher et al. (Citation2016) and the OWDA scPDSI reconstruction back to 850 CE, comparing them to selected forced last-millennium CMIP5 model (CCSM4 and MPI-ESM-P) simulations and instrumental records over the twentieth century. At decadal-centennial scales, they found a positive coupling between warm-season temperature and hydroclimate (i.e. warm and wet) in Fennoscandia and other parts of northern Europe. In contrast, tendencies for a negative relationship (i.e. warm and dry) were found in southern Europe. However, compared to instrumental data, the proxy tree-ring based reconstructions were shown to have a too positive temperature-hydroclimate relationship, particularly in the high frequency (annual resolution) domain, while forced last-millennium model simulations showed a too negative relationship across all timescales. This temperature bias in the Scandinavian portion of the OWDA reconstruction was at partly attributed to the fact that several of the predictor chronologies from northern Scandinavia were strongly and positively related to warm-season temperature rather than being direct predictors of drought. These chronologies were used to indirectly predict soil moisture availability by leaning on its inverse relationship to clear skies and consequently on high temperatures and reduced rainfall (see Cook et al. [Citation2015] and the discussion in Ljungqvist et al. [Citation2019] for details). Despite the observed differences in the temperature-hydroclimate co-variability patterns in instrumental, reconstructed and model simulated data, Ljungqvist et al. (Citation2019) found that all data types share relatively similar phase-relationships between temperature and hydroclimate.
3.3. SPEI
A number of historical reconstructions utilizing warm-season SPEI as a predictor of past hydroclimate variability are available from Fennoscandia (Seftigen et al. Citation2015a; Seftigen et al. Citation2015b; Seftigen et al. Citation2017). In fact, the first gridded hydroclimate proxy reconstruction (0.5° latitude x 0.5° longitude) developed for Fennoscandia used SPEI as the target variable (Seftigen et al. Citation2015a), reconstructed from a dense network of moisture sensitive tree-ring chronologies in Sweden. The reconstruction reveals large decadal-scale variability in wet and dry periods over the last 1000 years. The eleventh, twelfth and seventeenth centuries are standing out with its high number of spatially extensive moisture anomalies (defined as area [no. of grid points] where SPEI > 2.0 or <2.0). The seventeenth century anomalies are notably coinciding with the coldest period in Scandinavia in the past millennium (Linderholm et al. Citation2015). The fifteenth and sixteenth centuries are on the contrary rather absent of any widespread droughts/pluvials. Moreover, the reconstruction shows evidence for a zonal anti-phasing behavior in wet and dry periods, where there is a tendency for northern Fennoscandia to be wet when the southern parts of the domain are experiencing drier than normal conditions. This zonal dipole structure is also evident in the instrumental data, and is associated with the summer NAO-like atmospheric pressure patterns, indicating an important role of the circulation on the moisture distribution in the region.
Building on the previous tree-ring based SPEI reconstruction efforts in Seftigen et al. (Citation2015a), Seftigen et al. (Citation2017) employed a paleoclimate data-model comparison framework to further explore the drivers and dynamics of drought and pluvials across Fennoscandia. The collective comparison reveals large differences between GCM-simulated and reconstructed SPEI time series, despite a general agreement on the modes of atmospheric variability that produce regional hydrologic anomalies in the proxy and model datasets. Moreover, the GCM-simulated multi-decadal and/or longer hydroclimate variability was shown to be systematically smaller than the proxy-based estimates, whereas the dominance of GCM-simulated high-frequency components of variability were not reflected in the proxy record. Further, Seftigen et al. (Citation2017) explored the link between regional hydroclimate and temperature in the model simulations and in the paleoclimate evidence. Notably and in line with Ljungqvist et al. (Citation2019) the authors found an in-phase coherence between regional hydroclimate and temperature in the tree-ring reconstructions on decadal timescales, i.e. sustained wet periods in the past are often concurrent with warm periods and vice versa. The CMIP5-PMIP3 archive showed, however, an out-of-phase coherence between the two variables in the last millennium. This discrepancy and the lack of adequate understanding of mechanisms linking temperature and moisture supply on longer timescales was pointed out to have serious implications for attribution and prediction of regional hydroclimate changes.
3.4. Summary
The collective comparison of climate proxy evidence suggests hydroclimatic conditions have persistently been shifting in Fennoscandia over the Common Era, with large interannual and decadal fluctuations. There is support for long periods of rather severe dry warm-season conditions from ∼1000 to 1200 CE, while overall wetter summers prevailed in the thirteenth and fourteenth centuries, in parallel to the global onset of the LIA. A shift towards drier conditions in the early nineteenth century appears in the proxy records from southern Sweden and Finland, yet not in the record from Mideast Sweden, suggesting a somewhat spatially confined anomaly. Putting the modern-day warm-season hydroclimate in Fennoscandia in a millennia perspective suggests that we might currently experience a slow progression towards increasingly pluvial conditions, already in the marginal bands of its historical fluctuations. We caution, however, that this twentieth-century trend is far from conclusive amongst the available hydroclimate proxy data and that additional evidence is needed to reach a more definite conclusion.
4. Variation of drought since the 1900s
The literature reviewed in this section are those that focused on hydroclimate changes (including extreme precipitation changes) since 1902 and until 2018 based on observational precipitation and observational-data-derived SPI, AI, PDSI (including scPDSI) and SPEI. We aimed at reviewing all existing published papers that fulfill the above criterion. Therefore, besides the papers that focused on Sweden, we also include those that covered Continental Europe or even the globe. Some papers concerning assessment of climate model capability in simulating the observational hydroclimate changes and concerning the causes of the changes (e.g. from atmospheric circulation perspectives) are also included.
4.1. Precipitation and SPI
Annual precipitation in Sweden has increased over the period 1901–2010 and 1951–2010 according to the records from Climatic Research Unit (CRU), Global Historical Climatology Network (GHCN) and Global Precipitation Climatology Centre (GPCC) datasets (Hartmann et al. Citation2013). The magnitudes of the trends are similar in the three datasets, which are about 2.5–25 mm/year per decade (Hartmann et al. Citation2013). The trends are significant over whole Sweden since 1901, while they become insignificant in central-southern Sweden since 1951 (Becker et al. Citation2013; Hartmann et al. Citation2013). According to Caloiero et al. (Citation2018).
The increase of winter precipitation contributed most to the increase of annual precipitation, particularly in southern Sweden (Bengtsson and Rana Citation2014; Caloiero et al. Citation2018). At the same time, the increased annual precipitation in northern and northeast Sweden were mainly the result of the increased precipitation in spring (mainly in March and May) and summer (mainly in July) respectively. Further, the increased autumn precipitation (mainly in September for southern Sweden and November for whole Sweden) is a major factor for the increased annual precipitation for central and southern Sweden.
Large-scale atmospheric circulation such as North Atlantic Oscillation (NAO) influences the precipitation variation in Northern Europe (Hurrell Citation1995; Busuioc et al. Citation2001), particularly during winter (Uvo Citation2003; Trigo et al. Citation2008). For example, the increase of March precipitation in northern Sweden has been linked to the increase of cyclonic activities caused by the enhanced NAO (Paredes et al. Citation2006). The synoptic circulation pattern changes, reflecting large-scale changes in the atmospheric wave (Hurrell and Deser Citation2010), are found to contribute to wetting trends in Northern Europe from January to March and June over 1963–2001 (Fleig et al. Citation2015). The summer North Atlantic Oscillation (SNAO) and also the planetary-scale wave-train pattern can significantly influence the summer precipitation variability in Scandinavia (Folland et al. Citation2009; Bladé et al. Citation2012; Saeed et al. Citation2014). However, climate model simulations from two CMIP3 models (HadCM3 and GFDL-CM2.1) fail in simulating the impacts of SNAO on the summer precipitation variability (Bladé et al. Citation2012).
The ensemble mean of climate model simulations from CMIP5 historical runs replicates the increasing trend of annual precipitation in Sweden over 1901–2010, but weaker compared to the observational trend derived from the GPCC dataset (Krakauer and Fekete Citation2014). Regional climate model simulations underestimate the magnitude of the positive trend of winter precipitation in Northern Europe over recent decades possibly due to the low signal-to-noise ratio of anthropogenic-induced changes in NAO, which can largely influence winter precipitation in Northern Europe (Bhend and Von Storch Citation2008).
Annual precipitation extremes, derived from various precipitation indices, show increasing trends in Sweden over 1961–2004 according to records from the majority of Swedish meteorological stations, yet only a small number of the stations show significant trends (Achberger and Chen Citation2006). Most of the stations show an increasing trend of precipitation extremes in winter, spring and summer, while in autumn, a significant amount of stations show negative trends (Achberger and Chen Citation2006). Spring and summer are the seasons when Sweden has the largest number of stations having positive trends in precipitation extremes (Achberger and Chen Citation2006). The spatial structure of the annual and seasonal trends greatly varies in magnitude and sign even within a short distance in Sweden (Achberger and Chen Citation2006) and also for the whole Europe (Zolina Citation2012; Hov et al. Citation2013). This may reflect an impact of topography on precipitation distribution features (Johansson and Chen Citation2003; Jeong et al. Citation2011). Differences in the magnitude and sign of trends depending on seasons is also a common feature that has been observed from other analysis of precipitation extreme trends in Europe (Hundecha and Bárdossy Citation2005; Moberg and Jones Citation2005; Schmidli and Frei Citation2005). Using updated station data, Kivinen et al. (Citation2017) found that the frequency of the 1% most extreme daily precipitation in northern Fennoscandia showed a weak increasing trend over the period 1914–2013. The annual maximum daily precipitation in Sweden shows an increasing trend but not significant over 1880–2017 (Belusic et al. Citation2019). Over the entire twentieth century, most significant increasing trends of precipitation extreme indices appear in cold seasons in Northern Europe (Chen et al. Citation2014). Global climate models in general underestimate rainfall extremes partly because of their coarse spatial resolution (Hov et al. Citation2013). This is especially true for convective precipitation in summer (Chen et al. Citation2020) which can be more realistically simulated by higher resolution convection-permitting models (Lind et al. Citation2020).
For the period 1951–2016, the 3-month SPI show significant increasing trends over parts of southern and northern Sweden in winter and summer, and over northern and eastern Sweden in spring (Caloiero et al. Citation2018); the 6-month SPI show significant increasing trends mainly in northern Sweden during autumn and winter, and in most of Sweden except for central-eastern part during spring and summer (Caloiero et al. Citation2018); the 12- and 24-month SPI show significant increasing trends over most of Sweden except for the central-eastern part (Caloiero et al. Citation2018). A significant tendency towards less frequent droughts in Northern Europe, especially in winter and spring has been detected since the 1950s based on 3-month SPI (Spinoni et al. Citation2014; Citation2017; Gudmundsson and Seneviratne Citation2015), although both precipitation and potential evapotranspiration have increasing trends over the same time period (Spinoni et al. Citation2015a).
4.2. AI
According to the AI, Sweden was classified as a humid hydroclimate type over 1960–2009 (Zarch et al. Citation2015). Over this period the annual AI shows an increasing trend (indicating a wetting tendency) in northern Sweden due to increase of precipitation and decrease of PET, and a decreasing trend (indicating a drying tendency) in southern Sweden due to increasing PET (Zarch et al. Citation2015). The increasing trend in northern Sweden is mainly due to the wetting over 1960–1979, while after 1979, northern Sweden shows a drying trend; The decreasing trend of AI in southern Sweden is also contributed by the period of 1960–1979, while after 1979, it shows a wetting trend (Zarch et al. Citation2015). However, the shifts of the trends between the two periods are insignificant (Zarch et al. Citation2015; Prăvălie et al. Citation2019). For the period of 1948–2005, AI also shows a wetting trend over northern Sweden (Greve et al. Citation2014). However, there is a lack of study on changes in seasonal variability of AI over Sweden.
4.3. PDSI
Several PDSI including PDSI_th, scPDSI_th, PDSI_pm and scPDSI_pm (th: PET based on Thornthwaite equation; pm: PET based on PM equation) show increasing trend (indicating a wetting tendency) over northern and southern Sweden, and slightly decreasing trend (indicating a drying trend) over central and southeast Sweden over 1950–2008 (Dai Citation2011a; Citation2011b). A similar pattern of annual scPDSI trends over Sweden can be found from Sheffield et al. (Citation2012), although there is a larger domain with a drying trend appearing in the south. The discrepancy between these two studies might be caused by differences in the datasets used to determine the PET component (Trenberth et al. Citation2014; Dai and Zhao Citation2017). The drying trend domain revealed by scPDSI_th is slightly larger than that revealed by scPDSI_pm in Dai (Citation2011b), which is due to lager impacts of temperature increase on the drying trend revealed by scPDSI_th in which the calculation of PET is more dependent on temperature than that in scPDSI_pm (Sheffield et al. Citation2012). The wetting trend may be due to increasing annual precipitation over whole Sweden and weaker increasing trend of air temperature in the north, while the drying trend is mainly due to increasing air temperature and weaker increasing trend in precipitation in eastern Sweden (Dai Citation2011a, Citation2013). PDSI shows a wetting trend over northern Sweden and a drying trend over southern Sweden for the period 1950–2002 (Dai et al. Citation2004). A similar pattern can also be found for the period 1901–1949, but the wetting trend over northern Sweden is weaker than the late half of the twentieth century (Dai et al. Citation2004).
The state-of-the-art climate models can replicate the increasing trend of annual scPDSI_pm over parts of far-southern Sweden during 1950–2014, but with a weaker magnitude compared to observations (Zhao and Dai Citation2017). However, assessment of climate models in replicating the pattern of the observed wetting/drying trends over other parts of Sweden is lacking.
4.4. SPEI
SPEI at the combined timescale (ranging from 1-month to 48-month) shows increasing trend (wetting tendency) in northern and southern Sweden, and decreasing trend (drying tendency) or even slightly increasing trend in scattered areas of central Sweden over 1950–2009 (Beguería et al. Citation2014). According to the 3-month SPEI, there is a wetting trend in Sweden over 1950–2014, especially for winter and autumn (Spinoni et al. Citation2017). The wetting trends are slightly weaker than those revealed by 3-month SPI, indicating a negative impact of temperature increasing on wetting trends over the period (Spinoni et al. Citation2017). The drought event frequency and severity also show a decreasing trend especially for winter and autumn over whole Sweden and for all the four seasons in southern Sweden over 1950–2014 (Spinoni et al. Citation2017). However, since 1981, drought event frequency has shown an increasing trend in spring especially over southern Sweden (Spinoni et al. Citation2017). 6-month SPEI shows a wetting trend over the whole of Sweden for the period 1958–2014, with significant trends in far-southern Sweden (Stagge et al. Citation2017). Based on a combined index made based on three annual drought indices (SPI, SPEI and Reconnaissance Drought Index [RDI]), the frequency and severity of meteorological drought show significant decreasing trend over most of Sweden over 1950–2012 (Füssel et al. Citation2012; Spinoni et al. Citation2015a).
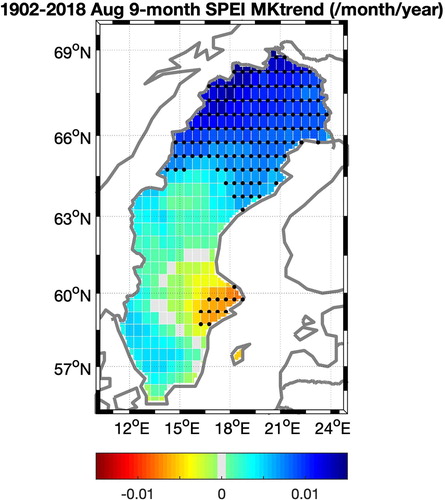
shows the spatial pattern of the 9-month SPEI trend for August over Sweden during the period 1902–2018. The trend analysis is based on Sen’s slope and Mann-Kendall Tau trend (MKtrend) significance test (Burkey Citation2006). The timescale of 9-month was used to calculate the SPEI, so the drought status of a month is calculated based on the hydroclimate conditions (precipitation and potential evapotranspiration) of the previous 9 months. The selection of the timescale is based on its suitability on reflecting the typical timescale of groundwater recharge (usually 6 months and above). Over 1902–2018, significant wetting was shown over Northern Sweden while significant drying was found over Southeastern Sweden.
Figure 2. Spatial pattern of 9-month SPEI trend for August over the period 1902–2018, calculated based on CRU TS4.03 monthly precipitation and evapotranspiration dataset (Harris et al. Citation2020). Grids, where the trends are significant at p < 0.05 level, are shown in black dots.
4.5. Summary
According to the studies reviewed above, Sweden shows an overall wetting trend since the 1900s, in particular since the middle of the twentieth century. The wetting trend is most clear in northern Sweden where annual precipitation, especially winter precipitation, has significantly increased. In contrast, drying trends have been detected in central or southern Sweden where the increasing trend of precipitation is smaller than that in the north. However, the significance, magnitude, location and even sign of the trends are sensitive to drought index used, time period, and timescale. Nevertheless, a drying trend (relevant to hydrological drought such as low groundwater level) since 1981, seems to be robust in central-eastern part of Sweden where 6-month SPI does not show significant increasing trends in spring and summer as can be seen in other parts of Sweden.
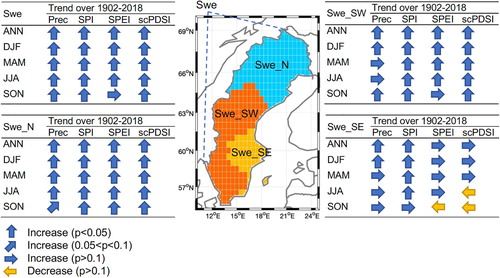
summarizes annual and seasonal trends of precipitation and the three drought indices: SPI, SPEI and scPDSI, for the whole Sweden and three sub-domains over 1902–2018. The timescale of 9-month was used to calculate the SPI and SPEI indices. scPDSI usually has a fixed temporal scale between 9 and 12 months (Guttman Citation1998). The precipitation data is derived from GPCC Full Data Monthly Product Version 2018 (Schneider et al. Citation2018). The scPDSI data is derived from CRU drought indices dataset (https://crudata.uea.ac.uk/cru/data/drought/#global). The calculations of SPI and SPEI are based on precipitation and PET data derived from CRU TS v.4.03 dataset (Harris et al. Citation2020). The trend analysis is also based on Sen’s slope and Mann-Kendall Tau trend significance test. The subdomains are defined based on the trend analysis shown in . The northern Sweden domain (Swe_N) is defined as the region where 9-month SPEI in August over 1902–2018 was significantly increasing; the southwestern domain (Swe_SW) is defined as the region where the SPEI was increasing but not significant; the southeastern domain (Swe_SE) is defined as the SPEI was decreasing. From , we can see that there are drying trends only in southeastern Sweden during summer and autumn over 1902–2018.
Figure 3. Trends of annual (ANN) and seasonal (winter: DJF, spring: MAM, summer: JJA, autumn: SON) precipitation, 9-month SPI, 9-month SPEI and scPDSI of whole Sweden (Swe) and three sub-domains (northern Sweden: Swe_N, southwestern Sweden: Swe_SW, southeastern Sweden: Swe_SE) over the period 1902-2018. Shadings on the map indicate the three identified sub-domains over Sweden.
5. Future (-2100) projections
Future projection of drought is based on simulations using GCMs under different future emission scenarios for the twenty-first century. In terms of the published results, most models either belong to GCMs participated in the Coupled Model Intercomparison Project Phase 3 (CMIP3) (Meehl et al. Citation2007a) or the Coupled Model Intercomparison Project Phase 5 (CMIP5) (Taylor et al. Citation2012). Projections based on the Coupled Model Intercomparison Project Phase 6 (CMIP6) (Eyring et al. Citation2016) are being used by the upcoming IPCC 6th Assessment report and some of these projections are starting to be published. However, projections by GCMs are generally on a coarse horizontal resolution, e.g. around 250 km. High-resolution regional climate models (RCMs), e.g. 0.44° (∼50 km) over Europe was used by Strandberg et al. (Citation2015). These RCMs were forced by the GCM simulations to provide high-resolution drought projections. Given realistic boundary conditions RCMs have been shown to realistically reproduce conditions of drought in parts of Europe including southern Scandinavia (Maule et al. Citation2013).
The emission scenarios for the twenty-first century of the CMIP3 projections were produced and documented in the Special Report on Emission Scenarios (SRES emission scenarios; Nakićenović et al. Citation2000). The SRES include A1 scenarios and A1 family (A1T; A1B; A1Fl), B1, A2, and B2. Starting from the CMIP5 projections, a new greenhouse gas concentration (not emissions) trajectory, the so-called Representative Concentration Pathways (RCPs), was adopted which superseded the SRES projections (Moss et al. Citation2010). The RCPs include RCP2.6, RCP4.5, RCP6 and RCP8.5. In terms of global mean temperature change, RCP8.5 is close to A2, but below A1F1; RCP6.0 is close to RCP4.5, but with a lower (higher) temperature change before (after) the later 2060s compared to that of RCP4.5, which follows B1 but increases toward B2 by 2100; there is no SRES which is comparable with RCP2.6; scenarios A1B, A1T, and B2 lie in the large gap between RCP8.5 and RCP4.5/6.0 (Burkett et al. Citation2014). The shared socio-economic pathways (SSPs) were adopted in CMIP6 (Riahi et al. Citation2017), in which both the socioeconomic challenges for mitigation and socioeconomic challenges for adaptation were considered (O’Neill et al. Citation2017). There are five distinctly different pathways about future socioeconomic developments, i.e. SSP1 (Sustainability), SSP2 (Middle of the Road), SSP3 (Regional Rivalry), SSP4 (Inequality), and SSP5 (Fossil-fueled development) (O’Neill et al. Citation2017). The SSPs are developed focusing on the forcing levels covered by the RCPs (Riahi et al. Citation2017), in which their instantaneous radiative forcing matches that of the corresponding RCPs, e.g. SSP2-4.5 and SSP5-8.5 have the same forcing levels as RCP4.5 and RCP8.5. However, the effective radiative forcing (ERF) of the prescribed concentrations of greenhouse gases (GHG) is larger in the SSPs than those of corresponding RCPs, which may lead to stronger warming in the CMIP6 projections (e.g. Wyser et al. Citation2020).
In addition to SRES and RCPs, the response of changes in drought conditions under high CO2 concentration (double CO2: 2 × CO2) is summarized in this work, which highlights the human impact on the changes in drought conditions. Projected changes in drought condition when the global temperature reaches 1.5°C, 2.0°C, and 3.0°C warming are also included in this work.
5.1. Precipitation and SPI
Annual precipitation in Sweden is projected to significantly increase associated with the increase in temperature under all RCPs during 2006–2100, especially over northern Sweden (Greve et al. Citation2018; Martin Citation2018). Annual precipitation is projected to increase during near-term (∼2011–2040), mid-term (∼2041–2070), and long-term (∼2071–2100) under RCP4.5, RCP8.5, A1B, A2, and B3 with reference to (w.r.t.) a 30-year historical period during 1961–2010 (Räisänen et al. Citation2003; Dai Citation2011a; Eklund et al. Citation2015; Sjökvist et al. Citation2015; Zhao and Dai Citation2017; Dezsi et al. Citation2018; Spinoni et al. Citation2020). In addition to the projected increase in annual precipitation over Sweden under RCPs and SRES, the precipitation is also projected to increase following the increase in the CO2, based on CMIP5 transient CO2 increase to 2 × CO2 simulations (Fu and Feng Citation2014). The increase in precipitation is associated with an increase in heavy precipitation, especially over Northern Sweden during 2071–2100 under RCP8.5 (w.r.t. 1971–2000) (Olsson and Foster Citation2013; Olsson et al. Citation2017; Davour Citation2019).
For most regions, the large-scale patterns of wetting and drying, based on precipitation, are similar between CMIP5 under RCP 4.5 and 8.5 and CMIP6 under the Shared Socioeconomic Pathways (SSP) 2-4.5 and 5-8.5 (e.g. Cook et al. Citation2020; Ukkola et al. Citation2020). However, there is a clear difference in the changes between CMIP5 under RCP8.5 and CMIP6 under SSP5-8.5 over southern Sweden during the warm season (AMJJAS), with a projected drying in CMIP6 while a wetting in CMIP5 during the long-term w.r.t. 1851–1880 (Cook et al. Citation2020). The difference may be due to the projected stronger warming in the CMIP6 models, which is caused by the stronger ERF of GHG in the SSPs than those of the corresponding RCPs with the same forcing levels (e.g. Wyser et al. Citation2020).
Seasonal difference in the projected changes in precipitation is evident. Precipitation is projected to increase over whole Sweden in winter and spring, increasing more (less) in northern (southern) in summer and autumn during the mid-term and long-term under A1B, RCP8.5 and 4.5 w.r.t. 1961–1990 or 1971–2000 (Heinrich and Gobiet Citation2012; Eklund et al. Citation2015; Strandberg et al. Citation2015). Here, four seasons are defined using the commonly used definition, i.e. winter (DJF), spring (MAM), summer (JJA), and autumn (SON). Lind and Kjellström (Citation2008) pointed out that the largest increase signals are seen in winter and in northern Sweden, where precipitation increases by around 25% (6–44%) during the long-term under A1F1, A1, A1T, A1B, B2, B1 w.r.t. 1961–1990. In southern Sweden, the corresponding value is +11%. In summer, the precipitation increase is moderate and some projections even indicate a decrease in southern Sweden during the long-term under A2 and B2 w.r.t 1961–1990 (Räisänen et al. Citation2003; Eckersten et al. Citation2008).
The annual number of dry days (number of days with precipitation less than 1 mm) will not likely increase over Sweden during the long-term under RCP4.5 and 8.5 w.r.t. 1971–2000 (Strandberg et al. Citation2015). The maximum number of consecutive dry days will decrease in northern Sweden during 2069–2098 w.r.t. 1961–1990 under both RCP4.5 and 8.5, while there is no change in southern Sweden (Eklund et al. Citation2015). Dry events are projected to decrease over Sweden based on SPI (Heinrich and Gobiet Citation2012; Spinoni et al. Citation2015b). The SPI-3 (3 months) would increase during the mid-term under A1B w.r.t. 1961–1990 which is similar to that of changes in precipitation (Heinrich and Gobiet Citation2012). Significantly increasing trend in SPI-6 (6 months) is found over Sweden during 2006–2100 under RCP8.5 (Martin Citation2018). The mean, duration, and frequency of drought based on SPI-6 is projected to decrease over Sweden under 1.0°C, 1.5°C, and 2.0°C global warming w.r.t. 1971–2000 based on projections under RCP2.6, RCP6.0, and RCP8.5 (Xu et al. Citation2019). Based on SPI-6, exceptional drought (<2% percentile of the index over the 1961–2005 baseline period) is projected to decrease during 2010–2054, 2055–2099 under RCP8.5 w.r.t. 1961–2005 (Touma et al. Citation2015). SPI-12 (12 months) based drought events in Sweden is projected to be less frequent during the mid-term under A1B w.r.t. 1981–2010, especially over the northern part (Spinoni et al. Citation2015b). Similarly, SPI-12 is projected to increase over Sweden during the long-term under RCP8.5 w.r.t. 1980–1999 (Orlowsky and Seneviratne Citation2013).
5.2. AI
PET is projected to significantly increase over Sweden during the long-term under RCP8.5 w.r.t. 1980–2000 (Greve and Seneviratne Citation2015; Scheff and Frierson Citation2015). Both ET and PET are projected to increase over Sweden during the near-term and mid-term under RCP4.5 w.r.t. 1961–1990 (Dezsi et al. Citation2018).
Precipitation-PET (P-PET) is projected to significantly increase over northern Sweden during the long-term under RCP8.5 w.r.t. 1980–2000 (Greve and Seneviratne Citation2015). In the same period, an increasing trend in P-PET can also be found in southern Sweden, but the change is not significant. The projected changes in the difference between precipitation and ET (P-PET) are similar to that of P-PET (Greve and Seneviratne Citation2015). Greve et al. (Citation2018) also shows an overall increasing trend in P-PET over Sweden, especially over the northern part, under all the RCPs w.r.t. 1980–1999 associated with the increase in temperature.
There are no clear projected changes in the aridity index (ET/precipitation) during the near-term and mid-term under RCP4.5 w.r.t. 1961–1990, although a slightly drying trend can be found over southeast Sweden during the two future periods (Dezsi et al. Citation2018). No increase/decrease in precipitation/PET (P/PET) over Sweden can be found during the long-term under RCP8.5 w.r.t. 1981–1999 (Scheff and Frierson Citation2015). P/PET was projected to increase over the whole Sweden with the increasing CO2 based on the CMIP5 transient CO2 increase to 2 × CO2 simulations (Fu and Feng Citation2014).
5.3. PDSI
A clear regional difference in the projected changes in PDSI and scPDSI can be found over Sweden. scPDSI is projected to increase over northern Sweden while a decrease over the south is expected during 2090–2099 under A1B w.r.t. 1975–1984 (Dai Citation2011a). Projected PDSI shows a decreasing (drying) trend during 2000–2046 and 2050–2096 (with a larger trend in the later period) over southern Sweden under A2 using HadCM3 (Burke et al. Citation2006). An increasing trend can be found over northern Sweden during the period 2050–2096.
The frequency of dry events are projected to decrease over Scandinavia during 2021–2050 w.r.t. 1961–1990 based on scPDSI calculated using RCMs downscaled GCMs projections under A1B (Heinrich and Gobiet Citation2012). A wet (dry) condition is projected over northern (southern) Sweden during the long-term under RCP8.5 w.r.t. 1931–1990, based on PDSI, which is due to the increase in precipitation (PET) (Cook et al. Citation2014). Based on a different approach, PDSI is expected to decrease w.r.t. 1985–2005 over Sweden, especially over southern Sweden, with the global temperature increase of 1.5°C and 2.0°C (Liu et al. Citation2018b).
5.4. SPEI
Based on SPEI-12 (12 months), a clear increase (decrease) in the drought events/frequency during the mid-term and long-term under A1B, RCP4.5 and 8.5 w.r.t. 1981–2010 can be found over southern (northern) Sweden, while a general decrease in drought events during 2071–2100 is shown over Sweden (Spinoni et al. Citation2015b; Citation2020). A wetter (drier) condition is projected over northern (southern) Sweden during the long-term under RCP8.5 w.r.t. 1931–1990 (Cook et al. Citation2014) Drought magnitude is projected to increase (decrease) in south (north) Sweden under 1.5°C, 2.0°C, and 3.0°C warming w.r.t. 1976–2005 (Naumann et al. Citation2018).
Based on SPEI-6 (6 months), exceptional droughts (<2% percentile of the index over the 1961–2005 baseline period) are projected to increase over southern Sweden during both 2010–2054 and 2055–2099 under RCP8.5 w.r.t. 1961–2005 (Touma et al. Citation2015); mean and frequency of drought are projected to increase under 2.0°C warming w.r.t. 1971–2000, especially over southern Sweden (Xu et al. Citation2019).
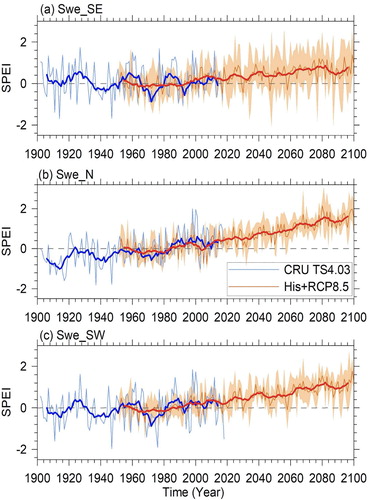
shows the variation of August 9-month SPEI averaged over the three subdomains of Sweden shown in . It should be pointed out that the results are based on the ensemble mean of the Rossby Centre regional atmospheric model, RCA4, driven by eight GCMs and one observation realism (CRU TS4.03; Harris et al. Citation2020). Consequently, the decadal variability of the model ensemble mean is weaker than that of the observation. Individual model simulation has similar decadal variability with the observation. The results show that the future projected changes in the SPEI are generally following the trend as observed during the past century. Northern Sweden, where a wet tendency was observed, is projected to be wetter than the current condition. Large inter-model variation is found for southeast Sweden, where a dry tendency was observed during the past century. We may expect a drying trend over some parts of this region at the end of the twenty-first century.
Figure 4. Variation of regional averaged August 9-month SPEI from observation and model simulations in the three subdomains defined in . (a) Southeastern Sweden (Swe_SE): where a decreasing (drying) trend in SPEI is observed as shown in ; (b) Northern Sweden (Swe_N): where a significant increase (wetting) in SPEI is found as shown in ; (c) Southwestern Sweden (Swe_SW): where a weak increasing (wetting) trend in SPEI is observed as shown in . The observation is based on CRU TS4.03 as shown in . The model simulations are monthly historical simulation (1951-2005) and RCP8.5 projection (2006-2100) of Rossby Centre regional atmospheric model, RCA4, driven by 8 GCMs. The 8 GCMs are CanESM2, CSIRO-Mk3.6.0, IPSL-CM5A-MR, MIROC5, HadGEM2-ES, MPI-ESM-LR, NorESM1-M, GFDL-ESM2M. The reference period for calculating the SPEI index is set to the historical simulation time period, i.e. from January 1951 to December 2005, for both observation and model simulations. (Thick lines show a 9-year running average.)
5.5. Summary
Overall, precipitation is projected to significantly increase in Sweden, especially over northern Sweden. This is consistent with the observed changes over the last 120 years. Projected changes in the drought index based on precipitation only, i.e. SPI, is similar to the projected changes in the precipitation. Projected changes in other drought indices, with temperature and moisture considered, are different from that of the SPI. There is no clear trend in AI. Projected changes in PDSI (including scPDSI) and SPEI are similar to each other, which shows a wetting trend in northern Sweden and a drying trend in southern Sweden. The projected wet (dry) condition over northern (southern) Sweden may be due to the increase in precipitation (PET) (Cook et al. Citation2014). The main information of projected changes in precipitation and drought indices is summarized in .
Figure 5. Summary of the projected changes (or linear trend when no reference period is given) in precipitation and drought indices with major references cited. Sweden has been roughly divided into two parts, northern Sweden (North S) and southern Sweden (South S), since most of the results are based on a global picture. Cited references: (1) Burke et al. Citation2006 [HadCM3 3 member; SRES A2]; (2) Collins et al. Citation2013 [39 CMIP5 GCMs; RCP8.5]; (3) Cook et al. Citation2014 [15 CMIP5 GCMs with 34 members; RCP8.5]; (4) Cook et al. Citation2020 [13 CMIP6 GCMs; SSP1-2.6 37 member, 2–4.5 37 member, 3–7.0 44 member, 5–8.5 35 member ]; (5) Dai Citation2011a [22 CMIP3 GCMs; SRES A1B]; (6) Dezsi et al. Citation2018 [15 CMIP5 GCMs; RCP4.5]; (7) Eklund et al. Citation2015 [RCA4 driven by 9 CMIP5 GCMs; RCP4.5, 8.5]; (8) Greve and Seneviratne Citation2015 [30 CMIP5 GCMs; RCP8.5]; (9) Heinrich and Gobiet Citation2012 [8 RCMs driven by 6 GCMs; A1B]; (10) Knutti and Sedlacek Citation2013 [30 CMIP5 GCMs; RCP8.5; 19 CMIP3 GCMs; SRES A2]; (11) Martin Citation2018 [24 CMIP5 GCMs; RCP8.5]; (12) Meehl et al. Citation2007b [21 CMIP3 GCMs; SRES A1B]; (13) Orlowsky and Seneviratne Citation2013 [39 CMIP5 GCMs; RCP4.5]; (14) Räisänen et al. Citation2003 [RCAO driven by HadAM3H and ECHAM4/OPYC3; SRES A2, B2]; (15) Spinoni et al. Citation2020 [31 CORDEX downscaling; RCP 4.5 and 8.5]; (16) Strandberg et al. Citation2015 [RCA driven by 9 GCMs; RCP8.5]; (17) Zhao and Dai Citation2017 [40 CMIP5 GCMs; RCP4.5. 23 CMIP3 GCMs SRES A1B]. Significant test: S1 (more than two-thirds of the simulations agree with the sign of change), S2 (more than 75% of the simulations agree with the sign of change), S3 (more than 80% of the simulations agree with the sign of change), S4 (more than 90% of the simulations agree with the sign of change), S5 (Robustness metric R > 0.8; see Knutti and Sedlacek Citation2013 for more information of the R), S6 (Robustness metric R > 0.9), S7 (significant at 95% level), NoS (no significant test has been given in the reference).
![Figure 5. Summary of the projected changes (or linear trend when no reference period is given) in precipitation and drought indices with major references cited. Sweden has been roughly divided into two parts, northern Sweden (North S) and southern Sweden (South S), since most of the results are based on a global picture. Cited references: (1) Burke et al. Citation2006 [HadCM3 3 member; SRES A2]; (2) Collins et al. Citation2013 [39 CMIP5 GCMs; RCP8.5]; (3) Cook et al. Citation2014 [15 CMIP5 GCMs with 34 members; RCP8.5]; (4) Cook et al. Citation2020 [13 CMIP6 GCMs; SSP1-2.6 37 member, 2–4.5 37 member, 3–7.0 44 member, 5–8.5 35 member ]; (5) Dai Citation2011a [22 CMIP3 GCMs; SRES A1B]; (6) Dezsi et al. Citation2018 [15 CMIP5 GCMs; RCP4.5]; (7) Eklund et al. Citation2015 [RCA4 driven by 9 CMIP5 GCMs; RCP4.5, 8.5]; (8) Greve and Seneviratne Citation2015 [30 CMIP5 GCMs; RCP8.5]; (9) Heinrich and Gobiet Citation2012 [8 RCMs driven by 6 GCMs; A1B]; (10) Knutti and Sedlacek Citation2013 [30 CMIP5 GCMs; RCP8.5; 19 CMIP3 GCMs; SRES A2]; (11) Martin Citation2018 [24 CMIP5 GCMs; RCP8.5]; (12) Meehl et al. Citation2007b [21 CMIP3 GCMs; SRES A1B]; (13) Orlowsky and Seneviratne Citation2013 [39 CMIP5 GCMs; RCP4.5]; (14) Räisänen et al. Citation2003 [RCAO driven by HadAM3H and ECHAM4/OPYC3; SRES A2, B2]; (15) Spinoni et al. Citation2020 [31 CORDEX downscaling; RCP 4.5 and 8.5]; (16) Strandberg et al. Citation2015 [RCA driven by 9 GCMs; RCP8.5]; (17) Zhao and Dai Citation2017 [40 CMIP5 GCMs; RCP4.5. 23 CMIP3 GCMs SRES A1B]. Significant test: S1 (more than two-thirds of the simulations agree with the sign of change), S2 (more than 75% of the simulations agree with the sign of change), S3 (more than 80% of the simulations agree with the sign of change), S4 (more than 90% of the simulations agree with the sign of change), S5 (Robustness metric R > 0.8; see Knutti and Sedlacek Citation2013 for more information of the R), S6 (Robustness metric R > 0.9), S7 (significant at 95% level), NoS (no significant test has been given in the reference).](/cms/asset/6bbbac0b-b412-4494-95a2-9abeaa928854/tgaa_a_1841410_f0005_oc.jpg)
In addition to using a single drought index, Spinoni et al. (Citation2018) uses a combined drought indicator (based on SPI, SPEI, and reconnaissance drought indicator (RDI ∼ P/PET)) based on high-resolution (0.11°) bias-corrected regional downscaling. Their results show that the drought frequency over Sweden is projected to increase during 2041–2070 and 2071–2100 under RCP4.5 and 8.5 w.r.t. 1981–2010. However, this is no other work to compare due to different drought index and model products used.
The current work focuses on the changes in drought conditions under different scenarios, which to a large extent is a response to human impact. We should keep in mind that natural variability can, to a strong degree, mask out more or less any long-term signal even on decadal time scales in precipitation in this region (e.g. Martel et al. Citation2018). Large ensembles of simulations with the same or many GCMs are needed to address future climate change.
6. Conclusions and discussions
This review summarizes trends of dryness/wetness over Sweden in the past and future according to reconstructions based on proxy data (mainly tree-ring) for the past 2000 years (0–2012 CE), instrumental observations since 1902 (until 2018), and GCM/RCM model simulations for the past 2000 years and future 100 years (until 2100). The followings conclusions can be drawn:
Hydroclimatic conditions in Fennoscandia including Sweden experienced large interannual and decadal fluctuations between dry and wet periods over the Common Era. Compared to the last 2000 years, especially those severe dry conditions from ∼1000 to 1200 CE, the current climate is relatively wet.
Over the period 1902–2018, in particular from 1950 to 2014, there is an overall wetting trend mainly caused by an increase in winter precipitation for Sweden. The north experienced the most significant increase in precipitation, while the middle and the south saw smaller increases or even a decreasing trend.
The characteristics of the wetting and drying trends detected depend on the index used. However, the overall wetting trend over 1902–2018, and the drying trend (relevant to hydrological drought) in central-eastern part of Sweden over 1981–2018 seem to be robust.
Climate model projections for the future show that there would be a wetting trend in northern Sweden and a drying trend in southern Sweden, which is broadly consistent with what has been observed by the instrumental data.
The differences among the indices seem to become larger in future projections, which indicates the more important roles played by variables other than precipitation (e.g. temperature).
While integrating hydroclimatic indicators across proxy data, instrumental observations, and model simulations starting from 1300 years ago till the end of this century is a useful exercise, the integration met several challenges and the interpretation of the results needs some cautions.
First, it is not surprising to have divergent results on trend analysis based on different drought indices, because each of them focuses on different aspects of dryness, and can represent water surplus/deficit from different perspectives. Proper interpretation of the discrepancy of the results may bring insights into the cause and impact of drought trends. It is therefore often motivated to use multi drought indices to assess drought variability for a given region. The drought indices reviewed in this paper represent surface dry/wet conditions at various aspects. When AI, SPI and SPEI represent top-layer surface hydrological condition, PDSI/scPDSI can even significantly correlate with observed SM content within the top 1-meter depth during warm-season months in some regions (Dai et al. Citation2004), which may be used as an estimation of the 1-meter SM observations. These subtle differences among the drought indices and the distinct trends detected from different indices (e.g. as shown in ) imply that the inferences of past hydrological variability based on different proxies may have some discrepancy, if the proxies represent different aspects of surface dry/wet conditions. Observations of the deep-layer (deeper than 1-meter depth) hydrological condition are very limited. This hampers our understanding of the variability of the hydrological condition related to deep-layer SM and groundwater, and their relationship with climate change and ecosystem. Deep-layer SM data have been generated by the state-of-the-art land surface models together with an advanced data assimilation system (Rodell et al. Citation2004). Although the modeled SM may show large agreement to each other in some regions, there is still lack of observational data to make independent validations on the model outputs. Satellite data provide observational variability of land surface total water storage (Rodell et al. Citation2018), but the low spatial resolution and ambiguous representative on soil depth are still the disadvantages that need to be overcome for a regional analysis.
Second, the various paleoclimate data sets reviewed here are far from being conclusive in their evidence of past hydroclimate variability and change. It is important to recognize that moisture-related climate variables seldom are the dominant tree growth-limiting factors in Fennoscandia, as well as other regions characterized by a relatively cold and humid climate regime. This poses a challenge in developing reconstructions with a strong and temporally stable hydroclimate signal. In this context, it is wise to bear in mind that moisture availability will rarely control more than 50% of the inter-annual tree-growth variability, even at the most moisture-limited sites in the region. The tree-ring chronologies will therefore contain a significant fraction of variation that is unrelated to the hydroclimate, which will limit the interpretation of the tree-ring based estimates. Moreover, the quantification of the tree-ring response to climate almost always focuses on the high-frequency portion of variability, rendering the long-term changes (centennial to multi-centennial) the least reliable component of their variation. An additional challenge is posed by the spatial heterogeneity of precipitation and other hydroclimate related metrics, making tree-ring based hydroclimate reconstructions of these variables more challenging than reconstructions of e.g. temperature, and hence requiring denser networks of tree-ring predictors for meaningful reconstructions and interpretations of regional-scale patterns and changes. The fairly limited number of available hydroclimate proxy records currently available in Fennoscandia are not sufficient to represent such a climatologically heterogeneous region. Continued efforts to expand the spatial and temporal coverage of hydroclimate proxy records in this region is therefore paramount to advance our understanding of regional drought dynamics and underlying physical mechanisms.
Third, the impact of changing climate on groundwater resources is difficult to predict. In Sweden, inter-annual groundwater head fluctuations and therefore dynamic groundwater storage are strongly related to the migration of the temperate-cold climate zone boundary (Nygren et al. Citation2020). According to RCP8.5, the northwards retreat of cold humid climate zones are expected to continue within this century (Beck et al. Citation2018). This will have an influence on the processes and seasonality of groundwater recharge. Major differences are the dominant types of precipitation in winter, snow storage and the changing soil properties in winter due to frost (Jyrkama and Sykes Citation2007; Okkonen and Kløve Citation2011). These differences result in specific recharge patterns for the climate zones. In temperate climate, groundwater recharge mainly occurs in autumn and winter due to extensive rainfall whereas in cold climate, groundwater recharge mainly occurs during the snowmelt season in spring and early summer. These changes in recharge processes need to be considered in future prediction of groundwater droughts, e.g. based on the presented drought indices, and future groundwater management in general.
Finally, the existing studies often used different periods, different data sources, and different trend estimators, which makes it difficult to compare the results and to draw conclusions about the changes of dryness over Sweden in the past and into the future. Therefore, a unified framework such as using the same timescale, time period and even trend-detecting method is desirable to exclude the uncertainties associated with diversified analysis methods.
Acknowledgements
This work was supported by the Swedish government research council for sustainable development: FORMAS under Grant (number: 2018-00302) and Grant (number: 2018-02858). The authors are grateful to the two anonymous reviewers for their valuable comments and suggestions, and to the support by the Swedish national research programs BECC and MERGE.
Disclosure statement
No potential conflict of interest was reported by the author(s).
Additional information
Funding
Notes on contributors
Deliang Chen
Dr Deliang Chen is Professor of Physical Meteorology and August Röhss Chair in Physical Geography at the University of Gothenburg, Gothenburg, Sweden. His main research interests are Earth System Science and global environmental change with a focus on climate change and impacts in Europe and Asia. He is an elected member of six Academies in the world including the Royal Swedish Academy of Sciences and The World Academy of Sciences. He has served on numerous international and national committees and boards, as well as advised various governmental, intergovernmental, and international non-governmental bodies including funding agencies. A recent example is his role in the 6th IPCC working group I assessment report as a coordinating lead author.
Peng Zhang
Dr Peng Zhang is a researcher in physical geography at the University of Gothenburg, Gothenburg, Sweden. His main research interests are climate extremes and their interactions with forest.
Kristina Seftigen
Dr Kristina Seftigen is a researcher in physical geography at the University of Gothenburg, Gothenburg, Sweden. Her research interests are broadly focused on decadal-to-centennial hydroclimate variability in northern Europe during the past millennium.
Tinghai Ou
Dr Tinghai Ou is a principal research engineer in climate modeling at the University of Gothenburg, Gothenburg, Sweden. His main research interest is detecting and modeling regional climate change.
Markus Giese
Dr Markus Giese is a researcher in hydrogeology at the University of Gothenburg, Gothenburg, Sweden. His main research interests are groundwater dynamics and the impact of changing environmental and climatic conditions on water resources.
Roland Barthel
Dr Roland Barthel is Professor of Hydrogeology at the University of Gothenburg, Gothenburg, Sweden. His main research interests are groundwater dynamics; climate change impacts on groundwater resources and water supply; integrated water resources management.
References
- Achberger C, Chen D. 2006. Trend of extreme precipitation in Sweden and Norway during 1961–2004. Gothenburg (Sweden): University of Gothenburg. Report No.: C72.
- Ahmed K, Shahid S, Wang X, Nawaz N, Khan N. 2019. Spatiotemporal changes in aridity of Pakistan during 1901–2016. Hydrol Earth Syst Sci. 23(7):3081–3096.
- Ault TR, Cole JE, Overpeck JT, Pederson GT, St. George S, Otto-Bliesner B, Woodhouse CA, Deser C. 2013. The continuum of hydroclimate variability in Western North America during the last millennium. J Clim. 26(16):5863–5878.
- Baek SH, Smerdon JE, Coats S, Williams AP, Cook BI, Cook ER, Seager R. 2017. Precipitation, temperature, and teleconnection signals across the combined North American, monsoon Asia, and old world drought atlases. J Clim. 30(18):7141–7155.
- Bannayan M, Sanjani S, Alizadeh A, Lotfabadi SS, Mohamadian A. 2010. Association between climate indices, aridity index, and rainfed crop yield in northeast of Iran. Field Crops Res. 118(2):105–114.
- Beck HE, Zimmermann NE, McVicar TR, Vergopolan N, Berg A, Wood EF. 2018. Present and future Köppen-Geiger climate classification maps at 1-km resolution. Sci Data. 5:180214.
- Becker A, Finger P, Meyer-Christoffer A, Rudolf B, Schamm K, Schneider U, Ziese M. 2013. A description of the global land-surface precipitation data products of the global precipitation climatology centre with sample applications including centennial (trend) analysis from 1901–present. Earth Syst Sci Data. 5(1):71–99.
- Beguería S, Vicente-Serrano SM, Reig F, Latorre B. 2014. Standardized precipitation evapotranspiration index (SPEI) revisited: parameter fitting, evapotranspiration models, tools, datasets and drought monitoring. Int J Climatol. 34(10):3001–3023.
- Belusic D, Berg P, Bozhinova D, Bärring L, Döscher R, Eronn A, Kjellström E, Klehmet K, Martins H, Nilsson C et al. 2019. Climate extremes for Sweden. Norrköping (Sweden): SMHI. doi:10.17200/Climate_Extremes_Sweden.
- Bengtsson L, Rana A. 2014. Long-term change of daily and multi-daily precipitation in Southern Sweden. Hydrol Process. 28(6):2897–2911.
- Bhend J, Von Storch H. 2008. Consistency of observed winter precipitation trends in Northern Europe with regional climate change projections. Clim Dyn. 31(1):17–28.
- Bladé I, Liebmann B, Fortuny D, van Oldenborgh GJ. 2012. Observed and simulated impacts of the summer NAO in Europe: implications for projected drying in the Mediterranean region. Clim Dyn. 39(3–4):709–727.
- Bloomfield J, Marchant B. 2013. Analysis of groundwater drought building on the standardised precipitation index approach. Hydrol Earth Syst Sci. 17(12):4769–4787.
- Burke EJ, Brown SJ, Christidis N. 2006. Modeling the recent evolution of global drought and projections for the twenty-first century with the Hadley centre climate model. J Hydrometeorol. 7(5):1113–1125.
- Burkett VR, Suarez AG, Bindi M, Conde C, Mukerji R, Prather MJ, St. Clair AL, Yohe GW, et al. 2014. Point of departure. In: Field CB, Barros VR, Dokken DJ, editor. Climate change 2014: impacts, adaptation, and vulnerability part A: global and sectoral aspects contribution of working group II to the fifth assessment report of the intergovernmental panel on climate change. Cambridge (UK) and New York (NY, USA): Cambridge University Press; p. 169–194.
- Burkey J. 2006. A non-parametric monotonic trend test computing Mann-Kendall Tau, Tau-b, and Sen’s slope written in Mathworks-MATLAB implemented using matrix rotations. Seattle, WA: King County, Department of Natural Resources and Parks, Science and Technical Services Section.
- Busuioc A, Chen D, Hellström C. 2001. Temporal and spatial variability of precipitation in Sweden and its link with the large-scale atmospheric circulation. Tellus A: Dyn Meteorol Oceanogr. 53(3):348–367.
- Caloiero T, Veltri S, Caloiero P, Frustaci F. 2018. Drought analysis in Europe and in the Mediterranean basin using the standardized precipitation index. Water (Basel). 10(8):1043.
- Campbell BMS. 2016. The great transition: climate, disease and society in the late medieval world. Cambridge: Cambridge University Press.
- Casty C, Raible CC, Stocker TF, Wanner H, Luterbacher J. 2007. A European pattern climatology 1766–2000. Clim Dyn. 29(7–8):791–805.
- Chartres CJ, Noble A. 2015. Sustainable intensification: overcoming land and water constraints on food production. Food Secur. 7(2):235–245.
- Chen D, Gao G, Xu C-Y, Guo J, Ren G. 2005. Comparison of the Thornthwaite method and pan data with the standard Penman-Monteith estimates of reference evapotranspiration in China. Clim Res. 28(2):123–132.
- Chen D, Rodhe H, Emanuel K, Seneviratne SI, Zhai P, Allard B, Berg P, Björck S, Brown IA, Bärring L, et al. 2020. Summary of a workshop on extreme weather events in a warming world organized by the Royal Swedish Academy of Sciences. Tellus B: Chem Phys Meteorol. 72(1):1–13.
- Chen D, Walther A, Moberg A, Jones P, Jacobeit J, Lister D. 2014. European trend Atlas of extreme temperature and precipitation records. Netherlands: Springer.
- Collins M, Knutti R, Arblaster J, Dufresne JL, Fichefet T, Friedlingstein P, Gao X, Gutowski WJ, et al. 2013. Long-term climate change: projections, commitments and irreversibility. In: Stocker T.F., D. Qin, G.-K. Plattner, M. Tignor, S.K. Allen, J. Boschung, A. Nauels, Y. Xia, V. Bex, P.M. Midgley, editors. Climate change 2013: the physical science basis. Contribution of working group I to the fifth assessment report of the intergovernmental panel on climate change. Cambridge (UK) and New York (NY, USA): Cambridge University Press; p. 1029–1136.
- Cook BI, Mankin JS, Marvel K, Williams AP, Smerdon JE, Anchukaitis KJ. 2020. Twenty-first century drought projections in the CMIP6 forcing scenarios. Earth’s Future. 8:e2019EF001461.
- Cook ER, Seager R, Kushnir Y, Briffa KR, Büntgen U, Frank D, Krusic PJ, Tegel W, van der Schrier G, Andreu-Hayles L, et al. 2015. Old world megadroughts and pluvials during the common era. Sci Adv. 1(10):e1500561.
- Cook BI, Smerdon JE, Seager R, Coats S. 2014. Global warming and 21st century drying. Clim Dyn. 43(9–10):2607–2627.
- Cook ER, Woodhouse CA, Eakin CM, Meko DM, Stahle DW. 2004. Long-term aridity changes in the western United States. Science. 306(5698):1015–1018.
- Dai A. 2011a. Drought under global warming: a review. Wiley Interdiscip Rev Clim Change. 2(1):45–65.
- Dai A. 2011b. Characteristics and trends in various forms of the Palmer drought severity index during 1900–2008. J Geophys Res Atmos. 116(D12):D12115.
- Dai A. 2013. Increasing drought under global warming in observations and models. Nat Clim Change. 3(1):52–58.
- Dai A, Trenberth KE, Qian T. 2004. A global dataset of Palmer drought severity index for 1870–2002: relationship with soil moisture and effects of surface warming. J Hydrometeor. 5(6):1117–1130.
- Dai A, Zhao T. 2017. Uncertainties in historical changes and future projections of drought. Part I: estimates of historical drought changes. Clim Change. 144(3):519–533.
- Dannenberg MP, Wise EK. 2016. Seasonal climate signals from multiple tree ring metrics: a case study of Pinus ponderosa in the upper Columbia River Basin. J Geophys Res Biogeosci. 121(4):1178–1189.
- Davour D. 2019. Present and future extreme weather in Sweden according to the d4PDF [Master’s thesis]. Lund (Sweden): Lund University.
- Dezsi Ş, Mîndrescu M, Petrea D, Rai PK, Hamann A, Nistor MM. 2018. High-resolution projections of evapotranspiration and water availability for Europe under climate change. Int J Climatol. 38(10):3832–3841.
- Drobyshev I, Niklasson M, Linderholm HW, Seftigen K, Hickler T, Eggertsson O. 2011. Reconstruction of a regional drought index in southern Sweden since AD 1750. The Holocene. 21(4):667–679.
- Eckersten H, Karlsson S, Torssell B. 2008. Climate change and agricultural land use in Sweden. Uppsala (Sweden): Swedish University of Agricultural Sciences.
- Eddy JA. 1976. The maunder minimum. Science. 192(4245):1189–1202.
- Eklund A, Mårtensson JA, Bergström S, Björck E, Dahné J, Lindström L, Nordborg D, Olsson J, Simonsson L, Sjökvist E. 2015. Sveriges framtida klimat: Underlag till Dricksvattenutredningen. Norrköping (Sweden): SMHI. Report No.: Klimatologi 14.
- Eyring V, Bony S, Meehl GA, Senior CA, Stevens B, Stouffer RJ, Taylor KE. 2016. Overview of the coupled model intercomparison project phase 6 (CMIP6) experimental design and organization. Geosci Model Develop. 9(5):1937–1958.
- Fang X, Pomeroy JW. 2007. Snowmelt runoff sensitivity analysis to drought on the Canadian prairies. Hydrol Process. 21:2594–2609.
- Fleig AK, Tallaksen LM, James P, Hisdal H, Stahl K. 2015. Attribution of European precipitation and temperature trends to changes in synoptic circulation. Hydrol Earth Syst Sci. 19(7):3093–3107.
- Folland CK, Knight J, Linderholm HW, Fereday D, Ineson S, Hurrell JW. 2009. The summer North Atlantic Oscillation: past, present, and future. J Clim. 22(5):1082–1103.
- Fu Q, Feng S. 2014. Responses of terrestrial aridity to global warming. J Geophys Res Atmos. 119(13):7863–7875.
- Füssel H-M, Jol A, Hildén M, Isoard S, van Aardenne J, Georgi B, Fronzek S, Castellari S, Greiving S, Kurnik B et al. 2012. Climate change, impacts and vulnerability in Europe 2012 an indicator-based report. Copenhagen (Denmark): European Environment Agency. Report No.: 12/2012.
- Gimbel KF, Puhlmann H, Weiler M. 2016. Does drought alter hydrological functions in forest soils? Hydrol Earth Syst Sci. 20:1301–1317.
- Grafton RQ, Pittock J, Davis R, Williams J, Fu G, Warburton M, Udall B, McKenzie R, Yu X, Che N, et al. 2013. Global insights into water resources, climate change and governance. Nat Clim Change. 3(4):315–321.
- Greve P, Gudmundsson L, Seneviratne SI. 2018. Regional scaling of annual mean precipitation and water availability with global temperature change. Earth Syst Dyn. 9(1):227–240.
- Greve P, Orlowsky B, Mueller B, Sheffield J, Reichstein M, Seneviratne SI. 2014. Global assessment of trends in wetting and drying over land. Nat Geosci. 7(10):716–721.
- Greve P, Seneviratne SI. 2015. Assessment of future changes in water availability and aridity. Geophys Res Lett. 42(13):5493–5499.
- Gudmundsson L, Seneviratne SI. 2015. European drought trends. Proc Int Assoc Hydrol Sci. 369:75–79.
- Guttman NB. 1998. Comparing the palmer drought index and the standardized precipitation index. JAWRA J Am Water Resour Assoc. 34(1):113–121.
- Harris I, Osborn TJ, Jones P, Lister D. 2020. Version 4 of the CRU TS monthly high-resolution gridded multivariate climate dataset. Sci Data. 7(1):1–18.
- Hartmann DL, Tank AMGK, Rusticucci M, Alexander LV, Brönnimann S, Charabi Y, Dentener FJ, Dlugokencky EJ, Easterling DR, Kaplan A, et al. 2013. Observations: atmosphere and surface. In: Stocker TF, Qin D, Plattner G-K, et al., editors. Climate change 2013: the physical science basis contribution of working group I to the fifth assessment report of the intergovernmental panel on climate change. Cambridge (UK) and New York (NY, USA): Cambridge University Press; p. 159–254.
- Heinrich G, Gobiet A. 2012. The future of dry and wet spells in Europe: a comprehensive study based on the ENSEMBLES regional climate models. Int J Climatol. 32(13):1951–1970.
- Helama S, Lindholm M. 2003. Droughts and rainfall in south-eastern Finland since AD 874, inferred from Scots pine ring-widths. Boreal Environ Res. 8(2):171–183.
- Helama S, Meriläinen J, Tuomenvirta H. 2009. Multicentennial megadrought in Northern Europe coincided with a global El Niño–Southern Oscillation drought pattern during the medieval climate anomaly. Geology. 37(2):175–178.
- Holden J, Burt TP. 2002. Laboratory experiments on drought and runoff in blanket peat. Eur J Soil Sci. 53:675–690.
- Hov Ø, Cubasch U, Fischer E, Höppe P, Iversen T, Kvamstø NG, Kundzewicz ZW, Rezacova D, Rios D, Santos FD, et al. 2013. Extreme weather events in Europe: preparing for climate change adaptation. Oslo (Norway): Norwegian Meteorological Institute.
- Huang H, Han Y, Cao M, Song J, Xiao H. 2016. Spatial-temporal variation of aridity index of China during 1960–2013. Adv Meteorol. 2016:1536135.
- Hundecha Y, Bárdossy A. 2005. Trends in daily precipitation and temperature extremes across Western Germany in the second half of the 20th century. Int J Climatol. 25(9):1189–1202.
- Hurrell JW. 1995. Decadal trends in the North Atlantic Oscillation: regional temperatures and precipitation. Science. 269(5224):676–679.
- Hurrell JW, Deser C. 2010. North Atlantic climate variability: the role of the North Atlantic Oscillation. J Mar Sys. 79(3–4):231–244.
- Jeong J-H, Walther A, Nikulin G, Chen D, Jones C. 2011. Diurnal cycle of precipitation amount and frequency in Sweden: observation versus model simulation. Tellus A: Dyn Meteorol Oceanogr. 63(4):664–674.
- Johansson B, Chen D. 2003. The influence of wind and topography on precipitation distribution in Sweden: statistical analysis and modelling. Int J Climatol. 23(12):1523–1535.
- Jönsson K, Nilsson C. 2009. Scots pine (Pinus sylvestris L.) on shingle fields: a dendrochronologic reconstruction of early summer precipitation in Mideast Sweden. J Clim. 22(17):4710–4722.
- Jyrkama MI, Sykes JF. 2007. The impact of climate change on spatially varying groundwater recharge in the grand river watershed (Ontario). J Hydrol. 338(3–4):237–250.
- Kivinen S, Rasmus S, Jylhä K, Laapas M. 2017. Long-term climate trends and extreme events in Northern Fennoscandia (1914–2013). Climate. 5(1):16.
- Kløve B, Kvitsand HML, Pitkänen T, Gunnarsdottir MJ, Gaut S, Gardarsson SM, Rossi PM, Miettinen I. 2017. Overview of groundwater sources and water-supply systems, and associated microbial pollution, in Finland, Norway and Iceland. Hydrol J. 25(4):1033–1044.
- Knutti R, Sedlacek J. 2013. Robustness and uncertainties in the new CMIP5 climate model projections. Nat Clim Change. 3(4):369–373.
- Krakauer NY, Fekete BM. 2014. Are climate model simulations useful for forecasting precipitation trends? Hindcast and synthetic-data experiments. Environ Res Lett. 9(2):024009.
- Lind P, Belušić D, Christensen OB, Dobler A, Kjellström E, Landgren O, Lindstedt D, Matte D, Pedersen RA, Toivonen E et al. 2020. Benefits and added value of convection-permitting climate modeling over Fenno-Scandinavia. Clim Dyn. [cited 2020 Jul 10]: [20 p.]. doi:10.1007/s00382-020-05359-3.
- Lind P, Kjellström E. 2008. Temperature and precipitation changes in Sweden; a wide range of model-based projections for the 21st century. Norrköping (Sweden): SMHI. Report No.: 113.
- Linderholm HW, Björklund J, Seftigen K, Gunnarson BE, Fuentes M. 2015. Fennoscandia revisited: a spatially improved tree-ring reconstruction of summer temperatures for the last 900 years. Clim Dyn. 45(3–4):933–947.
- Linderholm HW, Chen D. 2005. Central Scandinavian winter precipitation variability during the past five centuries reconstructed from Pinus sylvestris tree rings. Boreas. 34(1):43–52.
- Linderholm HW, Molin T. 2005. Early nineteenth century drought in east central Sweden inferred from dendrochronological and historical archives. Clim Res. 29(1):63–72.
- Linderholm HW, Nicolle M, Francus P, Gajewski K, Helama S, Korhola A, Solomina O, Yu Z, Zhang P, D'Andrea WJ, et al. 2018. Arctic hydroclimate variability during the last 2000 years: current understanding and research challenges. Climate of the Past. 14(4):473–514.
- Linderholm HW, Niklasson M, Molin T. 2004. Summer moisture variability in east central Sweden since the mid-eighteenth century recorded in tree rings. Geogr Ann Phys Geogr. 86(3):277–287.
- Liu W, Lim WH, Sun F, Mitchell D, Wang H, Chen D, Bethke I, Shiogama H, Fischer E. 2018a. Global freshwater availability below normal conditions and population impact under 1.5°C and 2°C stabilization scenarios. Geophys Res Lett. 45(18):9803–9813.
- Liu W, Sun F, Lim WH, Zhang J, Wang H, Shiogama H, Zhang Y. 2018b. Global drought and severe drought-affected populations in 1.5°C and 2°C warmer worlds. Earth Syst Dyn. 9(1):267–283.
- Liu B, Sun J, Liu M, Zeng T, Zhu J. 2019. The aridity index governs the variation of vegetation characteristics in alpine grassland, northern Tibet Plateau. PeerJ. 7:e7272.
- Ljungqvist FC, Krusic PJ, Sundqvist HS, Zorita E, Brattström G, Frank D. 2016. Northern hemisphere hydroclimate variability over the past twelve centuries. Nature. 532(7597):94–98.
- Ljungqvist FC, Piermattei A, Seim A, Krusic PJ, Büntgen U, He M, Kirdyanov AV, Luterbacher J, Schneider L, Seftigen K, et al. 2020. Ranking of tree-ring based hydroclimate reconstructions of the past millennium. Quat Sci Rev. 230:106074.
- Ljungqvist FC, Seim A, Krusic PJ, González-Rouco JF, Werner JP, Cook ER, Zorita E, Luterbacher J, Xoplaki E, Destouni G, et al. 2019. European warm-season temperature and hydroclimate since 850 CE. Environ Res Lett. 14(8):084015.
- Luterbacher J, Werner JP, Smerdon JE, Fernández-Donado L, González-Rouco FJ, Barriopedro D, Ljungqvist FC, Büntgen U, Zorita E, Wagner S, et al. 2016. European summer temperatures since Roman times. Environ Res Lett. 11(2):024001.
- Luterbacher J, Xoplaki E, Dietrich D, Jones PD, Davies TD, Portis D, Gonzalez-Rouco JF, Von Storch H, Gyalistras D, Casty C, et al. 2001. Extending North Atlantic oscillation reconstructions back to 1500. Atmos Sci Lett. 2(1–4):114–124.
- Ma Q, Zhang J, Sun C, Guo E, Zhang F, Wang M. 2017. Changes of reference evapotranspiration and its relationship to dry/wet conditions based on the aridity index in the Songnen Grassland, northeast China. Water (Basel). 9(5):316.
- Markonis Y, Hanel M, Máca P, Kyselý J, Cook ER. 2018. Persistent multi-scale fluctuations shift European hydroclimate to its millennial boundaries. Nat Commun. 9(1):1767.
- Marsh T, Cole G, Wilby R. 2007. Major droughts in England and Wales, 1800–2006. Weather. 62(4):87–93.
- Martel J, Mailhot A, Brissette F, Caya D. 2018. Role of natural climate variability in the detection of anthropogenic climate change signal for mean and extreme precipitation at local and regional scales. J Clim. 31:4241–4263.
- Martin ER. 2018. Future projections of global pluvial and drought event characteristics. Geophys Res Lett. 45(21):11913–11920.
- Maule CF, Thejll P, Christensen JH, Synne HS, Jamie H. 2013. Improved confidence in regional climate model simulations of precipitation evaluated using drought statistics from the ENSEMBLES models. Clim Dyn. 40:155–173.
- McKee TB, Doesken NJ, Kleist J. 1993. The relationship of drought frequency and duration to time scales. Proceedings of the 8th conference on applied climatology. 17–22 January 1993. Anaheim (CA): American Meteorological Society, Boston (MA); p. 179–183.
- Meehl GA, Covey C, Delworth T, Latif M, McAvaney B, Mitchell JF, Stouffer RJ, Taylor KE. 2007a. The WCRP CMIP3 multimodel dataset: a new era in climate change research. Bull Am Meteorol Soc. 88(9):1383–1394.
- Meehl GA, Stocker TF, Collins WD, Friedlingstein P, Gaye AT, Gregory JM, Kitoh A, Knutti R, et al. 2007b. Global climate projections. In: Solomon S., D. Qin, M. Manning, Z. Chen, M. Marquis, K.B. Averyt, M. Tignor, H.L. Miller, editors. Climate change 2007: the physical science basis. Contribution of working group I to the fourth assessment report of the intergovernmental panel on climate change. Cambridge (UK) and New York (NY, USA): Cambridge University Press; p. 747–845.
- Moberg A, Jones PD. 2005. Trends in indices for extremes in daily temperature and precipitation in central and Western Europe, 1901–99. Int J Climatol. 25(9):1149–1171.
- Moss RH, Edmonds JA, Hibbard KA, Manning MR, Rose SK, Van Vuuren DP, Carter TR, Emori S, Kainuma M, Kram T, et al. 2010. The next generation of scenarios for climate change research and assessment. Nature. 463(7282):747–756.
- Nakićenović N, Alcamo J, Davis G, de vries B, Fenhann J, Gaffin S, Gregory K, Grübler A, Jung TY, Kram T, et al. 2000. Special report on emissions scenarios (SRES), a special report of working group III of the intergovernmental panel on climate change. Cambridge (UK): Cambridge University Press.
- Nastos PT, Politi N, Kapsomenakis J. 2013. Spatial and temporal variability of the aridity index in Greece. Atmos Res. 119:140–152.
- Naumann G, Alfieri L, Wyser K, Mentaschi L, Betts RA, Carrao H, Spinoni J, Vogt J, Feyen L. 2018. Global changes in drought conditions under different levels of warming. Geophys Res Lett. 45(7):3285–3296.
- Nemani RR, Keeling CD, Hashimoto H, Jolly WM, Piper SC, Tucker CJ, Myneni RB, Running SW. 2003. Climate-driven increases in global terrestrial net primary production from 1982 to 1999. Science. 300(5625):1560–1563.
- Nygren M, Giese M, Kløve B, Haaf E, Rossi PM, Barthel R. 2020. Changes in seasonality of groundwater level fluctuations in a temperate-cold climate transition zone. J Hydrol X. 8:100062.
- Okkonen J, Kløve B. 2011. A sequential modelling approach to assess groundwater–surface water resources in a snow dominated region of Finland. J Hydrol. 411(1–2):91–107.
- Olsson J, Berg P, Eronn A, Simonsson L, Södling J, Wern L, Yang W. 2017. Extremregn i nuvarande och framtida klimat Analyser av observationer och framtidsscenarier. Norrköping (Sweden): SMHI. Report No.: Klimatologi 47.
- Olsson J, Foster K. 2013. Extrem korttidsnederbörd i klimatprojektioner för Sverige. Norrköping (Sweden): SMHI. Report No.: Klimatologi 6.
- O’Neill BC, Kriegler E, Ebi KL, Kemp-Benedict E, Riahi K, Rothman DS, Van Ruijven BJ, Van Vuuren DP, Birkmann J, Kok K, et al. 2017. The roads ahead: narratives for shared socioeconomic pathways describing world futures in the 21st century. Glob Environ Change. 42:169–180.
- Orlowsky B, Seneviratne SI. 2013. Elusive drought: uncertainty in observed trends and short-andlong-term CMIP5 projections. Hydrol Earth Syst Sci. 17(5):1765–1781.
- Palmer WC. 1965. Meteorological drought. Washington (DC, USA): U. S. Department of Commerce, Weather Bureau.
- Paredes D, Trigo RM, Garcia-Herrera R, Trigo IF. 2006. Understanding precipitation changes in Iberia in early spring: weather typing and storm-tracking approaches. J Hydrometeor. 7(1):101–113.
- Park C-E, Jeong S-J, Joshi M, Osborn TJ, Ho C-H, Piao S, Chen D, Liu J, Yang H, Park H, et al. 2018. Keeping global warming within 1.5°C constrains emergence of aridification. Nat Clim Change. 8(1):70–74.
- Pasho E, Camarero JJ, de Luis M, Vicente-Serrano SM. 2011. Impacts of drought at different time scales on forest growth across a wide climatic gradient in north-eastern Spain. Agric For Meteorol. 151(12):1800–1811.
- Pauling A, Luterbacher J, Casty C, Wanner H. 2006. Five hundred years of gridded high-resolution precipitation reconstructions over Europe and the connection to large-scale circulation. Clim Dyn. 26(4):387–405.
- Pour SH, Wahab AKA, Shahid S. 2020. Spatiotemporal changes in aridity and the shift of drylands in Iran. Atmos Res. 233:104704.
- Prăvălie R, Bandoc G, Patriche C, Sternberg T. 2019. Recent changes in global drylands: evidences from two major aridity databases. Catena. 178:209–231.
- Räisänen J, Hansson U, Ullerstig A, Döscher R, Graham LP, Jones C, Meier M, Samuelsson P, Willén U. 2003. GCM driven simulations of recent and future climate with the Rossby Centre coupled atmosphere-Baltic Sea regional climate model RCAO. Norrköping (Sweden): SMHI. Report No.: RMK 101.
- Riahi K, Van Vuuren DP, Kriegler E, Edmonds J, O’neill BC, Fujimori S, Bauer N, Calvin K, Dellink R, Fricko O, et al. 2017. The shared socioeconomic pathways and their energy, land use, and greenhouse gas emissions implications: an overview. Glob Environ Change. 42:153–168.
- Rice JL, Woodhouse CA, Lukas JJ. 2009. Science and Decision making: water management and tree-ring data in the western United States. JAWRA J Am Water Resour Assoc. 45(5):1248–1259.
- Rocha E, Gunnarson BE, Holzkämper S. 2020. Reconstructing summer precipitation with MXD data from Pinus sylvestris growing in the Stockholm Archipelago. Atmosphere (Basel). 11(8):790. doi:10.3390/atmos11080790.
- Rodell M, Famiglietti JS, Wiese DN, Reager JT, Beaudoing HK, Landerer FW, Lo M-H. 2018. Emerging trends in global freshwater availability. Nature. 557(7707):651–659.
- Rodell M, Houser PR, Jambor U, Gottschalck J, Mitchell K, Meng C-J, Arsenault K, Cosgrove B, Radakovich J, Bosilovich M, et al. 2004. The global land data assimilation system. Bull Am Meteorol Soc. 85(3):381–394.
- Saarni S, Saarinen T, Lensu A. 2015. Organic lacustrine sediment varves as indicators of past precipitation changes: a 3000-year climate record from central Finland. J Paleolimnol. 53(4):401–413.
- Saeed S, Van Lipzig N, Müller WA, Saeed F, Zanchettin D. 2014. Influence of the circumglobal wave-train on European summer precipitation. Clim Dyn. 43(1–2):503–515.
- Scheff J, Frierson DMW. 2015. Terrestrial aridity and its response to greenhouse warming across CMIP5 climate models. J Clim. 28(14):5583–5600.
- Schmidli J, Frei C. 2005. Trends of heavy precipitation and wet and dry spells in Switzerland during the 20th century. Int J Climatol. 25(6):753–771.
- Schneider U, Becker A, Finger P, Meyer-Christoffer A, Ziese M. 2018. GPCC full data monthly product version 2018 at 1.0°: monthly land-surface precipitation from rain-gauges built on GTS-based and historical data. Global Precipitation Climatology Centre. https://opendata.dwd.de/climate_environment/GPCC/html/fulldata-monthly_v2018_doi_download.html.
- Seftigen K, Björklund J, Cook ER, Linderholm HW. 2015a. A tree-ring field reconstruction of Fennoscandian summer hydroclimate variability for the last millennium. Clim Dyn. 44(11–12):3141–3154.
- Seftigen K, Cook ER, Linderholm HW, Fuentes M, Björklund J. 2015b. The potential of deriving tree-ring-based field reconstructions of droughts and pluvials over Fennoscandia. J Clim. 28(9):3453–3471.
- Seftigen K, Fuentes M, Ljungqvist FC, Björklund J. 2020. Using Blue Intensity from drought-sensitive Pinus sylvestris in Fennoscandia to improve reconstruction of past hydroclimate variability. Clim Dyn. [cited 2020 May 13]: [16 p.]. doi:10.1007/s00382-00020-05287-00382.
- Seftigen K, Goosse H, Klein F, Chen D. 2017. Hydroclimate variability in Scandinavia over the last millennium-insights from a climate model-proxy data comparison. Climate of the Past. 13:1831–1850.
- Seftigen K, Linderholm HW, Drobyshev I, Niklasson M. 2013. Reconstructed drought variability in southeastern Sweden since the 1650s. Int J Climatol. 33(11):2449–2458.
- Sheffield J, Wood EF, Roderick ML. 2012. Little change in global drought over the past 60 years. Nature. 491(7424):435–438.
- Shiklomanov LA. 1993. World freshwater resources. In: Gleick PH, editor. Water in crisis: a guide to world’s freshwater resources. New York (NY, USA): Oxford University Press; p. 13–24.
- Shukla S, Wood AW. 2008. Use of a standardized runoff index for characterizing hydrologic drought. Geophys Res Lett. 35(2):L02405.
- Sjökvist E, Mårtensson JA, Dahné J, Köplin N, Björck E, Nylén L, Berglöv G, Brunell JT, Nordborg D, Hallberg K, et al. 2015. Klimatscenarier för Sverige: Bearbetning av RCP-scenarier för meteorologiska och hydrologiska effektstudier. Norrköping (Sweden): SMHI. Report No.: Klimatologi 15.
- Spinoni J, Barbosa P, Bucchignani E, Cassano J, Cavazos T, Christensen JH, Christensen OB, Coppola E, Evans J, Geyer B, et al. 2020. Future global meteorological drought hotspots: a study based on CORDEX data. J Clim. 33:3635–3661. doi:10.1175/JCLI-D-19-0084.1.
- Spinoni J, Naumann G, Carrao H, Barbosa P, Vogt J. 2014. World drought frequency, duration, and severity for 1951–2010. Int J Climatol. 34(8):2792–2804.
- Spinoni J, Naumann G, Vogt J. 2015b. Spatial patterns of European droughts under a moderate emission scenario. Adv Sci Res. 12:179–186.
- Spinoni J, Naumann G, Vogt JV. 2017. Pan-European seasonal trends and recent changes of drought frequency and severity. Glob Planet Change. 148:113–130.
- Spinoni J, Naumann G, Vogt J, Barbosa P. 2015a. European drought climatologies and trends based on a multi-indicator approach. Glob Planet Change. 127:50–57.
- Spinoni J, Vogt JV, Naumann G, Barbosa P, Dosio A. 2018. Will drought events become more frequent and severe in Europe? Int J Climatol. 38(4):1718–1736.
- Stagge JH, Kingston DG, Tallaksen LM, Hannah DM. 2017. Observed drought indices show increasing divergence across Europe. Sci Rep. 7(1):14045.
- Stagge JH, Kohn I, Tallaksen LM, Stahl K. 2015. Modeling drought impact occurrence based on meteorological drought indices in Europe. J Hydrol. 530:37–50.
- Stahl K, Kohn I, Blauhut V, Urquijo J, De Stefano L, Acácio V, Dias S, Stagge JH, Tallaksen LM, Kampragou E, et al. 2016. Impacts of European drought events: insights from an international database of text-based reports. Nat Hazards Earth Syst Sci. 16(3):801–819.
- Stine S. 1994. Extreme and persistent drought in California and Patagonia during mediaeval time. Nature. 369(6481):546–549.
- Strandberg G, Bärring L, Hansson U, Jansson C, Jones C, Kjellström E, Kolax M, Kupiainen M, Nikulin G, Samuelsson P, et al. 2015. CORDEX scenarios for Europe from the Rossby Centre regional climate model RCA4. Norrköping (Sweden): SMHI. Report No.: RMK 116.
- Taylor RG, Scanlon B, Döll P, Rodell M, van Beek R, Wada Y, Longuevergne L, Leblanc M, Famiglietti JS, Edmunds M, et al. 2013. Ground water and climate change. Nat Clim Change. 3(4):322–329.
- Taylor KE, Stouffer RJ, Meehl GA. 2012. An overview of CMIP5 and the experiment design. Bull Am Meteorol Soc. 93(4):485–498.
- Thornthwaite CW. 1948. An approach toward a rational classification of climate. Geogr Rev. 38(1):55–94.
- Touma D, Ashfaq M, Nayak MA, Kao S-C, Diffenbaugh NS. 2015. A multi-model and multi-index evaluation of drought characteristics in the 21st century. J Hydrol. 526:196–207.
- Trenberth KE, Dai A, Van Der Schrier G, Jones PD, Barichivich J, Briffa KR, Sheffield J. 2014. Global warming and changes in drought. Nat Clim Change. 4(1):17–22.
- Trigo RM, Valente MA, Trigo IF, Miranda PMA, Ramos AM, Paredes D, García-Herrera R. 2008. The impact of North Atlantic wind and cyclone trends on European precipitation and significant wave height in the Atlantic. Ann NY Acad Sci. 1146(1):212–234.
- Ukkola AM, De Kauwe MG, Roderick ML, Abramowitz G, Pitman AJ. 2020. Robust future changes in meteorological drought in CMIP6 projections despite uncertainty in precipitation. Geophys Res Lett. 46:e2020GL087820.
- UNEP, WRI, IUCN. 1992. Global biodiversity strategy. Washington (DC, USA): World Resources Institute.
- Unesco. 1979. Map of the world distribution of arid regions: explanatory note. Paris (France): Unesco.
- Uvo CB. 2003. Analysis and regionalization of Northern European winter precipitation based on its relationship with the North Atlantic Oscillation. Int J Climatol. 23(10):1185–1194.
- Verschuren D, Laird KR, Cumming BF. 2000. Rainfall and drought in equatorial east Africa during the past 1100 years. Nature. 403(6768):410–414.
- Vicente-Serrano SM, Beguería S, López-Moreno JI. 2010. A multiscalar drought index sensitive to global warming: the standardized precipitation evapotranspiration index. J Clim. 23(7):1696–1718.
- Vicente-Serrano SM, Beguería S, Lorenzo-Lacruz J, Camarero JJ, López-Moreno JI, Azorin-Molina C, Revuelto J, Morán-Tejeda E, Sanchez-Lorenzo A. 2012a. Performance of drought indices for ecological, agricultural, and hydrological applications. Earth Interactions. 16:10.
- Vicente-Serrano SM, Gouveia C, Camarero JJ, Beguería S, Trigo R, López-Moreno JI, Azorín-Molina C, Pasho E, Lorenzo-Lacruz J, Revuelto J, et al. 2013. Response of vegetation to drought time-scales across global land biomes. Proc Natl Acad Sci USA. 110(1):52–57.
- Vicente-Serrano SM, Zouber A, Lasanta T, Pueyo Y. 2012b. Dryness is accelerating degradation of vulnerable shrublands in semiarid Mediterranean environments. Ecol Monogr. 82(4):407–428.
- Wang C, Wang X, Liu D, Wu H, Lü X, Fang Y, Cheng W, Luo W, Jiang P, Shi J, et al. 2014. Aridity threshold in controlling ecosystem nitrogen cycling in arid and semi-arid grasslands. Nat Commun. 5:4799.
- Wang J, Yang B, Ljungqvist FC, Luterbacher J, Osborn TJ, Briffa KR, Zorita E. 2017. Internal and external forcing of multidecadal Atlantic climate variability over the past 1200 years. Nat Geosci. 10:512–517.
- Wells N, Goddard S, Hayes MJ. 2004. A self-calibrating Palmer drought severity index. J Clim. 17(12):2335–2351.
- Woodhouse CA, Lukas JJ. 2006. Drought, tree rings and water resource management in Colorado. Canadian Water Resour J. 31(4):297–310.
- Woodhouse CA, Lukas JJ, Morino K, Meko DM, Hirschboeck KK, et al. 2016. Using the past to plan for the future? The value of paleoclimate reconstructions for water resource planning. In: Miller KA, Hamlet AF, Kenney DS, editor. Water policy and planning in a variable and changing climate. Boca Raton (USA): CRC Press of Taylor & Francis Group; p. 161–184.
- Wyser K, Kjellström E, Koenigk T, Martins H, Döscher R. 2020. Warmer climate projections in EC-Earth3-Veg: the role of changes in the greenhouse gas concentrations from CMIP5 to CMIP6. Environ Res Lett. 15:054020.
- Xu L, Chen N, Zhang X. 2019. Global drought trends under 1.5°C and 2°C warming. Int J Climatol. 39(4):2375–2385.
- Xu C-Y, Singh VP, Chen YD, Chen D. 2008. Chapter 6: evaporation and evapotranspiration. In: Singh VP, editor. Hydrology and hydraulics. Colorado (USA): Water Resources Publications, L.L.C.; p. 229–276.
- Zarch MAA, Sivakumar B, Sharma A. 2015. Assessment of global aridity change. J Hydrol. 520:300–313.
- Zhao T, Dai A. 2017. Uncertainties in historical changes and future projections of drought. part II: model-simulated historical and future drought changes. Clim Change. 144(3):535–548.
- Zolina O. 2012. Changes in intense precipitation in Europe. In: Kundzewicz ZW, editor. Changes in flood risk in Europe. London (UK): CRC Press of Taylor & Francis Group; p. 97–119.