
 ?Mathematical formulae have been encoded as MathML and are displayed in this HTML version using MathJax in order to improve their display. Uncheck the box to turn MathJax off. This feature requires Javascript. Click on a formula to zoom.
ABSTRACT
Treelines driven by climatic conditions are characteristic of alpine areas. This study assesses the degree of accuracy with which the TREELIM model predicts present treeline elevation along a regional continentality-maritimity gradient in southwest Norway. The study area consists of 15 sites chosen along this gradient, wherein observed treelines range from nearly sea level to over 1200 m a.s.l. The TREELIM model calculates treeline position based solely on meteorological parameters obtained from gridded climate datasets. The model assumes that tree growth occurs if the length of the growing season (LGS) exceeds a minimum duration and the seasonal mean temperature (SMT) does not fall below a certain value. Six different scenarios were developed in order to determine the effects of changing precipitation and drought within TREELIM. Within these scenarios, three different SMTs were used in order to model the treeline position. Model performance was evaluated by comparing resultant treeline elevation with observed values. Results of experiments using lapse rate-based temperature input data were compared to those using the gridded climate data. Statistical analysis determined that the lapse rate-based temperature scenario removing drought constraints and using a SMT of 6.4°C gave the most accurate prediction of treeline position, and a relatively uniform growing season ranging from 110 to 128 days. Precipitation and snow cover do not significantly affect treeline elevation. The results suggest that TREELIM accurately predicts the treeline in most cases, but is less suited in areas with steeply varying topography.
1. Introduction
Treelines constitute important biological and ecological boundaries, marked by changes in site conditions and communities of plants and organisms. The alpine treeline ecotone in particular represents the transition zone whereby the closed boreal forest belt gives way to the treeless alpine tundra at higher elevations (Holtmeier Citation2003). Although height thresholds vary within the literature, this study uses the definition used within Norgeskart (Kartverket Citation2016), whereby a tree must have a height of at least 5 m. In addition, in this paper the term ‘treeline’ is used exclusively when referring to the climatic treeline, meaning that the limits of growth are driven by climatic conditions (Tuhkanen Citation1993; Körner Citation2012a). In reality, upper tree limits are often limited by biotic interaction, edaphic, topographic, anthropogenic or other factors. As such, the term ‘upper tree limit’ is used in this study to refer to areas where tree growth may be constrained by factors other than climate, including when referring to observational data. This study evaluates a model’s ability to reproduce treeline altitudes along a representative continentality gradient.
Numerous studies have attempted to find causal relationships for the altitudinal limit of the upper tree limit on both local and global scales (Odland Citation1996; Holtmeier Citation2003; Paulsen and Körner Citation2014; Schwörer et al. Citation2017; Wang et al. Citation2017b). Factors include climate (air temperature, precipitation, cloud cover, wind, and snow), topography (slope, aspect), edaphic factors, geomorphological factors, mountain height, latitude and degree of continentality (Jobbagy and Jackson Citation2000; Holtmeier Citation2003; Odland Citation2010; Fang et al. Citation2011; Öberg and Kullman Citation2012; Macias-Fauria and Johnson Citation2013; Loranger et al. Citation2016; Holtmeier and Broll Citation2017; Wang et al. Citation2017a; Bader et al. Citation2021; Kullman Citation2021). Anthropogenic influences such as agricultural land use and livestock grazing are equally, if not more, important on a local scale (Dalen and Hofgaard Citation2005; Wielgolaski et al. Citation2017).
From a global perspective, Körner and Paulsen (Citation2004) suggested that treeline position may be best modelled by three meteorological parameters: a minimum air temperature for physiological tree activity (which constrains the growing season, generally defined as the time of year when conditions are favourable for plant growth), a minimum duration of the growing season, and a minimum mean temperature for all days of that growing season. A seasonal mean temperature (SMT) of 6.4°C and a growing season length (LGS) of 94 days were found to yield the best approximation of treeline elevation globally. Furthermore, Körner (Citation2012a) suggested that common environmental limits to undisturbed alpine tree growth exist worldwide. This forms the basis for the TREELIM model and suggests that the elevation of the climatic treeline on a global scale may be predicted based on meteorological data only (Paulsen and Körner Citation2014). Although topographic and edaphic factors can prevent trees from migrating upwards in response to increasing temperatures, treeline dynamics are generally expected to undergo substantial alterations in response to ongoing climate warming (Macias-Fauria and Johnson Citation2013; Alatalo and Ferrarini Citation2017; Holtmeier and Broll Citation2017; Schwörer et al. Citation2017; Hansson et al. Citation2021). Global temperature-treeline relationships are well established, and the global pattern of climate-driven treelines has been modelled with a high degree of confidence (Paulsen and Körner Citation2014; Irl et al. Citation2016; Karger et al. Citation2019; Körner Citation2021).
The TREELIM model considers generalized tree growth based on local climate conditions, without species specification. However, it should be noted thatin Norway, the altitudinal boundary of the boreal zone is currently dominated by the northern mountain birch species Betula pubescens. This species forms a distinct belt above the montane coniferous forests in Fennoscandia extending on average for 100–150 vertical meters in width (Kullman Citation1998). The upper species limit of Norway spruce (Picea abies) and Scots pine (Pinus sylvestris) are in most areas located about 50 and 100 m, respectively, below that of birch (Kullman Citation2010).
Treeline elevations vary greatly within Norway due to a number of climatic factors. First, mountains in continental regions typically experience more sunshine hours, less precipitation, and a larger range of temperatures than maritime mountains (Beniston Citation2005). Average seasonal temperatures are generally lower at treelines on oceanic versus sites that are more continental. In addition, mountains are in general much higher in continental than in coastal areas. As such, treelines in continental regions are often located at higher elevations than at maritime zones, with the forest limit gradually rising from the coast to the interior of the country (Tuhkanen Citation1993; Odland Citation1996; Beniston Citation2005). In other words, the maritime climate with mild winters combined with cool summers works together in reducing treeline elevation (Körner Citation2012b).
The highest limits are found in and around Jotunheimen, south Norway, where the limit reaches 1320 m a.s.l. (Aas and Faarlund Citation2001). From this point, climatic treelines descend in all directions to coincide with precipitation and temperature gradients in the area, most strikingly from the interior to the coast, where it reaches sea level in some places (Bryn and Pothoff Citation2018). The upper tree limits of birch in Fennoscandia are highest in central south-eastern Norway, where the terrain provides sheltered places at high levels (Aas and Faarlund Citation2001).
In the northern hemisphere, the upper tree limit is generally higher on south-facing slopes than north-facing slopes, and this difference is especially pronounced between southeast- and northeast-facing slopes (Odland Citation1996; Schickhoff Citation2005; Richardson and Friedland Citation2009). In addition, trees generally grow to higher elevations on steeper slopes, until the slope reaches a degree that prevents growth (Odland Citation1996; Richardson and Friedland Citation2009). Upper tree limits in Norway have been found to be on average 35 m but up to 50–80 m higher on south-facing slopes in comparison to other aspects (Odland Citation1996; Bryn et al. Citation2013).
The main objective of this study is to evaluate the extent to which the TREELIM model provides an accurate climate-based prediction of the present treeline elevation along a continentality-maritimity gradient in southwest Norway. We compare the modelled with observed treeline in order to evaluate model performance and determine the effects of changing precipitation and drought within TREELIM.
2. Study area
The study area consists of fifteen sites distributed along a longitudinal transect, extending approximately 234 km inland from the western coast of Norway, 4.656°E to 8.992°E ( and ). Previous research shows a clear gradient in climate, topography and humidity in this region, which makes it suitable for an investigation of model performance in gradually varying environmental conditions (Odland Citation1996; Beniston Citation2005). Dvořák (Citation2013) and Odland (Citation2021) have compared data regarding the upper tree limit extracted from Norgeskart with observational data at over 300 locations, and found a high degree of correlation between the two datasets (34 m ± 20). The sites in this study were selected based on sites where upper tree limits have been previously observed, and either confirmed or updated using a visual inspection of Norgeskart (www.norgeskart.no). All sites were chosen with either south, southeast, or southwest facing aspects for standardization and to avoid any bias, and represent the local maximum tree limit.
Figure 1. Study area. Refer to for site names.
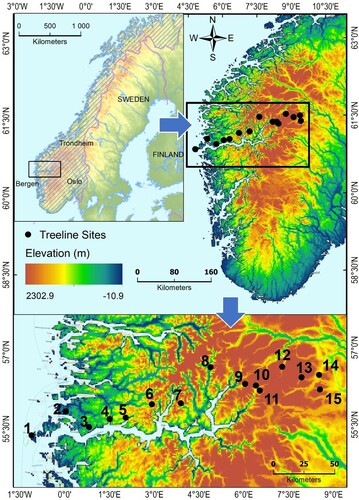
Table 1. Characteristics of the selected sites.
The topographical elevation increases linearly from west to east, with chosen site elevations ranging from nearly sea level to 1205 m a.s.l. Mountain heights increase strongly from west to east where the highest peaks reach more than 2000 m a.s.l. The regional climate displays strongly maritime conditions in the west, and continental conditions in the east. At Kupegjelet, around 121 km from the coast, the climate shifts from predominantly oceanic to increasingly continental, according to Moen’s (Citation1999) map of climatic sections in Norway. Treeline elevation generally increases with distance from the coast.
Precipitation is another indicator of the climate character along the transect. Towards the coast, annual precipitation is upwards of 2200 mm, whereas in the mountains, annual precipitation falls to between around 600 and 800 mm. In western Norway, precipitation increases sharply up to 40–50 km from the coast, where it peaks before gradually decreasing with further distance from the coast. Precipitation also increases with elevation, but can be extremely variable with topography (Førland Citation1979; Loranger et al. Citation2016; Hanssen-Bauer et al. Citation2017). Yearly average snow depth ranges from below 25 cm at the coast to above 400 cm in the mountains. Closer to the coast, the number of days with snow cover is lower, and seasonal snowmelt is earlier (Hanssen-Bauer et al. Citation2017).
In order to isolate the environmental factors responsible for the treeline position, sites were chosen that were free from human influence or land use, such as logging. However, herbivores graze on most forest areas in southern Norway.
3. Data and methods
Paulsen and Körner (Citation2014) constructed a statistical model (TREELIM), using meteorological parameters calculated from climate data to model the global treeline position for the present climate. Their TREELIM model successfully simulated the treeline positions at a global scale. TREELIM models treeline elevation using only meteorological parameters (mean, minimum and maximum temperature, precipitation and cloudiness). The Norwegian Meteorological Institute created gridded climate datasets containing these parameters for the present ‘normal’ climatic period 1971–2000, which were used as inputs for the TREELIM model (Lussana et al. Citation2018a, Citation2018b). The dataset containing temperature (minimum, maximum, and mean) and precipitation were gridded at 1 × 1 km resolution and contained daily data for the time period 1971–2017. The data was converted from daily to monthly values, and data outside the normal climatic time period 1971–2000 and data outside the study area was removed. The files containing cloud cover data were gridded at 11 × 11 km resolution and contained monthly data for the time period 1971–2000 (Reistad et al. Citation2011). Cloud cover data was interpolated to 1 × 1 km resolution using ArcMap 10.7.
All datasets from the Norwegian Meteorological Institute were created using Bayesian spatial interpolation methods. The temperature datasets are based on a two-step scale separation approach where Optimal Interpolation (OI) is used for the statistical interpolation. The precipitation dataset is based on a multi-scale OI over a cascade of spatial scales (decreasing sequence of length scales). Further information including the potential consequences for uncertainties in this dataset may be found in the references for the datasets cited above.
Data from Norgeskart used for evaluation consists of two different scale-dependent datasets. At a scale of 1:12 000 and smaller, N50 Kartdata (N50) is used. At a larger scale, a more detailed dataset, FKB AR5 Markslag (AR5), is used (Kartverket Citation2016, Citation2017). The location of the upper tree limit is similar in the two datasets; however, AR5 generally indicates a tree limit that is lower than that depicted on N50 (). A difference in elevation of 10 percent or less was considered marginal, and no differentiation was made. Both datasets are produced by using photogrammetry with aerial photographs. Forest areas larger than 4 000 m2 and wider than 30 m are included; several small forest areas may also be merged into larger areas. Forests are defined as an area with at least 6 trees per acre that are at least 5 m high; these should be evenly distributed in a given area (Kartverket Citation2016). Both datasets were used for comparison with model results.
A digital elevation model (DEM) at a 25 m resolution was obtained from the Copernicus Land Monitoring Service – EU-DEM and resampled to 1 km. The DEM has a vertical accuracy of ±7 m RMSE (EU-DEM Statistical Validation Report). Distance to the west coast of Norway was obtained using ArcGIS 10.7.1 software. Scripting was carried out using Python 2.7 and ArcMap 10.7.
3.1. TREELIM model
The TREELIM model looks for the best matching grid point in the DEM for the study area and calculates season length, season mean temperature and other values for the growing season of the site based on the site georeference (latitude, longitude, and elevation) and the minimum temperature for a day required to belong to the growing season. The length of the growing season represents the sum of days with a daily mean air temperature above a defined threshold temperature (0.9°C), sufficient soil moisture and no snow cover. In order to determine the number of days meeting the criteria for the growing season, soil water content, snowmelt and accumulation, and temperature must be modelled on a daily basis for each day of the year by converting monthly mean temperatures into daily temperatures using cubic spline interpolation. Default values for the ecological inputs are listed in . It is assumed that all precipitation falling at daily mean temperatures less than or equal to 0°C falls as snow, and snow is assumed to stay and accumulate on the ground as long as daily mean temperatures remained at or below 0°C. A snow-melt factor of 0.14 mm snow per hour and degree above 0°C was used. A sub-model of TREELIM accounts for precipitation, evapotranspiration, and the resulting soil water content, in order to calculate site water balance. Daily potential evapotranspiration is estimated within the model based on site elevation, daily minimum and maximum temperatures, solar radiation, and cloudiness data.
Table 2. Default values for ecological inputs in the TREELIM model.
Defining the beginning and end of the growing season by air temperature only, as has been done in previous studies, does not account for snowpack and varying soil moisture conditions (Körner and Paulsen Citation2004; Paulsen and Körner Citation2014). The TREELIM model assumes that tree growth will occur if the temperature throughout the growing season, ie. the SMT, does not fall below a certain seasonal mean temperature (SMTMIN), and the LGS must not be shorter than a minimum growing season length (LGSMIN). Therefore, the following expressions (Eq.1 and Eq.2) are true for all sites supporting tree growth (assuming absence of snow and presence of sufficient plant-available soil water):
(1)
(1)
Thresholds of 6.4°C for SMTMIN and 94 days for LGSMIN were initially used to define the model. Changing the temperature data will decrease or increase the duration of the growing season. As such, altering the temperature data by a constant value is equivalent to shifting site elevation. At the treeline, the climatic limit of tree growth, following expressions are true:
(2)
(2)
For the fifteen chosen sites known to be at the upper tree limit, ideally, the modelled elevation should match the observed. Where the modelled treeline does not match observational data, a lapse rate appropriate for moist conditions of 0.55°C per 100 m (Paulsen and Körner Citation2014) was used to adapt the temperature conditions at each site to match those where the model calculates that the treeline exists. This determines how many meters away the model-predicted treeline location is from the observed site.
3.2. Statistical methods
Correlation analysis was conducted on the 15 sites in order to quantify the strength of association between observation and model predictions. Pearson’s correlation coefficient, r, measures the strength of the linear relationship between observation and prediction on a continuous scale. The error of the model was measured using root mean square error (RMSE) together with mean absolute error (MAE). RMSE gives a relatively high weight to large errors, since the errors are squared before they are averaged. In contrast, MAE is a linear score, whereby errors are weighted equally in the average. RMSE is always larger or equal to MAE. If RMSE = MAE, then all errors are of the same magnitude; the larger the difference between RMSE and MAE, the greater the variance in the individual errors.
4. Results and discussion
4.1. Initial model output
TREELIM was first run without changes, using the original gridded climate datasets. Based on a global mean analysis, Paulsen and Körner (Citation2014) found that TREELIM yielded the best fit with a SMT of 6.4°C and a minimum LGS of 94 days. Therefore, a SMT threshold of 6.4°C was used for the principal analysis. However, Körner and Paulsen (Citation2004) also show that the SMT value differs in various global climatic zones. For instance, mean temperatures are generally lower in the subarctic and boreal zone than in tropical regions. Therefore, in this study we also tested the model against SMT thresholds of 5.4°C and 4.9°C. A SMT of 5.4°C is within the appropriate standard deviation for the study area according to Körner and Paulsen (Citation2004). Temperatures below 5°C do not permit significant tissue formation and growth (Alvarez-Uria and Körner Citation2007), and therefore the use of a SMT of 4.9°C tests the lower limit of plant growth.
The RMSE and MAE are both lowest when SMT = 6.4°C. When SMT = 6.4°C, the observed upper tree limit from Norgeskart is similar between AR5 and N50 in 10 sites, and differs by up to almost 300 m in 5 sites (). Because N50 gives a slightly higher observed upper tree limit than does AR5, TREELIM’s prediction of treeline position at Gaularfjell, Bjørnskorhalli, Helgedalssladen, Russvatnet and Stuttgonglie becomes further away from the observed. Although the r value was marginally higher using N50 over AR5 using SMT = 6.4°C, both the RMSE and MAE were also higher, illustrating the greater distance between observed and modelled points. The model performed poorly for sites such as Kupegjelet and Helgelassladen, where the model predicted the treeline 1000 m below the observed location when SMT = 6.4°C. When SMT = 5.4°C for this scenario the model improves, predicting the treeline location exactly for Horrøyna and Lavikvegen. When SMT = 4.9°C, although the r value is the highest, as seen in , the model begins to overpredict treeline elevation at these sites as well as at Bjørnskorhalli and Visdalen, as shown by the high RMSE and MAE.
Figure 2. Original model output. Orange = Norgeskart (fine scale), Yellow = Norgeskart (coarse scale), Purple = SMT 6.4°C, Blue = SMT 5.4°C, Green = SMT = 4.9°C. Circles around orange points indicate where coarse and fine scale give the same values. The red dashed line indicates the topographic gradient. Sites 11 and 15 are displayed 10 km further from the coast than their true location for visualization purposes.
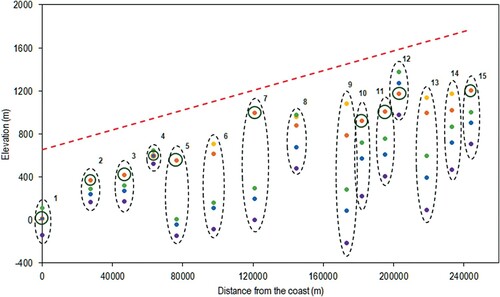
Table 3. Statistical analysis – original model.
The model gives a longer growing season at the coast (Horrøyna) than inland. Spring starts 2–3 weeks earlier whereas autumn is delayed 1–3 weeks in coastal areas compared to in the alpine zone (Høgda et al. Citation2001). The length of the growing season is relatively uniform within the other 14 sites, ranging from 110 to 128 days when SMT = 6.4°C. shows the LGS for all sites for SMT = 6.4°C, 5.4°C and 4.9°C.
Table 4. Length of the growing season (days) for the original model.
Globally, alpine treelines have been found to have a growing season ranging from 100 to 150 days (Holtmeier Citation2003; Körner and Paulsen Citation2004; Odland Citation2011). Our results are consistent with studies showing that within continental areas in Norway the birch growing season ranges between 106 and 115 days, and in oceanic areas it varies from 123 to 140 days (Bandekar et al. Citation2017). At a SMT of 5.4°C the LGS is long enough to support tree growth at most sites, but at a SMT of 4.9°C the LGS not long enough to support plant growth at any site except Horrøyna.
4.2. Sensitivity to temperature and precipitation
Six scenarios were subsequently developed in order to investigate temperature and precipitation parameters and their effects on treeline prediction, in order to improve the accuracy of the model (). Precipitation is highly dependent on specific local topography, so because the input precipitation data was gridded at a scale of 1 × 1 km, it is likely that not all local effects of topography were incorporated at this scale. Since precipitation increases with higher topography in western Norway, the local precipitation may therefore be underestimated. The adjustments to precipitation in all but the EARLY_NODROUGHT scenario are based on IPCC scenarios (RCP4.5 and RCP8.5) downscaled for Norway, not to look at any future situation, but rather to ensure that precipitation was adjusted within a range that is physically possible for the climate (Hanssen-Bauer et al. Citation2017). Similar to the original model, the threshold for LGS remained for all scenarios at 94 days and SMT was adjusted to 6.4°C, 5.4°C and 4.9°C.
Table 5. Description of scenarios.
Of all the scenarios, EARLY_NODROUGHT, which removed drought rules and made no changes to precipitation, provided the most accurate prediction of the treeline when adjusted to a SMT of 6.4°C () . However, as can be seen in , TREELIM generally still underpredicts the treeline position in relation to the observed locations. Only at Horrøyna does the model overpredict the treeline position (by 500 m). Because the observational upper tree limit according to N50 has a higher elevation, the use of AR5 gives a slightly improved model prediction. Although the r value is higher using N50, both RMSE and MAE are also higher in comparison to AR5.
Figure 3. All scenarios for SMT = 6.4°C. Orange = Norgeskart (fine scale), Yellow = Norgeskart (coarse scale), Purple = WET, Grey = XTRWET, Salmon = WET_EARLY, Pink = XTRWET_EARLY, Green = EARLY_NODROUGHT. Circles around orange points indicate where coarse and fine scale give the same values. Red dashed line indicates the topographic gradient. Sites 11 and 15 are displayed 10 km further from the coast than their true location for visualization purposes.
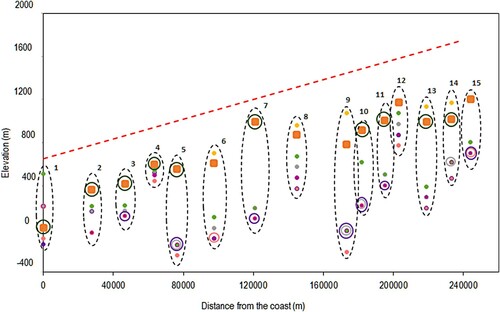
Figure 4. Results for the EARLY_NODROUGHT scenario. Green = TREELIM, Orange = Norgeskart (fine scale), Yellow = Norgeskart (coarse scale). Circles around orange points indicate where coarse and fine scales give the same values. The red dashed line indicates the topographic gradient. Sites 11 and 15 are displayed 10 km further from the coast than their true location for visualization purposes.
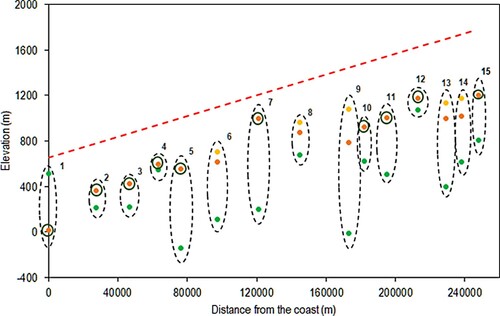
The highest difference in elevation between the modelled and observed sites was at Kupegjelet and Helgedalssladen, where the difference was 800 m. The difference at Breidalsvegen was 700 m. TREELIM predicted most accurately at Lavikvegen, where the model predicted only 50 m below the observed location. Using AR5, the r value was 0.475, RMSE was 528 and MAE was 445 (). These values are 0.112 lower, and 116 and 125 higher for the r, RMSE and MAE values for the original model using AR5, respectively. These results indicate that the original model performs better than any of the scenarios for SMT = 6.4°C. Adjusting the model using SMTs of 5.4°C and 4.9°C for this scenario gave an equivalent r value when SMT = 5.4°C but higher RMSE and MAE values, and a lower r value and higher RMSE and MAE values when SMT = 4.9°C (). Although the model performed slightly better for individual sites such as Grasdalfjellet, Russvatnet, Stuttgonglie and Sikilsdalen, the magnitude of error increased for other sites, including Lavikvegen and Horrøyna, where the model overpredicts the treeline by 850 m. Using N50 for evaluation, the r value, RMSE and MAE all increased () indicating that although the overall fit may have improved, the magnitude of the error increased.
Table 6. Statistical results for EARLY_NODROUGHT scenario (using AR5).
Table 7. Comparison of statistical results between Norgeskart datasets for the EARLY_NODROUGHT scenario using SMT = 6.4°C.
Increasing precipitation (WET, XTRWET, WET_EARLY and XTRWET_EARLY scenarios) did not significantly improve treeline prediction. Numerous studies have found that soil moisture – and therefore precipitation – conditions are sufficient for birch, pine and spruce growth in Norway (Aas and Faarlund Citation1988; Körner and Paulsen Citation2004; Bryn Citation2008). Our results are consistent with previous studies that have not found precipitation to be predictive of alpine treeline, as water is not usually scarce at high altitudes in the boreal region (Körner Citation2012b; Jochner et al. Citation2017).
4.3 Sensitivity to temperature datasets
A common issue with the correlation of temperature to treeline position is that trees experience temperature in a way that is difficult to measure by meteorological stations, which are often several hundred meters below and kilometres away from treeline sites (Paulsen and Körner Citation2014; Moore et al. Citation2017). Local treelines are influenced by other factors such as seasonal and diurnal temperature amplitudes, growing season duration, solar angles and peak radiation. Therefore, temperatures at individual treeline sites are influenced by local microclimates, which may differ from those at the nearest meteorological stations (Schwörer et al. Citation2017; Tran et al. Citation2017).
The gridded temperature dataset used as model input interpolates temperatures across Norway to a high degree of accuracy. The precision of the dataset varies between 0.8°C and 2.4°C (Lussana et al. Citation2018b). However, extremely high temperatures are represented more accurately than extremely low temperatures, such as those found in the high mountains, such as Kongsdalsnosi and Russvatnet. The complex Norwegian terrain, with its steep slopes and valleys, can provide a challenge to accurately estimating temperatures. In order to test the sensitivity of the model to potential inaccuracies in the gridded temperature dataset, lapse rate-based temperatures (minimum, maximum, and mean) were calculated for all 15 sites, based on meteorological station data from the Lærdal station (SN54110) located at 2 m a.s.l. Using the moist adiabatic lapse rate of 0.55°C per 100 m, new temperature datasets were created for all sites. These datasets can be viewed as potential temperature datasets simplified for ecological purposes, assuming that all sites are located directly above the Lærdal station. As such, the gradient is exclusively vertical, without a horizontal component. In reality, surface characteristics related to the complexity of the terrain, air masses and local winds all depend on horizontal distances and affect local temperatures (Brinckmann et al. Citation2016). The EARLY_NODROUGHT scenario was run using lapse rate temperatures in order to compare with results using the original gridded climate datasets.
The EARLY_NODROUGHT scenario using lapse rate based temperature input data and a fi of 6.4°C more accurately predicted the treeline elevation overall than did the results for this scenario using the original gridded climate data. However, as seen in , when lapse rate based temperatures are used TREELIM overpredicts treeline elevation, particularly at Breidalsvegen, where the difference in elevation is 1000 m. The model performs well at sites such as Svartedalen and Grasdalfjellet, where the treeline prediction is within 100 m of the observed location.
Figure 5. Results for the EARLY_NODROUGHT scenario using lapse rate-based temperature. Green = TREELIM, Orange = Norgeskart (fine scale), Yellow = Norgeskart (coarse scale). Circles around orange points indicate where coarse and fine scales give the same values. The red dashed line indicates the topographic gradient. Sites 11 and 15 are displayed 10 km further from the coast than their true location for visualization purposes.
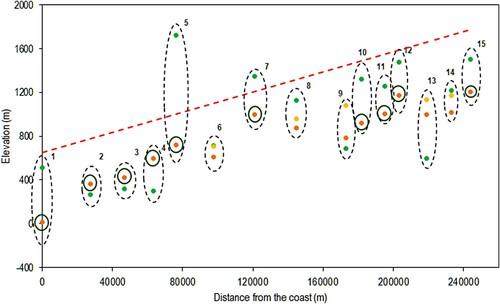
As shown in , the r value of 0.715 for this scenario is 0.24 higher than the r value for the EARLY_NODROUGHT scenario using the original gridded climate data. However, the high RMSE and MAE values for this scenario indicate the presence of one or more outliers (Horrøyna and Breidalsvegen). Adjusting to SMTs of 5.4°C and 4.9°C improves the RMSE and MAE, but worsen the r values. As shown in , using the N50 for evaluation the r value significantly worsens to 0.184. However, the RMSE and MAE decrease, indicating less overall error.
Table 8. Statistical results for the EARLY_NODROUGHT lapse scenario.
Table 9. Comparison of statistical results between Norgeskart datasets for the EARLY_NODROUGHT lapse scenario (SMT = 6.4°C).
Although previous studies have correlated the climatic treeline with various seasonal temperatures, this study supports Paulsen and Körner’s (Citation2014) findings that climatic treelines are associated with a SMT of around 6.4°C (Aas and Faarlund Citation1996; Odland Citation1996). A study of high-elevation treeline sites in southern California and central Nevada indicated that an average daily temperature of 5.5°C–7.2°C provides the best fit for the model, also correlating with Paulsen and Körner’s results and adding to the evidence that an average growing season temperature of approximately 6°C best explains the location of the alpine treeline across latitudes, climate zones, and species (Körner and Paulsen Citation2004; Paulsen and Körner Citation2014; Bruening et al. Citation2017). Our study shows that examining local treelines from a meteorological perspective, excluding any influence of non-temperature-related drivers, can result in accurate modelling of present climatic treelines.
4.4. Removal of outliers
4.4.1. Horrøyna
The treeline may not reach its potential climatic limit due to the effect of relatively low topography, the influence of the ocean, or both. Following the work of Körner (Citation2007) regarding the climatic limit of treelines, Odland (Citation2010) used regression analysis to estimate how high a mountain must be for vascular plants to reach their potential altitudinal limits. Results indicated that in general mountains in Scandinavia are 200–600 m too low for the treeline to reach its climatic limit; the highest mountains in Scandinavia (Jotunheimen) are just sufficiently high enough to allow all plants to reach their potential maximum limits. This is due to the mass elevation effect (MEE), whereby the thermodynamic effect of mountain massifs results in the central parts of large mountains becoming favoured in terms of temperature and sunshine hours (Paus and Haugland Citation2017). Since the MEE causes isotherms to shift to higher elevations in the centre of certain mountain systems, MEE has a major impact on the position of alpine treelines (Fang et al. Citation2011; Zhang and Yao Citation2016; Wang et al. Citation2017a). MEE generally decreases from continental, large and high mountain ranges to smaller and lower coastal regions (Irl et al. Citation2016).
Using the EARLY_NODROUGHT scenario and a SMT of 6.4°C, TREELIM underpredicts the treeline at Horrøyna (13 m a.s.l) by 500 m. When the SMT is set to 4.9°C, the treeline is underpredicted by 850 m. In addition, the LGS at this site is at least 150 days greater than the LGS at all other sites. Due to its low elevation and location directly on the coast, the upper species limit cannot be climatically limited at Horrøyna (Odland Citation2010). Therefore, TREELIM cannot be expected to accurately predict treeline elevation at this site, and as such Horrøyna may be considered an outlier and removed.
4.4.2. Breidalsvegen
Regional montane climates are highly dependent on the topographic and geographic features that produce them, and it has been suggested that treeline dynamics may vary markedly over only moderate spatial ranges (Daniels and Veblen Citation2004; Körner and Paulsen Citation2004; Smith et al. Citation2009; Jochner et al. Citation2018). For instance, Öberg and Kullman (Citation2012) found that climatic fluctuation does not everywhere lead to the same pattern and magnitude of birch treeline change in the Swedish Scandes. In mountainous terrain, the local topography generally controls wind speeds and directions. Increased wind reduces temperature differences between plants and ambient air, thereby reducing the temperatures that plant tissues experience on warmer days, particularly in oceanic climates (Holtmeier Citation2003).
In steep terrain, large variations in climate can occur between gridded cells at 1 × 1 km resolution. For instance, the Breidalsvegen site displayed a slope of 10.5°, whereas the grid cell to the west had a slope of 6° and the grid cell to the east a slope of 14°. This variation in slope is indicative of the varying landscape of the area, which makes it difficult for TREELIM to predict treeline position accurately. A range of slope steepness between 10° and 60° has been found to result in a difference of up to 100 m in the altitudinal position of the treeline (Odland Citation1996). Paulsen and Körner (Citation2014) recognize that TREELIM has high predictive power at large geographical scales, but struggles at the local scale, especially in regions where few meteorological stations exist.
At Breidalsvegen (723 m a.s.l.), TREELIM over-predicts the treeline by 700 m for the EARLY_NODROUGHT scenario with SMT set to 6.4°C. Using lapse rate-based temperatures, the distance between modelled treeline and the observed upper tree limit decreased for all sites but Breidalsvegen. The TREELIM model (EARLY_NODROUGHT scenario, using both original and lapse rate-based temperature input data) was rerun with data from two grid cells adjacent to the Breidalsvegen site in order to determine if this site was representative of the area. The model predicted treeline accurately (within 100 m) at both adjacent grid cells for using both original and lapse rate-based temperature input data. Therefore, Breidalsvegen was considered not representative of the area and could be removed as an outlier.
4.4.3. Effects of outlier removal
After removing both Horrøyna and Breidalsvegen from the statistical analysis for the EARLY_NODROUGHT scenario, the r value improved significantly after adjusting to SMT = 6.4°C, 5.4°C and 4.9°C (). Using the original temperature dataset and SMT = 6.4°C, the r value increased by 0.321, with marginal increases in RMSE and MAE. Using lapse-rate based temperatures, when SMT = 6.4°C, the r value improved from 0.715 to 0.920. The RMSE and MAE increased only marginally, with the RMSE increasing from 1039 to 1136 and MAE increasing from 937 to 1012.
Table 10. Comparison of statistical results before and after removing outliers (Horrøyna and Breidalsvegen) for the EARLY_NODROUGHT lapse scenario (SMT = 6.4°C) using AR5.
4.5. Effects of variable snow cover
Snow cover varies considerably locally due to variable topography, making modelling snow difficult. The default model assumption is that any snow layer greater than 0 m precludes tree growth, so the growing season cannot commence until there is a complete absence of snowpack. The snow layer is assumed to be 0 mm on the last day of the longest continuous period of air temperatures above 0°C (Paulsen and Körner Citation2014). However, green birches may begin growing in the snow when little to no permafrost exists (Wielgolaski et al. Citation2004). In practice, birch appears to be limited to sites where the maximum snow thickness is between 0.5 and 2 m (Odland and Munkejord Citation2008). Therefore, the snowpack parameter was adjusted accordingly in the TREELIM model so that growth was allowed to begin when the snowpack receded to these depths. The model was run using the EARLY_NODROUGHT scenario for two snow cover experiments, the first using a snowpack layer of 0.5 m and the second using a snowpack of 2 m. The model was run for three sites (Svartedalen, Skogadalsnosi and Sikilsdalen) for which snowpack existed for 260, 235 and 205 days of the year, respectively. Results indicated that the model was not sensitive to adjustments made to maximum snowpack depth. Output data remained unchanged for all three sites; in order to see a difference in output data the snowpack depth must be changed to an unreasonable depth (greater than 20 m).
Sufficient soil moisture is a precondition for germination (Bryn Citation2008). Snow distribution and snowpack duration determine the timing and volume of snowmelt, thereby influencing soil moisture availability during the growing season; however, this is not a straightforward and causal relationship. Soil moisture approximations provide a challenge within the TREELIM model, as available soil data is limited in mountain terrain and rooting depth is unknown. Regeneration of tree seedlings varies spatially and temporally as mediated by the duration of snowpack, which in turn interacts with spring and summer temperatures to determine when snow-free soil surface and high enough soil temperatures for a physiological activity will occur. This in turn affects the length of growing season on high precipitation sites and soil moisture supply on low precipitation sites. The TREELIM model uses water supply as a potential constraint to LGS, during which thermal conditions would allow tree growth (Paulsen and Körner Citation2014).
4.6. Modelling limitations
4.6.1. Climate data
Assumptions and uncertainties are inherent in our modelling efforts. For the TREELIM model mean daily rainfall was interpolated from 30-year data with a monthly resolution. Therefore, actual rainfall regimes are approximated (Paulsen and Körner Citation2014). However, the errors introduced by this handling of precipitation are small, especially considering the uncertainty of actual precipitation at the treeline based on climate data from meteorological stations. Grid data often underestimates precipitation, especially in regions with high wind speeds and frequent snowfall, and a major source of error is the scarcity of meteorological stations in mountain areas, weakening climate approximations (Ma et al. Citation2020). A rapid change of precipitation over short horizontal distances is often not reflected in the grid data (Paulsen and Körner Citation2014). TREELIM is highly sensitive to input data accuracy, meaning that any error in the meteorological datasets or DEM translates directly into errors within the model.
4.6.2. Norgeskart data
The border between forested areas and open tundra is often not well defined. Therefore, in the creation of datasets based on aerial photographs, including those provided by Norgeskart, there is a degree of uncertainty and interpretation in the task of drawing a discrete forest boundary. The AR5 and N50 datasets are updated continuously over time, and incorporate data from the 1960s through to the present day. In this study, climate data from the normal period 1971–2000 was used as input data. However, there is some debate within the literature regarding the degree of correlation between current treeline positions and the present climate. Some studies conclude that it is the past rather than present climates which determine current treeline positions; in Norway, present treelines may have been established prior to 1971 (Zeng and Malanson Citation2006; Holtmeier et al. Citation2008; Paulsen and Körner Citation2014). Consequently, the sites chosen on Norgeskart may not accurately reflect the current treeline location based on meteorological data from the normal period. However, studies have shown that in recent years forest densification has occurred more readily than upward treeline shift in some regions of the world (Crawford Citation1997; Fang et al. Citation2009; Camarero et al. Citation2017). In Scandinavia, the pine treeline remained positionally static although substantially densified during the past 100 years (Kullman Citation2016).
It should be noted that Paulsen and Körner (Citation2014) define the treeline as a line connecting the uppermost patches of trees of at least 3 m high (in contrast to the 5 m tree height used by Norgeskart). Were Norgeskart to define a ‘tree’ as 3 m, it is possible that the upper tree limit may appear lower in elevation than with the 5 m definition. However, the TREELIM model does not require a certain tree height, but rather indicates where tree growth in general is possible. Therefore, in this study, we assume that the location of the upper tree limit as indicated on Norgeskart maps can be used to validate the model.
4.6.3. Grazing
There is a long tradition of grazing cattle, sheep, goats, and reindeer at or above the treeline in Fennoscandia. Farming practices associated with human livestock cultivation include tree clearing for space, firewood collecting, fencing and building, and harvesting of young twigs and leaf material as additional fodder. In areas in Nordic countries where grazing by livestock has been ongoing, the upper tree limit has been lowered below its climatic potential, whereas in areas with reduced grazing in recent years tree growth near the upper tree limit has increased (Wielgolaski and Sonneson Citation2001). Therefore, agricultural practices surrounding animal grazing, coupled with climatic factors, may act as a limiting factor for birch establishment, growth, and survival in Norway (Dalen and Hofgaard Citation2005; Wielgolaski et al. Citation2017).
4.6.4. Global versus regional modelling
It has been argued that when modelling treeline dynamics, downscaling relationships between treeline position and factors found at a global scale, such as temperature or precipitation, produces simplistic scenarios that won’t go beyond general statements or contribute to a better functional understanding (Holtmeier and Broll Citation2017). These authors argue that the primary shortcoming of global modelling is a lack of physiological meaning captured by its predictive variables, and the value of site-specific, regional analysis is the ability to investigate variables other than those found only at the global scale that may more accurately explain a physiological mechanism for treeline formation. In addition, different tree species have different ecophysiological demands with respect to temperature, which cannot be captured in a global model. The three dominant tree species in southwestern Norway (mountain birch, Norway spruce, and Scots pine) each have different and specific climatic requirements for growth. Finally, it should be noted that mean temperatures do not exist in nature, and should be therefore only considered as indicators, not as causal factors (Holtmeier Citation2003).
Our study has been conducted on a regional scale, with an investigation of 15 specific sites. However, due to the dynamic nature of topography in southwestern Norway, care should be taken when generalizing or extrapolating results. Additional study sites or a dataset covering a continuous area would be useful for further research in order to provide a more complete understanding of the TREELIM model and its ability to predict treeline position in southern Norway.
5. Conclusion
Our results suggest that TREELIM accurately predicts the treeline in some cases, but in general, underestimates the treeline by up to several hundred meters when using original gridded climate data. On the other hand, use of lapse rate adjusted temperature data often resulted in overprediction of the treeline. Precipitation and depth of snowpack do not have significant effect on the prediction of the treeline position, but removing drought constraints improves treeline prediction. TREELIM is designed to model treeline position on a broad global scale, irrespective of species or local environmental or anthropogenic conditions. Our statistical results indicated a good model fit overall, especially when two outliers were removed. Consequently, we conclude that the model performs reasonably accurately for a continentality-maritimity gradient in southwestern Norway, although it is less suited in areas with steeply varying topography, and in areas where herbivory and other anthropogenic land use factors are prevalent.
Acknowledgments
We thank the following employees at the Norwegian Meteorological Institute: Jan Erik Haugen for providing cloud cover data, Cristian Lussana for his valuable assistance with temperature and precipitation data and Ketil Tunheim for his Python expertise. Thank you to Anders Bryn for his review and comments on the manuscript.
Disclosure statement
No potential conflict of interest was reported by the author(s).
Data availability statement
Temperature and precipitation data from the Norwegian Meteorological Institute is available at https://thredds.met.no/thredds/catalog/ngcd/catalog.html.
Additional information
Notes on contributors
Jasmine Byrne
Jasmine Byrne is a Ph.D. student at the University of South-Eastern Norway, Department of Nature, Health and Environment. Her main research interest is the impact of climate change on treelines in Scandinavia.
Hans Renssen
Hans Renssen is a professor at the University of South-Eastern Norway, Department of Nature, Health and Environment. His main research interest is the impact of climate change on the environment, particularly climate changes in the past 150 000 years and in relation to ongoing climate warming.
Dieu Tien Bui
Dieu Tien Bui is a professor at the University of South-Eastern Norway, Department of Business and IT. His research interests include geospatial artificial intelligence and machine earning, GIS, GNSS, applied remote sensing, natural hazards, engineering geology and structural displacements.
Arvid Odland
Arvid Odland is a professor emeritus at University of South-Eastern Norway, Department of Nature, Health and Environment. His main research interests include botany, alpine ecology, biodiversity and the effects of climate change.
References
- Aas B, Faarlund T. 1988. Postglasiale skoggrenser i sentrale sørnorske fjelltrakter. 14C- datering av subfossile furu- og bjørkerester. [Postglacial forest limits in central south Norwegian mountains. Radiocarbon datings of subfossil pine and birch specimens]. Nor Geogr Tidsskr. 42(1):25–61.
- Aas B, Faarlund T. 1996. The present and the Holocene subalpine birch belt in Norway. Paleoclimate Res. 20:19–42.
- Aas B, Faarlund T. 2001. The Holocene history of the Nordic mountain birch belt. In: Wielgolaski FE, editor. Nordic mountain birch ecosystems. New York: UNESCO Paris and The Parthenon Publishing Group.
- Alatalo JM, Ferrarini A. 2017. Braking effect of climate and topography on global change-induced upslope forest expansion. Int J Biometeorol. 61(3):541–548.
- Alvarez-Uria P, Körner C. 2007. Low temperature limits of root growth in deciduous and evergreen temperate tree species. Funct Ecol. 21(2):211–218.
- Bader MY, Llambí LD, Case BS, Buckley HL, Toivonen JM, Camarero JJ, Cairns DM, Brown CD, Wiegand T, Resler LM. 2021. A global framework for linking alpine-treeline ecotone patterns to undrelying processes. Ecography. 44:265–292.
- Bandekar G, Dvořák Z, Skeie G, Odland A. 2017. Vegetation, soil-and air temperature studies within alpine treeline ecotones of southern Norway. Oecol Mont. 26:19–33.
- Beniston M. 2005. Mountain climates and climatic change: an overview of processes focusing on the European Alps. Pure Appl Geophys. 162(8):1587–1606.
- Brinckmann S, Krähenmann S, Bissolli P. 2016. High-resolution daily gridded data sets of air temperature and wind speed for Europe. Earth Syst. Sci Data. 8:491–516.
- Bruening J, Tran T, Bunn A, Weiss S, Salzer M. 2017. Fine-scale modeling of bristlecone pine treeline position in the Great Basin, USA. Environ Res Lett. 12:014008.
- Bryn A. 2008. Recent forest limit changes in south-east Norway: effects of climate change or regrowth after abandoned utilisation? Nor Geogr Tidsskr. 62(4):251–270.
- Bryn A, Dourojeanni P, Hemsing LØ, O'Donnell S. 2013. A high-resolution GIS null model of potential forest expansion following land use changes in Norway. Scand J For Res. 28(1):81–98.
- Bryn A, Pothoff K. 2018. Elevational treeline and forest line dynamics in Norwegian mountain areas - a review. Landsc Ecol. 33(8):1225–1245.
- Camarero JJ, Linares JC, García-Cervigón AI, Batllori E, Martínez I, Gutiérrez E. 2017. Back to the future: the responses of alpine treelines to climate warming are constrained by the current ecotone structure. Ecosystems. 20(4):683–700.
- Crawford RMM. 1997. Oceanicity and the ecological disadvantages of warm winters. Bot J Scotl. 49(2):205–221.
- Dalen L, Hofgaard A. 2005. Differential regional treeline dynamics in the Scandes Mountains. Arc Antarct Alp Res. 37(3):284–296.
- Daniels L, Veblen T. 2004. Spatio-temporal influences of climate on altitudinal treeline in Northern Patagonia. Ecology. 85:1284–1296.
- Dvořák Z. 2013. Floristiske og økologiske forhold ved den alpine skoggrensen i Sør- Norge [Foristic and ecological conditions at the alpine forest border in southern Norway]. Bø i Telemark: Høgskolen i Telemark.
- EU-DEM Statistical Validation Report. [accessed 2018 Oct 5]. http://land.copernicus.eu/user- corner/technical-library.
- Fang H, Baiping Z, Yonghui Y, Yunhai Z, Yu P. 2011. Mass elevation effect and its contribution to the altitude of snowline in the Tibetan Plateau and surrounding areas. Arc Antarct Alp Res. 43(2):207–212.
- Fang K, Gou X, Chen F, Peng J, D’Arrigo R, Wright W, Li M-H. 2009. Response of regional tree-line forests to climate change: evidence from the northeastern Tibetan plateau. Trees. 23(6):1321–1329.
- Førland E. 1979. Nedbørens høydeavhengighet [The height dependence of precipitation]. Klima. 2:3–24.
- Hanssen-Bauer I, Førland E, Haddeland I, Hisdal H, Lawrence D, Mayer S, Nesje A, Nilsen JE, Sandven S, Sandø A, et al. 2017. Climate in Norway 2100 - A knowledge base for climate adaptation. Norwegian Cenre for Climate Services. 1.
- Hansson A, Dargusch P, Shulmeister J. 2021. A review of modern treeline migration, the factors controlling it and the implications for carbon storage. J Mt Sci. 18(2):291–306.
- Høgda KA, Karlsen SR, Solheim I. 2001. Climate change impact on growing season in Fennoscandia studied by a time series of NOAA AHHRR NDVI data. Scanning the present and resolving the future. IEEE Operations Center 2001. III:1338- 1340. Piscataway, NJ.
- Holtmeier FK. 2003. Mountain timberlines: ecology, patchiness, and dynamics. Vol. 14. Dordrecht: Kluwer Academic Publishers.
- Holtmeier F-K, Anschlag K, Broll G, Brauckmann H-J. 2008. Mountain birch, tree line and climate change. Ger Res. 30:25–28.
- Holtmeier FK, Broll G. 2017. Treelines—approaches at different scales. Sustainability. 9(5):808.
- Irl SDH, Anthelme F, Harter DEV, Jentsch A, Lotter E, Steinbauer MJ, Beierkuhnlein C. 2016. Patterns of island treeline elevation - a global perspective. Ecography. 39(5):427–436.
- Jobbagy EG, Jackson RB. 2000. Global controls of forest line elevation in the northern and southern hemispheres. Glob Ecol Biogeogr. 9(3):253–268.
- Jochner M, Bugmann H, Nötzli M, Bigler C. 2017. Among-tree variability and feedback effects result in different growth responses to climate change at the upper treeline in the Swiss Alps. Ecol Evol. 7(19):7937–7953.
- Jochner M, Bugmann H, Nötzli M, Bigler C. 2018. Tree growth responses to changing temperatures across space and time: a fine-scale analysis at the treeline in the Swiss Alps. Trees. 32:645–660.
- Karger DN, Kessler M, Conrad O, Weigelt P, Kreft H, König C, Zimmermann NE. 2019. Why tree lines are lower on islands—climatic and biogeographic effects hold the answer. Glob Ecol Biogeogr. 28(6):839–850.
- Kartverket. 2016. Produktspesifikasjon FKB-AR5 4.6. Oslo, Norway.
- Kartverket. 2017. Produktspesifikasjon for N50 Kartdata. Oslo, Norway.
- Körner C. 2007. Climatic treelines: conventions, global patterns, causes. Erdkunde. 61:316–324.
- Körner C. 2012a. Alpine treelines: functional ecology of the global high elevation tree limits. Basel: Springer.
- Körner C. 2012b. Treelines will be understood once the functional difference between a tree and a shrub is. Ambio. 41(S3):197–206.
- Körner C. 2021. The cold range limit of trees. Trends Ecol Evol. 2878:1–11.
- Körner C, Paulsen J. 2004. A world-wide study of high altitude treeline temperatures. J Biogeogr. 31(5):713–732.
- Kullman L. 1998. Tree-limits and montane forests in the Swedish Scandes: sensitive biomonitors of climate change and variability. Ambio. 27:312–321.
- Kullman L. 2010. One century of treeline change and stability - experiences from the Swedish scandes. Landscape. 17:1–31.
- Kullman L. 2016. Pine (Pinus sylvestris L.) penetration towards the head of the Handolan Valley: recent reversal of long-term retrogressional trend-contrasting responses to climate change of tree-and forest line. Geoinformatics & Geostat. 4:163–172.
- Kullman L. 2021. Soil temperatures at the birch treeline (Betula pubsescens ssp. czerepanovii) - a 21-year record in the Swedish scandes and a contribution to general treeline theory. Int J Sci Res. 2(2):172–182.
- Loranger H, Zotz G, Bader M. 2016. Early establishment of trees at the alpine treeline: idiosyncratic species responses to temperature-moisture interactions. AoB PLANTS. 8:plw053.
- Lussana C, Saloranta T, Skaugen T, Magnusson J, Tveito OE, Andersen J. 2018a. Senorge2 daily precipitation, an observational gridded dataset over Norway from 1957 to the present day. Earth Syst Sci Data. 10(1):235–249.
- Lussana C, Tveito OE, Uboldi F. 2018b. Three-dimensional spatial interpolation of 2 m temperature over Norway. Q J R Meteorol Soc. 144(711):344–364.
- Ma J, Li H, Wang J, Hao X, Shao D, Lei H. 2020. Reducing the statistical distribution error in gridded precipitation data for the Tibetan plateau. J Hydrometeorol. 21(11):2641–2654.
- Macias-Fauria M, Johnson EA. 2013. Warming-induced upslope advance of subalpine forest is severely limited by geomorphic processes. Proc Natl Acad Sci USA. 110(20):8117–8122.
- Moen A. 1999. National atlas of Norway: vegetation. Hønefoss: Norwegian Mapping Authority.
- Moore P, Alvarez O, McKinney S, Li W, Brooks M, Guo Q. 2017. Climate change and tree-line ecosystems in the Sierra Nevada: habitat suitability modeling to inform high-elevation forest dynamics monitoring. Natural Resource Report NPS/SIEN/NRR—2017/1476. Fort Collins, CO: National Park Service.
- Öberg L, Kullman L. 2012. Contrasting short-term performance of mountain birch (Betula pubescens ssp. czerepanovii) treeline along a latitudinal continentality- maritimity gradient in the southern Swedish scandes. Fennia. 190(1):19–40.
- Odland A. 1996. Differences in the vertical distribution pattern of Betula pubescens in Norway and its ecological significance. In: Frenzel B, editor. Holocene treeline oscillations, dendrochronology and paleoclimate. Stuttgart: Gustav Fischer; p. 43–59.
- Odland A. 2010. Importance of mountain height and latitude for the altitudinal distribution limits of vascular plants in scandinavia: are the mountains high enough? Fennia. 188(2):149–162.
- Odland A. 2011. Estimation of the growing season length in alpine areas: effects of snow and temperatures. In: Schmidt J, editor. Alpine environment: geology, ecology, and conservation. New York: Nova Science Publishers; p. 85–134.
- Odland A. 2021. Fjelløkologi: klimaeffekter på vegetasjon og flora I fortid, nåtid og fremtid. Rådal: Fenris Forlag.
- Odland A, Munkejord HK. 2008. Plants as indicators of snow layer duration in southern Norwegian mountains. Ecol Indic. 8(1):57–68.
- Paulsen J, Körner C. 2014. A climate-based model to predict potential treeline position around the globe. Alp Bot. 124(1):1–12.
- Paus A, Haugland V. 2017. Early- to mid-Holocene forest-line and climate dynamics in southern Scandes mountains inferred from contrasting megafossil and pollen data. Holocene. 27(3):361–383.
- Reistad M, Breivik O, Haakenstad H, Aarnes O, Furevik B, Bidlot J. 2011. A high- resolution hindcast of wind and waves for the North Sea, the Norwegian Sea and the Barents Sea. J Geophys Res. 116:1–18.
- Richardson AD, Friedland AJ. 2009. A review of the theories to explain Arctic and alpine treelines around the world. J Sustain For. 28(1-2):218–242.
- Schickhoff U. 2005. The upper timberline in the Himalayas, Hindu Kush and Karakorum: a review of geographical and ecological aspects. In: Broll G, Keplin B, editors. Mountain ecosystems: studies in treeline ecology. New York: Springer; p. 275–354.
- Schwörer C, Gavin DG, Walker IR, Hu FS. 2017. Holocene tree line changes in the Canadian Cordillera are controlled by climate and topography. J Biogeogr. 44(5):1148–1159.
- Smith W, Germino M, Johnson D, Reinhardt K. 2009. The altitude of alpine treeline: a bellwether of climate change effects. Bot Rev. 75:163–190.
- Tran T, Bruening J, Bunn A, Salzer M, Weiss S. 2017. Cluster analysis and topoclimate modeling to examine bristlecone pine tree-ring growth signals in the Great Basin, USA. Environ Res Lett. 12:014007.
- Tuhkanen S. 1993. Treeline in relation to climate, with special reference to oceanic areas. In: Alden JN, Mastrantonio JL, Ødum S, editors. Forest development in cold climates. Boston, MA: Springer US; p. 115–134.
- Wang J, Zhang B, He W, Yao Y, Zhang W, Zhao C. 2017a. A quantitative study on the mass elevation effect of the Rocky Mountains and its significance for treeline distribution. Phys Geogr. 38:1–17.
- Wang Y, Liang E, Sigdel SR, Liu B, Camarero JJ. 2017b. The coupling of treeline elevation and temperature is mediated by non-thermal factors on the Tibetan Plateau. Forests. 8(4):109.
- Wielgolaski FE, Hofgaard A, Holtmeier FK. 2017. Sensitivity to environmental change of the treeline ecotone and its associated biodiversity in European mountains. Clim Res. 73(1 & 2):151–166.
- Wielgolaski FE, Karlsen SR, Høgda KA. 2004. Plant phenology in Norway related to climate change and latitude. In: van Vliet AJH, editor. Proceedings of the international conference “Challenging Times”, April 2003. Wageningen, The Netherlands. p. 96–102.
- Wielgolaski FE, Sonneson M. 2001. Nordic mountain birch ecosystems – a conceptual overview. In: Wielgolaski FE, editor. Nordic mountain birch ecosystems. New York: UNESCO Paris and The Parthenon Publishing Group; p. 377–384.
- Zeng Y, Malanson G. 2006. Endogenous fractal dynamics at alpine treeline ecotones. Geogr Anal. 38:271–287.
- Zhang B, Yao Y. 2016. Implications of mass elevation effect for the altitudinal patterns of global ecology. J Geogr Sci. 26:871–877.