ABSTRACT
Climate change leads to deep modifications of high Alpine environments. Those modifications have significant consequences on mountaineering itineraries and make them technically more difficult and more dangerous. Although a growing number of studies have recently documented this issue, they only list the processes affecting the itineraries and do not document their characteristics. Therefore, the acquired data lack relevance to be spread and for prevention making among climbers. In the present study, on the basis of the processes identified in previous studies in the Mont Blanc massif, we developed a legend in order to map the processes related to climate change that affect the itineraries and modify their climbing parameters. Following the UNIL geomorphological legend and using the same color code, 21 symbols were defined to map 23 processes. In order to evaluate the applicability and interest of the legend proposed, we present a first application in the Valais Alps (Switzerland), based on 21 semi-structured interviews with local Alpine guides and hut keepers. The map then allowed to list the processes affecting each of the 36 itineraries studied. On average, an itinerary is affected by 9 different processes and 25% of the itineraries have greatly evolved, which means their ascent in summer cannot be recommended anymore because of climate change. More generally, this legend would provide a common methodological basis, destined to be completed within future studies and to be relevant beyond the European Alps. This basis would also ease the comparability and compilation of results from different future studies.
Introduction
Climate change leads to deep modifications of high Alpine environments (Beniston et al. Citation2018; IPCC Citation2019), especially because of shrinking glaciers (Shannon et al. Citation2019; Hock and Huss Citation2021; Hugonnet et al. Citation2021) and permafrost degradation (Harris et al. Citation2001; Etzelmüller et al. Citation2020; Marcer et al. Citation2021). This implies a series of processes such as the retreat of glacier fronts (GLAMOS Citation2020), the loss of ice thickness (Fischer et al. Citation2014), the erosion of moraines (Lukas et al. Citation2012), an increase in the frequency of rockfalls (Ravanel et al. Citation2017), etc. All these glaciological and geomorphological processes have significant consequences on recreational mountain activities and especially on mountaineering (Ritter et al. Citation2011; Temme Citation2015; Purdie and Kerr Citation2018; Mourey, Marcuzzi, et al. Citation2019a; Mourey, Ravanel, et al. Citation2019b), which has recently been inscribed by UNESCO on the Representative List of the Intangible Cultural Heritage of Humanity (Debarbieux Citation2020).
Ritter et al. (Citation2011) proposed a list of 22 processes related to climate change that affects mountaineering and trekking itineraries in the Austrian Alps, and showed that they have numerous impacts on the itineraries such as an increase in danger, technical difficulty and the period when they can be climbed in fairly good conditions. However, they only identified these processes but did not analyze in detail the evolution of a sample of itineraries and therefore did not identify the processes that most affect the itineraries or that are the most determinant for the practice. Temme (Citation2015) proposed a comparison of guidebooks from different periods and showed that the rockfall frequency in mountaineering itineraries has increased since 2000 in the Bernese Alps. Purdie and Kerr (Citation2018) made a detailed analysis of the modification of the classic itinerary to climb Mount Cook (3724 m a.s.l.) in the Southern Alps of New Zealand, and showed that the itinerary is mainly affected by the loss of ice thickness of the Tasman glacier in its lower part, while it becomes steeper because of the melting of the Linda hanging glacier in its upper part. It results in an increase of the technical difficulty of the itinerary and a decrease by half of the length of the favorable period to climb it.
On a similar methodological approach as Purdie and Kerr (Citation2018), Mourey, Marcuzzi, et al. (Citation2019a) studied the modification of the mountaineering itineraries described in G. Rébuffat's iconic guidebook The Mont Blanc Massif: the 100 Finest Routes (Citation1973). The authors identified 25 geomorphological and glaciological processes related to climate change affecting the itineraries in the Mont Blanc massif (MBM, European Alps) and modifying their climbing parameters (level of exposure to objective dangers, technical difficulty and the optimal period for climbing – i.e. when the number/intensity of processes affecting the itinerary is the lowest). On average, each of the 95 itineraries studied is affected by 9 different processes such as rockfall, glacier slope angle increase, ice apron retreat, appearance of smooth slabs of bedrock or serac fall. In other words, a climber attempting to climb one of these itineraries has to consider and potentially adapt his behavior to, on average, nine different processes related to climate change. As a result, 36% of the itineraries have become more dangerous and difficult and are unclimbable during certain periods of the year, particularly in summer and during/following heat waves – which are increasingly common (Della-Marta et al. Citation2007) – while 27% are no longer climbable in summer, as the processes affecting them lead to an excessive level of danger and/or technical difficulty. Finally, 3% of the itineraries have already disappeared, either due to glacial retreat or rockfalls. For example, the Bonatti pillar on the west face of the Drus (3754 m a.s.l.), disappeared in 2005 because of a 700 m high and 292 680 m3 rock avalanche (Ravanel and Deline Citation2008; Guerin et al. Citation2017). In such a context, mountaineers must consider these changes – which are increasingly constraining – and must adapt their behavior to continue the practice of mountaineering and limit their risk-taking (Pröbstl-Haider et al. Citation2016; Mourey et al. Citation2020).
While the study by Mourey, Marcuzzi, et al. (Citation2019a) is probably the most thorough that has been realized up to now, it only lists the processes affecting each itinerary and does not document their characteristics or location. Thus, the acquired data lack relevance to be spread and for prevention making among climbers who need to know the characteristics of the processes and where they are affecting the itineraries. Adding spatial information to the type of process affecting each itinerary would therefore help to reduce these limitations and to better document the changes that affect high mountain environments. Therefore, the main objective of the present study is to develop a legend to map the processes related to climate change that affect mountaineering itineraries and modify their climbing parameters. Such a legend should (i) ease data collection, (ii) make the data analysis simpler, (iii) favor the knowledge transfer to the mountaineer's community and (iv) participate in improving knowledge on processes related to climate change in high mountains. More generally, this legend would provide a common methodological basis, destined to be completed within future studies and to be relevant beyond the European Alps. It would also enable the comparability and compilation of results from different researches.
In order to evaluate the applicability and interest of the legend proposed, we thus present a first application in the Valais Alps (Switzerland), allowing to assess the modification of mountaineering itineraries for this Alpine region, following the scheme of the previous study carried out in the MBM. A comparison of the results between these two massifs is also carried out.
Study area
The Valais Alps, the 100 finest routes as the reference sample
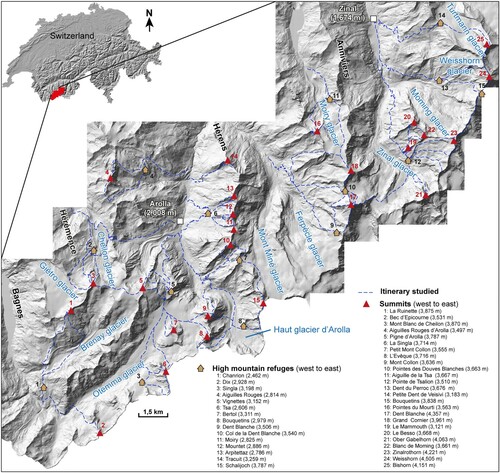
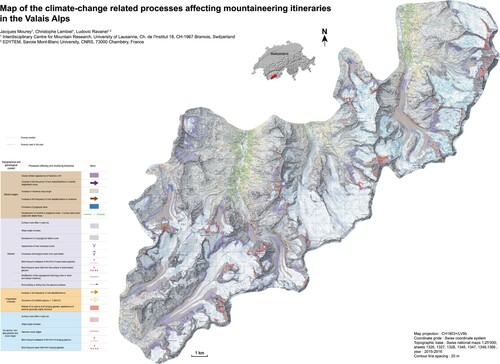
The Valais Alps are located on the orographic left side of the Rhone River (). The high-altitude study area includes many summits above 3500 m a.s.l., 5 summits above 4000 m a.s.l. and 27 glaciers. It belongs mainly to the Dent Blanche nappe (Austroalpine unit), where orthogneisses of the Arolla series (Arolla gneiss) are dominant, with the exception of the Aiguilles Rouges d’Arolla, that belong to the Tsaté nappe (Upper Penninic unit) and are composed of metagabbros. Climatically, the Valais Alps are under the influence of a semi-continental climate of intra-Alpine shelter. The mean annual air temperatures and precipitations at 2800 m a.s.l. are around −1°C and 1200 mm/yr according to MeteoSwiss data (Évolène weather station, 1825 m a.s.l.).
Figure 1. Location map of the Bagnes, Hérémence, Herens and Anniviers valleys in the Valais Alps (Switzerland). The 36 itineraries studied are represented with the summits they reach and the refuges concerned (alt. are in m a.s.l.). DTM SwissTopo.
Using the same general approach as the study conducted on the MBM by Mourey, Marcuzzi, et al. (Citation2019a), the present study focused on the itineraries presented in M. Vaucher's guidebook (Citation1979) – The Valais Alps, the 100 finest routes – whose series was directed by G. Rébuffat. It presents all kinds of itineraries (rock, snow and mixed) in an increasing order of difficulty from F-facile – easy – to ED-extrêmement difficile – extremely difficult – (see Cox and Fulsaas Citation2006). This makes this guidebook a relevant and representative sample of popular itineraries in this massif, at least at the date of publication.
The 100 itineraries presented in the guidebook dedicated to the Valais Alps are spread over a very large area (3000 km2), extending from the Grand-Saint-Bernard pass (2469 m a.s.l.) to the Simplon pass (2106 m a.s.l.). In this work, we have only studied the itineraries present in the Bagnes, Hérémence, Hérens and Anniviers valleys (). This represents a region of 750 km2 in the French-speaking part of the Valais Alps and 36 different itineraries are described (). Each itinerary was divided into four parts: (i) the access to the refuge, which starts down in the valley, (ii) the approach, which starts at the refuge and ends either at the foot of the rockwall to be climbed or at the bergschrund (crevasse between moving glacier ice and stationary ice or firn or rockwall above); (iii) the route itself and its continuation to the summit and (iv) the descent, which starts at the summit and ends in the valley.
For some cases, the guidebook proposes several different routes for the same itinerary number. If the orientation and the type (rock, snow, or mixed) of the routes presented for the same itinerary are different and if they are far away from each other, they have been analyzed as different itineraries. It is the case for itineraries 62 and 25 (see Appendix). For the itinerary 62, the guidebook proposes three routes to climb the Mont Blanc de Cheilon (3870 m a.s.l.): the north face, the Gallet ridge and the Jenkins ridge. Since the three routes have a different orientation, are of different types (one ‘snow’ and two ‘rock’) and relatively separated in space, they have been analyzed separately. We did the same for the itinerary 25, which presents three different routes to climb the Pointes de Mourti (3564 m a.s.l.): the north face, the south face and the west face. On the contrary, when the routes have the same orientation, are of the same type, and are close to each other, they have been analyzed as a single route. It is the case for the itineraries 4 (Le Mammouth, 3215 m a.s.l.), 9 (Pointe de Tsalion, 3512 m a.s.l.) and 61 (Dent de Perroc, 3676 m a.s.l.). Accordingly, a total of 36 different itineraries were studied, 7 of them are ‘snow’ routes, 24 ‘rock’ and 5 ‘mixed’.
The Alpine environments in the context of climate change
In the current context of climate change, the study area undergoes deep modifications. Since the end of the Little Ice Age (LIA), there has been a clear decrease in the number of snowfall days relative to the total precipitation days in the Alps (Serquet et al. Citation2011), together with earlier snow melting (Klein et al. Citation2016). In the Swiss Alps between 1139 and 2540 m a.s.l., snow cover duration shortened by 8.9 days/decades during the period 1970–2015, with a snow season starting 12 days later and ending 26 days earlier than in 1970 (Klein et al. Citation2016). This decrease is dependent on the altitude and therefore less significant at high altitudes.
Glacierized areas in the Swiss Alps have decreased by 28% between 1973 and 2010 (Fischer et al. Citation2014) with an acceleration of the melting since the 1990s (Huss Citation2012; Vincent et al. Citation2017). Between 1900 and 2011, glacier volume in the Alps decreased by 49% (Huss Citation2012). In the study area, the Giétro, Breney and Otemma glaciers have lost respectively 43%, 61% and 63% of their mass between 1850 and 2009 (Lambiel and Talon Citation2019) and the Haut glacier d’Arolla has lost 40 (±5) × 106 m3 of ice volume between 1999 and 2005, associated with a vertical loss of 35 m in the tongue area (Dadic et al. Citation2008). At the same time, glacier fronts retreated dramatically, as for example, the Zinal glacier for which the front retreat reached 400 m between 1990 and 2018 (Glamos Citation2020).
Another consequence of climate change on glaciers is a decrease in snow cover on glaciers, both in area and depth, in relation with a 170 m rise of the glacier equilibrium line (ELA) altitude between 1984 and 2010 in the western Alps (Rabatel et al. Citation2013) and a reduction in winter snow accumulations (Beniston et al. Citation2018). As a consequence, crevasses masked by snow in winter appear higher in altitude and earlier in spring and areas of bare ice, technically difficult to cross for a climber in steep terrain, are more extended, even above 3000 m a.s.l.
The decrease in snow cover on glacier, combined with a decrease in the frost frequency (Pohl et al. Citation2019) and a rise in altitude of the 0°C isotherm in summer (167 m increase in the MBM since 1960; Météo France and Snow Research Center data, analysis by the Research Center for Alpine Ecosystems) probably leads to an earlier weakening of snow bridges in spring or during heat waves. Moreover, the retreat of steep hanging glaciers may imply an increase in the frequency of ice avalanches, as evidenced locally by Fischer et al. (Citation2006). On annual and secular time scales, they are occurring especially during the warmest periods (Deline et al. Citation2012). Glacial shrinkage also leads to an increase in the surface and/or thickness of supraglacial debris covers for some glaciers (Gomez and Small Citation2018; Scherler et al. Citation2018).
In response to the melting of glaciers, the Alps are currently in a paraglacial period (Church and Ryder Citation1972; Ballantyne Citation2002; McColl, Citation2012). As a consequence, paraglacial processes – defined by Ballantyne (Citation2002) as ‘the non-glacial earth-surface processes, sediment accumulations, landforms, landsystems and landscapes that are directly conditioned by glaciation and deglaciation’ – are intensifying. In the Alps, the main paraglacial processes at work are rockfalls, debris slides and slumping due to the erosion of recently deglaciated moraines (McColl Citation2012; Deline et al. Citation2015; Draebing and Eichel Citation2018; Eichel et al. Citation2018; Ravanel et al. Citation2018) and rockfalls from recently deglaciated rock slopes (Hartmeyer et al. Citation2020).
At the same time, permafrost undergoes accelerated degradation (Haeberli and Gruber Citation2009; Biskaborn et al. Citation2019), which results in more frequent and voluminous rock slope movements (rockfalls, rock slides) (Harris et al. Citation2001, Citation2009; Ravanel and Deline Citation2011; Ravanel et al. Citation2017). However, one must be careful not to consider every rockfall as due to permafrost degradation, since it is a natural erosion process in high mountain environments.
Methods
Construction of the legend and mapping of the processes affecting the itineraries
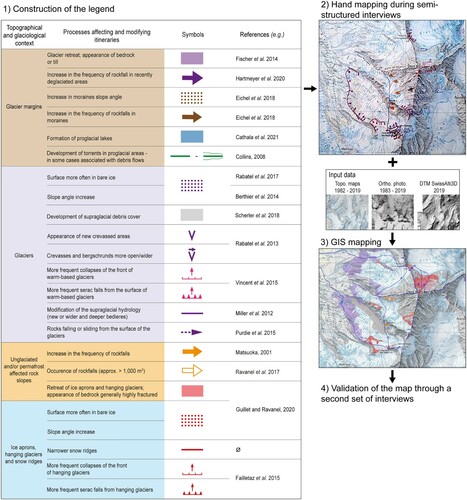
The method used to map the processes affecting the itineraries is divided in 4 steps ():
A legend was developed on the basis of the 25 processes identified in the MBM (Mourey, Marcuzzi, et al. Citation2019a). Following the UNIL geomorphological legend (Schoeneich Citation1993; Lambiel et al. Citation2016) and using the same color code, 21 symbols were defined to map 23 processes (). The processes ‘Weakening of snow bridges’ and ‘Less frequent night freezing’, identified in the MBM, have not been considered in this work as they are impossible to map at the scale of a mountaineering itinerary and the two processes ‘Glaciers surface more often in bare ice’ and ‘Glaciers slope angle increase’ are almost always associated and are therefore represented using the same symbol. The same applies for the two processes ‘Ice aprons surface more often in bare ice’ and ‘Ice aprons slope angle increase.’ The processes were classified according to the terrain in which they take place: (i) glacier margins, (ii) glaciers, (iii) unglaciated and/or permafrost affected rock slopes and (iv) ice aprons, hanging glaciers and snow ridges.
In a first set of semi-structured interviews (16 interviews lasting 1–2 hours) carried out by the same researcher, local mountain guides and refuge keepers were asked to draw on the most recent topographic map available, with the help of the legend, the long-term modifications of the itineraries (since the 1980s) they are able to identify. At the same time the interviewer took notes to complete and clarify the mapped processes.
The changes mapped during the interviews were then remapped using the Geographic Information System (GIS) QGIS. This information was completed by a diachronic analysis of aerial images from 1982 to 1983 and 2019 to 2020, together with the analysis of topographic maps and the SwissAlti3D digital elevation model (DTM) of Swisstopo (2 m resolution) (). The latest aerial images allowed to accurately digitize the difference in ice surfaces related to the shrinkage of glaciers and ice aprons, the development of debris covers on glaciers, the newly formed proglacial lakes, the development of torrents in proglacial areas and the changes in supra-glacial hydrology such as the formation/widening of bedieres and moulins. Overall, only the processes affecting the itineraries studied – or in the direct proximity with them – were mapped. The digitization was carried out at a scale between 1:1000 and 1:5000. The scale of the final map (Appendix 1) is 1:25,000, in accordance with the scale of the topographic map used. A few days of field work were also needed to confirm some observations, as for example the limits of debris-covered glacier, which are difficult to identify from aerial images.
Finally, an evaluation of the map was completed through a second set of five interviews with some other local mountain guides and refuge keepers, not interviewed during the first set. They were asked to confirm/precise or invalidate the processes mapped if necessary.
Figure 2. The four steps of the mapping work of the climate-related processes affecting mountaineering itineraries.
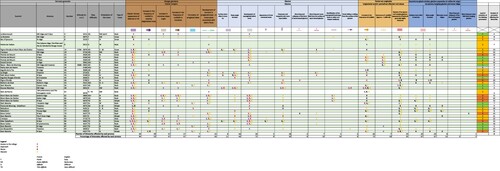
From the final map, all the processes affecting each of the itineraries could be listed and organized in a database (Appendix 2), cross-referencing each of the itineraries with the 23 geomorphological and glaciological processes. A cross analysis between the number of processes that affect each itinerary, their type, their level of modification, their orientation, etc., could then be performed.
During step 2, the identification by the interviewees of the processes affecting the itineraries was generally influenced by the conditions encountered during their last ascent and/or their clients. The interviewees identified in priority the processes that are the most relevant for their ascent, without necessarily considering the season and the climate-related evolutions. For example, an alpine guide will be more prone to notice a change such as a steeper glacier if he is with clients of a rather low technical level. It was the interviewers’ role to encourage interviewees to identify only long-term processes rather than focusing on their last ascent. For this reason, each of the itineraries was studied during at least two different interviews.
Change in the climbing parameters for each itinerary
The interviewees were asked to evaluate the level of change of the climbing parameters for each itinerary, according to the 5-level scale used in the MBM (Mourey, Marcuzzi, et al. Citation2019a):
Level 0: the itinerary is not affected by any process related to climate change. There is no change in its climbing parameters.
Level 1: the itinerary is affected by a few processes related to climate change, but they only affect a small part of the itinerary and do not imply an increase in danger or in technical difficulty.
Level 2: the itinerary is affected by processes related to climate change that imply a moderate increase in danger and/or technical difficulty; as a result, the itinerary may not be climbable all the summer long and the most favorable period to climb it shifts to spring and/or fall, sometimes winter.
Level 3: the itinerary is affected by processes related to climate change that imply a strong increase in danger and/or technical difficulty; the itinerary is thus generally no longer climbable in summer.
Level 4: the itinerary is affected by processes related to climate change that led to the disappearance of a large part of the itinerary (e.g. massive rockfall). It can no longer be climbed.
Results
Map of the climate-induced processes affecting mountaineering itineraries
The general map (Appendix 1) shows the glaciological and geomorphological processes related to climate change that affect the 36 itineraries studied and an example is given in . This map was then used to list the processes affecting each of them and to perform a statistical analysis (Appendix 2). For example, according to the local map extracted for the Cheilon glacier area (), the itinerary 62 – the ‘Gallet ridge’ on the Mont Blanc de Cheilon (3870 m a.s.l.) – is affected by 12 different types of processes.
Figure 3. Extract of the general map of the climate-related processes affecting mountaineering itineraries: the Cheilon glacier area (Hérémence valley). Twelve processes are affecting the itinerary 62, the ‘Gallet ridge’ on the Mont Blanc de Cheilon.
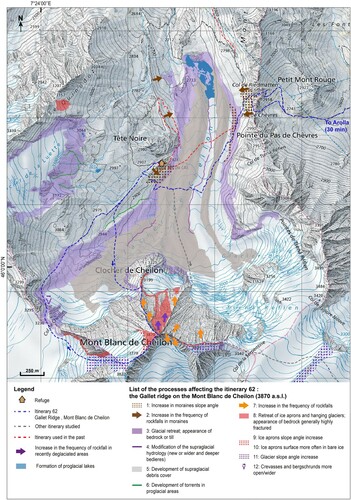
On average, an itinerary is affected by nine different processes. Eight processes are affecting more than half of the itineraries: (i) glacial retreat and the appearance of bedrock or till (34 itineraries affected out of 36 = 94%), (ii) the retreat of ice aprons and hanging glaciers and the appearance of bedrock, generally highly fractured (33/36 = 92%), (iii) the development of a supraglacial debris cover (26/36 = 72%), (iv) the increase in the frequency of rockfalls in unglaciated rock slopes (26/36 = 72%), (v) steeper ice aprons and hanging glaciers (24/36 = 67%), (vi) ice aprons more often in bare ice (24/36 = 67%), (vii) the development of torrents in proglacial areas – in some cases associated with debris flows (23/36 = 64%) and (viii) the increase in the frequency of rockfall in recently deglaciated areas (19/36 = 53%). Overall, these processes cause an increase in danger and technical difficulty for climbers.
Altitudinal distribution of the climate-induced processes affecting the itineraries
The different parts of the itineraries (refuge access, approach, route and descent) are not affected by the same processes () which are generally altitudinally distributed.
Figure 4. Number of refuge access, approach, route and descent affected by each process.
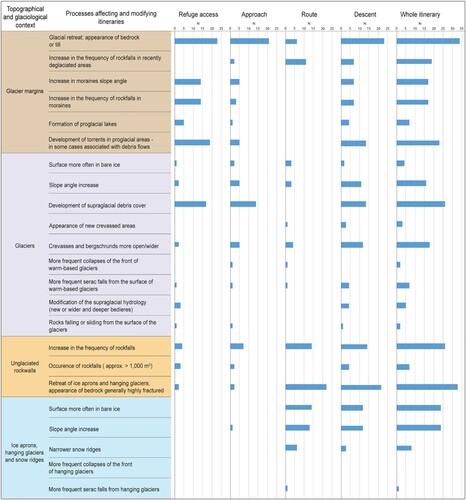
Refuge accesses are affected by 15 different processes occurring mainly in glacier margins. Glacier retreat and the appearance of bedrock or till is the process that mostly affects the refuge accesses (23 over 36–64%). This observation is consistent with the fact that the 15 refuges concerned are located at a mean altitude of 3069 m a.s.l. (min.: 2462 m a.s.l.; max.: 3787 m a.s.l.; med.: 2954 m a.s.l.), i.e. below the ELA. Their access follows and/or crosses glacier tongues, where the melting is the highest (Berthier et al. Citation2014). This finding is in agreement with other studies carried out on climate-related evolution of the accesses to high mountain refuges in the Alps (Mourey and Ravanel Citation2017; Mourey, Ravanel, et al. Citation2019b).
The approach to the route start is the part of the itinerary affected by the highest number of processes (17/23) and is also mainly affected by the glacier retreat and the appearance of bedrock or till (23/36–64%). However, as they are located a little higher in altitude than the accesses to the refuges, they are less affected by paraglacial processes and they are more affected by processes occurring in unglaciated rock slopes such as the increase in the frequency of rockfalls ().
The route itself is the part of the itinerary that is affected by the lowest number of processes (14/23) as their environment is generally monotype (rock, snow or mixed), but these processes largely define the level of change of the climbing parameters of the entire itinerary. Indeed, the route being in general the steepest and the most technically difficult part of the whole itinerary, the slightest modification of the environment quickly leads to a modification of its climbing parameters. The process that mostly affects the routes is the retreat of ice aprons and hanging glaciers and the appearance of bedrock, generally highly fractured (22/36–61%).
Level of change of the climbing parameters of the itineraries
The climbing parameters have not evolved for only 1 (3%) of the itineraries studied: the Traversée des Petites Dents de Veisivi (3184 m a.s.l.; itinerary 34), located relatively low in altitude and without glaciers. They have slightly evolved (level 1) for 12 (33%) of the itineraries, moderately evolved (level 2) for 14 (39%) and strongly evolved (level 3) for 9 (25%). None of the studied itineraries are at a level 4 of change.
Overall, snow and mixed itineraries are more affected by climate change, with an average level of change of 2.5 and 2 respectively, than rock itineraries (1.6). North-oriented routes have the highest average level of change (2.5) compared to the south-oriented routes (1.3). The samples of west- and east-oriented routes are very limited (3 routes for each; ) so they have not been considered in the later analysis.
Table 1. Comparison of the samples of itineraries studied in the Valais Alps and the MBM according to their type, orientation, technical difficulty and level of change of their climbing parameters.
Moreover, there is a link between the number of geomorphic changes affecting an itinerary and its level of change. On average, for level 1, 7.5 changes were affecting the itineraries, 9.4 for level 2 and 11.2 for level 3.
Eight of the nine itineraries with a modification level of 3 show the same pattern of change. For these 8 itineraries, the routes located on north faces are unclimbable during most of the summer period due to the melting of ice aprons. The laters re-form during winter and melt earlier in spring, leading to the appearance of generally highly fractured bedrock and related frequent rockfalls.
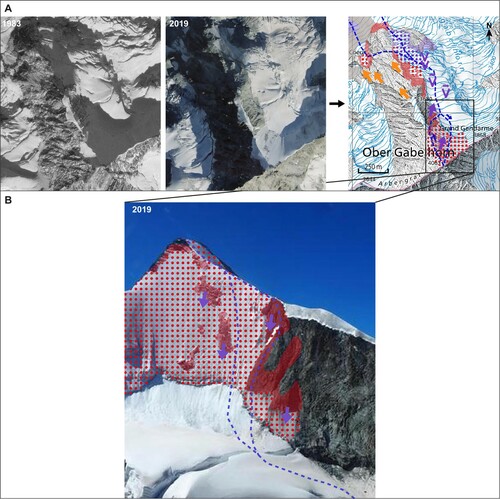
In our sample of itineraries, the following north-facing routes are presenting this pattern of change and a level of change of 3: the Pointes de Mourti (3564 m a.s.l.; itinerary 25), the Petit Mont Collon (3538 m a.s.l.; itinerary 43), the Pigne d’Arolla (3796 m a.s.l.; itinerary 46), the Mont Blanc de Cheilon (; 3869 m a.s.l.; itinerary 62), the Ober Gabelhorn (; 4063 m a.s.l.; itinerary 84) and the Dent Blanche (4357 m a.s.l.; itinerary 99).
Figure 5. Evolution of the Ober Gabelhorn (4063 m a.s.l., itinerary 84; modification level: 3). (A) Comparison of aerial images from 1983 and 2019 (Swisstopo) to build the map on GIS. (B) The North Face in 2019 with the processes affecting the itinerary mapped (PoliceValais).
Discussion
Climate-related processes versus seasonality
In this paper, we identified the processes related to climate change that affect mountaineering itineraries on a climatic time scale (the last 40 years). In general, they lead to an increase in danger and technical difficulty of the itineraries and a modification in the most favorable and stable time of the year for mountaineering that tend to be more variable in summer and shift towards spring and fall. However, those consequences can be reduced or increased by seasonal and meteorological factors. The processes related to climate change identified in this work are generally less frequent and/or intense at the beginning of the season and on the contrary, they are more frequent and/or intense at the end of the summer season and/or during/following heat waves, which are becoming increasingly frequent and intense (Della-Marta et al. Citation2007). Thus, it is possible that at certain periods of the summer, depending on the conditions, the level of change of the climbing parameters of the studied itineraries may be less or more important than in the results presented above.
It is also important to note that some sections may also become easier thanks to changing conditions, notably in favor of a flatter and/or less crevassed glaciers. However, in the Valais Alps as well as in the MBM, this observation never applies to a whole itinerary. In all cases studied, the maximum technical level and/or the danger level has remained unchanged or increased.
Comparison between the Valais Alps and the MBM
Considering the main characteristics of the itineraries (type, orientation and technical difficulty), the samples studied in the MBM (see Mourey, Marcuzzi, et al. Citation2019a) and the Valais Alps are relatively similar (). Both have a majority of rock routes and a similar percentage of snow and mixed routes. Similarly, the proportion of routes for each orientation and technical level are of the same order ().
Results for the Valais Alps and the MBM are very similar. No new processes affecting and modifying the itineraries have been identified in the Valais Alps. On the contrary, no itinerary is affected by the process ‘More frequent collapses of the front of hanging glaciers’ in this region. In both massifs, the itineraries are affected by an average of nine climate-related processes. The level of change of the climbing parameters is also very similar () with, in both massifs, a quarter of the itineraries with a level 3 of change. The main difference is that there are no itineraries with a level 4 of change in the sample studied in the Valais Alps. In both massifs, the process that mostly affects the itineraries is the glacial retreat and the appearance of bedrock or till. In contrast, the second and third processes in order of importance are not the same. In the Valais Alps, these are (i) the retreat of ice aprons and hanging glaciers and the appearance of bedrock generally highly fractured (33/36–91%), (ii) the development of supraglacial debris cover (26/36–72%) and (iii) the increase in the frequency of rock slope movements in unglaciated rock slopes (26/36–72%). In the MBM, these are: (i) more open crevasses and bergschrund (78/95–74%) and (ii) the increase in glacier slope angle (73/95–70%). These differences are probably related to the differences in the topographical, lithological and glaciological contexts between the two massifs. Indeed, compared to the Valais Alps, the MBM has a higher average altitude, a higher proportion of glaciated areas and a more humid climate. This explains that the processes that most affect the itineraries in the MBM are related to the evolution of glacial environments, whereas in the Valais Alps the processes are more diverse and also related to the evolution of unglaciated rock walls.
The differences in the identified processes may also be partly due to the two different methods used for each massif and in particular to the fact that diachronic analysis of aerial images was systematically used in the Valais Alps to draw the map.
In the MBM, three main patterns of itinerary change were identified: (i) snow routes made more difficult and dangerous, and sometimes unclimbable, by the melting of ice aprons, (ii) rock routes made inaccessible by the loss of glacier ice thickness and (iii) access to refuges made more difficult and dangerous by the melting of glacier tongues. In the Valais Alps, we find the same patterns concerning the snow routes and the access to the refuges. However, the pattern concerning the rock routes has not been identified. This difference is probably linked to the lithology. In the recently deglaciated areas of the MBM, the granite tends to form smooth rocky slabs that are particularly difficult to climb, whereas the fractured gneiss in the Valais Alps limits the formation of such unclimbable rocky slabs and instead produces ledges.
Finally, in both massifs, rock routes have the lowest average level of change (1.6 in both massifs) and conversely, snow and mixed routes have the highest level of change (2.5 in the Valais Alps and 2.4 in the MBM). This finding is not in accordance with the events that are generally reported in the press, which generally reports on events where climbers have been affected by rockfalls (examples of the Matterhorn were two climbers were killed by rockfalls on Wednesday 25th of July 2019; https://www.letemps.ch/suisse/canicule-accelere-lerosion-alpes-accentue-chutes-pierres). It is likely that the media focuses on these types of events because they are known by the general public, easy to illustrate and regularly at the origin of fatalities. However, our work shows that rockfalls, although very dangerous and spectacular, are not the process that most affect mountaineering itineraries.
Interest of the mapping
Mapping the climate-related processes affecting the mountaineering routes with the method presented here greatly facilitated the data acquisition and analysis, compared to the method used by Mourey, Marcuzzi, et al. (Citation2019a) in the MBM. Indeed, it was easier for the interviewees to draw on a map the modifications they identified than to list them during an oral discussion without any physical support. The intellectual effort of visualizing the itinerary and identifying the processes affecting it is much greater without a map, while drawing the changes also avoided repetition between interviews and/or a too important focus on only one part of the itinerary. In addition, we chose to have several interviewees drawing on the same extract of map. Therefore, from one interview to the other, the interviewees could see the data already collected. This facilitated the validation of the mapped processes from one interview to the next, but this methodological choice may also imply a bias in the sense that an interviewee may be influenced by what he saw on the map. It was therefore the researcher's role to limit this bias during the interviews by asking each interviewee to have a critical look at the processes mapped during the previous interviews. In any case, the methodological approach used in this work, based on semi-structured interviews, necessarily implies a certain amount of subjectivity, as most of the information collected comes from the memories and appreciations of the interviewees.
The map also facilitates the analysis of the data. Once the map was made, it was easy to identify the processes () that affect each itinerary and then do a statistical treatment as presented in the results. In addition, the map will make the update of the data easier compared to a table that lists the processes for each route.
The use of topographic maps at the scale 1:25,000 is convenient and easy in Switzerland where maps have a high level of accuracy and are freely available. Moreover, Swiss Alpine guides and refuge keepers are used to read this type of document. However, in other parts of the world where maps are not necessarily accessible and/or of lower quality and the resource persons not used to reading maps, it might be necessary to use another type of support. One possibility could be to map on ground-based photographs as in (B). However, this method would require a potentially large bank of images, depending on the size of the study area, and would not necessarily be easy to collect.
Mapping the climate-related processes affecting mountaineering itineraries also allows to produce documents that promote the transfer of knowledge to mountaineers. The 1:25,000 topographic map is a tool classically used by mountaineers, on which we add information on the change of the itineraries. In order to encourage awareness about the effects of climate change and the adaptation of mountaineers, these maps could, for example, be displayed for free in high mountain refuges. The map has a strong informative power for the users and should be a valuable planning and prevention tool in the future. Refuge keepers interviewed have already shown their interest for such initiative.
Limitations
The mapping method we propose here has however several limitations. Mapping processes in two dimensions is not optimal for representing elevation changes. For example, a glacier can lose several meters of ice thickness without any significant surface changes. In this case, no processes will be represented while the terrain and the climbing parameters of the itinerary have potentially deeply changed. This limitation can be balanced by applying the legend to ground-based photographs.
The legend we propose does not allow the mapping of all the processes that affect mountaineering itineraries. The fact that freezing is less frequent in high mountains (Pohl et al. Citation2019), with for example a projected decrease of 15–20% of the number of icy days (daily maximum temperature <0°C) between 2300–2700 m a.s.l. by 2030 (Cremonese et al. Citation2019) will have a significant effect on climbing parameters, but it is impossible to map. It is the same for the process ‘Weakening of snow bridges’.
The snow conditions on the aerial images used during step 3 (GIS mapping) have necessarily conditioned the digitization of glaciers and ice aprons. The presence of snow can hide some changes. However, any process drawn on the map was identified in step 1 and confirmed in step 3.
The attribution of a process as a result of climate change is done by the interviewees and is subject to the appreciation of the researcher, especially during the stage 3 of the method. It is not the result of a quantitative measurement with therefore a part of uncertainty on the exact causes of each process. In order to limit this bias as much as possible, we insisted during interviews on the fact that the interviewees have to identify changes over a long period of time and not during particular events; anyway, there are some cases where the attribution of processes as a direct effect of the climate change remains uncertain. This is particularly true for rockfalls because they can be triggered by several factors possibly combined.
As for the MBM, the present work does not take into account any ice gullies, which are defined as seasonal (Faup Citation2003) ‘concealed and narrow ice couloirs’ (Jouty and Odier Citation1999). Those gullies started to be climbed thanks to improvements in mountaineering equipment, after the guidebooks used in the MBM and the present study were published. According to the interviewees those gullies are also affected by climate change and form less frequently, with a lower ice quality because of a diminution in winter and spring snowfalls and more intense melting of the ice/snow cover. It is likely that new symbols will have to be added to the legend when studying this type of routes.
There is also a bias related to the itinerary sectorization. The fact that the descents start at the summit and end at the bottom of the valley implies that they are statistically affected by a large number of processes.
Conclusions and perspectives
This study presents the first legend that enables to map the processes related to climate change that affect mountaineering itineraries and modify their climbing parameters. This study responds to one of the main limitations identified in several previous studies on this topic. It facilitates the acquisition, analysis and update of the data, through the precise localization and quantification of the processes related to climate change that affect mountaineering routes. Their modification and the evolution of the possibility to practice mountaineering because of climate change are therefore all the better documented.
Furthermore, the legend defines an analytical framework, which can be completed and reused in other regions of the world, allowing for a better comparability and compilation of results. As could be expected, the comparison of the results between the MBM and the Valais Alps shows very similar patterns with, in both massifs, (i) an average of nine processes affecting the itineraries, (ii) itineraries mainly affected by glacial retreat and the appearance of bedrock or till and (iii) a quarter of the itineraries that is no longer climbable in summer. This observation confirms the robustness of the methodology used. In the future, similar studies on other massifs of the world should be made. In this regard, a work by the authors on the Hurrungane massif and the Lynguen Alps in the Scandinavian Alps should start soon. Another perspective would be to quantify the processes mapped in particular by measuring at the scale of mountaineering itineraries ice surface evolution and carrying out diachronic analysis of DTMs (loss of ice surface/thickness, evolution of the slope angles, etc.) in GIS.
Finally, mapping makes it possible to produce documents that promote the transfer of information to mountaineers and their adaptation to the effects of the climate change. They can therefore be used in this sense on many occasions and in particular during the training of Alpine guides and conferences as well as being displayed in high mountain refuges.
Disclosure statement
No potential conflict of interest was reported by the author(s).
Additional information
Notes on contributors
Jacques Mourey
Dr. Jacques Mourey is a post-doctoral researcher at the Center for Interdisciplinary Research on Mountains, University of Lausanne. His main research interests are the effects of climate change on sports practices in high mountain environments.
Ludovic Ravanel
Dr Ludovic Ravanel is a CNRS researcher in Geography at the University Savoie-Mont-Blanc. His work concerns the evolution of high mountain environments, notably permafrost-affected rock faces, ice faces, glaciers, and related natural hazards, in the context of climate change.
Christophe Lambiel
Dr Christophe Lambiel work at the Institute of Earth Surface Dynamics, University of Lausanne. His research mainly focus on high mountain geomorphology, with a special focus on detecting, mapping, monitoring and modeling of mountain permafrost.
References
- Ballantyne CK. 2002. Paraglacial geomorphology. Quat Sci Rev. 21:1935–2017. DOI:10.1016/S0277-3791(02)00005-7.
- Beniston M, Farinotti D, Stoffel M, Andreassen L-M, Coppola E, Eckert N, Fantini A, Giacona F, Hauck C, Huss M, et al. 2018. The European mountain cryosphere: a review of its current state, trends, and future challenges. Cryosphere. 12:759–794. DOI:10.5194/tc-12-759-2018.
- Berthier E, Vincent C, Magnússon E, Gunnlaugsson A, Pitte P, Le Meur E, Masiokas M, Ruiz L, Pálsson F, Belart JMC, et al. 2014. Glacier topography and elevation changes derived from Pléiades sub-meter stereo images. Cryosphere. 8:2275–2291. DOI:10.5194/tc-8-2275-2014.
- Biskaborn BK, Smith SL, Noetzli J, Matthes H, Vieira G, Streletskiy D, Schoeneich P, Romanovsky V, Lewkowicz A, Abramov A, et al. 2019. Permafrost is warming at a global scale. Nat Commun. 10:264. DOI:10.1038/s41467-018-08240-4.
- Church M, Ryder JM. 1972. Paraglacial sedimentation: a consideration of fluvial processes conditioned by glaciation. Geol Soc Am Bull. 83:3059–3072.
- Cox S, Fulsaas K. 2006. Mountaineering, the freedom of the hills. Seattle: The Mountaineering Books.
- Cremonese E, Carlson B, Filippa G, Pogliotti P, Alvarez I, Fosson JP, Ravanel L, Delestrade A. 2019. AdaPT Mont-Blanc: Rapport Climat: Changements climatiques dans le massif du Mont-Blanc et impacts sur les activités humaines. Rédigé dans le cadre du projet AdaPT Mont-Blanc financé par le Programme européen de coopération territoriale Alcotra Italie-France 2014–2020, 101.
- Dadic R, Corripio J, Burland P. 2008. Mass-balance estimates for Haut Glacier d’Arolla, Switzerland, from 2000 to 2006 using DEMs and distributed mass-balance modeling. Ann Glaciol. 49:22–26. DOI:10.3189/172756408787814816.
- Debarbieux B. 2020. L’Unesco au mont Blanc. Chamonix: Chamonix Guérin.
- Deline P, Gardent M, Magnin F, Ravanel L. 2012. The morphodynamics of the Mont Blanc massif in a changing cryosphere: a comprehensive review. Geogr Ann A Phys Geogr. 94:265–283. DOI:10.1111/j.1468-0459.2012.00467.x.
- Deline P, Gruber S, Delaloye R, Fischer L, Geertsema M, Giardino M, Hasler A, Kirkbride M, Krautblatter M, Magnin F. 2015. Ice loss and slope stability in high- mountain regions. In: Haeberli W, Whiteman C, Shroder JF, editors. Snow and ice-related hazards, risks, and disasters. Saint-Louis: Elsevier Science; p. 521–561.
- Della-Marta PM, Haylock MR, Luterbacher J, Wanner H. 2007. Doubled length of western European summer heat waves since 1880. J Geophys Res. 112. DOI:10.1029/2007JD008510.
- Draebing D, Eichel J. 2018. Divergence, convergence, and path dependency of paraglacial adjustment of alpine lateral moraine slopes. Land Degrad Dev. 29:1979–1999. DOI:10.1002/ldr.2983.
- Eichel J, Draebing D, Meyer N. 2018. From active to stable: paraglacial transition of Alpine lateral moraine slopes. Land Degrad Dev. 29(11):4158–4172. DOI:10.1002/ldr.3140.
- Etzelmüller B, Guglielmin M, Hauck C, Hilbich C, Hoelzle M, Isaksen K, Noetzli J, Oliva M, Ramos M. 2020. Twenty years of European mountain permafrost dynamics—the PACE legacy. Environ Res Lett. 15:104070. DOI:10.1088/1748-9326/abae9d.
- Faup H. 2003. Goulottes du massif du Mont Blanc. Géographie, fonctionnement et évolution glacio-morphologiques, 88. Univ. Paris VII. Paris, Mémoire DEA.
- Fischer L, Kääb A, Huggel C, Noetzli J. 2006. Glacier retreat and permafrost degradation as controlling factors of slope instabilities in a high-mountain rock wall: the Monte Rosa east face. Nat Hazards Earth Syst Sci. 6:761–772. DOI:10.5194/nhess-6-761-2006.
- Fischer M, Huss M, Barboux C, Hoelzle M. 2014. The new Swiss Glacier Inventory SGI2010: relevance of using high-resolution source data in areas dominated by very small glaciers. Arct Antarct Alp Res. 46(4):933–945. DOI:10.1657/1938-4246-46.4.933.
- GLAMOS. 2020. Swiss glacier length change, release 2020, Glacier Monitoring Switzerland. DOI:10.18750/lengthchange.2020.r2020.
- Gomez B, Small R. 2018. Medial moraines of the Haut Glacier d’Arolla, Valais, Switzerland: debris supply and implications for moraine formation. J Glaciol. 31(109):303–307. DOI:10.3189/S0022143000006638.
- Guerin A, Abellán A, Matasci B, Jaboyedoff M, Derron M-H, Ravane L. 2017. Brief communication: 3-D reconstruction of a collapsed rock pillar from Web-retrieved images and terrestrial lidar data – the 2005 event of the west face of the Drus (Mont Blanc massif). Nat Hazards Earth Syst Sci. 17:1207–1220. DOI:10.5194/nhess-17-1207-2017.
- Haeberli W, Gruber S. 2009. Global warming and mountain permafrost. In: Margesin R, editor. Permafrost Soils. Vol. 16. Berlin: Springer; p. 205–218.
- Harris C, Arenson LU, Christiansen HH, Etzelmüller B, Frauenfelder R, Gruber S, Haeberli W, Hauck C, Hoelzle M, Humlum O, et al. 2009. Permafrost and climate in Europe: monitoring and modelling thermal, geo- morphological and geotechnical responses. Earth Sci Rev. 92:117–171. DOI:10.1016/j.earscirev.2008.12.002.
- Harris C, Davies MC, Etzelmüller B. 2001. The assessment of potential geotechnical hazards associated with mountain permafrost in a warming global climate. Permafr Periglac Process. 12:145–156. DOI:10.1002/ppp.376.
- Hartmeyer I, Delleske R, Keusching M, Krautblatter M, Lang A, Schrott L, Otto J-C. 2020. Current glacier recession causes significant rockfall increase: the immediate paraglacial response of defglaciating cirque walls. Earth Surf Dyn. 8:729–751. DOI:10.5194/esurf-8-729-2020.
- Hock R, Huss M. 2021. Glaciers and climate change. In: Letcher T, editor. Climate change, observed impacts on planet earth. p. 157–176. DOI:10.1016/B978-0-12-821575-3.00009-8.
- Hugonnet R, McNabb R, Berthier E, Menounos B, Nuth C, Girod L, Farinotti D, Huss M, Dussaillant I, Brun F, Kääb A. 2021. Accelerated global glacier mass loss in the early twenty-first century. Nature. 592:726–731. DOI:10.1038/s41586-021-03436-z.
- Huss M. 2012. Extrapolating glacier mass balance to the mountain range scale: the European Alps 1900–2100. Cryosphere. 6:1117–1156. DOI:10.5194/tcd-6-1117-2012.
- IPCC. 2019. Summary for policymakers. IPCC Special Report on the Ocean and Cryosphere in a Changing Climate, Working Group I and II.
- Jouty S, Odier H. 1999. Dictionnaire de la montagne, illustré, 720. Paris, Arthaud.
- Klein G, Vitasse Y, Rixen C, Marty C, Rebetez M. 2016. Shorter snow cover duration since 1970 in the Swiss Alps due to earlier snowmelt more than to later snow onset. Clim Change. 139:637–649. DOI:10.1007/s10584-016-1806-y.
- Lambiel C, Maillard B, Kummert M, Reynard E. 2016. Geomorphology of the Hérens valley (Swiss Alps). J Maps. 12(1):160–172. DOI:10.1080/17445647.2014.999135.
- Lambiel C, Talon P. 2019. Les glaciers du haut val de Bagnes au Petit Age glaciaire. In: valaisannes A, editor. Actes du colloque Giétro 1818 sous la loupe des sciences. Centre Interdisciplinaire de Recherche sur la Montagne. Le Châble: Société d'histoire du Valais romand; p. 63–75.
- Lukas S, Graf A, Coray S, Schlüchter C. 2012. Genesis, stability and preservation potential of large lateral moraines of Alpine valley glaciers – toward a unifying based on Findelengletscher, Switzerland. Quat Sci Rev. 38:27–48. DOI:10.1016/j.quascirev.2012.01.022.
- Marcer M, Cicoira A, Cusicanqui D, Bodin X, Echelard Tm Obregon R, Schoeneich P. 2021. Rock glaciers throughout the French Alps accelerated and destabilised since 1990 as air temperatures increased. Commun Earth Environ. 2:81. DOI:10.1038/s43247-021-00150-6.
- McColl ST. 2012. Paraglacial rock-slope stability. Geomorphology. 153–154:1–16. DOI:10.1016/j.geomorph.2012.02.015.
- Mourey J, Marcuzzi M, Ravanel L, Pallandre F. 2019a. Effects of climate change on high Alpine environments: evolution of mountaineering routes in the Mont Blanc massif (Western Alps) over half a century. Arct Antarct Alp Res. 51(1):176–189. DOI:10.1080/15230430.2019.1612216.
- Mourey J, Perrin-Malterre C, Ravanel L. 2020. Strategies used by French Alpine guides to adapt to the effects of climate change. J Outdoor Recreat Tour. 29:100278. DOI:10.1016/j.jort.2020.100278.
- Mourey J, Ravanel L. 2017. Evolution of access routes to high mountain refuges of the Mer de Glace basin (Mont Blanc massif, France) – an example of adapting to climate change effects in the Alpine high mountains. J Alp Res. 105. DOI:10.4000/rga.3790.
- Mourey J, Ravanel L, Lambiel C, Strecker J, Piccardi M. 2019b. Access routes to high mountain huts facing climate-induced environmental changes and adaptive strategies in the Western Alps since the 1990s. Nor Geogr Tidsskr–Nor J Geogr. 73(4):215–228. DOI:10.1080/00291951.2019.1689163.
- Pohl B, Joly D, Pergaud J, Buoncristiani JF, Soare P, Berger A. 2019. Huge decrease of frost frequency in the Mont-Blanc Massif under climate change. Sci Rep. 9:4919. DOI:10.1038/s41598-019-41398-5.
- Pröbstl-Haider U, Dabrowska K, Haider W. 2016. Risk perception and preferences of mountain tourists in light of glacial retreat and permafrost degradation in the Austrian Alps. J Outdoor Recreat Tour. 13:66–78. DOI:10.1016/j.jort.2016.02.002.
- Purdie H, Kerr T. 2018. Aoraki Mont Cook: environmental change on an iconic mountaineering route. Mt Res Dev. 38(4):364–379. DOI:10.1659/MRD-JOURNAL-D-18-00042.1.
- Rabatel A, Letréguilly A, Dedieu J-P, Eckert N. 2013. Changes in glacier equilibrium-line altitude in the western Alps from 1984 to 2010: evaluation by remote sensing and modeling of the morpho-topographic and climate controls. Cryosphere. 7:1455–1471. DOI:10.5194/tc-7-1455-2013.
- Ravanel L, Deline P. 2008. La face ouest des drus (massif du Mont-Blanc): évolution de l’instabilité d’une paroi rocheuse dans la haute montagne alpine depuis la fin du petit age glaciaire. Géomorphologie. 4:261–272. DOI:10.4000/geomorphologie.7444.
- Ravanel L, Deline P. 2011. Climate influence on rock- falls in high-Alpine steep rockwalls: the north side of the Aiguilles de Chamonix (Mont Blanc Massif) since the end of the “Little Ice Age”. Holocene. 21:357–365. DOI:10.1177/0959683610374887.
- Ravanel L, Duvillard P-A, Jaboyedoff M, Lambiel L. 2018. Recent evolution of an ice-cored moraine at the Gentianes Pass, Valais Alps, Switzerland. Land Degrad Dev. 29(10):3693–3708. DOI:10.1002/ldr.3088.
- Ravanel L, Magnin F, Deline P. 2017. Impacts of the 2003 and 2015 summer heatwaves on permafrost-affected rock-walls in the Mont Blanc massif. Sci Total Environ. 609:132–143. DOI:10.1016/j.scitotenv.2017.07.055.
- Rébuffat G. 1973. Le massif du Mont-Blanc – Les 100 plus belles courses, 238. Paris: Denoël.
- Ritter F, Fiebig M, Muhar A. 2011. Impacts of global warming on mountaineering: a classification of phenomena affecting the Alpine trail network. Mt Res Dev. 32:4–15. DOI:10.1659/MRD-JOURNAL-D-11-00036.1.
- Scherler D, Wulf H, Gorelick N. 2018. Global assessment ofsupraglacial debris-cover extents. Geophys Res Lett. 45:11798–11805. DOI:10.1029/2018GL080158.
- Schoeneich P. 1993. Comparaison des systèmes de légendes français, allemand et Suisse – principes de la légende IGUL. In: Schoeneich P, Reynard E, editors. Cartographie géomorphologiques, cartographie des risques, Vol. 9. Lausanne: Institut de Géographie, Travaux et Recherches; p. 15–24.
- Serquet G, Marty C, Dulex J-P, Rebetez M. 2011. Seasonal trends and temperature dependence of the snowfall/precipitation-day ratio in Switzerland. Geophys Res Lett. 38:L07703. DOI:10.1029/2011GL046976.
- Shannon S, Smith R, Wiltshire A, Payne T, Huss M, Betts R, Caesar J, Koutroulis A, Jones D, Harrison S. 2019. Global glacier volume projections under high-end climate change scenarios. Cryosphere. 13:325–350. DOI:10.5194/tc-13-325-2019.
- Temme AJAM. 2015. Using climber’s guidebooks to assess rock fall patterns over large spatial and decadal temporal scales: an example from the Swiss Alps. Geogr Ann A: Phys Geogr. 97(4):793–807. DOI:10.1111/geoa.12116.
- Vaucher M. 1979. Les Alpes Valaisannes – Les 100 plus belles courses. Paris: Denoël.
- Vincent C, Fischer A, Mayer C, Bauder A, Galos SP, Funk M, Thibert E, Six D, Braun L, Huss M. 2017. Common climatic signal from glaciers in the European Alps over the last 50 years: common climatic signal in the Alps. Geophys Res Lett. 44:1376–1383. DOI:10.1002/2016GL072094.
Appendices
Appendix 1
Appendix 2