
ABSTRACT
The extent of the Southern Alps icefield in New Zealand is well-constrained chronologically for the last glacial cycle. The sediment-landform imprint of this glacial system, however, offers insight into ice-marginal processes that chronological control cannot. We present the first detailed investigation of sediments along the southwestern shores of Lake Tekapo, South Island. We identify seven lithofacies, from which a five-stage palaeoglaciological reconstruction of depositional and glaciotectonic events is proposed: (i) ice-marginal advance and deposition of outwash gravels in lithofacies (LF) 1; (ii) ice-marginal recession and the development of an ice-contact lake, manifest in rhythmite deposition and iceberg rafting of dropstones (LF 2), followed by a depositional hiatus; (iii) ice-marginal recession recorded in ice-proximal aggradation of glaciofluvial hyperconcentrated flows (LFs 3, 4); (iv) ice-marginal advance documented by glaciotectonic disturbance and localized hydrofracturing, coeval with the deposition of delta foresets and a subglacial diamicton/till (LFs 5, 6); (v) final stages of ice-marginal recession and deposition of outwash gravels in LF 7. Two infrared stimulated luminescence ages were obtained from the glaciolacustrine sediments and, whilst the dating has some limitations, the sediments pre-date both the global and local Last Glacial Maximum. Overall, this sequence, consistent with sediment fills recorded elsewhere across South Island, suggests recurrence of processes from different glacial advances and the role of topographic constraints on maintaining lake positions.
Introduction
Mountain glaciers are rapidly diminishing and causing widespread environmental and socio-economic concern (Hugonnet et al. Citation2021). Reconstructing the nature and behaviour of palaeo-glaciers enables a better understanding of the long-term (centennial to multi-millennial) character of glaciers within the Earth-atmosphere system (e.g. Clark Citation1997; Boulton et al. Citation2001; Clark et al., Citation2018; Evans et al. Citation2009; Hubbard et al. Citation2009; Ely et al. Citation2021). In particular, the relative sensitivity of mid-latitude glaciers to modern climate change makes them especially important to consider compared to other regions around the world. For example, the sediment-landform relationships of New Zealand valley glacier systems are important for understanding glacier behaviour in mountainous mid-latitude regions, including South America (e.g. Bentley Citation1996), parts of northwest Europe (e.g. Winkler and Nesje Citation1999), and the Pacific northwest of North America (e.g. Bennett et al. Citation2002; Wyshnytzky et al. Citation2019). New Zealand valley glacier systems are especially interesting due to high sediment supply driven by active tectonics, relatively friable bedrock, and a climate characterized by high annual temperatures and low seasonality. These factors combine to also generate significant year-round glaciofluvial activity (Hyatt et al. Citation2012) and consequently glacial landsystems that are dominated by thick sequences of glaciofluvial gravels (e.g. Soons Citation1963; Gage Citation1965; Suggate Citation1990) and proglacial lake sediments trapped behind outwash heads composed of these aggradational gravels (e.g. Kirkbride Citation1993; Evans et al. Citation2013; Sutherland et al. Citation2019a). This landsystem, therefore, differs significantly from those of high- and mid-latitude valley glaciers and continental ice sheet margins of the Northern Hemisphere, on which most of the palaeoglaciological literature has been previously focused (e.g. Benn and Evans Citation1998; Evans Citation2003, Citation2013a, Citation2013b).
There is a growing body of empirical evidence relating to the temporal evolution of the Southern Alps icefield throughout the Quaternary (see Darvill et al. Citation2016 for a review; Shulmeister et al. Citation2019). Constraining the timing of glacial fluctuations in New Zealand has been used to deduce climatological inferences on an interhemispheric scale (e.g. Putnam et al. Citation2013a, Citation2013b; Doughty et al. Citation2013). As a result, rather more is known about glacier moraine chronology than the sediment-landform imprint of New Zealand glacial systems, especially in terms of ice-marginal process-form regimes, and their palaeo-glaciological implications. Fundamentally, such insight relies upon high-resolution local studies of the stratigraphy and sedimentology of deposits from former glacier margins. The high-quality outcrops required for such work on Quaternary-age strata in the New Zealand Southern Alps are from discontinuous exposures in gully or valley walls, or vehicle-track cuttings, and exposures through the infills of the lower ends of glacial troughs. These sediment exposures commonly contain remnants of relatively old (pre-21 ka) sediments, such as those in the Rakaia (e.g. Shulmeister et al. Citation2010b; Hyatt et al. Citation2012), a valley with a 2372 km2 catchment on the southeastern side of the Southern Alps (43°S, 171°E). Within the context of this study, we refer to the global Last Glacial Maximum (LGM) defined by Clark et al. (Citation2009) from 26.5 to 19 ka, but with the local LGM in New Zealand occurring between c. 35 and 28 ka (Barrell Citation2011; Shulmeister et al. Citation2019).
Detailed, lithofacies-focused glacial sedimentological studies in New Zealand (e.g. Speight Citation1926; Hart Citation1996; Hambrey and Ehrmann Citation2004; Mager and Fitzsimons Citation2007; Carrivick and Rushmer Citation2009; Shulmeister et al. Citation2009; Evans et al. Citation2010, Citation2013; Rother et al. Citation2010; Hyatt et al. Citation2012) have demonstrated that the available outcrops contain a potentially valuable archive of glacial history and climatic change, as well as palaeo-seismic and tectonic activity over millennia. The Mackenzie basin in South Island has been a particular area of focused study for understanding Quaternary glacial oscillations, especially for the LGM (Schaefer et al. Citation2009; Kaplan et al. Citation2010, Citation2013; Putnam et al. Citation2010; Kelley et al. Citation2014; James et al. Citation2019; Strand et al. Citation2019) and the Little Ice Age (LIA; Carrivick et al. Citation2020a). However, these palaeo-glacier extents and local valley chronologies have been predominantly defined by geomorphological mapping and geochronology, limiting their applicability to assessing temporal evolution. The sedimentary exposures that exist within these valleys have been largely ignored but could be utilized to gain a better understanding of glacier behaviour and palaeo-glacier dynamics. The aim of this study is, therefore, to determine the depositional processes and relative event stratigraphy of sediments in cliff exposures along the eastern shores of Lake Tekapo.
Study area and previous research
Tekapo valley
The Tekapo valley is a southerly-draining catchment located east of the Southern Alps in the Mackenzie basin (southern Canterbury; ), a structurally controlled intra-montane basin occupied by a large river system (the Waitaki). The lithology of the region is mostly mid-late Triassic greywackes of the Torlesse Terrane, with Permian sequences occurring in the south and east (Gair Citation1967). A significant structural feature cutting through the Mackenzie basin is the Irishman Creek Fault (ICF; (c)). This is a reverse fault, striking parallel to the Alpine Fault and dipping ∼55 o southeast (Fox Citation1987; Chetwin Citation1998; Kleffmann Citation1999). The ICF is likely the major structure within a broader zone of deformation, the Irishman Creek Fault Zone (Fox Citation1987; Cox and Barrel Citation2007). The fault zone is ∼15 km wide, generally trends east – northeast, and is defined by a series of east-northeast trending fault traces to the southeast of Lake Tekapo. According to The New Zealand Active Faults Database (NZAFD; Langridge et al. Citation2016), the fault recurrence interval is between 0 and 2000 years, the slip rate is low (0.2–1 mm yr−1) and the single event displacement is moderate (1–5 m). Upton et al. (Citation2004) suggested that it can sensibly be projected across Lake Tekapo into the zone of Forest Creek Faults (FCF), which strike northeast and extend at least as far as the Rangitata river (Upton and Osterberg Citation2007). A northeast extension of the ICF has also been proposed based on a series of uplifted basement blocks, including Mt John, Mt Hay, Wee McGregor and possibly Motuariki island, which run approximately along-strike of the ICF (Fox Citation1987).
The Mackenzie basin has been glaciated numerous times throughout the Quaternary period (Shulmeister et al. Citation2019) with piedmont glaciers reaching >50 km downstream of their present ice margins (Barrell et al. Citation2011). During previous glacial advances, the Godley Glacier coalesced with the nearby Maud, Grey and Classen Glaciers, as well as ice from the Fork and Cass tributaries, to form a large piedmont glacier lobe in the lower reaches of the Tekapo valley ((b)). The Tekapo Glacier constructed a spectacular sequence of inset latero-frontal moraines and associated outwash fans, as reported by Sutherland et al. (Citation2019b). The over-deepened glacially excavated trough is now occupied by the modern Lake Tekapo (). The glacial trough has formed through multiple glaciations and is predominantly bound at its southern extent by moraine and glaciofluvial outwash deposits (Gage Citation1975; Cox and Barrel Citation2007). The lake is 27 km long and, at its widest, 6 km across with a surface area of approximately 87 km2. Typical of intermontane lakes, Lake Tekapo is deep (∼120 m southeast of Motuariki Island), with a flat-floored basin containing numerous subaqueous slumps (Mountjoy et al. Citation2019). In the early 1950s, the original lake outlet into the Tekapo River was dammed and the lake raised for hydroelectric storage. Lake Tekapo has a normal operating range from 702 m a.s.l to 711 m a.s.l.
Barrell and Read (Citation2014) provide a review of the nomenclature on landform associations in the Mackenzie basin. The majority of palaeoglaciological investigations have focussed on the landforms in the Ohau and Pukaki valleys (Schaefer et al. Citation2009; Kaplan et al. Citation2010, Citation2013; Putnam et al. Citation2010, Citation2013a, Citation2013b; Kelley et al. Citation2014; Doughty et al. Citation2015; Strand et al. Citation2019). Sedimentary outcrops around Lake Pukaki have also been investigated and logged in detail (Hart Citation1996; Mager and Fitzsimons Citation2007; Evans et al. Citation2013) to reconstruct the depositional processes involved in moraine construction and associated glaciolacustrine deposition. In the Tekapo valley, previous research has largely been concerned with the modern-day lake. Pickrill and Irwin (Citation1983) conducted an initial seismic reflection survey of Lake Tekapo and from gravity cores they described ‘varved lower foreset sediments’. Upton and Osterberg (Citation2007) later interpreted palaeoseismic events and mass flows from seismic reflection data of the lake. More recently, Mountjoy et al. (Citation2019) investigated the tsunami hazard from lacustrine mass wasting in Lake Tekapo. The glacial geomorphology of the Tekapo valley was mapped by Barrell et al. (Citation2011), who concentrated on identifying contiguous geochronological surfaces, and most recently and in more detail by Sutherland et al. (Citation2019b), who produced a more process-focussed geomorphological map. In combination, this previous research has demonstrated that the landforms preserved in the Tekapo valley are potential sedimentary archives of both climatic and non-climatic geomorphological events during the LGM.
Stratigraphic exposures
Well-exposed sedimentary outcrops occur in the wave-cut cliff along the lakeshore of southwestern Lake Tekapo, South Island, New Zealand (). Pale-coloured sediments form part of the cliff-line, locally known as the ‘white cliffs’ or ‘white bluffs’. The main cliff exposure is located on the southwestern shore of Lake Tekapo, between 5.5 and 7 km north of the lake outlet ( and ). The cliffs lie at the margin of a broad glacier-sculpted plateau to the west, the bedrock massif of Mt John to the south, and a steep drop eastward into the axis of the trough from the former Tekapo Glacier (). The Tekapo valley in this vicinity is broad (>10 km wide), but the present-day lake is at its narrowest at this location. To the north, the lake is shallow for ∼1 km before deepening rapidly. The lake trough is cut into basement greywacke as a result of multiple glaciations and pre-dates the deposition of the cliff sediments since they are located above the current lake levels (Upton and Osterberg Citation2007).
Figure 1. (a). Study area location: Mackenzie basin highlighted by dashed box. (b). Mackenzie basin: present-day ice is mapped in white; LGM ice extent is mapped in light grey. (c). 1 m hillshaded bathymetry of Lake Tekapo (from Mountjoy et al. Citation2019), overlain on a 1 m hillshaded DEM (from Land Information New Zealand; LINZ). The logged outcrop is highlighted by a black box and labelled. The palaeo-lake level at the LGM (Sutherland et al. Citation2019a, Citation2019b) is shown by the white contour (726 m a.s.l). Major fault lines are mapped in red (from New Zealand Active Faults Database; NZAFD).
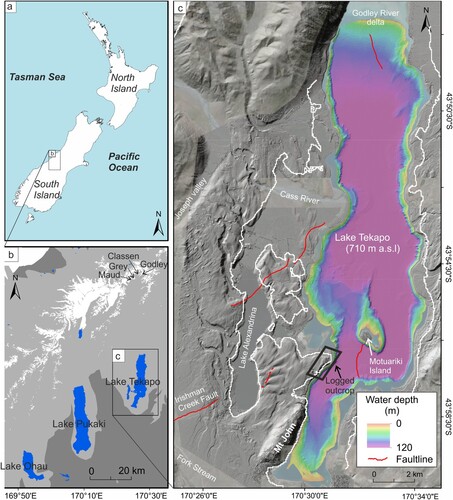
Figure 2. (a). The southwestern shoreline of Lake Tekapo, viewed from the eastern lakeshore, showing the location of the outcrop in panel b and the bedrock contact in panel d. (b). Extent of the logged outcrop, as viewed from the eastern lakeshore. Note that the surface of the cliff is relatively flat-lying, and the top of the outcrop is cut through a palaeo-lake level at 726 m a.s.l. (Sutherland et al. Citation2019a, Citation2019b) (c). Contextual photograph to show the vertical scale of the outcrop, viewed from the south. Circle and arrow in the box in panel b indicates the position of the photographer and view direction respectively in panel c. (d). Contact between bedrock and pale silts, location relative to logged exposure shown in panel a.
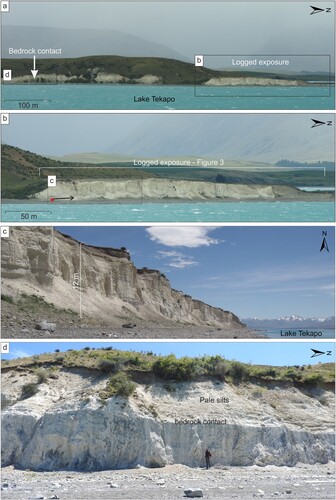
The sedimentary exposure documented in this study lies immediately adjacent to extensive drumlinized terrain (Sutherland et al. Citation2019b) and provides a window into what could underly this broad plateau to the west. The whole southern sector of the exposure is composed of pale lake silt, overlain on a horizontal contact by gravels. The cliff exposure has a representative range of sedimentological and structural elements within a small area, and therefore, is the focus of documentation in and succeeding figures. The artificial control over the current water levels of Lake Tekapo is, in part, responsible for the exposed outcrop.
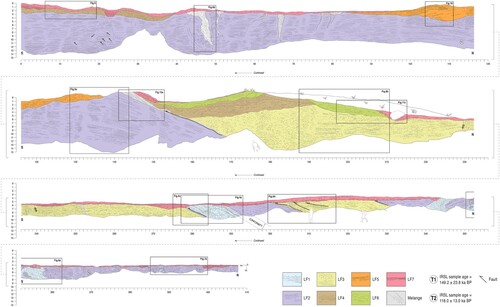
Figure 3. Scaled section sketch of the northern half of the stratigraphic outcrop on the west shoreline of Lake Tekapo, showing main lithofacies and their architectural characteristics. The white area at the base of the section is obscured by talus. Boxed areas are the locations of detailed studies of lithofacies and structures depicted in annotated photographs in . Readers are directed to the high-resolution online version of this figure for detail.
Pickrill and Irwin (Citation1983) first noted the presence of rhythmic bedding in outcrops along the shore of Lake Tekapo, which they interpreted as varves. Upton and Osterberg (Citation2007) noted that sediment was presumably deposited soon after the last deglaciation, when the level of Lake Tekapo was considerably higher than today (Cox and Barrel Citation2007; Sutherland et al. Citation2019a). Upton and Osterberg (Citation2007) further described two northern exposures as ‘flat-lying’ and observed deformation in the form of various low-amplitude, small-scale, folds and faults, which they attributed to deformation along the ICF ((c)). However, they also raised the possibility that the small offset faults may have developed from drainage of the lake basin during deglaciation.
Methods
Stratigraphy and sedimentology
Our stratigraphical and sedimentological investigations focussed on ∼350 m lateral outcrop between 43° 56′40.8″ S, 170° 30′02.3″ E and 43° 56′55.3″ S, 170° 30′00.2″ E ((a,b)). The outcrop was logged using scaled section sketches made in the field and detailed photograph annotation. These logs were augmented by highlighting the stratigraphic architecture of the outcrop and with photographs and sketches of localized sedimentological and structural details of the most accessible parts of the cliff. We characterized individual lithofacies, classified according to the facies codes proposed by Eyles et al. (Citation1983) and following the procedures reviewed by Evans and Benn (Citation2004). Exposure logging recorded unit thickness, bedding, colour, primary sedimentary structures, bed contacts, sediment body geometry, as well as sorting and texture. Secondary sedimentary structures, such as faults, folds and clastic dykes were also recorded.
Clast morphology
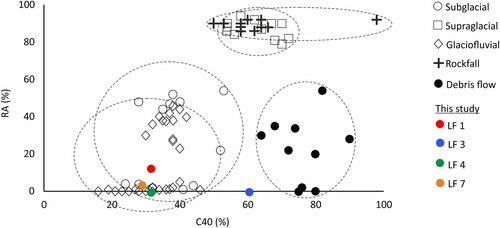
Quantitative analyses of clast morphology, using clasts of similar lithology, can provide information on aspects of transport history prior to, and during, deposition. Clast morphological analysis is particularly useful for differentiating subglacial debris from englacially, supraglacially, or fluvially transported sediment. At selected sites from four of the clast-rich lithofacies (LFs 1, 3, 4, 7), a sample of 50 greywacke and schist clasts was picked from the outcrop from each lithofacies for clast-form analysis to help establish the depositional history of the sediment. The inaccessibility of two lithofacies (LFs 5 and 6) restricted the collection of clast form data. The measured parameters included clast shape (the relative dimensions of the long, intermediate, and short axes), Power’s roundness (the overall smoothness of the clast outline), and texture (small-scale surface features) (cf. Evans and Benn Citation2004; Hubbard and Glasser Citation2005; Hambrey and Glasser Citation2012; Lukas et al. Citation2013). Roundness was assessed visually using histogram plots and statistically by calculating the percentage of clasts that are angular (A) and very angular (VA) providing a summary index for roundness (RA value), and the percentage of clasts in the rounded (R) and well-rounded (WR) categories (RWR value; Benn Citation2004; Lukas et al. Citation2013). Clast shape was analysed statistically by using clast shape triangles (Benn Citation2004) from which the percentage of clasts with a c:a (short:long axis) ratio of ≤0.4 is calculated. This summary index for shape is known as a C40 index. C40 indices were compared to RA values in co-variance plots following procedures outlined in Benn and Ballantyne (Citation1994). Data derived from different depositional environments in New Zealand (Evans et al. Citation2010; Brook and Lukas Citation2012; Lukas et al. Citation2013) were also plotted to aid assessments of inter-sample variability. The control samples were taken from Greywacke, Argillite and Schist clasts in latero-frontal moraine loops of Fox Glacier in Westland.
Infrared stimulated luminescence
Two luminescence samples were obtained from glaciolacustrine sediments (LF 2) in the outcrop by forcing a reinforced plastic tube (220 mm long, 75 mm diameter) into the compacted silt. Sample sites (T1 43°56′48.6 S, 170°30′02.3 E, T2 43°56′41.20″S 170°30′2.10″E) are labelled in . Both samples were submitted to the Victoria University Dating Laboratory (Wellington, New Zealand), where their ages were determined using Infrared stimulated Luminescence (IRSL) on the silt fraction (4–11 µm). Samples were measured using the single aliquot regenerative (SAR) technique. Full details on the luminescence methods and results are provided in Supplementary Information.
Results
Overall stratigraphy and sedimentology
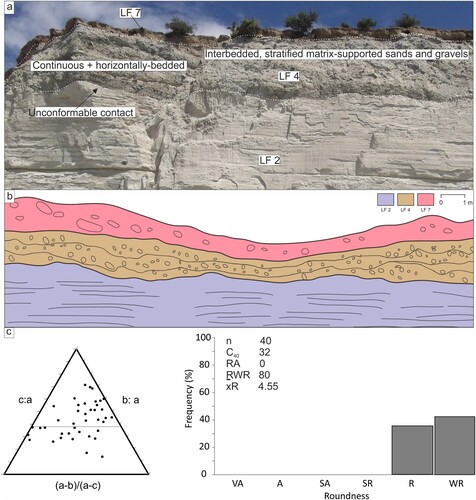
There is approximately 500 m of laterally accessible cliff exposure, with a maximum cliff height of 15 m gradually decreasing in height northwards from the toe of Mt John. The overall exposure has been examined in detail, and the northern ∼410 m of the section is shown in to provide the spatial context for the sedimentological results. The broad stratigraphic architecture comprises horizontally arranged lithofacies packages in the southern part of the section, passing northwards into progressively deformed strata (). Greywacke bedrock is observed in a southern outcrop of cliffs (43°57′10.75″ S, 170°29′38.37″ E; (d)), protruding 4 m above the present shoreline and dipping northeast. In places, the sediments sub-crop the beach face and down into the shallow lake water.
Seven lithofacies were identified within the section (LFs 1–7; ), together with several tectonic melanges and numerous prominent sub-vertical to vertical clastic dykes (). The lithofacies are described in superpositional order with numbering of LF 1 through LF 7 representing an interpreted relative age sequence, from oldest to youngest. The following sections provide a description of textural composition, clast-form morphology for gravelly units, nature of bedding and relationship to other units. Following this, an assessment of depositional genesis is made for each lithofacies.
Table 1. Descriptive information and depositional interpretation.
Lithofacies descriptions and geometry
Lithofacies 1 (LF 1)
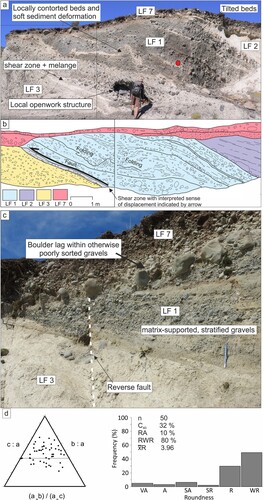
LF 1 occurs in the northern part of the outcrop (). It is composed of steeply-dipping and locally heavily contorted beds of coarser (cobble to boulder) gravels; initial sub-horizontal emplacement is indicated by the bedding in the fine-grained laminae of lenses (see below). Bedding is dipping at angles up to 30°, largely dipping towards the north. These sediments range from well- to poorly-sorted and from matrix-supported to clast-supported and in places openwork in character ((a,b)). Individual gravel packages are separated by discontinuous lenses to beds of laminated silty-sand and silt. Localized soft sediment deformation structures, especially in areas of thicker laminated silt units, are present and comprise convolute (polyclinal) folds and load structures ((a,b)) in alternating fine- and coarse-grained facies. Gravel lag horizons occur in the upper beds of this lithofacies and comprise cobbles and boulders ((c)), forming a conformable contact with overlying LF 2. Small-scale simple shear structures between the lower contact of LF 1 and the upper contact of LF 3 ((a–c)) are characterized by well-developed overturned, isoclinal and sheath folds, associated with reverse faults (small thrust displacements; (c)). At the boundary between LF 1 and LF 3 ((a–c)), the otherwise highly contorted beds of poorly sorted cobble gravel of LF 1 and cross-bedded sands of LF 3 and an overlying matrix-supported gravel within LF 1 have been attenuated to form pseudo-laminated banding. Here, upper stratified gravels have been amalgamated with underlying matrix-supported gravels. Similarly, a well-developed, bed-parallel fissility is apparent at this point of contact. Clast form in LF 1 is characterized by an RA of 10%, RWR of 80% and a C40 of 32% ((d)).
Figure 4. Characteristics of LF 1: (a) tilted bedding of well- to poorly-sorted and matrix-supported to clast-supported coarse gravels. Note that gravel packages are separated by discontinuous lenses/beds of laminated silty-sand and silt, displaying soft sediment deformation structures; (b) Stratigraphical and structural interpretation of panel a, location labelled on . (c) shear zone/fault contact within LF 1 (outlined and descending from left to right) where upper stratified gravels have been amalgamated with underlying matrix-supported gravels. (d) Clast form for LF 1 collected from area marked by red circle in a.
Lithofacies 2 (LF 2)
LF 2 is the most laterally extensive and thickest of the lithofacies at the site ( and ). It comprises ≤11 m of horizontally bedded rhythmites (cosets) comprising alternating fine units (sets) of clayey fine silt and coarser units (sets) of silty fine sand to medium sand laminae or beds. Individual sets vary in thickness, with finer-grained sets ranging from 2.5 to 5.0 cm and coarser grained sets ranging from 2.5 to 11.25 (rarely up to 80) cm thick; these coarse and fine grained rhythmite cosets alternate up sequence to form repeating couplets. Internally, the cosets also display strongly developed horizontal stratification or lamination ((a)). The basal contacts of the coarser beds also appear in some places to have been scoured downwards into underlying beds. Bedforms are largely absent throughout LF 2 with the exception of features in the lowest 2 m of the outcrop above lake level. Here, thin and discontinuous lenses or horizontal laminae of coarse sandy silt with scoured infills at the base of the coarser sets. These horizontal laminae form coarsening upwards sequences at the top of the coarser sets, capped by rapidly fining laminae or beds of the fine sets which drape undulatory tops of the lenses ((b)).
Figure 5. Characteristics of LF 2: (a) coarse and fine grained rhythmite cosets forming repeating couplets and showing strongly developed internal horizontal stratification or lamination (scraper blade = 15 cm long); MS notation = melt season, N-MS notation = non-melt season (b) thin and discontinuous horizontal laminae of coarse sandy silt, displaying rip up clasts and starved ripples, and capped by rapidly fining laminae; (c) lonestone cluster; (d) lonestone (e) rhythmic cycles forming couplets throughout LF 2 and showing the change from thin bedding at the base to the thickest bedding at the top of the sequence. Note the lonestone on the right-hand side of exposure; (f) Stratigraphical and structural interpretation of panel d, location labelled on . (g) Heavily faulted and fractured rhythmites (h) Reverse fault with lonestone, note pencil for scale (i) Load and flame soft sediment deformation in sand and silts, note pencil for scale (j) Convoluted and highly contorted sands and silts
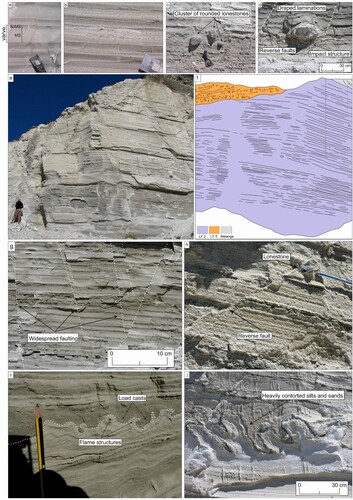
Generally, LF 2 outcrops intermittently except at the southern end where it is much more laterally continuous (). At the northern end of the logged outcrop, the silts are not as well-laminated and are locally heavily disturbed by cross-cutting dykes (see below; ), open, asymmetric and polyclinal folds ((a,b)), in contrast to the southern end. Rounded lonestones or outsized clasts occur sporadically throughout the sequence but are most abundant in the lower 2–3 m at the southern end of the logged outcrop, where they often occur in clusters ((c)); above this in the sequence, lonestones are rare but can be up to cobble or even boulder size ((d)). The lonestones puncture the delicate laminae below and exhibit both impact structures beneath them, and draping lamination overlying them ((c,d)). Notwithstanding this variability in detail, at outcrop scale the whole of LF 2 displays remarkable consistency in rhythmic cycles to form couplets, but with the lower 3.5 m containing the thinnest bedding (often laminated) and the upper 7.5 m displaying the thickest ((e,f)). In the highest and undeformed cliff exposure, the total sequence contains 77 couplets of coarse- and fine-grained cosets/couplets. Due to its fine-grained nature, LF 2 displays the most widespread internal fault structures ((g,h)) which are difficult to observe in the coarser materials of the other lithofacies. Some steeper faults, dipping at 40° to 42° northwards also occur in LF 2 at the southern end of the exposure, where they are crosscut by southerly dipping faults.
Figure 6. Clastic dykes developed in LF 2: (a) complex of upward-tapering form displaying anabranching gravel-filled necks that isolate blocks of LF 2 host material and end in numerous tapering offshoots and isolated elongate gravel pods or stringers; (b) Stratigraphical and structural interpretation of panel a, location labelled in ; (c & d) downward-tapering forms, showing also multiple vertical cracks that parallel the wedge sides; (e & f) examples of the bases of downward-tapering wedges, including finer poorly-sorted gravels (d) and finely-laminated rhythmites that parallel the dyke walls (e).
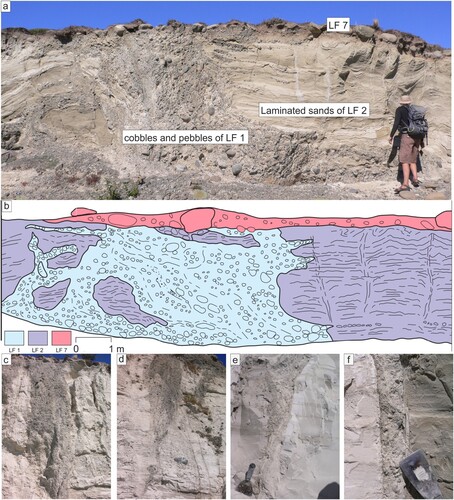
Figure 7. (a) Highly contorted bedding (tight polyclinal folding) displayed in upper LF 2 at the northernmost end of the outcrop. (b) Stratigraphical and structural interpretation of panel a, location labelled in (c) clastic dyke developed along a fault in LF 2, probable hydrofracture (d) close up of probable hydrofracture (e) clastic dyke developed between faults in LF 3
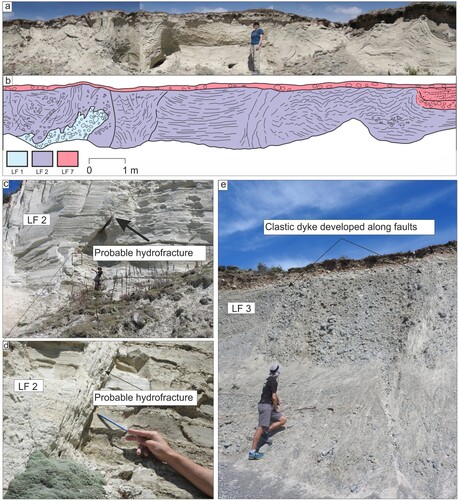
Other important characteristics which crosscut LF 2 are widespread clastic dykes (). These dykes occur as either upwards- or downward-tapering forms, with the former being observed at the northern end of the exposure and the latter at the southern end (). In detail, the upwards-tapering forms are complex and constitute wide anabranching necks filled with gravels that effectively isolate blocks of the host materials and end in numerous tapering offshoots and isolated elongate gravel pods or stringers that largely parallel the bedding in the host materials ((a,b)). Crude to well-developed stratification involving gravels and finer laminated sediments is displayed within the necks, in which the bedding parallels the neck walls, but the neck cores can also be composed of structureless gravel. Downward-tapering forms are less complex and constitute largely simple wedges containing crudely stratified gravels in which bedding is vertical and largely parallel to the dyke walls ((c,d)). These forms have a sharp erosional contact with LF 7 above. Also prominent on either side of the downward-tapering wedges are multiple vertical cracks that parallel the wedge sides. These cracks are arranged in downward-tapering clusters and in some cases a cluster will grade upwards into a clastic dyke ((c)). The bases of downward-tapering wedges are characterized by finer-grained dykes containing either finer poorly-sorted gravels and/or finely-laminated rhythmites that parallel the dyke walls ((e,f)).
A narrow zone (≤1 m thick) at the top of LF 2 in the central part of the exposure is composed of highly compacted and massive silty sand derived from the underlying rhythmites. In some places, these sediments ascend at low angles into the overlying lithofacies as attenuated lenses or boudinaged folds, thereby resembling a Type IV melange of Cowan (Citation1985). Highly contorted bedding representative of tight isoclinal folding occurs in the upper beds of LF 2 in an area of complex disturbance at the north end of the exposure ((a,b)).
Lithofacies 3 (LF 3)
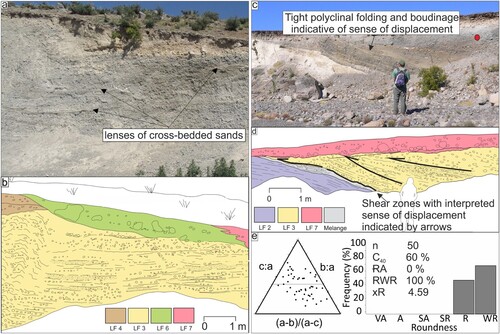
LF 3 occurs in the central part of the section () and is a layered ≤5.5 m thick sequence of predominantly poorly sorted pebble to cobble gravel, arranged in packages of massive to crudely horizontally bedded sheets and separated by discontinuous, lensate bodies of largely planar cross-bedded sands ((a,b)). The lensate bodies infill scoured lower contacts and display flat upper contacts where they grade sharply into the overlying gravel sheets ((c,d)). A clast form sample from LF 3 ((e)) yielded an RA of 0%, an RWR of 100% and a C40 of 60%. Highly contorted bedding representative of tight isoclinal folding occurs in two conspicuous areas of LF 3 (; shear zones in (c,d)) in the centre of the logged exposure, otherwise fold structures are predominantly of shallow, open styles. Several large dykes occasionally crosscut LF 3 ((e)).
Figure 8. Characteristics of LF 3: (a) packages of massive to crudely horizontally bedded sheets of poorly sorted gravel, separated by discontinuous, lensate bodies of cross-bedded sands; (b) Stratigraphical and structural interpretation of panel a, location labelled on ; (c) tilted bedding with large concentrations of cross-bedded sands, in thrust fault contact with underlying LF 2 and containing a shallow internal thrust fault dipping northwards; (d) Stratigraphical and structural interpretation of panel c, location labelled on ; (e) Clast form data from LF 3 sampled from the area marked by the red circle in c.
Lithofacies 4 (LF 4)
LF 4 appears near the top of the logged exposure at its southern and central sections and has an erosional lower boundary with either LF 2 or LF 3 (). LF 4 ‘oversteps’ LF 2 and LF 3 i.e. the boundary is an unconformity/erosional surface. LF 4 is comprised of ≤3 m of multiple packages of horizontally bedded stratified and clast-dominated pebbles interbedded with matrix-supported gravels, containing and separated by relatively continuous beds of crudely horizontally bedded sand ((a,b)). In the central section, the architecture of LF 4 changes abruptly up section from horizontal bedding into shallow clinoforms. A clast form sample from LF 4 is characterized by an RA value of 0%, an RWR of 100% and a C40 of 32% ((c)).
Figure 9. Characteristics of LF 4: (a) outcrop details showing interbedded stratified and locally clast-supported diamictons and matrix-supported gravels, here lying unconformably over LF 2; (b) Stratigraphical and structural interpretation of panel a, location labelled on ; (c) Clast form data from LF 4.
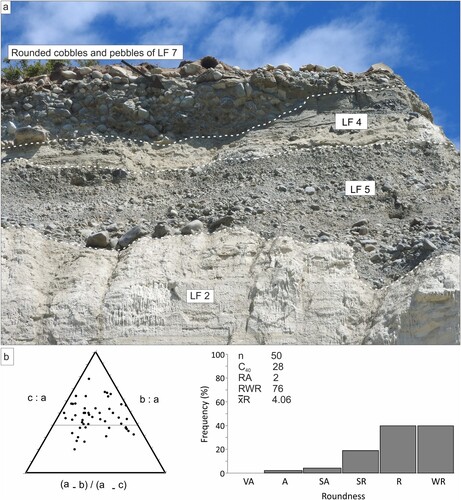
Lithofacies 5 (LF 5)
LF 5 occurs in the southern part of the exposure (). This lithofacies is a single package of clinoforms dipping consistently at ∼20° towards the southeast and contains well-sorted, clast-supported pebble to cobble gravels with occasional boulders (). LF 5 displays an erosional and scoured contact with the underlying LF 2 rhythmites. LF 5 interdigitates vertically and to the south with planar bedded gravelly sand and sandy pebble gravel with a southerly shallowing dip, resulting in a reduction from 20° in the clinoforms to horizontal over a distance of 5 m. Repetitive bedding is observed in the dipping beds.
Figure 10. (a) Gravel clinoforms of LF 5 dipping at 20° from right to left and lying unconformably on LF 2 rhythmites and interdigitating vertically with planar bedded gravelly sand and sandy pebble gravel. (b) Stratigraphical and structural interpretation of panel a, location labelled on .
Lithofacies 6 (LF 6)
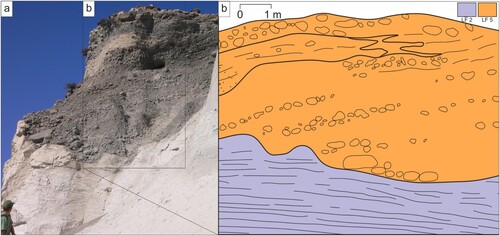
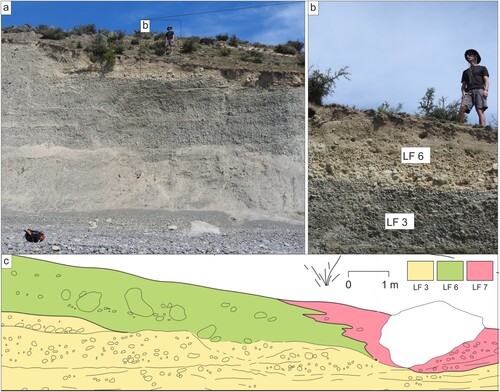
LF 6 comprises a discontinuous massive matrix-supported diamicton (Dmm) that outcrops only in the central section of the logged exposures (; (a,b)). It directly overlies both LF 3 and LF 4 in different parts of the section. The lower half is clast-supported cobbles and pebbles which fine upwards into a matrix-supported silty-sand. LF 6 is significant at this location in that in lies immediately north (up flow) of the clinoforms of LF 5 and overlies the stratified and clast-supported diamictons and matrix-supported gravels of LF 4, which have been sheared and attenuated, together with LFs 2 and 3, beneath LF 6 (area of melange in ; see below). There is a sharp contrast in colour between the cream colour of LF 6 and the grey gravels of LF 3 beneath.
Figure 11. Characteristics of LFs 6 and 7: (a) Stratigraphic overview of LF 6, which is located immediately below the ground surface in this view (indicated above white dashed line) and comprises a massive matrix-supported diamicton (Dmm) overlying LF 3; (b) Nature of the contact between LF 3 and LF 6; (c) Stratigraphical and structural interpretation of panel a, location labelled on .
Lithofacies 7 (LF 7)
LF 7 occurs at the top of the logged exposure and displays significant lateral variability (). LF 7 comprises a poorly sorted, matrix-supported boulder to cobble gravel with localized beds of cross-stratified sand. This passes upwards into a discontinuous layer of variable thickness that comprises clast-supported, poorly sorted gravel. In some places, lags of single-layered clasts lie unconformably at the junction between LF 7 and underlying lithofacies ( and (c)). These gravels are massive to crudely horizontally bedded and locally occupy cut and fill channels in older lithofacies ((a)). A clast form sample from LF 7 is characterized by an RA value of 2%, an RWR of 76% and a C40 of 28% ((b)).
Figure 12. (a) Boulder to cobble gravel of LF 7 and its relationship to LFs 2 and 5; (b) Clast form data from LF 7.
Geometry of contacts between lithofacies
In addition to the above seven lithofacies, sediments at the boundaries of some lithofacies have been modified to form melanges (sensu Cowan Citation1985; Evans Citation2018; cf. Hoffmann and Piotrowski Citation2001). Primary horizontal sedimentation of LF 1–4 is apparent in both their bedding details and broad architecture, which has been locally modified, especially near lithofacies boundaries, to tilt towards the north at dip angles of between 20° and 33° (). Melange horizons that occur at the boundaries between lithofacies ((a) and (c,d)) have been developed in a deformation zone that also dips northwards at similar angles. These compressional features record small vertical displacement by stress directed from the northeast.
Lithofacies and geometric interpretation
Lithofacies 1 (LF 1)
The co-variance plot of the C40/RA values () reveals that LF 1 is likely derived from glaciofluvial materials due to very few angular clasts. LF 1 is composed of abrupt vertical changes from boulder gravels to the laminated sediments typical of overbank fines or waning discharge drapes. These are interpreted to be the result of a rapidly accreting, horizontally bedded glaciofluvial outwash assemblage of gravel sheets, recording rapidly fluctuating discharges (c.f. Miall Citation1977, Citation1985; Collinson Citation1996). Matrix-supported gravels also record hyperconcentrated flows and intraformational soft sediment deformation structures are indicative of high porewater pressures in rapidly accreting deposits (c.f. Maizels Citation1989a, Citation1989b; Mulder and Alexander Citation2001; Carrivick et al. Citation2004). The localized soft sediment deformation structures appear to be related to loading and water escape.
Figure 13. Co-variance graph for RA and C40 value incorporating modern samples from Fox Glacier, collected by Brook and Lukas (Citation2012) and palaeo-data from formerly glaciated sites at the West Coast and Lake Pukaki (Evans et al. Citation2010, Citation2013). The C40 values appear unusually slabby compared to other glaciogenic sediments in New Zealand (e.g. Benn and Ballantyne Citation1994; Evans et al. Citation2010, Citation2013a, Citation2013b; Brook and Lukas, Citation2012; Lukas et al. Citation2013). The RWR values also appear elevated and the samples have exceedingly high roundness, indicating very rounded slabs.
Lithofacies 2 (LF 2)
The stratified gravel deposits of LF 1 have been winnowed to produce a clast lag and then draped by the thick rhythmite sequence of LF 2 ((a,b)), indicating that a slackwater environment replaced that of a glaciofluvial outwash surface. The rhythmites provide evidence that this is glaciolacustrine in nature. The abundance of lonestones or outsized clasts in the finer-grained rhythmites of LF 2 are interpreted as dropstones because the impact depressions beneath the clasts are evidence that they were not transported by the same water currents as the rhythmites but were dropped vertically through the water column. Similarly, the clast clusters, especially in the lower part of the rhythmite sequence, are interpreted as iceberg dump structures because the concentrated pockets of gravel indicate the break-up or overturning of sediment-laden icebergs and the consequent release of debris to the lake floor (Thomas and Connell Citation1985). These are indicative of an ice-marginal environment, or that ice was calving into this basin, although their rarity also suggests that icebergs were not numerous ((c,d); Smith and Ashley Citation1985; Thomas and Connell Citation1985; Carrivick and Tweed Citation2013). The majority of dropstones observed are rounded (e.g. (c)), which we interpret to indicate that they have been derived from material that was worked fluvially before incorporation in the glacial system, similar to those in the Tui Stream section in the Butler Downs of the Rangitata (Shulmeister et al. Citation2018). Alternations between relatively fine and coarse sets to form couplets is likely representative of cyclic sedimentation due to seasonal variability in glacier runoff, thereby likely constituting annual varves (Ashley Citation1975; Church and Gilbert Citation1975). Non-melt season (autumn/winter) and melt-season (spring/summer) laminae within a single varve are indicated as N-MS and MS respectively in (a). Together, these two layers form a varve couplet representing one year of sedimentation (Ojala et al. Citation2012). Modern sequences in Lake Tekapo (Pickrill and Irwin Citation1983) and in adjacent Lake Ohau have also been interpreted as varves (e.g. Roop et al. Citation2015, Citation2016; Cossu et al. Citation2016; Levy et al. Citation2018; Vandergoes et al. Citation2018).
A minimum number of 77 couplets or years of lake sedimentation is recorded in LF 2. The appreciable thicknesses of both the fine (winter) and coarse (summer) components of the LF 2 varve sequence, which are up to 5 and 11.25 (rarely 80) cm respectively, indicate high sedimentation rates, especially in summer, with prominent internal lamination in both components recording continuous pulses of sediment-laden meltwater into a glacier-fed, and at times glacier contact, lake. For comparison, sediments collected from the floor of Lake Tekapo indicate that historical varves, interpreted by Pickrill and Irwin (Citation1983) as deposited in the 1940s-1970s, are only 0.2-2.2 cm thick (LF 2 minima are 2.5 cm). Towards the northern end of the section, the lacustrine sediments are less well-developed as varves and there is also evidence of grading (fining upwards) and scouring, which may represent turbidite sequences. The thin, discontinuous, or horizontal laminae of coarse sandy silt with scoured infills at the base of the coarser sets are interpreted as evidence of rip-up intraclasts of finer rhythmite material and display rare clinoforms (starved ripples). Most of the rhythmically bedded sediment of LF 2 was likely delivered as interflows, although the scour infills at the base of the coarser sets, as well as evidence of rip up intraclasts, starved ripples and coarsening-upwards sequences in the lower few metres of LF 2, suggest the operation of underflows. Greater numbers of dropstones and other ice-rafted debris (IRD) in these lower sediments also indicate glacier proximity (early phases of lake development) and an ice-contact lake setting that promoted iceberg calving. However, low background sedimentation rates are represented in the lowest 3.5 m of the outcrop where the couplets are thinnest. This observation is notable since sedimentation should be greatest closest to the glacier and the dropstone evidence is strong for an ice-contact lake. The dropstones are also more heavily concentrated towards the southern end of the exposure indicating that this is a preferential zone for icebergs to accumulate. Widespread normal faults with small downthrow could relate to the melt-out of buried glacier ice (i.e. grounded icebergs) but also may have been initiated by sediment loading and subaqueous slumping. Either mechanism, as well as seismic activity, may be a possibility due to the evidence of contemporaneous liquification (e.g. (j)) and injection along fault planes (e.g. (c,d)).
Lithofacies 3 (LF 3)
A glaciofluvial origin is preferred for LF 3 based upon its poorly sorted and coarse-grained characteristics, in addition to the evidence for abrupt discharge changes recorded in discontinuous, lensate bodies of cross-bedded sands that grade upwards into the gravels. These packages of massive to crudely horizontally bedded sheets separated by lower discharge scour infills are typical of strongly episodic fluvial sedimentation, classified as gravel sheets by Miall (Citation1977) and Maizels (Citation1993). An abundance of rounded and well-rounded clasts represented by the very low RA values also support the interpretation that LF 3 is derived from glaciofluvial sediments (). As such, LF 3 is similar in origin to much of LF 1. Whilst it is also possible these sediments could have been deposited as sheet gravels, the consistently poorly sorted gravel of LF 3 is more similar to the matrix-supported gravel of hyperconcentrated flow type sedimentation rather than bar or gravel sheet aggradation and hence is indicative of glaciofluvial aggradation in an ice-proximal setting (Maizels Citation1993, Citation2002; Carrivick and Rushmer Citation2009). No bedding structures are observed within LF 3, indicating a high-energy mass flow deposit, such as a minor outburst flood (Pierson Citation2005), rather than braided river-type sedimentation. Similar sediment packages of LF 3 (hyperconcentrated flows) are described in the Rakaia, Pukaki and Rangitata valleys across South Island (Hyatt et al. Citation2012; Evans et al. Citation2013; Shulmeister et al. Citation2018). Although the bedding of LF 3 is largely horizontal over much of its outcrop, it is likely not in situ in most places in the exposure, having been emplaced between shallow thrust faults and also displaying significant disturbance in the form of crumpled bedding and normal faulting ((e)) where LF 3 has been thrust over LF 1. In at least one location (e.g. (e)), a clastic dyke containing crudely vertically stratified material from the host gravels penetrates through the entire thickness of LF 3, recording the post-depositional release of pressurized groundwater through the sediments (cf. Rijsdijk et al. Citation1999).
Lithofacies 4 (LF 4)
LF 4 records continued episodic fluvial sedimentation in interbedded stratified and locally clast-dominated diamictons and matrix-supported gravels. These sediments are indicative of sediment gravity flows and/or hyperconcentrated flows punctuated by the deposition of crudely horizontally bedded sand, typical of ice-proximal, episodic flooding (Miall Citation1978). Resulting hyperconcentrated flows scoured downwards into older lithofacies prior to sediment aggradation. Importantly, the abrupt change from horizontal bedding into shallow clinoforms in the central section of the logged exposure likely records a change from a braid plain to a more proximal fan setting (e.g. Krzyszkowski and Zieliński Citation2002) at a location where glaciotectonic disturbance becomes more intense (see below). Similar deglacial deposits occur in the Rakaia river basin (Shulmeister et al. Citation2010b) and at Lake Pukaki (Evans et al. Citation2013).
Lithofacies 5 (LF 5)
LF 5 clinoforms prograde south-easterly and possess the characteristics of gravel foreset bedding (Martini Citation1990; Nemec Citation1990; Nemec et al. Citation1999). Very similar proglacial delta deposits have been described from the Rangitata River basin (Shulmeister et al. Citation2018). South-easterly shallowing of the foreset bedding records proximal to distal fining over a scoured, unconformable contact with underlying LF 2. Progradation of the foresets in LF 5 appear to have been initiated from the southern limit of the melange at the contact between LF 2 and overlying LFs 3 and 4 as well as LF 6. The Type IV characteristics of the melange at this location indicate that it has been produced as a shear zone between LF 2 and LFs 3 and 4, developed on the footwall of a shallow thrust fault dipping northwards (rising southwards and indicating shearing from the north).
Lithofacies 6 (LF 6)
The occurrence of LF 6 immediately above an area of intense deformation and shallow angled shear zone between LFs 2, 3 and 4 (see area of melange in ), strongly suggests that the deposits were constructed during glacier overriding, likely in a sub-marginal location, as the diagnostic subglacial deposits (melange; described below and Dmm/LF 6) do not extend any further south of this location; moreover, the deltaic foresets also prograde from the southerly extent of the subglacial deposits and hence are interpreted here as a grounding line fan, similar to deposits in the Acheron Bank outcrop in the Rakaia River basin (Shulmeister et al. Citation2010b). This juxtaposition indicates discharge directly into water when the lake was deep at the time of infilling. LF 6 is, therefore, interpreted as glacier sub-marginal in origin, although cannot be unequivocally classified as subglacial till (sensu Evans et al. Citation2006; Evans Citation2018).
Lithofacies 7 (LF 7)
The final sediments laid down within the logged outcrop were the poorly sorted to matrix-supported boulder to cobble gravels and localized cross-stratified sands of LF 7. Exposures are too restricted to be confident of genetic detail. They could constitute final glaciofluvial outwash deposits and postglacial winnowed lags but due to the considerable lateral variability within the deposit and the irregular drape of LF 7 at a variety of levels along the outcrop, LF 7 is more likely to be a beach deposit given that the logged exposure is entirely below the postglacial lake highstand (740 m a.s.l; Sutherland et al. Citation2019a, Citation2019b). The palaeo-shoreline scarp shown in and as well as an array of beach forms clearly visible immediately west of the logged cliffs, suggests a widespread distribution of locally wave-washed LF 7 material. We suggest, therefore, that the palaeo shoreline has modified the glaciofluvial outwash cobbles and pebbles into well sorted, well-rounded raised beach deposits at various locations along the outcrop.
Structural properties and deformation interpretation
The shallow northward tilting and open folding within LF 1–4 bedding north of the central section, together with laterally extensive sheared contacts, localized internal thrust faults and tight polyclinal fold structures, record large scale glaciotectonic deformation. Associated with this glaciotectonic deformation was the emplacement of clastic dykes. Upward-tapering styles of largely stratified dyke emplacement have been widely linked to the escape of pressurized groundwater by hydrofracturing and the creation of burst-out structures, where gravelly aquifers are injected into overlying deposits either post- or syn-depositionally (Rijsdijk et al. Citation1999). The occurrence of burst-out structures and dykes at the northern end of the exposure ((a)) is compatible with an increase of water pressures in subglacial groundwater (Nichols et al. Citation1994; Boulton and Caban Citation1995; Le Heron and Etienne Citation2005) and thereby strongly suggests glacier sub-marginal to proglacial (glaciotectonic) origins for the shallow angled shear zones. The crudely stratified gravelly or fine-grained rhythmite infills of the downward-tapering forms are also likely derived from hydrofracturing driven by the de-pressurizing of aquifers, especially as they occur beyond the southern extent of the subglacial deposits and their associated glaciotectonic structures (Phillips et al. Citation2013a).
Chronological control of sedimentary events
Dating yielded SAR IRSL ages of 149.2 ± 23.8 and 118.0 ± 13.0 ka BP for samples T1 and T2 respectively (; locations labelled on ). Both ages suggest that deposition of the glaciolacustrine sequence in the logged outcrop is likely to have occurred during the MIS-6 (Waimea) glaciation (known as Balmoral 1 in the Mackenzie basin). Given the age of the glaciolacustrine sediments, their subsequent deformation could be entirely MIS 6 as well or could relate to MIS 4 or the LGM advance.
Table 2. Water contents and radionuclide contents.
Discussion
Reconstruction of glacial events in the Tekapo valley
The logged outcrop records an ice-marginal environment. Specifically, the sediments document a sequence of events from an advanced ice-margin position to recession, followed by a re-advance and recession. This sequence of events, summarized in , has been reconstructed using interpretations of LFs 1–7 and their internal structures as described above. Due to the nature of deformation, conformable contacts between lithofacies are mostly difficult to identify unequivocally. However, there is clearly a conformable contact between the boulder gravels of LF 1 and overlying LF 2 (glaciolacustrine rhythmites) and it is this that has been used to determine relative age in that part of the sequence. This contact is characterized by a clast lag that is draped by LF 2 rhythmites. Based on the very similar outcrops towards the south and to the north (, and ), the same depositional environments were laterally extensive, at least on the western side of the Tekapo valley, for >10 km.
In detail, we propose that the logged sedimentary sequence was deposited in two main phases; (i) the undisturbed varves (LF 2) represent very low-energy glaciolacustrine deposition that was uninterrupted for at least 77 years, and (ii) the glaciofluvial sediments (LFs 1, 3, 4, 5, 6, 7) represent ice-contact and ice-proximal outwash and subaerial mass flows. These two phases of the sequence are likely to have been deposited during separate glacial advances because of the unconformable contacts between them. Additionally, the glaciotectonic structures developed in the varves and glaciofluvial sediments (e.g. ) illustrate that the whole outcrop was disrupted and glacially overridden during either the emplacement of the glaciofluvial sediments (LFs 5 and 6) or after glaciofluvial deposition. We propose a five-stage idealized reconstruction of depositional events and glacier dynamics in the Tekapo valley (; ). We extrapolate this event reconstruction across the valley and so does not directly correspond to the sediment sequence observed.
Figure 14. Conceptual model to illustrate event stratigraphy. (HCF in legend = hyper-concentrated flow, SGF = sediment gravity flow).
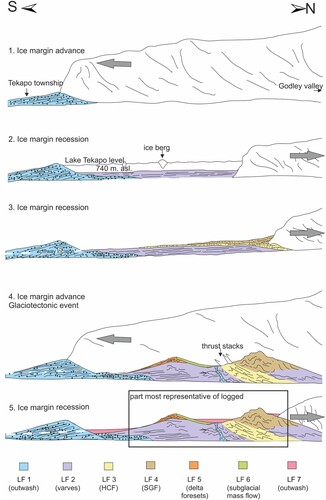
Stage 1: ice marginal advance
The glaciolacustrine sequence (LF 2) was deposited in an ice-contact proglacial lake due to the presence of dropstones and iceberg dump structures (). Therefore, since the glaciofluvial outwash gravels of LF 1 occur stratigraphically below LF 2, they record a glacier advance that preceded lake development (). A glacial advance and/or stillstand origin for the LF 1 outwash gravels, as proposed in many settings in New Zealand (cf. Rother et al. Citation2010; Shulmeister Citation2017; Thackray et al. Citation2021) is consistent with the deposition of lake sediments (LF 2) immediately above LF 1 and separated by a conformable contact comprising draped laminations over a clast lag. The clast lag represents winnowing by lake floor traction currents prior to the accumulation of glaciolacustrine rhythmites. The Rangitata kame terrace record reported by Thackray et al. (Citation2021) also documents this pattern of outwash timing. The folding within LF 1 could be a result of ice push shortly after deposition (i.e. in front of an advancing ice margin). However, we imply that LF 1 was completely overridden by ice during a later stage, evidenced by intense glaciotectonic deformation and clastic dykes.
Stage 2: ice marginal recession and development of an ice-contact proglacial lake
Subsequent glacial recession was initiated down an adverse slope (Sutherland et al. Citation2019a). A substantial dam is required to have created a relatively large and deep proglacial lake with water levels at least 20 m higher than today. The ice-contact lake was present for an extended period of time, as evidenced by the thick sequence of LF 2 glaciolacustrine sediments, and this suggests that the dam/adverse slope was created by an outwash head and terminal moraine that accumulated during Stage 1. Although there is no sedimentary evidence for this since the most southerly point on the log is comprised of glaciolacustrine sediments (LF 2), there is an arc of moraine and outwash deposits at the townsite to the south (; Sutherland et al. Citation2019a). Due to the over-deepened subglacial topography (Sutherland et al. Citation2019a), it follows that ice-proximal slopes of the outwash fan blocked proglacial drainage and produced a lacustrine sediment sink once the glacier terminus receded behind it (). The topography also explains the increased occurrence of soft-sediment deformation structures (high porewater pressures) and/or ice melt-out features in LF 2 (high debris content at the ice margin) in a sediment pile that accumulated rapidly until the dam was breached by over spilling lake water. This style of combined outwash-head and terminal moraine damming is commonly observed in modern New Zealand and Icelandic proglacial lakes (e.g. Benn et al. Citation2003; Evans et al. Citation2013; Evans and Orton Citation2015; Sutherland et al. Citation2019a).
Critical to the subaqueous interpretation of LF 2 are the characteristics of the glaciolacustrine sediments, which reflect rhythmic sedimentation by suspension settling, iceberg rafting of dropstones, and pulsed traction current activity. If the couplets observed in LF 2 are indeed varves, their numbers indicate that a minimum of 77 years of relatively distal lake sedimentation took place. In particular, the sedimentation rate was substantial and glaciolacustrine deposition was rapid, in an ice-proximal setting. Vertical and lateral variability in proximal versus distal glaciolacustrine sedimentation documents temporal and spatial changes in meltwater flux points and thereby ice-margin position. The changing landsystem imprint related to the recession of the modern Tasman Glacier since the Little Ice Age (Kirkbride and Warren Citation1999) provides an analogue of spatio-temporal landsystem change, whereby the glacier and its foreland have evolved from a coupled outwash head/moraine-dammed lake to an uncoupled landsystem (Benn et al. Citation2003; Evans et al. Citation2013).
Stage 3: continued ice marginal recession
After the drainage of the proglacial lake through a spillway incised into the outwash head, continued ice marginal recession resulted in the deposition of coarse-grained glaciofluvial deposits. There is no geomorphological imprint in the landscape for this spillway, however, evidence of iceberg meltout hollows (Sutherland et al. Citation2019b) immediately south of lake Alexandrina, reveal a possible drainage route. Some of these deposits were hyperconcentrated flows (LF 3) and sediment gravity flows (LF 4). These coarse-grained deposits can be envisaged to have been fed by meltwater emanating from subglacial portals on the receding ice margin. High-energy deposits such as LF 4 indicate that glacier proximity increases vertically up the stratigraphic succession in the logged outcrop.
Stage 4: ice marginal advance
Widespread glaciotectonic disturbance, in the form of folds, shear horizons and melanges (glaciotectonites), as well as the emplacement of clastic dykes (hydrofracture fills) all record a substantial glacier advance into the pre-existing LFs 1–4 ((b); (c); ). The shallow northward tilt and open folding of all bedding in LFs 1–4 north of the central section, together with sheared contacts and localized internal thrust faults and tight polyclinal fold structures, record thrust stacking by a glacier margin moving down the Lake Tekapo basin from the north. A genetic model to produce steeply inclined hydrofractures which ‘climb’ steeply and widen upwards through sediment piles has been proposed by Phillips et al. (Citation2013b). They suggest that pressurized water and then aquifer and host material are mobilized upwards and away from the overriding glacier margin due to the marked decrease in the overburden pressure in that direction. Certainly, the location and architecture of the downward tapering dykes and their associated parallel fault systems are compatible with such a scenario.
The grounding line fan (LF 5) was emplaced syn-depositonally with the till (LF 6) that overlies its proximal slope, and both were overrun by the advancing glacier margin responsible for prograding the fan directly from a subglacial environment (). A similar style of deposition during re-advances has been interpreted for the Rakaia basin (Shulmeister et al. Citation2010a).
Stage 5: final and sustained ice margin recession
The final and sustained recession of the Tekapo Glacier is recorded by the deposition of glaciofluvial outwash gravels (LF 7) that record the aggradation and subsequent terracing of glacier-fed outwash fans. These were fed by meltwater emanating from a glacier terminus occupying the Lake Tekapo valley to the north. Once recession was initiated, the ice surface level lowered and glaciofluvial gravels aggraded until they became abandoned and perched above the elevation of the still-receding meltwater portal (cf. Price Citation1969; Gustavson and Boothroyd Citation1987). Subsequently, glaciofluvial sediments partially filled the depressions between, and channels incised through, the surface expression (undulations or ridges) of the pre-existing glaciotectonic structures (cf. Phillips et al. Citation2002, Citation2008).
Geochronological implications
SAR IRSL yielded ages of 149.2 ± 23.8 and 118.0 ± 13.0 ka BP for samples T1 and T2 respectively (; ). Both ages suggest that deposition of the glaciolacustrine sequence in the logged outcrop is likely to have occurred during MIS-6 (the Waimea glaciation, known as Balmoral 1 in the Mackenzie basin). There is, however, considerable uncertainty in the absolute ages due to anomalous fading and unidentified incompletely bleached signals. It is clear, however, that the sediments pre-date the LGM and are more likely related to either MIS-6 or 4. In particular, with respect to MIS-4 possibilities, there are deposits that have been dated by terrestrial cosmogenic nuclide (TCN) analysis immediately to the south (Pukaki valley; Schaefer et al. Citation2015) and by optically stimulated luminescence (OSL) to the north (Rangitata drainage; Thackray et al. Citation2021) of the Tekapo basin recording the MIS-4 glacial maximum nearby. Given the age of the glaciolacustrine sediments, their subsequent deformation could have occurred entirely within MIS-6 as well or could relate to MIS-4 or the LGM advance. Therefore, since the glaciofluvial outwash gravels of LF 1 occur stratigraphically below LF 2, they record a glacier advance that preceded lake development, likely also during MIS-6 ().
Table 3. Measured a-value and equivalent dose, total dose rate and luminescence age.
LGM landforms have been mapped in the Tekapo valley (Barrell et al. Citation2011; Sutherland et al. Citation2019b) based on relative morphostratigraphic correlations with landforms surrounding adjacent Lakes Pukaki and Ohau. However, the exposed sections do not include sediments that are represented by the surficial geomorphology. In particular, the glaciolacustrine sediments of LF 2 do not relate to the landforms stratigraphically above them. These sediments were not deposited by the ice advances that shaped the surficial landforms and by that inference, must be older. The sedimentary volume associated with LGM landforms must be comparatively small, as the last glacial deposits are draped over much thicker pre-LGM sediments which survived in-situ in the foreland valley. The key point is not the absolute ages but that LF 2, and therefore, the deposits stratigraphically higher, are pre-LGM, preserved in substantive volumes despite later LGM ice occupying the area. Hence it is clear that the LGM Tekapo Glacier did not completely remove older sediments beneath the most distal 5 km of its terminus, at least some of the sediment infill in the lower Tekapo valley was deposited during the penultimate glacial cycle (MIS-6). The study highlights the limited erosion of older glacial deposits, supported in part by MIS-6 ages for the glaciolacustrine deposits and the rare preservation of such thick sequence of varves with minimal weathering in the New Zealand glacial record.
Recognition of the in-situ survival of extensive pre-LGM glacial sediment does not represent a new feature in the Quaternary stratigraphy of the Southern Alps. Moreover, the findings from this study are consistent with sediment fills recorded elsewhere across South Island. Extensive suites of pre-LGM sediments dated by IRSL have also been recovered from moraines in the Takaka valley, northwest Nelson (Thackray et al. Citation2009), from the Cascade Plateau in Fiordland (Sutherland et al. Citation2007), and across north Canterbury, such as the Hope valley (Rother et al. Citation2010), the Rakaia river (Shulmeister et al. Citation2010b; Hyatt et al. Citation2012), and the Potts valley in the Rangitata River basin (Evans Citation2008). It is now widely accepted that pre-last glacial cycle advances extended further down-valley than LGM glaciers and Rother et al. (Citation2010) also find that the older glacial sequences, in particular those of the MIS-6 glaciation, were considerably more voluminous than those deposited more recently. In the Hope valley (Rother et al. Citation2010) and in the Rakaia River basin (Shulmeister Citation2017; Shulmeister et al. Citation2019), ice did not excavate the underlying glaciolacustrine sediments and furthermore was not erosive enough to recycle its own outwash (cf. Rother et al. Citation2007).
Conclusion
The sedimentary outcrop along the southwestern shores of Late Tekapo has provided rare insight into the behaviour of a terrestrial outlet of the Southern Alps icefield over multiple glacial cycles. It has provided the opportunity to reconstruct the depositional environment and glaciotectonic disturbance associated with advances of the former Tekapo Glacier. We have presented the first detailed sedimentological investigation of the sequence and we propose a five-stage palaeo-glaciological model in which 7 lithofacies were deposited; (i) ice-margin advance and deposition of outwash gravels (LF 1); (ii) ice-marginal recession and the development of an ice-contact lake, manifest in rhythmite deposition by suspension setting and iceberg rafting of dropstones (LF 2); (iii) continued ice-marginal recession after lake drainage, recorded in ice-proximal aggradation of glaciofluvial deposits (LFs 3 and 4); (iv) major ice-marginal advance documented by glaciotectonic disturbance and localized hydrofracturing, coeval with the deposition of delta foresets and till (LF 5 and 6); (v) final stages of ice-marginal recession and deposition of outwash gravels in LF 7.
Further independent age control is critical to robust palaeo-glaciological interpretations. However, given their stratigraphic position, the glaciolacustrine silts in LF 2 are likely to be older than the current lake and the most recent glacial advances. Although LGM landforms have been documented in the Tekapo valley (Barrell et al. Citation2011; Sutherland et al. Citation2019b), our study shows that their sedimentary volume is relatively small in comparison to more substantial pre-LGM glacial deposits (e.g. LF 2) which survived in-situ, and largely unmodified, and thereby reduced the accommodation space in the valley overdeepening. Varves are deposited below wave depth and the bottom sediments preserved in this sequence lie well above the modern-day lake basin. This implies that; (i) lakes recur in the same location and (ii) there is significant landscape modification from successive glaciations which have dug out the sediments and allowed the outlet river from Lake Tekapo to incise further. The same assumptions hold true for other localities across South Island, particularly visible in the Rakaia, while the Rangitata shows that if the deposit is away from the thalweg of the valley, preservation is also likely.
Whilst the preservation and minimal weathering of such a thick sequence of rhythmites in the glacial record may be remarkable elsewhere, our sedimentological findings are not unique in the context of the glacial literature from New Zealand (e.g. Shulmeister et al. Citation2010b; Evans et al. Citation2013). Our study emphasizes and reiterates the uniqueness of the New Zealand glacial systems and the need to view those systems through a distinct lens. Glaciations were times of multiple, repeated advances, but the logged section in the Tekapo valley reveals limited erosion of older glacial deposits. This suggests that either (i) LGM deposition was minimal, or (ii) there was limited erosive capacity near maximum LGM glacial extents, perhaps because ice was thin and short-lived. Overall, our findings support the increasing evidence of the persistence of the extensive pre-LGM sediments in the Quaternary stratigraphy of the Southern Alps. These findings are important to consider when applying a landsystems approach to glacial reconstructions in New Zealand.
Acknowledgements
Ningsheng Wang from Victoria University Dating Laboratory (Wellington, New Zealand), is thanked for preparing and analysing the luminescence samples. Olivia Hyatt, William James, Pippa Chapman, and Fiona Tweed are thanked for their assistance in the field. JLS thanks Ann Rowan for helpful discussions.
Disclosure statement
No potential conflict of interest was reported by the author(s).
Additional information
Funding
Notes on contributors
Jenna L. Sutherland
Jenna L. Sutherland has interests in mountain glacial systems and works on the influence of proglacial lakes on glacier evolution.
David J. A. Evans
David J. A. Evans is a glacial geomorphologist and has a research focus which lies at the interface of glacial geology and Quaternary Science, concentrating specifically on the reconstruction of former glaciers and ice sheets through time.
Jonathan L. Carrivick
Jonathan L. Carrivick has a research focus on earth surface processes and landforms in polar, arctic and alpine environments. He especially focuses on the processes and products of glacial outburst floods or ‘jökulhlaups'.
James Shulmeister
James Shulmeister has research interests in glacial geology and geochronological investigations of the timing, extent and nature of Southern Hemisphere glaciations as well as broader interests in climate change across the South West Pacific.
Henrik Rother
Henrik Rother is a Quaternary geologist. His skills and expertise span glacial geology, geomorphology, sedimentology and stratigraphy.
References
- Ashley GM. 1975. Rhythmic sedimentation in glacial lake Hitchcock, Massachusetts-Connecticut. In: Jopling AV, McDonald BC, editors. Glacio-fluvial and glaciolacustrine sedimentation. Vol. 23. Tulsa (Oklahoma): Society of Economic Palaeontologists and Mineralogists Special 2; p. 304–320.
- Barrell DJ, Read SA. 2014. The deglaciation of Lake Pukaki, South Island, New Zealand – a review. New Zealand J Geol Geophys. 57(1):86–101.
- Barrell DJA. 2011. Quaternary glaciers of New Zealand. In: Ehlers J, Gibbard PL, Hughes PD, editors. Quaternary glaciations – extent and chronology: a closer look. Developments in quaternary science, vol. 15. Amsterdam: Elsevier; p. 1047–1064.
- Barrell DJA, Anderson BG, Denton GH. 2011. Glacial geomorphology of the central South Island, New Zealand. In: GNS science monograph. 5 maps, and legend. Vol. 27. Lower Hutt (New Zealand): Institute of Geological and Nuclear Sciences Ltd; p. 81.
- Benn DI. 2004. Clast morphology. In: Evans DJA, Benn DI, editors. A practical guide to the study of glacial sediments. London: Edward Arnold; p. 77–92.
- Benn DI, Ballantyne CK. 1994. Reconstructing the transport history of glaciogenic sediments – a new approach based on the co-variance of clast form indexes. Sediment Geol. 91(1–4):215–227.
- Benn DI, Evans DJA. 1998. Glaciers and glaciation. London: Arnold. 734 p.
- Benn DI, Kirkbride MP, Owen LA, Brazier V. 2003. Glaciated valley landsystems. In: Evans D.J.A, editor. Glacial landsystems. London: Arnold; p. 372–406.
- Bennett MR, Huddart D, Thomas GS. 2002. Facies architecture within a regional glaciolacustrine basin: copper river, Alaska. Quat Sci Rev. 21(20-22):2237–2279.
- Bentley M. 1996. The role of lakes in moraine formation, Chilean lake district. Earth Surf Process Landforms. 21(6):493–507.
- Boulton GS, Caban P. 1995. Groundwater flow beneath ice sheets: part II – its impact on glacier tectonic structures and moraine formation. Quat Sci Rev. 14(6):563–587.
- Boulton GS, Dongelmans P, Punkari M, Broadgate M. 2001. Palaeoglaciology of an ice sheet through a glacial cycle: the European ice sheet through the Weichselian. Quat Sci Rev. 20(4):591–625.
- Brook MS, Lukas S. 2012. A revised approach to discriminating sediment transport histories in glacigenic sediments in a temperate alpine environment: a case study from Fox Glacier, New Zealand. Earth Surf Processes Landforms. 37(8):895–900.
- Carrivick JL, James WH, Grimes M, Sutherland JL, Lorrey AM. 2020a. Ice thickness and volume changes across the Southern Alps, New Zealand, from the little ice age to present. Sci Rep. 10(1):1–10.
- Carrivick JL, Rushmer EL. 2009. Inter-and intra-catchment variations in proglacial geomorphology: an example from Franz Josef Glacier and Fox Glacier, New Zealand. Arct Antarct Alp Res. 41(1):18–36.
- Carrivick JL, Russell AJ, Tweed FS, Twigg D. 2004. Palaeohydrology and sedimentary impacts of jökulhlaups from Kverkfjöll, Iceland. Sediment Geol. 172(1-2):19–40.
- Carrivick JL, Tweed FS. 2013. Proglacial lakes: character, behaviour and geological importance. Quat Sci Rev. 78:34–52.
- Chetwin E. 1998. Active faulting and subsurface structure in the Mackenzie basin: an investigation using gravity and seismics. Unpublished BSc (Hons) thesis, Victoria University of Wellington, Wellington, New Zealand.
- Church M, Gilbert R. 1975. Proglacial fluvial and lacustrine environments.
- Clark CD. 1997. Reconstructing the evolutionary dynamics of former ice sheets using multi-temporal evidence, remote sensing and GIS. Quat Sci Rev. 16(9):1067–1092.
- Clark CD, Ely JC, Greenwood SL, Hughes AL, Meehan R, Barr ID, Bateman MD, Bradwell T, Doole J, Evans DJA, Jordan CJ. 2018. BRITICE glacial Map, version 2: a map and GIS database of glacial landforms of the last British–Irish Ice sheet. Boreas. 47(1):11–e8.
- Clark PU, Dyke AS, Shakun JD, Carlson AE, Clark J, Wohlfarth B, Mitrovica JX, Hostetler SW, McCabe AM. 2009. The last glacial maximum. Science. 325(5941):710–714.
- Collinson JD. 1996. Alluvial sediments. In, Reading, H. G. (ed). Sedimentary environments: processes, facies and stratigraphy.
- Cossu R, Forrest AL, Roop HA, Dunbar GB, Vandergoes MJ, Levy RH, Stumpner P, Schladow SG. 2016. Seasonal variability in turbidity currents in Lake Ohau, New Zealand, and their influence on sedimentation. Mar Freshw Res. 67(11):1725–1739.
- Cowan DS. 1985. Structural styles in mesozoic and cenozoic mélanges in the western Cordillera of North America. Geol Soc Am Bull. 96(4):451–462.
- Cox S, Barrel DJA. 2007. Geology of the Aoraki area, Institute of Geological and Nuclear Sciences 1: 250000 Geological Map. Lower Hutt, New Zealand (GNS Science), 71.
- Darvill CM, Bentley MJ, Stokes CR, Shulmeister J. 2016. The timing and cause of glacial advances in the southern mid-latitudes during the last glacial cycle based on a synthesis of exposure ages from Patagonia and New Zealand. Quat Sci Rev. 149:200–214.
- Doughty AM, Anderson BM, Mackintosh AN, Kaplan MR, Vandergoes MJ, Barrell DJ, Denton GH, Schaefer JM, Chinn TJ, Putnam AE. 2013. Evaluation of lateglacial temperatures in the Southern Alps of New Zealand based on glacier modelling at Irishman Stream, Ben Ohau Range. Quat Sci Rev. 74:160–169.
- Doughty AM, Schaefer JM, Putnam AE, Denton GH, Kaplan MR, Barrell DJ, Andersen BG, Kelley SE, Finkel RC, Schwartz R. 2015. Mismatch of glacier extent and summer insolation in Southern Hemisphere mid-latitudes. Geology. 43(5):407–410.
- Ely JC, Clark CD, Hindmarsh RC, Hughes AL, Greenwood SL, Bradley SL, Gasson E, Gregoire L, Gandy N, Stokes CR, Small D. 2021. Recent progress on combining geomorphological and geochronological data with ice sheet modelling, demonstrated using the last British–Irish ice sheet. J Quat Sci. 36(5):946–960.
- Evans DJA. 2003. Ice-marginal terrestrial landsystems: active temperate glacier margins. In: D.J.A. Evans, editor. Glacial landsystems. London: Arnold; p. 12–43.
- Evans DJA. 2013a. Glacial landsystems. In: Elias SA, Mock C, editors. Encyclopedia of quaternary science. Oxford: Elsevier; p. 813–824.
- Evans DJA. 2013b. The glacial and periglacial research – geomorphology and retreating glaciers. In: J. Shroder, R. Giardino, J. Harbor, editor. Treatise on geomorphology, vol. 8, glacial and periglacial geomorphology. San Diego, CA: Academic Press; p. 460–478.
- Evans DJA. 2018. Till – a glacial process sedimentology. Chichester: Wiley-Blackwell.
- Evans DJA, Benn DI. 2004. A practical guide to the study of glacial sediments. London: Hodder Education.
- Evans DJA, Livingstone SJ, Vieli A, Ó Cofaigh C. 2009. The palaeoglaciology of the central sector of the British and Irish ice sheet: reconciling glacial geomorphology and preliminary ice sheet modelling. Quat Sci Rev. 28(7-8):739–757.
- Evans DJA, Orton C. 2015. Heinabergsjökull and Skalafellsjökull, Iceland: active temperate piedmont lobe and outwash head glacial landsystem. J Maps. 11(3):415–431.
- Evans DJA, Phillips ER, Hiemstra JF, Auton CA. 2006. Subglacial till: formation, sedimentary characteristics and classification. Earth Sci Rev. 78(1-2):115–176.
- Evans DJA, Rother H, Hyatt OM, Shulmeister J. 2013. The glacial sedimentology and geomorphological evolution of an outwash head/moraine-dammed lake, South Island, New Zealand. Sediment Geol. 284:45–75.
- Evans DJA, Shulmeister J, Hyatt O. 2010. Sedimentology of latero-frontal moraines and fans on the west coast of South Island, New Zealand. Quat Sci Rev. 29(27-28):3790–3811.
- Evans MD. 2008. A geomorphological and sedimentological investigation into the glacial deposits of the Lake Clearwater Basin, Mid Canterbury, New Zealand [Master Thesis in Geology]. University of Canterbury, Geological Sciences. https://ir.canterbury.ac.nz/handle/10092/1531
- Eyles N, Eyles CH, Miall AD. 1983. Lithofacies types and vertical profile models; an alternative approach to the description and environmental interpretation of glacial diamict and diamictite sequences. Sedimentology. 30(3):393–410.
- Fox AN. 1987. The neotectonics history of the Lake Tekapo region, MacKenzie Basin, New Zealand. Unpublished MSc thesis, University of Canterbury, Christchurch, New Zealand.
- Gage M. 1965. Some characteristics of Pleistocene cold climates in New Zealand. Trans Royal Soc New Zealand Geol. 3(2):11.
- Gage M. 1975. Glacial lakes. New Zealand lakes. Auckland: Auckland University Press; p. 57–69.
- Gair HS. 1967. The question of post-Rangitata Peneplantation in New Zealand. An investigation of Cretaceous peneplanation in relation to unconformities in Upper Jurassic and Cretaceous sequences. Unpublished PhD dissertation lodged in the Library, University of Canterbury, Christchurch, New Zealand.
- Gustavson TC, Boothroyd JC. 1987. A depositional model for outwash, sediment sources, and hydrologic characteristics, Malaspina Glacier, Alaska: a modern analog of the southeastern margin of the Laurentide Ice Sheet. Geol Soc Am Bull. 99(2):187–200.
- Hambrey MJ, Ehrmann W. 2004. Modification of sediment characteristics during glacial transport in high-alpine catchments: Mount Cook area, New Zealand. Boreas. 33(4):300–318.
- Hambrey MJ, Glasser NF. 2012. Discriminating glacier thermal and dynamic regimes in the sedimentary record. Sediment Geol. 251:1–33.
- Hart JK. 1996. Proglacial glaciotectonic deformation associated with glaciolacustrine sedimentation, Lake Pukaki, New Zealand. J Quat Sci. 11(2):149–160.
- Hoffmann K, Piotrowski JA. 2001. Till melange at Amsdorf, central Germany: sediment erosion, transport and deposition in a complex, soft-bedded subglacial system. Sediment Geol. 140(3-4):215–234.
- Hubbard A, Bradwell T, Golledge N, Hall A, Patton H, Sugden D, Cooper R, Stoker M. 2009. Dynamic cycles, ice streams and their impact on the extent, chronology and deglaciation of the British–Irish ice sheet. Quat Sci Rev. 28(7-8):758–776.
- Hubbard B, Glasser NF. 2005. Field techniques in glaciology and glacial geomorphology. Chichester: John Wiley & Sons.
- Hugonnet R, McNabb R, Berthier E, Menounos B, Nuth C, Girod L, Farinotti D, Huss M, Dussaillant I, Brun F, Kaeaeb A. 2021. Accelerated global glacier mass loss in the early twenty-first century. Nature. doi:10.1038/s41586-021-03436-z.
- Hyatt OM, Shulmeister J, Evans DJA, Thackray GD, Rieser U. 2012. Sedimentology of a debris-rich, perhumid valley glacier margin in the Rakaia Valley, South Island, New Zealand. J Quat Sci. 27(7):699–712.
- James WH, Carrivick JL, Quincey DJ, Glasser NF. 2019. A geomorphology based reconstruction of ice volume distribution at the Last Glacial Maximum across the Southern Alps of New Zealand. Quat Sci Rev. 219:20–35.
- Kaplan MR, Schaefer JM, Denton GH, Barrell DJ, Chinn TJ, Putnam AE, Andersen BG, Finkel RC, Schwartz R, Doughty AM. 2010. Glacier retreat in New Zealand during the Younger Dryas stadial. Nature. 467(7312):194.
- Kaplan MR, Schaefer JM, Denton GH, Doughty AM, Barrell DJ, Chinn TJ, Putnam AE, Andersen BG, Mackintosh A, Finkel RC, Schwartz R. 2013. The anatomy of long-term warming since 15 ka in New Zealand based on net glacier snowline rise. Geology. 41(8):887–890.
- Kelley SE, Kaplan MR, Schaefer JM, Andersen BG, Barrell DJ, Putnam AE, Denton GH, Schwartz R, Finkel RC, Doughty AM. 2014. High-precision 10Be chronology of moraines in the Southern Alps indicates synchronous cooling in Antarctica and New Zealand 42,000 years ago. Earth Planet Sci Lett. 405:194–206.
- Kirkbride MP. 1993. The temporal significance of transitions from melting to calving termini at glaciers in the central Southern Alps of New Zealand. The Holocene. 3(3):232–240.
- Kirkbride MP, Warren CR. 1999. Tasman Glacier, New Zealand: 20th-century thinning and predicted calving retreat. Global Planet Change. 22(1–4):11–28.
- Kleffmann S. 1999. Crustal structure studies of a transpressional plate boundary – the central South Island of New Zealand. Unpublished PhD thesis, Victoria University of Wellington, Wellington, New Zealand.
- Krzyszkowski D, Zieliński T. 2002. The Pleistocene end moraine fans: controls on their sedimentation and location. Sediment Geol. 149(1-3):73–92.
- Langridge RM, Ries WF, Litchfield NJ, Villamor P, Van Dissen RJ, Barrell DJA, Rattenbury MS, Heron DW, Haubrock S, Townsend DB, et al. 2016. The New Zealand active faults database. New Zealand J Geol Geop. 59(1):86–96.
- Le Heron DP, Etienne JL. 2005. A complex subglacial clastic dyke swarm, Sólheimajökull, southern Iceland. Sediment Geol. 181(1-2):25–37.
- Levy RH, Dunbar G, Vandergoes M, Howarth JD, Kingan T, Pyne AR, Brotherston G, Clarke M, Dagg B, Hill M, Kenton E. 2018. A high-resolution climate record spanning the past 17 000 years recovered from Lake Ohau, South Island, New Zealand. Scientific Drilling.
- Lukas S, Benn DI, Boston CM, Brook M, Coray S, Evans DJA, Graf A, Kellerer-Pirklbauer A, Kirkbride MP, Krabbendam M, et al. 2013. Clast shape analysis and clast transport paths in glacial environments: a critical review of methods and the role of lithology. Earth Sci Rev. 121:96–116.
- Mager S, Fitzsimons S. 2007. Formation of glaciolacustrine Late Pleistocene end moraines in the Tasman valley, New Zealand. Quat Sci Rev. 26(5-6):743–758.
- Maizels J. 1989a. Sedimentology, paleoflow dynamics and flood history of jokulhlaup deposits; paleohydrology of Holocene sediment sequences in southern Iceland sandur deposits. J Sediment Res. 59(2):204–223.
- Maizels J. 1989b. Sedimentology and palaeohydrology of Holocene flood deposits in front of a jokulhlaup glacier, south Iceland. Floods. 1989:239–251.
- Maizels J. 1993. Lithofacies variations within sandur deposits: the role of runoff regime, flow dynamics and sediment supply characteristics. Sediment Geol. 85(1-4):299–325.
- Maizels J. 2002. Sediments and landforms of modern proglacial terrestrial environments. In: Menzies J, editor. Modern and past glacial environments. Oxford: Butterworth-Heinemann; p. 279–316.
- Martini IP. 1990. Pleistocene glacial fan deltas in southern Ontario, Canada. In: Colella A, Prior DB, editors. Coarse-grained deltas. Oxford: Blackwell; p. 281–295.
- Miall AD. 1977. A review of the braided-river depositional environment. Earth Sci Rev. 13(1):1–62.
- Miall AD. 1978. Lithofacies types and vertical profile models in braided river deposits: a summary. In: Miall AD, editor. Fluvial sedimentology. Canadian Society of Petroleum Geologists Memoir 5; p. 597–604.
- Miall AD. 1985. Architectural-element analysis: a new method of facies analysis applied to fluvial deposits. Earth Sci Rev. 22(4):261–308.
- Mountjoy JJ, Wang X, Woelz S, Fitzsimons S, Howarth JD, Orpin AR, Power W. 2019. Tsunami hazard from lacustrine mass wasting in Lake Tekapo, New Zealand. Geol Soc. 477(1):413–426.
- Mulder T, Alexander J. 2001. The physical character of subaqueous sedimentary density flows and their deposits. Sedimentology. 48(2):269–299.
- Nemec W. 1990. Aspects of sediment movement on steep delta slopes. Coarse Grained Deltas. 10:29–73.
- Nemec W, Lφnne I, Blikra LH. 1999. The Kregnes moraine in Gauldalen, west-central Norway: anatomy of a Younger Dryas proglacial delta in a palaeofjord basin. Boreas. 28(4):454–476.
- Nichols RJ, Sparks RSJ, Wilson CJN. 1994. Experimental studies of the fluidization of layered sediments and the formation of fluid escape structures. Sedimentology. 41(2):233–253.
- Ojala AEK, Francus P, Zolitschka B, Besonen M, Lamoureux SF. 2012. Characteristics of sedimentary varve chronologies – a review. Quat Sci Rev. 43:45–60.
- Phillips E, Everest J, Reeves H. 2013b. Micromorphological evidence for subglacial multiphase sedimentation and deformation during overpressurized fluid flow associated with hydrofracturing. Boreas. 42(2):395–427.
- Phillips E, Lipka E, van der Meer JJ. 2013a. Micromorphological evidence of liquefaction, injection and sediment deposition during basal sliding of glaciers. Quat Sci Rev. 81:114–137.
- Phillips ER, Evans DJA, Auton CA. 2002. Polyphase deformation at an oscillating ice margin following the Loch Lomond Readvance, central Scotland, UK. Sediment Geol. 149:157–182.
- Phillips ER, Lee JR, Burke HF. 2008. Progressive proglacial to subglacial deformation and syntectonic sedimentation at the margins of the Mid-Pleistocene British ice sheet: evidence from north Norfolk, UK. Quat Sci Rev. 27:1848–1871.
- Pickrill RA, Irwin J. 1983. Sedimentation in a deep glacier-fed lake – Lake Tekapo, New Zealand. Sedimentology. 30(1):63–75.
- Pierson TC. 2005. Hyperconcentrated flow – transitional process between water flow and debris flow. In: Jakob M, Hungr O, editors. Debris-flow hazards and related phenomena. Berlin: Springer; p. 159–202.
- Price RJ. 1969. Moraines, sandar, kames and eskers near Breiðamerkurjökull, Iceland. Trans Inst British Geogr. 46:17–43.
- Putnam AE, Denton GH, Schaefer JM, Barrell DJ, Andersen BG, Finkel RC, Schwartz R, Doughty AM, Kaplan MR, Schlüchter C. 2010. Glacier advance in southern middle-latitudes during the Antarctic Cold Reversal. Nat Geosci. 3(10):700.
- Putnam AE, Schaefer JM, Denton GH, Barrell DJ, Andersen BG, Koffman TN, Rowan AV, Finkel RC, Rood DH, Schwartz R, et al. 2013a. Warming and glacier recession in the Rakaia valley, Southern Alps of New Zealand, during Heinrich Stadial 1. Earth Planet Sci Lett. 382:98–110.
- Putnam AE, Schaefer JM, Denton GH, Barrell DJ, Birkel SD, Andersen BG, Kaplan MR, Finkel RC, Schwartz R, Doughty AM. 2013b. The last glacial maximum at 44o S documented by a 10Be moraine chronology at Lake Ohau, Southern Alps of New Zealand. Quat Sci Rev. 62:114–141.
- Rijsdijk KF, Owen G, Warren WP, McCarroll D, van der Meer JJ. 1999. Clastic dykes in over-consolidated tills: evidence for subglacial hydrofracturing at Killiney Bay, eastern Ireland. Sediment Geol. 129(1-2):111–126.
- Roop HA, Dunbar GB, Levy R, Vandergoes MJ, Forrest AL, Walker SL, Purdie J, Upton P, Whinney J. 2015. Seasonal controls on sediment transport and deposition in Lake Ohau, South Island, New Zealand: implications for a high-resolution Holocene palaeoclimate reconstruction. Sedimentology. 62(3):826–844.
- Roop HA, Levy R, Dunbar GB, Vandergoes MJ, Howarth J, Fitzsimons S, Moon HS, Zammit C, Ditchburn R, Baisden T, Yoon HI. 2016. A hydroclimate-proxy model based on sedimentary facies in an annually laminated sequence from Lake Ohau, South Island, New Zealand. J Paleolimnol. 55(1):1–16.
- Rother H, Jol HM, Shulmeister J. 2007. Stratigraphy and tectonic implications of late Pleistocene valley fill in the Hope Valley, Canterbury, South Island, New Zealand. Geol Soc Am. 432:155.
- Rother H, Shulmeister J, Rieser U. 2010. Stratigraphy, optical dating chronology (IRSL) and depositional model of pre-LGM glacial deposits in the Hope valley, New Zealand. Quat Sci Rev. 29(3-4):576–592.
- Schaefer JM, Denton GH, Kaplan M, Putnam A, Finkel RC, Barrell DJ, Andersen BG, Schwartz R, Mackintosh A, Chinn T, Schlüchter C. 2009. High-frequency Holocene glacier fluctuations in New Zealand differ from the northern signature. Science. 324(5927):622–625.
- Schaefer JM, Putnam AE, Denton GH, Kaplan MR, Birkel S, Doughty AM, Kelley S, Barrell DJ, Finkel RC, Winckler G, Anderson RF. 2015. The southern glacial maximum 65,000 years ago and its unfinished termination. Quat Sci Rev. 114:52–60.
- Shulmeister J. 2017. Blowing on the west wind. The latest Quaternary glaciation of New Zealand. chapter 5 in landscape and Quaternary environmental change in New Zealand. In: J. Shulmeister, editor. Part of the developments in quaternary science series. Paris: Atlantic Press-Springer; p. 171–204.
- Shulmeister J, Davies TR, Evans DJA, Hyatt OM, Tovar DS. 2009. Catastrophic landslides, glacier behaviour and moraine formation – a view from an active plate margin. Quat Sci Rev. 28(11-12):1085–1096.
- Shulmeister J, Fink D, Hyatt OM, Thackray GD, Rother H. 2010a. Cosmogenic 10Be and 26Al exposure ages of moraines in the Rakaia Valley, New Zealand and the nature of the last termination in New Zealand glacial systems. Earth Planet Sci Lett. 297(3-4):558–566.
- Shulmeister J, Thackray GD, Rieser U, Hyatt OM, Rother H, Smart CC, Evans DJA. 2010b. The stratigraphy, timing and climatic implications of glaciolacustrine deposits in the middle Rakaia Valley, South Island, New Zealand. Quat Sci Rev. 29(17-18):2362–2381.
- Shulmeister J, Thackray GD, Rittenour TM, Fink D, Patton NR. 2019. The timing and nature of the last glacial cycle in New Zealand. Quat Sci Rev. 206:1–20.
- Shulmeister J, Thackray GD, Rittenour TM, Hyatt OM. 2018. Multiple glacial advances in the Rangitata Valley, South Island, New Zealand, imply roles for Southern Hemisphere westerlies and summer insolation in MIS 3 glacial advances. Quat Res. 89(2):375–393.
- Smith ND, Ashley G. 1985. Proglacial lacustrine environment.
- Soons JM. 1963. The glacial sequence in part of the Rakaia Valley, Canterbury, New Zealand. New Zealand J Geol Geophys. 6(5):735–756.
- Speight R. 1926. Varved glacial silts from the Rakaia valley. Rec Canterb Mus. 3:55–82.
- Strand PD, Schaefer JM, Putnam AE, Denton GH, Barrell DJ, Koffman TN, Schwartz R. 2019. Millennial-scale pulsebeat of glaciation in the Southern Alps of New Zealand. Quat Sci Rev. 220:165–177.
- Suggate RP. 1990. Late pliocene and quaternary glaciations of New Zealand. Quat Sci Rev. 9(2-3):175–197.
- Sutherland JL, Carrivick JL, Evans DJA, Shulmeister J, Quincey DJ. 2019b. The Tekapo Glacier, New Zealand, during the Last Glacial Maximum: An active temperate glacier influenced by intermittent surge activity. Geomorphology. 343:183–210.
- Sutherland JL, Carrivick JL, Shulmeister J, Quincey DJ, James WH. 2019a. Ice-contact proglacial lakes associated with the Last Glacial Maximum across the Southern Alps, New Zealand. Quat Sci Rev. 213:67–92.
- Sutherland R, Kim K, Zondervan A, McSaveney M. 2007. Orbital forcing of mid-latitude Southern Hemisphere glaciation since 100 ka inferred from cosmogenic nuclide ages of moraine boulders from the Cascade Plateau, southwest New Zealand. Geol Soc Am Bull. 119(3-4):443–451.
- Thackray GD, Rittenour TM, Shulmeister J. 2021. Ice-thickness variation during marine oxygen isotope stage 4–2 glaciation determined from kame terraces in the Rangitata Valley, New Zealand. Untangl Quat Period. 548:209.
- Thackray GD, Shulmeister J, Fink D. 2009. Evidence for expanded middle and late Pleistocene glacier extent in northwest Nelson, New Zealand. Geografiska Annaler. 91(4):291–311.
- Thomas GSP, Connell RJ. 1985. Iceberg drop, dump, and grounding structures from Pleistocene glacio-lacustrine sediments, Scotland. J Sediment Res. 55(2):243–249.
- Upton P, Craw D, James Z, Koons PO. 2004. Structure and neotectonics of the Southern Two thumb range, mid-canterbury, New Zealand. New Zealand J Geol Geophys. 47:141–153.
- Upton P, Osterberg EC. 2007. Paleoseismicity and mass movements interpreted from seismic-reflection data, Lake Tekapo, South Canterbury, New Zealand. New Zealand J Geol Geophys. 50(4):343–356.
- Vandergoes MJ, Howarth JD, Dunbar GB, Turnbull JC, Roop HA, Levy RH, Li X, Prior C, Norris M, Keller LD, Baisden WT. 2018. Integrating chronological uncertainties for annually laminated lake sediments using layer counting, independent chronologies and Bayesian age modelling (Lake Ohau, South Island, New Zealand). Quat Sci Rev. 188:104–120.
- Winkler S, Nesje A. 1999. Moraine formation at an advancing temperate glacier: Brigsdalsbreen, western Norway. Geogr Annaler. 81(1):17–30.
- Wyshnytzky CE, Rittenour TM, Thackray GD, Shulmeister J. 2019. An integrated morphologic and stratigraphic record of multiple MIS 2 glacial advances in the south Fork Hoh river valley, Olympic mountains, Washington, United States. Quat Res. doi:10.1017/qua.2019.47