
ABSTRACT
The neighbourhood effects literature indicates that a person's place of residence may affect their socio-economic situation. This study examines the association between the initial settlement and immigrants’ employment and income. Previous studies mostly used administratively defined geographical units of study, which may have led to an underestimation of neighbourhood effects. The current study uses individualized neighbourhoods, where neighbourhoods are constructed based on each individual's closest neighbours using geocoded register data, on different scales. In this way, more of the individual's actual neighbourhood is captured. The longitudinal study follows three cohorts of migrants and examines the relationship between the initial neighbourhoods that migrants settle in and their employment and income, in the short and medium-long term. The results show clear associations between neighbourhoods of initial settlement and labour market integration. Starting off in neighbourhoods with high levels of deprivation is associated with lower levels of employment while settling in affluent neighbourhoods is associated with higher incomes. Findings are stable for different migrant cohorts and in the short and long term. Neighbourhood effects are substantial especially for those settling in the most deprived or the most affluent neighbourhoods.
1. Introduction
Perhaps one of the biggest challenges of the new millennium in Europe is to house and integrate newly arrived migrants in the labour market. Although many European countries have used policies to disperse migrants in many different cities and neighbourhoods (Robinson, Andersson, and Musterd Citation2003), the majority has historically ended up in socioeconomically disadvantaged areas (Andersson, Bråmå, and Holmqvist Citation2010). For individuals living in the most segregated neighbourhoods, increased ethnic residential segregation has been found to lead to undesirable outcomes, such as poorer health or a weak position on the labour market (Atkinson and Kintrea Citation2001; Malmberg, Andersson, and Bergsten Citation2014; Malmberg and Andersson Citation2015). This is true even in Sweden, where migrants’ labour market integration has worsened since the mid-1980s (Segendorf and Teljosuo Citation2011), while migration flows to Sweden have increased dramatically, especially from non-European countries. In this context, this article focuses on the specific circumstances of the initial neighbourhood of settlement (‘port-of-entry' in some literature) and whether and how this place is associated to immigrant labour integration for a number of recent cohorts.
In this era of big data, segregation research may benefit significantly from geocoded full population micro data by improving the measures of segregation (Ruggles Citation2014). Decades of research have shown that segregation research will not be able to progress until problems caused by data and measurement limitations are addressed in a credible way (Openshaw Citation1984). Geographically coded register data allow researchers to redefine what a neighbourhood is and how segregation should be measured. Instead of using predefined areas, an individualized approach is founded on the idea of nearest neighbours forming the base for neighbourhood effects (Malmberg et al. Citation2018). Studies using this new approach have shown that neighbourhood effects on individual socio-economic outcomes are more substantial than previous studies have indicated (Östh, Andersson, and Malmberg Citation2013; Malmberg, Andersson, and Bergsten Citation2014; Andersson and Malmberg Citation2015, Citation2018; Malmberg and Andersson Citation2015). In this article, we use a similar methodology and approach and add to existing studies by investigating neighbourhood effects of first settlement associated with the outcome of labour market integration. We construct individualized neighbourhoods by creating a neighbourhood for each individual, based on that individual's nearest neighbours. Each individual has the same number of neighbours, so that the geographical size of the neighbourhood varies based on population density. We argue that this methodology comes closer to what individuals perceive to be their neighbourhood as it is based on the nearest individuals rather than on administrative borders, and at the same time, it avoids the problems that occur when using predefined areas. Using individualized neighbourhoods, we can measure neighbourhood characteristics on different scales simultaneously. For example, one can compare small-scale neighbourhood segregation with city-wide large-scale segregation (following Atkinson and Kintrea Citation2001; Malmberg, Andersson, and Bergsten Citation2014; Nielsen and Hennerdal Citation2017). This is important because an area might be segregated on one geographical scale but not on another (Fowler Citation2016). Using individualized neighbourhoods, we seek to answer how migrants’ initial neighbourhoods are associated with labour market integration, both in the short and the medium-long term.
In Europe, Sweden is a good context to study residential segregation and immigrant labour integration for several reasons. Internationally, Sweden has one of the most expanded welfare systems (Christophers Citation2013), a system that comprises both general individual-based benefits and area-based policies. Sweden is considered a liberal country regarding migration and integration policy (Sainsbury Citation2006), ranking first in Europe for the number of asylum applications per capita in the period 2010–2014 (UN Refugee Agency Citation2017). Sweden has a history of receiving large waves of migration, i.e. refugees from the former Yugoslavia and Iraq in the 1990s and 2000s. While many of the general individual-based policies are still in place, housing and area-based policies have gradually been removed to the degree that researchers have deemed the Swedish housing market liberal or a ‘hybrid' (Christophers Citation2013).
Compared to segregation in North America, ethnic and socio-economic residential segregation in Swedish metropolitan areas have been considered relatively low, although ethnic segregation had increased in the 1990s (Nielsen and Hennerdal Citation2017; Malmberg et al. Citation2018) and is now comparable to other north European countries (Andersson et al. Citation2018). As in other parts of Europe, migrants tend to start their residential careers in cheap rental housing built in the 1960s and 1970s at the edges of urban areas. Over time, some move out of such areas and into other rental houses or owner-occupied homes (Bråmå Citation2006). Migrants from sub-Saharan Africa tend to stay in these starter areas more than other migrant groups (Turner and Hedman Citation2014). Newly arrived migrants are likely to end up in these neighbourhoods as well, resulting in relatively few natives in such areas (Bråmå Citation2006).
Strategies to counter the negative effects of segregation in Sweden include mixed housing, refugee allocation, and efforts within the Metropolitan Development Initiative. The strategy of mixed housing is based on the idea that a mixed development of different forms of tenure, types of properties, and housing sizes leads to a mixed population composition. Refugee allocation has been another strategy to spread the refugee population evenly over Swedish municipalities. Finally, the Metropolitan Development Initiative was launched as a strategy where conditions for economic development were created in a number of vulnerable areas in metropolitan municipalities in the period 1999–2006. However, studies have shown that none of these strategies managed to counteract the levels of residential segregation to any significant degree (Andersson, Bråmå, and Holmqvist Citation2010).
Living in deprived neighbourhoods may affect socio-economic outcomes later in life. Such neighbourhood effects may be caused by a combination of internal and external mechanisms (see Galster Citation2012). Internal mechanisms pertain to causes emanating from within the neighbourhood. One such mechanism is that behaviour, attitudes, and ambitions are influenced by local examples during socialization. For instance, a scarcity of employed persons nearby may lead to negative attitudes to work. The presence of local norms may influence individual behaviour as well, such as norms regarding the importance of obtaining a higher education. Social networks might be important in supporting and aiding socio-economic integration (Kleit Citation2001). External mechanisms, emerging from outside the neighbourhood, may also lead to neighbourhood effects. Stigmatization of certain neighbourhoods may lead important actors, such as employers, to draw conclusions based on stereotypes of people living in these areas. A lack of local institutional or public resources may create disadvantages for the inhabitants of a neighbourhood. Finally, spatial isolation of a neighbourhood may lead to its individuals missing out on local labour markets. The comprehensive literature on neighbourhood effects has established that neighbourhood effects influence different outcomes in individual lives. However, it is often complicated to distinguish which causal mechanisms exist between living in a certain neighbourhood and subsequent individual socio-economic outcomes (Galster Citation2012).
While many studies focus on the effects of growing up in deprived neighbourhoods, moving to deprived neighbourhoods in later life may also affect future outcomes. Studies on neighbourhood effects and the relationship between social and spatial mobility provide evidence of the importance of initial residential settlement on subsequent spatial assimilation. The most geographically focused theory, the segmented assimilation theory (see Wright, Ellis, and Parks Citation2005), states that migrants’ integration depends to a large extent on their place of residence, besides the motivation for migration, resources, and host country reception (Newbold Citation2003). Settlement in poorer neighbourhoods might lead to assimilation into the lower class, while settling in economically well-off locations could initiate integration into the middle class.
Labor market integration among migrants is not only influenced by the neighbourhood they settle in. Integration is related to gender, country of birth, reason for migration, and time in Sweden (e.g. see Le Grand and Szulkin Citation2002; Bevelander Citation2011; Segendorf and Teljosuo Citation2011). Women, the lower educated, non-European migrants, and newly arrived migrants, in general, have a harder time establishing themselves in the labour market. Those who move to Sweden for studies or work tend to integrate more quickly into the labour market than those who move to reunite with family or move for humanitarian reasons. The latter groups are even confronted with ethnic discrimination by employers (Rydgren Citation2004; Carlsson and Rooth Citation2007). Furthermore, labour market integration among migrants varies with national and local economic conditions and geographic location (Åslund and Rooth Citation2007).
Studies examining the relationship between living in a deprived neighbourhood and individual socio-economic outcomes have shown negative associations between the two. For Sweden, the negative effects of growing up in deprived neighbourhoods have been associated with individual income (Andersson et al. Citation2007; Galster et al. Citation2008) and employment (Musterd and Andersson Citation2006). Other studies have shown connections between living in socio-economically vulnerable areas and receiving social welfare (Brännström Citation2005; Mood Citation2010; Brännström Citation2012; Brännström and Rojas Citation2012) as well as the length of education and educational outcomes (Andersson and Subramanian Citation2006; Bygren and Szulkin Citation2010).
However, neighbourhood effects tend to be relatively small compared to the role of individual factors such as educational level, experience in the labour market, ethnic background, and gender (Brännström Citation2005; Musterd and Andersson Citation2006; Hedberg Citation2009; Brännström Citation2012; Brännström and Rojas Citation2012; Hedberg and Tammaru Citation2013) with a few exceptions (Andersson and Subramanian Citation2006; Galster et al. Citation2008; Mood Citation2010). Some studies have shown that living in an ethnic enclave may have positive effects on socio-economic outcomes (Edin, Fredriksson, and Åslund Citation2003; Musterd et al. Citation2008; Andersson, Musterd, and Galster Citation2014), such as becoming an entrepreneur (Andersson and Hammarstedt Citation2015). Other studies have pointed to negative effects of living in ethnic enclaves, such as earning lower incomes (Musterd et al. Citation2008) and lower education levels (Grönqvist Citation2006), especially for women (Andersson, Musterd, and Galster Citation2018).
However, studies analyzing the relationship between segregation and individual socioeconomic outcomes have had a number of problems. First, most studies have focused on metropolitan areas while the rest of Sweden has been disregarded. Second, the majority of studies used administrative units, such as zip codes (Drever Citation2004; Gijsberts and Dagevos Citation2007) or, in Sweden, so-called SAMS areas (small areas for market statistics). When analyses are done using predefined areas, results may depend on the geographic delineation of the area units into which the data are aggregated, the so-called Modifiable Area Unit Problem (MAUP) (Openshaw Citation1984). Third, most studies generally use either large neighbourhood scales, such as cities (Edin, Fredriksson, and Åslund Citation2003; Bevelander Citation2011; Bevelander and Pendakur Citation2012; Damm Citation2014; Andersson and Hammarstedt Citation2015) or small-scale predefined administrative areas. However, as segregation indices depend on the size of the neighbourhood, multiscalar studies are to be preferred over uniscalar studies (Fisher et al. Citation2004; Hennerdal and Nielsen Citation2017). Finally, different studies use different indices to measure segregation, which complicates comparisons over time, between cities, and between studies. Based on these issues, it can be argued that previous studies have underestimated neighbourhood effects (Spielman and Yoo Citation2009; Amcoff Citation2012).
2. Materials and methods
2.1. Data and research design
The study used a compilation of longitudinal register datasets compiled by Statistics Sweden which includes demographic and socioeconomic variables. A unique quality is that it also includes geographic coordinates for place of residence within 250 × 250 m grid squares in urban areas, defined as built-up areas with at least 200 residents with houses not being more than 200 m apart (some special rules apply [Statistics Sweden Citation2015a]), and 1000 × 1000 m grid squares for rural areas.
A longitudinal design measures labor market integration from the time of registering in Sweden to four and ten years after arrival, and relates this to the area of initial settlement. The analyses were carried out for three different cohorts of migrants to assess whether a possible association between settlement area and labour market integration is persistent over time and across migrant cohorts that vary in terms of country of origin and reason for migration over time. All those born outside of Sweden and registering in Sweden in the years 1995, 2001 and 2007, while aged 18–54 were included.
The study examines the association between initial settlement neighbourhood and labour market integration in the short and medium-long term. Because the initial period after arriving in a new country might be characterized by high mobility, we chose to measure initial settlement in the year after registration in Sweden. Integration in the labour market is measured four and ten years after registration by examining whether migrants were employed, and for those employed, their income.
shows the number of migrants that were included in the study. After four years, the number of migrants captured in the cohorts decreased by about 22% as people left the country or died. After ten years, about 70% of the migrants remain. A small number of migrants registered in Sweden may have actually left the country. Statistics Sweden deregisters individuals who do not appear to work and live in the country anymore, but as that takes time, there is a risk that some of these migrants who are registered in the system with no employment and income may have actually emigrated (Statistics Sweden Citation2015b).
Table 1. Number of migrants covered in the study.
There are some differences between the migrants in the three cohorts (see appendix 1 Table 1). Over time, the number of migrants from outside the Nordic countries and especially from Asia has increased. This is partly related to an increase in labour migration due to changes in regulations; it is also due to the expansion of the European Union in 2004 and 2007, which led specifically to increased migration from Poland and Rumania. Employment rates for migrants were relatively low in 1995, increasing in 2001, and relatively high in 2007, reflecting overall economic conditions (cf. Segendorf and Teljosuo Citation2011). The first cohort is therefore expected to have had a harder time establishing themselves in the labour market. For all cohorts, family reunification was the most reported reason for migration, followed by humanitarian reasons.
To test the association between the initial settlement area and labour market integration, we used regression analyses. The research design is such that the first model, the ‘individual model,' includes individual characteristics that may explain labour market integration, based on previous studies. This model also includes whether a migrant moved to another neighbourhood after the initial settlement and characteristics of the local labour market. The second model, the ‘neighborhood model,' adds neighbourhood characteristics in order to be able to assess the added value of including such information. The association between neighbourhood and employment is tested using logistic regression, while the association between neighbourhood and (log) income is done using linear regression analysis.
Neighbourhood effects studies are confronted with many challenges, such as selecting the right scale level, measuring appropriate neighbourhood characteristics, and making a design that takes into account selective sorting into neighbourhoods (Galster Citation2008). Individuals with certain characteristics, for instance, better socio-economic prospects, choose to move to certain neighbourhoods, while others with a worse socio-economic status may have less choice. In addition, regulations regarding the settlement of asylum seekers have changed over time, and during the period of study, asylum seekers were either placed in asylum seeker accommodation or chose their own housing. As a consequence, segregation may increase because those with higher income move from deprived areas, while those with lower income move in (Aldén, Hammarstedt, and Neuman Citation2015). Our approach to the above-mentioned challenges consists of three strategies. First, we use a multiscalar approach that has been proven to be more accurate compared to uni-scalar studies (i.e. Galster Citation2008). Second, we include appropriate neighbourhood characteristics using factor analyses on a range of variables from full-population high-quality register data. Third, we include a range of variables to control for selective sorting into neighbourhoods, namely reason for migration, education, age, wealth, and residential turnover. By including the reason for migration, we correct for the possibility that, for instance, those who migrate based on an employment contract might move to better socio-economic areas. By including wealth, we capture some of the migrants arriving to Sweden with relatively better economic resources. Relatively wealthy migrants may be able to settle in socio-economically better neighbourhoods with better amenities and better housing (Wright, Ellis, and Parks Citation2005). Furthermore, we include residential turnover as an indication of neighbourhoods in a circle of decline (Hedman Citation2011) and it is likely that individuals with very low resources would initially move to neighbourhoods with high turnover. Finally, we also control for whether migrants move from the neighborhood they initially settled in (following Hedman Citation2011). However, there are variables that we are not able to include in the analysis, such as choice, networks, previous work experience, and different forms of human capital. Other methods, such as the instrumental variables approach (e.g. see Andersson, Musterd, and Galster Citation2018), difference models (Galster et al. Citation2008) or fixed-effects models (e.g. see Edin, Fredriksson, and Åslund Citation2003) do not, to our knowledge, go together with multiscalar neighbourhoods and factor variables (instrumental variables approach) or focus on change over time (fixed effects and difference models) while we are interested the association between static initial neighbourhoods and later labour market integration.
Robustness checks have been performed by running the models for groups based on reason for migration and by leaving out those migrants who were employed one year after registration. The results show some small differences in the association between neighbourhood and income in the short term, but the overall results are robust.
2.2. Operationalization
Labour market integration was operationalized in two ways. Employment indicates whether an individual was employed for at least an hour in November, including those who were self-employed. In order to also account for income earned from employment, we do an additional analysis examining income, originating from the national tax office. It is defined as the declared gross annual salary from employment and self-employment. In the OLS regression, we use the natural logarithm of income, as the variable is positively skewed.
Based on previous studies, the individual characteristics included were gender, age at immigration (at registration), educational level, capital income, mode of legal entry, visible minority status, and family position. Educational level measures completed education and consists of four categories: (1) primary education (a maximum of 9 years education); (2) secondary education (equivalent of gymnasium); (3) tertiary education (equivalent of eftergymnasial utbildning); and (4) missing educational information. The variable is measured four and ten years after registration.
Reason for migration is operationalized as mode of legal entry, which is reported at registration and comes from the Swedish Migration Agency. The variable measures whether a person immigrated to reunite with family, for humanitarian reasons, for labour, or for studies. For those not in need of a residence permit, we created three alternatives based on country of birth: born in the Nordic countries, born in the EU, and born outside the EU. For migrants from the Nordic countries, reason for migration is not registered, and for EU migrants other rules apply.
The variable visible minority measures whether a person is born in Africa, Asia, or South America. We included this variable because other studies have shown that ethnic discrimination is important to consider in studies on labour market integration (Rydgren Citation2004; Carlsson and Rooth Citation2007). To be born in one of these continents is not the same as belonging to a so-called visible ethnic minority in Sweden, but it is more likely that individuals born in these areas are visibly different from the population's ethnic majority.
Family position is operationalized as whether a person was married, cohabited with a partner and common children, was single, a single parent, or lived with his or her parents.
The variable capital income is an indicator for wealth, and catches gains and losses from things such as sales of property, sales of stock, bank account revenues, and mortgage interests. A negative capital income may be the result of losses from housing mortgages and may indicate that the migrant was able to secure a mortgage from the bank. Conversely, a positive capital income captures gains from capital and may indicate that the migrant had access to capital just after arrival.
In addition, two background variables were included that might influence labour market integration: variation between local labour markets and movement away from initial neighbourhoods. We used the categorization of the Swedish Association of Local Authorities and Regions to categorize municipalities according to population, commuting, and aspects of the local labour market. We regrouped the categorization into four broad groups: (1) Metropolitan cities including suburbs; (2) Larger cities including suburbs; (3) Towns; and (4) Countryside.
Finally, we control for whether an individual moved during the period of examination. This is operationalized as a change in the 250 or 1000 m square, depending on location, between registration and the measurement of labour market integration. This measurement does not include moves back to the initial square, neither are moves within the square or subsequent moves included.
2.3. Individualized neighborhoods
Individualized neighbourhoods for each individual were constructed using the EquiPop software.Footnote1 The software is based on the principle of nearest neighbours. The coordinates of residential squares were measured in the year after registration in Sweden. A number of characteristics among the 200, 2,000, and 20,000 nearest neighbours for the entire Swedish population aged 25–54 were included. This means that we created individual neighbourhoods for each populated location. Thus, each person has their own bespoke neighbourhood with three different sizes. The sizes of the neighbourhoods are chosen based on wanting to capture small-scale (200), midsize (2000), and large neighbourhoods (20,000). The neighbourhood's social character was operationalized by five characteristics pertaining to all neighbours aged 25–54, including both migrants and natives, in order to measure the share of neighbours who:
Were employed, based on the November measurement of Statistics Sweden.
Had completed a higher education.
Were migrants, i.e. not born in Sweden.
Had higher incomes, measured as belonging to the top ten percentiles of those with an income higher than zero.
Were receivers of social welfare, measured as receiving any social welfare during the year.
Three neighbourhood sizes and five variables result in 15 different neighbourhood variables for each individual. Because there is multicollinearity between these variables, we used factor analysis to reduce the number of variables into factor variables that still cover the contents of the original variables.
The factor analysis resulted in two factors, interpreted as two different types of neighbourhood.Footnote2 presents the factor loadings for the different types of neighbourhood for each migrant cohort. A variable with a high loading (marked in bold) can be interpreted as having a stronger association with the factor type. Factor type 1 mainly has strong loadings on the shares of employed, higher educated, and higher income. This applies to all k-levels and all cohorts. Factor type 2, on the other hand, has strong negative loadings for the share of employed, and high positive loadings for the share of migrants and the share on social welfare. Even here this applies to all k-levels and all cohorts. The only overlap between the two is that both are characterized by a relatively high share of the nearest 20,000 persons that are migrants.
Table 2. Factor loadings for neighbourhood types.
We denote factor type 1 as ‘degree of affluence in the neighborhood' and factor type 2 as ‘degree of deprivation in the neighbourhood.' Each migrant in the dataset has a value on both neighbourhood types. The degree of affluence mirrors to what degree each individual's nearest neighbours are employed, are higher educated and have higher incomes compared to the whole population. The degree of deprivation reflects to what degree each individual's nearest neighbours have lower employment rates, are more often migrants, and more often receive social welfare compared to the total population.
In addition, a third neighbourhood variable was added, measuring residential turnover. It examines the number of individuals moving out of a neighbourhood, in our case the 250 or 1000 m grid squares, at the year of settlement divided by the number of individuals registered in that grid at the beginning of the year.
2.4. Neighbourhood profiles
in the appendix shows that the differences in the most deprived and the most affluent neighbourhoods are substantial. Among the population living in the most deprived areas (that is the area with the highest factor 2 scores), the most common highest completed level of education is secondary education, while it is higher education in the most affluent areas. Similarly, the share of non-migrants is substantially higher in areas with the highest degrees of affluence (88–90%) compared to the most deprived areas (49–59%). The average age and the mean disposable income are much lower in the most deprived areas compared to the most affluent areas.
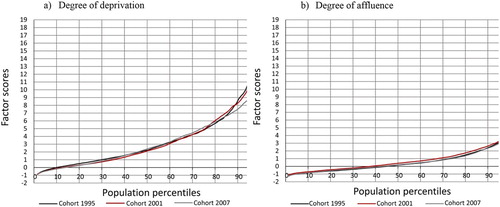
shows two percentile plots: one for degree of deprivation and one for degree of affluence in the neighbourhood. The three different lines in each graph represent the factor values for the three migrant cohorts in the study. The graphs show the proportion of migrants that lived in neighbourhoods characterized by different factor values. For instance, the right graph shows that 70% of the migrants arriving in the year 2007 lived in areas with factor values that were equal or lower than 0.8 regarding the degree of affluence in the neighbourhood of initial settlement. That means that 30% of that cohort lived in neighbourhoods with factor values higher than 0.8 on degree of affluence. In the same way, the graph on the left shows that 70% of the migrant cohort arriving in 2007 started off in neighbourhoods with factor values equal to or lower than 4.5 for degree of deprivation. The difference between the two graphs is clear. Vastly more migrants started off in neighbourhoods with relatively high values on deprivation than migrants starting off in neighbourhoods characterized by high degrees of affluence. It was, thus, more common for migrants (in all cohorts) to start off in neighbourhoods that had a low share of people who are employed, a high share of migrants, and a high share of individuals that are on social welfare.
Figure 1. Population percentiles based on the distribution of factor values for degree of deprivation (on the left) and degree of affluence (on the right) in the neighbourhoods of initial settlement. Source: Register data, authors’ calculations.
Neighbourhoods with the highest degrees of affluence (factor values that are more than 4) are limited to a few areas in the Stockholm metropolitan region such as Danderyd, Bromma, and Lidingö, and areas in Uppsala, Kungsbacka, Gothenburg, Lund, and Lomma. Neighbourhoods with the highest levels of deprivation are much more geographically spread out. The highest values are found in areas in the three metropolitan areas. Areas with factor values of more than 10 are, for instance, Rosengård in Malmö; Hjällbo, Hammarkullen, and Bergsjön in Gothenburg; Tveta and Ronna in Södertälje, and Rinkeby and Tensta in Stockholm.
3. Results
3.1. Initial settlement and subsequent employment
The share of migrants who are employed after four years varies across cohorts (37%; 42%; and 44%, respectively). Later cohorts are employed to a larger extent than the cohort arriving in 1995, which is in line with earlier studies documenting harsher conditions in the labour market in the 1990s. The share of migrants who are employed also increases over time: from about 40% that has a job after 4 years to about 60% after 10 years. Differences between cohorts might be caused by differences in terms of, for instance, personal wealth and mode of legal entry. Therefore, we include such variables in the multivariate analysis, as well as neighbourhood characteristics, in the next section.
and show the results of logistic regression analyses of the likelihood of being employed for the three different migrant cohorts, for the short and medium-long term respectively. The so-called individual model includes individual-level characteristics such as gender, age, wealth and mode of legal entry, while the ‘neighborhood model' also includes neighbourhood variables, in order to assess whether neighbourhood effects explain part of the results and whether they add to the explained variance.
Table 3. Logistic regression analysis of being employed 4 years after registration.
Table 4. Logistic regression analysis of being employed 10 years after registration.
The analyses show that there is a clear association between initial neighbourhood and later employment, both in the short and the medium-long term and for nearly all migrant cohorts. Across all cohorts and models, likelihood ratio tests testified that the explained variance significantly improved after adding neighbourhood context. Migrants settling in neighbourhoods with high degrees of affluence had a higher likelihood of being employed both four and ten years later, except for the 2001 cohort in the short term and cohort 1995 in the medium-long term. On the other hand, migrants settling in neighbourhoods with high degrees of deprivation had lower likelihoods of employment in all cohorts on the short and the medium-long term. Although the population composition of the different migrant cohorts varies, the neighbourhood effects are robust throughout all cohorts. In addition, settling in areas with high residential turnover is associated with decreased employment chances both on the short and the medium-long term.
The analyses also demonstrate the association between individual-level variables and employment. The results largely confirm other studies in that the likelihood of being employed in both the short and medium-long term increases for migrants who are male, who are not members of a visible minority, who are not older than 45 years at migration, who are married, who have higher levels of education, who have some wealth upon arrival, and who have moved away from the initial neighbourhood of settlement. Those that remain in the initial neighbourhood have lower employment chances after four and ten years, which is in line with previous studies that have found that those with the best human capital move out of more deprived areas (Bråmå Citation2006; Aldén, Hammarstedt, and Neuman Citation2015).
The likelihood of finding employment is much higher for those that entered the country as labour migrants compared to those who migrated to reunite with family, and much lower for those who came as refugees.
The results also suggest a higher likelihood for employment for migrants initially settling in metropolitan areas compared to settling in larger cities on the short term, as well as no employment effects for migrants who settle on the countryside, and even a positive effect for the 2007 cohort on the long term. This is in conjunction with findings by Hedberg and Haandrikman (Citation2014). The results on local labour markets and income are ambiguous and mostly negative, which is in line with the fact that salaries tend to be lower outside the metropolitan areas.
Because the degree of affluence, and especially the degree of deprivation, vary substantially (see ), we calculated predicted probabilities for the association between initial settlement and employment based on the final models. For those migrants that initially settled in neighbourhoods with relatively high values on affluence in 1996, i.e. with factor values of at least 2.47 which corresponds to population percentile 90 (see ), the predicted increase in the probability of being employed in the short term is 40%, keeping all other variables at their true values. Similarly, the value for population percentile 99 corresponds to an increase in the probability of being employed of 43% in the short term. When we compare this to the expected increase or decrease in the probability of being employed for other variables, we can see that for men, this probability increases by 43%; being a visible minority decreases this chance by 31%, and having been granted settlement based on humanitarian reasons corresponds to a decreased probability of being employed of 29%.
A number of sensitivity analyses confirmed the robustness of our findings. Separate analyses for different groups of migrants based on mode of legal entry as well as analyses that exclude those that had a job in the year of initial settlement showed that the association between initial settlement and employment remains.
3.2. Initial settlement and subsequent job income
As expected, over time, the median annual income for those migrants who were employed has increased for all cohorts (SEK 145,000; 183,000; and 214,000 respectively).Footnote3 Later cohorts have higher median annual incomes than the cohort coming to Sweden in 1990, which reflects economic conditions at the time.
and present the OLS regression results for log income for migrants who are employed, for the three migrant cohorts, and for the short and medium-long term respectively. Results for categorical variables indicate how much higher the log income would be compared to the reference category, holding other variables at fixed value. For instance, in column 1 the results for gender indicate that male migrants earn a higher income than women, namely exp(0.28) = 1.32, so 32% more.
Table 5. Linear regression analysis of log income for those employed 4 years after registration.
Table 6. Linear regression analysis of log income for those employed 10 years after registration.
The analyses show that there is an association between initial neighbourhood and later labour market integration when it is measured by income for employed migrants, but that it is less robust compared to the association with employment. However, likelihood ratio tests confirm that the addition of neighbourhood variables significantly increases the explained variance for all cohorts and for both the short and the medium-long term. The association between affluence in initial neighbourhoods and earned income is most evident. The higher the degree of affluence in the initial neighbourhood, the higher the income for those employed. This is valid for the short and the medium-long term and for all migrant cohorts. The association between deprivation in port-of-entry neighbourhoods and later income is less clear. The higher the degree of deprivation in the starting neighbourhood, the lower the income; this applies to the 1995 cohort in the short and the medium-long term but not for the other cohorts. In addition, we hardly find effects for settling into areas with high residential turnover on income.
The results for the association between individual variables and income confirm findings from previous studies. Income for employed migrants is higher for men, for those who are not part of a visibly minority, for those who are not too young when migrating to Sweden, who come from one of the Nordic countries or the EU (though not on the long term), those who entered based on studies or as labour migrants (compared to family reunion migrants), and who have a relatively high educational level and are wealthy upon arrival. Comparable to the results for employment, the association between income and the type of place one initially settles in and the mode of legal entry are less clear, but settling in metropolitan areas pays off in terms of income in the short and long term. There is a significant positive effect on income of leaving the initial residential area.
When we calculate predicted probabilities based on the final model, we can see that for those initially settling in neighbourhoods with high degrees of affluence in 2007, i.e. with factor values of at least 2.47 which corresponds to population percentile 90 (see ), the predicted increase in expected income in the short term is 14 times larger compared to living in a neighbourhood corresponding to population percentile 50. The predicted probability of living in a neighbourhood corresponding to the 90th population percentile is twice as large compared to the effect of being a man, and three times larger compared to being a visible migrant.
Sensitivity analyses were conducted in order to check robustness for mode of legal entry by doing separate analyses and by excluding migrants who were employed when they settled in the initial neighbourhood. The analyses showed some minor differences between initial neighbourhood and income in the short term, but overall the results were robust.
4. Discussion
The aim of this article was to examine the association between initial settlement and immigrant labour integration. Using a longitudinal approach, we followed three migrant cohorts from the time they settled in a certain neighbourhood after coming to Sweden to their labour market outcomes in the short (4 years) and the medium-long term (10 years), and we have demonstrated that there is a clear association between initial neighbourhood and later labour market integration, even when individual characteristics are controlled for. Results were fairly robust over time and between cohorts with the 1995 cohort having more difficulty establishing themselves in the labour market than the ones arriving in the 2000s.
While previous studies used administratively defined areas, in this study, neighbourhoods were constructed around individuals. Based on unique data comprising the whole Swedish population, the share of every person's nearest 200, 2,000, and 20,000 nearest neighbours who were employed, had a higher education, were migrants, had higher incomes and were receivers of social welfare, were calculated. Subsequently, a factor analysis resulted in two distinct neighbourhood types, which were named ‘degree of deprivation' and ‘degree of affluence.'
It was much more common for newly arrived migrants, across cohorts, to start off in neighbourhoods that can be classified as having a high degree of deprivation, i.e. where there is a low share of people who are employed, a high share of migrants, and a high share of individuals that receive social welfare. These areas are geographically spread across Sweden, with neighbourhoods with the highest degrees of deprivation located in Gothenburg, Malmö and Stockholm. Those migrants settling in areas with high degrees of affluence, i.e. areas with a high share of neighbours who are employed, are higher educated, and have higher incomes, are geographically limited to a few neighbourhoods in metropolitan and other urban areas.
A main finding of the study is that adding neighbourhood context explains a significant part of both employment and income of migrants on the short and medium-long term. Throughout three different cohorts, it is primarily the degree of deprivation and the extent of residential turnover, and to a lesser extent the degree of affluence, that make up neighbourhood context in explaining which migrants find a job. The higher the degree of deprivation in the initial neighbourhood, the less likely one will be employed in the short and the medium-long term.
For income, results are less robust, and neighbourhood context plays a role mainly through the degree of affluence in initial neighbourhood. The higher the degree of affluence in the initial neighbourhood, the higher the income among those employed in the short and the medium-long term. This contributes to previous studies that primarily examined the links between living in deprived areas and employment and income (for instance Musterd et al. Citation2008; Hedberg Citation2009; Hedberg and Tammaru Citation2013; Andersson, Musterd, and Galster Citation2014).
Previous studies on similar topics have found moderate neighbourhood effects (Hedberg Citation2009; Hedberg and Tammaru Citation2013) and both positive and negative associations between living in specific neighbourhoods and migrant labour integration (Musterd et al. Citation2008; Hedberg Citation2009; Åslund, Östh, and Zenou Citation2010; Hedberg and Tammaru Citation2013; Andersson, Musterd, and Galster Citation2014; Andersson, Musterd, and Galster Citation2018). It is possible that studies finding moderate effects have underestimated neighbourhood effects because they used administratively defined areas (see for instance Amcoff Citation2012; Andersson and Malmberg Citation2015). Another potential reason for this difference in findings is that previous studies finding positive associations between living in segregated neighbourhoods have used large neighbourhood scales in the analysis. This could rather be a question of city effects than neighbourhood effects. These studies have focused on one neighbourhood scale, such as only the SAMS area or the city scale, even though segregation cannot be uniquely linked to a single scale level (Jones et al. Citation2015). Our multiscalar individualized neighbourhoods approach entails that we measure segregation on different scale levels at the same time, adding to the growing literature showing that multi-scalar studies are more accurate than uni-scalar studies (e.g. see Fisher et al. Citation2004; Hennerdal and Nielsen Citation2017) and help us to understand neighbourhood dynamics better (Clark et al. Citation2015). Our study is a good example of how inventive methods may be used on big data to come to improved, more precise and a more nuanced understanding of how neighbourhoods affect individual outcomes (see also Andersson and Malmberg Citation2018). In addition, using individualized neighbourhoods enables comparable studies over time and between cities, regions and countries.
The study design in combination with the detailed geocoded data available to us allows for some tentative policy recommendations. Our findings that there are fewer chances for employment integration when initially settling in deprived neighbourhoods and that settling in affluent neighbourhoods is associated with higher incomes, suggest that local intervention initiatives should be considered at the neighbourhood level and not the municipality level. The issues related to establishing what mechanisms will be effective for the success of migrants’ labour market integration, however, remains unanswered. It is likely that access to resources (information about the labour market, access to networks and so on) varies with neighbourhood deprivation and affluence and are key for integration. Other explanations are possible, for instance, neighbourhood socialization processes could encourage migrants to assess the opportunities in the labour market deeper. Similarly, accounting for co-ethnic presence in neighbourhoods may be relevant in explaining socialization processes and access to labour markets, but due to the crude country of birth variable we had at our disposal, we have not been able to include this.
Disclosure statement
No potential conflict of interest was reported by the authors.
ORCID
Thomas Wimark http://orcid.org/0000-0001-7272-1729
Karen Haandrikman http://orcid.org/0000-0002-1246-2427
Michael Meinild Nielsen http://orcid.org/0000-0003-2770-7463
Additional information
Funding
Notes
1 Developed by John Östh and freely available for non-commercial use through Uppsala University.
2 The two factors together explained 64% of the variance in 1996, 65% in 2002 and 65% in 2008. We used a rotated structure matrix with Varimax rotation.
3 Similar income trends remain after correcting for inflation.
References
- Aldén, L., M. Hammarstedt, and E. Neuman. 2015. “Ethnic Segregation, Tipping Behavior, and Native Residential Mobility.” International Migration Review 49 (1): 36–69. doi: 10.1111/imre.12066
- Amcoff, J. 2012. “Hur bra fungerar SAMS-områdena i studier av grannskapseffekter? En studie av SAMS-områdenas homogenitet [How Well do SAMS Areas Function in Neighborhood Effects Studies? A Study on the Homogeneity of SAMS Areas].” Socialvetenskaplig Tidskrift 19 (2): 93–115.
- Andersson, R., Å Bråmå, and E. Holmqvist. 2010. “Counteracting Segregation: Swedish Policies and Experiences.” Housing Studies 25 (2): 237–256. doi: 10.1080/02673030903561859
- Andersson, L., and M. Hammarstedt. 2015. “Ethnic Enclaves, Networks and Self-employment among Middle Eastern Immigrants in Sweden.” International Migration 53 (6): 27–40. doi: 10.1111/j.1468-2435.2011.00714.x
- Andersson, E. K., and B. Malmberg. 2015. “Contextual Effects on Educational Attainment in Individualised, Scalable Neighbourhoods: Differences Across Gender and Social Class.” Urban Studies 52 (12): 2117–2133. doi: 10.1177/0042098014542487
- Andersson, E. K., and B. Malmberg. 2018. “Segregation and the Effects of Adolescent Residential Context on Poverty Risks and Early Income Career: A Study of the Swedish 1980 Cohort.” Urban Studies 55 (2): 365–383. doi: 10.1177/0042098016643915
- Andersson, E. K., B. Malmberg, R. Costa, B. Sleutjes, M. J. Stonawski, and H. A. de Valk. 2018. “A Comparative Study of Segregation Patterns in Belgium, Denmark, the Netherlands and Sweden: Neighbourhood Concentration and Representation of Non-European Migrants.” European Journal of Population 34 (2): 251–275. doi:10.1007/s10680-018-9481-5.
- Andersson, R., S. Musterd, and G. Galster. 2014. “Neighbourhood Ethnic Composition and Employment Effects on Immigrant Incomes.” Journal of Ethnic and Migration Studies 40 (5): 710–736. doi: 10.1080/1369183X.2013.830503
- Andersson, R., S. Musterd, and G. Galster. 2018. “Port-of-Entry Neighborhood and Its Effects on the Economic Success of Refugees in Sweden.” International Migration Review. doi:10.1177/0197918318781785.
- Andersson, R., S. Musterd, G. Galster, and T. M. Kauppinen. 2007. “What Mix Matters? Exploring the Relationships Between Individuals' Incomes and Different Measures of Their Neighbourhood Context.” Housing Studies 22 (5): 637–660. doi: 10.1080/02673030701474602
- Andersson, E. K., and S. V. Subramanian. 2006. “Explorations of Neighbourhood and Educational Outcomes for Young Swedes.” Urban Studies 43 (11): 2013–2025. doi: 10.1080/00420980600897834
- Åslund, O., J. Östh, and Y. Zenou. 2010. “How Important Is Access to Jobs? Old Question--Improved Answer” Journal of Economic Geography 10 (3): 389–422. doi: 10.1093/jeg/lbp040
- Åslund, O., and D.-O. Rooth. 2007. “Do When and Where Matter?” Initial Labor Market Conditions and Immigrant Earnings. The Economic Journal 117 (518): 422–448.
- Atkinson, R., and K. Kintrea. 2001. “Disentangling Area Effects: Evidence From Deprived and Non-Deprived Neighbourhoods.” Urban Studies 38 (12): 2277–2298. doi: 10.1080/00420980120087162
- Bevelander, P. 2011. “The Employment Integration of Resettled Refugees, Asylum Claimants, and Family Reunion Migrants in Sweden.” Refugee Survey Quarterly 30 (1): 22–43. doi: 10.1093/rsq/hdq041
- Bevelander, P., and R. Pendakur. 2012. “Citizenship, Co-ethnic Populations, and Employment Probabilities of Immigrants in Sweden.” Journal of International Migration and Integration 13 (2): 203–222.
- Bråmå, Å. 2006. “White Flight’? The Production and Reproduction of Immigrant Concentration Areas in Swedish Cities, 1990-2000.” Urban Studies 43 (7): 1127–1146. doi: 10.1080/00420980500406736
- Brännström, L. 2005. “Does Neighbourhood Origin Matter? A Longitudinal Multilevel Assessment of Neighbourhood Effects on Income and Receipt of Social Assistance in a Stockholm Birth Cohort.” Housing, Theory and Society 22 (4): 169–195. doi: 10.1080/14036090510011586
- Brännström, L. 2012. “Neighbourhood Effects on Young People's Future Living Conditions: Longitudinal Findings From Sweden.” International Journal of Social Welfare 21 (4): 325–337. doi: 10.1111/j.1468-2397.2011.00842.x
- Brännström, L., and Y. Rojas. 2012. “Rethinking the Long-term Consequences of Growing Up in a Disadvantaged Neighbourhood: Lessons From Sweden.” Housing Studies 27 (6): 729–747. doi: 10.1080/02673037.2012.714460
- Bygren, M., and R. Szulkin. 2010. “Ethnic Environment During Childhood and the Educational Attainment of Immigrant Children in Sweden.” Social Forces 88 (3): 1305–1329. doi: 10.1353/sof.0.0298
- Carlsson, M., and D.-O. Rooth. 2007. “Evidence of Ethnic Discrimination in the Swedish Labor Market Using Experimental Data.” Labour Economics 14 (4): 716–729. doi: 10.1016/j.labeco.2007.05.001
- Christophers, B. 2013. “A Monstrous Hybrid: The Political Economy of Housing in Early Twenty-first Century Sweden.” New Political Economy 18 (6): 885–911. doi: 10.1080/13563467.2012.753521
- Clark, W. A. V., E. Andersson, J. Osth, and B. Malmberg. 2015. “A Multiscalar Analysis of Neighborhood Composition in Los Angeles, 2000–2010: A Location-based Approach to Segregation and Diversity.” Annals of the Association of American Geographers 105 (6): 1260–1284. doi: 10.1080/00045608.2015.1072790
- Damm, A. P. 2014. “Neighborhood Quality and Labor Market Outcomes: Evidence from Quasi-Random Neighborhood Assignment of Immigrants.” Journal of Urban Economics 79: 139–166. doi: 10.1016/j.jue.2013.08.004
- Drever, A. I. 2004. “Separate Spaces, Separate Outcomes?” Neighborhood Impacts on Minorities in Germany. Urban Studies 41 (8): 1423–1439.
- Edin, P.-A., P. Fredriksson, and O. Åslund. 2003. “Ethnic Enclaves and the Economic Success of Immigrants – Evidence From a Natural Experiment.” The Quarterly Journal of Economics 118 (1): 329–357. doi: 10.1162/00335530360535225
- Fisher, C. S., G. Stockmayer, J. Stiles, and M. Hout. 2004. “Distinguishing the Geographic Levels and Social Dimensions of U.S. Metropolitan Segregation, 1960-2000.” Demography 41 (1): 37–59. doi: 10.1353/dem.2004.0002
- Fowler, C. S. 2016. “Segregation as a Multiscalar Phenomenon and Its Implications for Neighborhood-scale Research: The Case of South Seattle 1990–2010.” Urban Geography 37 (1): 1–25. doi: 10.1080/02723638.2015.1043775
- Galster, G. 2008. “Quantifying the Effect of Neighbourhood on Individuals: Challenges, Alternative Approaches, and Promising Directions.” Schmollers Jahrbuch 128 (1): 7–48. doi: 10.3790/schm.128.1.7
- Galster, G. 2012. “The Mechanism (s) of Neighborhood Effects: Theory, Evidence, and Policy Implications.” In Neighborhood Effects Research: New Perspectives, edited by M. Van Ham, D. Manley, N. Bailey, L. Simpson, and D. Maclennan, 23–56. Dordrecht: Springer.
- Galster, G., R. Andersson, S. Musterd, and T. M. Kauppinen. 2008. “Does Neighborhood Income mix Affect Earnings of Adults? New Evidence from Sweden.” Journal of Urban Economics 63 (3): 858–870. doi: 10.1016/j.jue.2007.07.002
- Gijsberts, M., and J. Dagevos. 2007. “The Socio-cultural Integration of Ethnic Minorities in the Netherlands: Identifying Neighbourhood Effects on Multiple Integration Outcomes.” Housing Studies 22 (5): 805–831. doi: 10.1080/02673030701474768
- Grönqvist, H. 2006. “Ethnic Enclaves and the Attainments of Immigrant Children.” European Sociological Review 22 (4): 369–382. doi: 10.1093/esr/jcl002
- Hedberg, C. 2009. “Entrance, Exit and Exclusion: Labour Market Flows of Foreign-Born Adults in Swedish ‘Divided Cities’.” Urban Studies 46 (11): 2423–2446. doi: 10.1177/0042098009342904
- Hedberg, C., and T. Haandrikman. 2014. “Repopulation of the Swedish Countryside: Globalisation by International Migration.” Journal of Rural Studies 34: 128–138. doi: 10.1016/j.jrurstud.2014.01.005
- Hedberg, C., and T. Tammaru. 2013. “‘Neighbourhood Effects’ and ‘City Effects’: The Entry of Newly Arrived Immigrants Into the Labour Market.” Urban Studies 50 (6): 1165–1182. doi: 10.1177/0042098012461674
- Hedman, L. 2011. “The Impact of Residential Mobility on Measurements of Neighbourhood Effects.” Housing Studies 26 (4): 501–519. doi: 10.1080/02673037.2011.559753
- Hennerdal, P., and M. M. Nielsen. 2017. “A Multiscalar Approach for Identifying Clusters and Segregation Patterns That Avoids the Modifiable Areal Unit Problem.” Annals of the American Association of Geographers 107 (3): 555–574. doi: 10.1080/24694452.2016.1261685
- Jones, K., R. Johnston, D. Manley, D. Owen, and C. Charlton. 2015. “Ethnic Residential Segregation: A Multilevel, Multigroup, Multiscale Approach Exemplified by London in 2011.” Demography 52: 1995–2019. doi: 10.1007/s13524-015-0430-1
- Kleit, R. G. 2001. “The Role of Neighborhood Social Networks in Scattered-site Public Housing Residents’ Search for Jobs.” Housing Policy Debate 12 (3): 541–573. doi: 10.1080/10511482.2001.9521418
- Le Grand, C., and R. Szulkin. 2002. “Permanent Disadvantage or Gradual Integration: Explaining the Immigrant-Native Earnings gap in Sweden.” Labour (committee. on Canadian Labour History) 16 (1): 37–64. doi: 10.1111/1467-9914.00186
- Malmberg, B., and E. K. Andersson. 2015. “Multi-scalar Residential Context and Recovery from Illness: An Analysis Using Swedish Register Data.” Health and Place 35 (Sept): 19–27. doi: 10.1016/j.healthplace.2015.05.013
- Malmberg, B., E. K. Andersson, and Z. Bergsten. 2014. “Composite Geographical Context and School Choice Attitudes in Sweden: A Study Based on Individually Defined, Scalable Neighborhoods.” Annals of the Association of American Geographers 104 (4): 869–888. doi: 10.1080/00045608.2014.912546
- Malmberg, B., E. K. Andersson, M. M. Nielsen, and K. Haandrikman. 2018. “Residential Segregation of European and Non-European Migrants in Sweden: 1990-2012.” European Journal of Population 34: 169–193. doi: 10.1007/s10680-018-9478-0
- Mood, C. 2010. “Neighborhood Social Influence and Welfare Receipt in Sweden: A Panel Data Analysis.” Social Forces 88 (3): 1331–1356. doi: 10.1353/sof.0.0304
- Musterd, S., and R. Andersson. 2006. “Employment, Social Mobility and Neighbourhood Effects: The Case of Sweden.” International Journal of Urban and Regional Research 30 (1): 120–140. doi: 10.1111/j.1468-2427.2006.00640.x
- Musterd, S., R. Andersson, G. Galster, and T. M. Kauppinen. 2008. “Are Immigrants' Earnings Influenced by the Characteristics of Their Neighbours?” Environment and Planning A: Economy and Space 40 (4): 785–805. doi: 10.1068/a39107
- Newbold, K. B. 2003. “Immigration, Spatial Assimilation, and Segmented Paths Within the Metropolis.” Geography Research Forum 23: 56–77.
- Nielsen, M. M., and P. Hennerdal. 2017. “Changes in the Residential Segregation of Immigrants in Sweden From 1990 to 2012: Using a Multi-Scalar Segregation Measure That Accounts for the Modifiable Areal Unit Problem.” Applied Geography 87: 73–84. doi: 10.1016/j.apgeog.2017.08.004
- Openshaw, S. 1984. The Modifiable Areal Unit Problem. Concepts and Techniques in Modern Geography, vol. 38. Norwich: GeoBooks.
- Östh, J., E. K. Andersson, and B. Malmberg. 2013. “School Choice and Increasing Performance Difference: A Counterfactual Approach.” Urban Studies 50 (2): 407–425. doi: 10.1177/0042098012452322
- Robinson, V., R. Andersson, and S. Musterd. 2003. Spreading the ‘Burden’? A Review of Policies to Disperse Asylum Seekers and Refugees. Bristol: Policy Press.
- Ruggles, S. 2014. “Big Microdata for Population Research.” Demography 51 (1): 287–297. doi: 10.1007/s13524-013-0240-2
- Rydgren, J. 2004. “Mechanisms of Exclusion: Ethnic Discrimination in the Swedish Labour Market.” Journal of Ethnic and Migration Studies 30 (4): 697–716. doi: 10.1080/13691830410001699522
- Sainsbury, D. 2006. “Immigrants’ Social Rights in Comparative Perspective: Welfare Regimes, Forms in Immigration and Immigration Policy Regimes.” Journal of European Social Policy 16 (3): 229–244. doi: 10.1177/0958928706065594
- Segendorf, ÅO, and T. Teljosuo. 2011. Sysselsättning för Invandrare: En ESO-rapport om Arbetsmarknadsintegration [Employment for Migrants: An ESO Report About Labor Market Integration]. Rapport till Expertgruppen för studier i offentlig ekonomi 2011:5. Stockholm: Government of Sweden, Ministry of Finance.
- Spielman, S. E., and E.-H. Yoo. 2009. “The Spatial Dimensions of Neighborhood Effects.” Social Science & Medicine 68 (6): 1098–1105. doi: 10.1016/j.socscimed.2008.12.048
- Statistics Sweden. 2015a. Geografidatabas [Geography data base]. Facts about the registers. http://www.scb.se/sv_/Vara-tjanster/SCBs-data-for-forskning/SCBs-datalager/ Geografidatabas/ (last accessed 8 December 2017).
- Statistics Sweden. 2015b. Övertäckning i Registret av Totalbefolkningen – En Registerstudie [Overcoverage in the Total Population Register]. Background and Facts. Population and Welfare 2015:1. Örebro: Statistics Sweden.
- Turner, L. M., and L. Hedman. 2014. “Linking Integration and Housing Career: A Longitudinal Analysis of Immigrant Groups in Sweden.” Housing Studies 29 (2): 270–290. doi: 10.1080/02673037.2014.851177
- The UN Refugee Agency. 2017. UNHCR Asylum Trends. http://www.unhcr.org/figures-at-a-glance.html. Accessed June 5, 2017).
- Wright, R., M. Ellis, and V. Parks. 2005. “Re-placing Whiteness in Spatial Assimilation Research.” City and Community 4 (2): 111–135. doi: 10.1111/j.1540-6040.2005.00107.x