
ABSTRACT
Sparsely Populated Areas are perceived as regions with the least human impact but the greatest potential for change. For some decades, the human geography of sparsely populated areas has attracted studies seeking to explain and differentiate their economic and demographic polarization in comparison to respective national averages. Evaluation of the economic, demographic and social progression of these sparsely populated areas is however obfuscated by the absence of globally agreed definitions on the qualifying criteria and, concurrently, inconsistent nomenclature to identify such regions internationally. Therefore, the aim of this study is to demonstrate the capacity for a globally consistent typology to identify the economic and demographic patterns in common, but within very different environmental constraints and institutional frameworks. To do so we focus on first-tier subnational geographical units with extremely low population densities and apply multivariable typology to understand and differentiate the key demographic and economic issues for sparsely populated areas. Using multivariable typology we identify three types of demographic and economic patterns as ‘marginal’, ‘semi’ and ‘very remote’ sparsely populated areas. The results emphasize the diversity of circumstances among these areas as a result of their past economic and demographic trajectories, but also as functions of institutional and political constraints.
1. Introduction
The human geography of sparsely populated areas (herein SPAs) has attracted studies seeking to explain and differentiate their economic and demographic polarization in comparison to respective national averages (for example, Carson Citation2011; Dyrting, Taylor, and Shalley Citation2020). From a policy perspective, many of such areas have been viewed as lagging or problematic, as evidenced by the seeming intractability in their capacity to deliver high standards of living to residents and meet perceived opportunities to contribute to national wealth (Huskey and Morehouse Citation1992).
Despite the accumulation of such studies, evaluation of the economic, demographic, environmental and social progression of regions considered as ‘remote’, ‘frontier’, ‘sparsely populated’ and ‘edge’ is obfuscated by the absence of globally agreed definitions on the qualifying criteria and, concurrently, inconsistent nomenclature to identify such regions internationally (for example, Pugh and Dubois Citation2021; Le Tourneau Citation2020; Huskey Citation2006; Karácsonyi and Taylor Citation2022). Past studies have highlighted there are inconsistencies in the naming and application of definitional terms applied in social science research on SPAs. For example, Carson et al. (Citation2011) noted the terms ‘rural’, ‘peripheral’, ‘remote’ and ‘sparse’ are often used interchangeably, while there is an emerging scientific consensus that SPAs are a distinct geographical space with features distinguishing them from urban and rural areas (see Carson et al. Citation2011; Carson and Carson Citation2014; Taylor et al. Citation2016; Le Tourneau Citation2020; Karácsonyi and Taylor Citation2022).
Nevertheless, SPAs continue to be targets for specific economic development and population growth policies. In Australia, for example, a national multi-year investment policy is in place. The Our North, Our Future: White Paper on Developing Northern Australia (see Australian Government Citation2015) policy aims to trigger large leaps forward in infrastructure, investment and population growth for the northern half of the continent. The north of Australia includes some of the most sparsely populated areas globally, but also relatively large cities such as Townsville (population: 180,000), Cairns (150,000) and Darwin (130,000; ABS Citation2021). This active Australian policy example highlights that SPAs are not conveniently definable, or at least their constitution is contestable; lacking precise and policy-orientated methods for their delimitation (Huskey Citation2006). In line with this, recent work by Le Tourneau (Citation2020) emphasized that SPAs are typically labelled with terms and development concepts that are country-specific such as the ubiquitous term ‘outback’ for Australia, ‘rural’ in Canada and ‘sertão’ in Brazil. Universality in the definition of SPAs does, however, exist within the European Nordic countries (Glorensen et al. Citation2005; Dubois and Roto Citation2012, etc.), the European Union (Schürmann and Talaat Citation2000) and the OECD (Dijkstra and Poelman Citation2008, etc.).
Despite these ambiguities and definitional issues for research on SPAs, ongoing expansions in the availability and quality of data on a global basis does permit important cross-comparative research. Accordingly, the aim of this study is to demonstrate the capacity for a globally consistent definition of SPAs to be applied to the analysis of common economic and demographic patterns they face, even though their institutional frameworks and environmental constraints are very different. We focus on first-tier subnational geographical units with extremely low population densities. While variations in the size and zoning of these first-tier subnational jurisdictions are ‘part of the problem’, as constructs of prevailing national and regional social, cultural and political frameworks (see Dubois and Roto Citation2012; Huskey Citation2006; Väätänen Citation2019), the methods engaged here demonstrate them as fit-for-purpose in the primary aim in this study, which is to provide a quantitative approach to systematically understand common demographic and economic patterns across diverse SPAs globally.
While there have been many studies which have tested and discussed alternative remoteness and sparsity measures, as well as quantitative regional typologies (see Stepanova et al. Citation2020), our focus is on identifying common demographic and economic patterns for the extremely low population densities observed in SPAs. The purpose of this paper is motivated by the observations of Carson and his co-authors (see Carson et al. Citation2011; Carson and Carson Citation2014) that, although SPAs encompass demographically, economically and environmentally diverse regions, there are commonalities associated with their distances from the cores of political influence, economic activity and population growth, and SPAs are themselves adversely and fundamentally challenged by their low population densities (Carson et al. Citation2011; Taylor et al. Citation2016). These and other economic and geographic studies on remote regions (for example, Le Tourneau Citation2020) highlight that policy shortcomings for SPAs are sometimes a function of inchoate attention to internal diversities in the characteristics (economic, demographic), institutional actors and historic influences shaping development trajectories for SPAs (Taylor et al. Citation2011).
To enact our global study, we determine a population density threshold for around 1,500 subnational units using GlobalDataLab’s Subnational HDI database (accessed at globaldatalab.org). By applying this threshold for SPAs we delimit first-tier subnational units, subjects for further multivariable analysis. Prior to this, we summarize and review definitional and typological concepts associated with SPAs from a broad stock of literature to help explain our qualification method as ‘SPAs’ or ‘other’. Subsequently we apply GIS mapping and quantitative multivariable typology, factor and cluster analysis to understand and differentiate the key demographic and economic patterns for the selected jurisdictions with extremely low population densities. Lastly, we undertake literature-based analytical discussion to highlight the contribution of this work to understanding demographic and economic patterns for SPAs.
2. Addressing definitional and typological challenges for sparsely populated areas
As with the term ‘rural’, there are empirical and epistemological limitations in defining SPAs as a distinct type of region. Some of these challenges were summarized by Le Tourneau (Citation2020), who distinguished four criteria by which SPAs can be defined, identified and distinguished from rural areas. These were: low population density, remote location, isolation and socio-economic ‘otherness’ when compared to rural areas (see p. 75). He also provided a global typology framework for SPAs based on the three dimensions of demographic, economic and ecological intensity. These separate dimensions highlight that SPAs are generally low density areas in terms of populations and economic activities, where the ecological intensity (number of species, density of biomass, etc.) ranges from very high, such as in the Amazon rainforest, to very low, as with the vast desert of Sahara and the cold Arctic.
A further and major challenge in achieving global consistency in defining SPAs as distinct spaces is that existing literature interprets sparse areas within developing and developed countries in fundamentally different ways. In the developing context, SPAs are understood as places of primitive economic accumulation (Di Tella Citation1982; Barbier Citation2005), where abundant resource commodities exist which are ‘ripe’ for exploitation (Barney Citation2009). Accordingly, SPAs in developing countries are the ‘contested spaces’ of neo-colonial frontier conquests (Barbier Citation2005; Tsing Citation2005; Geiger Citation2008) including in many cases, a conquest of the original inhabitants of the lands in which resources are located, such as for the Amazon Basin (see Cleary Citation1993; Geiger Citation2008) and the Southeast Asian highlands (see Tsing Citation2005; Barney Citation2009; Rippa Citation2019). Nevertheless, the significance of indigenous populations and their struggle for land rights (see Peluso and Lund Citation2011; Rasmussen and Lund Citation2017) is also emphasized in the context of developed countries (see Kassam Citation2001; Howitt Citation2001; Instone Citation1999; Howitt and Jackson Citation1998; Bohl-van den Boogaard, Carter, and Hollinsworth Citation2017; Taylor, Tátrai, and Erőss Citation2018), which, according to Carson and Koster (Citation2012) provides certain grounds for comparisons.
In many respects, SPAs in developing countries are encapsulations of the frontiers described by Innis (Citation1936) and other post-Staples scholars (for example, Wellstead Citation2007; Hayter Citation2003) as areas which should be exploited for their staple commodities. Conversely, in the western developed context, literature and policies for SPAs often interprets and discusses them as problematic due to their physical, economic and political limitations which impact their security, welfare and autonomy (Huskey and Morehouse Citation1992). In this context, remote studies often focus on institutional conditions (Huskey Citation2006; Carson and Koster Citation2012), the role of governments in the economy and the relationships between central governments and the remote subnational units and their populations (Huskey and Morehouse Citation1992). Such studies primarily focus on barriers to development and population growth, accessibility, technological constraints and improvements; as well as changes to policy frameworks (Huskey Citation2006).
While natural resources have and continue to be significant for SPAs, over-dependence on resources is widely discussed as a reason for poor growth performance in developing countries where the most common natural resource is agricultural land (Barbier Citation2005), since land conversion generates significantly less revenues compared to mineral extraction. However, development trajectories based on mineral extraction are also well known to be subject to boom-and-bust cycles as a result of fluctuations in global markets for the commodities at hand (for example, Barbier Citation2005; Carson Citation2011; Taylor et al. Citation2011) or when the resource itself is depleted (Hutton Citation2007). This makes resource-dependent SPAs vulnerable economically and socially (Productivity Commission Citation2017). These cycles are created by fluctuating world market prices which cannot consistently cover the tremendous costs of production and transportation from SPAs to markets while, in the longer term, SPA settlements and economies reliant on reserves of these resource deposits are finite (Huskey and Morehouse Citation1992).
A further challenge to understanding SPAs is the focus on the perceived uniqueness of these areas within certain countries or continents (see Väätänen Citation2019 on the ‘perceived reality’ of the Arctic), instead of emphasizing their common characteristics (Dubois and Roto Citation2012). Diversity in definitions for SPAs are largely a function of county-specific terms and concepts used to define them. To illustrate this, in we provide examples of a range of national and regional definitions. These can be grouped under the themes of population potential, population density, accessibility and combinations of these. The word ‘potential’ in the former refers to the number of people present within certain radiuses, providing a spatially moving average density (see Brezzi, Dijkstra, and Ruiz Citation2011; Dijkstra and Poelman Citation2008), a continuous measure in contrast to population density which reflects averages for discrete areas (geographical jurisdictions), thus bypassing the problem of administrative unit sizes and zoning differences (Carson and Koch Citation2013). Meanwhile, the density-based definitions emphasize there is a positive association between population density thresholds for SPAs and the average national population density. For example, according to Stepanova et al. (Citation2020), SPAs in Russia are those jurisdictions having a population density below one-third of the country’s average and designated as SPA by government decree. Furthermore, the US Census Bureau, which was the first to provide a universal definition, updated the moving boundary of SPAs forming the frontier line of settlement every ten years between 1790 and 1890. This reflected the political nature of the conquest of sparse areas (‘the frontier’) which was the main national policy goal at that time (Wakefield Citation2012). Since then, higher thresholds have been applied for defining SPAs in the USA because of the increased average national population density (see Wakefield Citation2012; Wilger Citation2016). This illustrates the liminal nature of these spaces and the strong political motives and contestations around them (Karácsonyi and Taylor Citation2022).
Table 1. Examples for national or regional definitions for sparseness and remoteness (Source: Authors’ own compilation).
The discussion to date highlights issues of definition, scale and zoning (see Carson and Koch Citation2013) in relation to SPAs. This context emphasizes that cross-comparative international research on SPAs is challenging due to varying definitions, methods for qualification as an SPA, and from the legacies of institutional and political frameworks as a result of the roles of SPAs in nationalistic and geopolitical policies (Taylor Citation2016). In this sense, the size and zoning variations of these jurisdictions are ‘part of the problem’ which is the product of nation – and region-specific historical processes. SPAs are ‘constructed’ and ‘institutionalised’ by the prevailing social, cultural and political frameworks (see Huskey Citation2006; Dubois and Roto Citation2012) to be subsequently ‘enacted’ by discourses (see Fitjar Citation2013; Väätänen Citation2019). Existing frameworks for and discourses about SPAs stem from the conceptualization of regions where ‘region’ because a body of literature posits regions of all types as non-predetermined and non-static constructs (see Murphy Citation1991; Paasi Citation1991, Citation2002). One way of overcoming this challenge is to narrow the focus to an investigation of jurisdictions with extremely low population densities. This approach standardizes the definition to facilitate analysis of economic and demographic patterns under very different environmental, political and institutional frameworks. We can consequently hone-in on delivering SPA-associated common economic and demographic patterns for better understanding extreme population sparsity and the associated demographic and economic patterns. In the next section, we explain the sources of data and methods related to that process.
3. Materials and methods
To determine the areas which qualify as an SPA we calculated population densities for 1,474 subnational geographic units using their most recent population numbers available at GlobalDataLab’s subnational HDI database (Version 4.0) and their areal sizes computed using ArcGIS. GlobalDataLab is an open-access database which includes a broad range of subnational socio-economic development indices for jurisdictions of all countries of the world utilized in this study. We then ranked population densities of subnational units on a logarithmic scale as shown in . It can be observed that the number of subnational units with densities between around 4 and 1,000 persons/km2 grows exponentially, but below and above these values the changes in densities are even more dramatic. From this we can identify outlying regions which are either extremely sparse (the left-end of the logarithmic curve) or extremely dense (highly urbanized units at the right end of the curve). Consequently, in defining units as sparsely populated we selected a cut-off density threshold of 4 persons/km2 to reflect the significant drop-off in unit densities below this (). This cut-off yields 195 first tier subnational units globally. As validation, jurisdictions below 4 persons/km2 density incorporates areas considered as extremely sparse, such as Arctic zones and deserts.
Figure 1. First-tier subnational units ranked on a log scale by population density (Source: Authors’ calculations based on data by GlobalDataLab.).
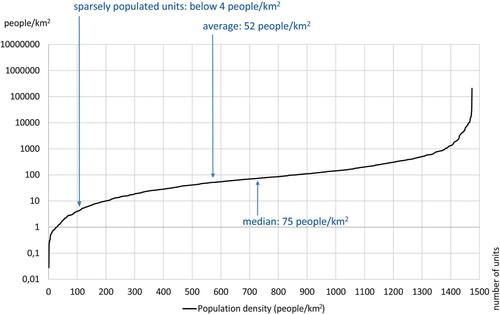
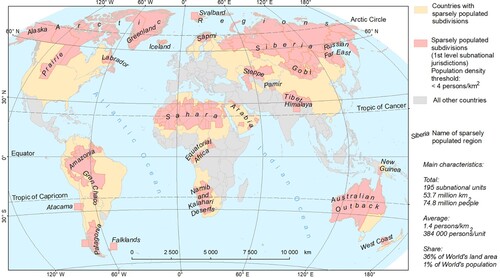
The 195 SPAs as defined by our density threshold represent 36% of Earth’s total land area (53.7 million km2) but just 1% of the global population (74.8 million people) with an average population density of 1.4 persons/km2 (). Since their areal sizes span a broad range, we merged SPA units if they were very small in area (below 5% of the largest jurisdiction, Republic of Sakha in Russia) and adjacent within one country to decrease areal size and population number heterogeneities, and because some administrative units were already aggregated in the GlobalDataLab database. This aggregation was also possible because our aim is not to provide a global typology for all sparse first tier subnational administrative units as defined by the 4 persons/km2 density threshold, but to understand common demographic and economic patterns associated with SPAs. As a result of this aggregation process, the number of analysed units was reduced to from 195 to 91 and these are shown in .
Figure 2. First-tier subnational (sparsely populated) jurisdictions below 4 persons/km2 density (Source: Calculation and cartographic design by the authors. ArcGIS shapefile provided by GADM).
To understand their characteristics and differentiate demographic and economic patterns in SPAs, we sourced demographic and economic data for the selected 195 first-tier subnational units. We calculated the weighted arithmetic means for ratios, densities and changes and applied these to the 91 units if they were not already aggregated. Indicators were sourced from a range of international organizations including the GlobalDataLab (Human Development Indices database and the Area Database), the World Bank’s Subnational Population Database and others. The sources for and specifications of indicators are listed in . We also calculated a range of derived indicators using existing data such as population change. Distance and accessibility were calculated using Google Maps and Google Earth. We used shapefiles provided by the Database of Global Administrative Areas (GADM) and GlobalDataLab to map the results in ArcGIS.
Table 2. Indicators for first-tier subnational units in the survey (Source: authors’ own).
We applied Principal Component Analysis (PCA) using the above indicators. Some of the indicators were correlated and consequently we were able to significantly reduce the dimension while retaining a large amount of the total variation of variables in the initial dataset. PCA is a multi-variable method of dimension reduction to perform a linear decomposition of the initial variables into a set of components ranked by their ability to explain the covariance within the variables in the initial dataset. The resulting factors (components) represent composite and uncorrelated dimensions. During the selection of variables from the initial dataset we aimed to exclude those indicators having low communalities and those having high factor weights on more than one component, the former because they do not contribute to either components, the latter because they do not differentiate. This was undertaken to extract the best-fit model with the lowest possible number of composite dimensions which still has an explanatory strength greater than 1. An explanatory strength of less than 1 means the factor explains less than even a single original variable and therefore has no value as a composite. It is also essential to choose not only a statistically sound, but theoretically meaningful factor-structure to capture demographic and economic patterns for SPAs such as those related to socio-economic performance (for example, HDI, GRP per capita), intra-national disparities (like HDI compared to the national average) and remoteness (see Huskey and Morehouse Citation1992; Carson Citation2011; Le Tourneau Citation2020).
We then used the factor scores from the PCA in a hierarchical cluster analysis based on Euclidean distances (the length of a straight line joining two points) and the within-groups linkage method to create clusters. These clusters articulate the main types of demographic and economic patterns characteristic of extremely low population density areas. To better understand the meaning of the clusters we applied cross-tabulations by calculating the weighted arithmetic means of all available indicators in the initial dataset for each cluster where the population sizes of the 91 units served as weights.
4. Results
The PCA-based analysis for the 91 SPA units allowed us to factor the selected 11 standardized measures of demographic and economic characteristics listed in into two dominant composite factors. The first factor is weighted more on life expectancy, working age and young populations, urbanization level, Human Development Index (HDI), per capita GRP and HDI compared to the national average. The first factor explained 39.8% of the variance of the initial dataset (). Based on factor loadings we interpreted the first dimension as the latent measure for socio-economic performance. The second factor is weighted more on gender ratio and population density compared to the national average, population density without the largest settlement and the size of the largest settlement. The second factor accounted for 16% of the variance, such that the combined variance explained by these two components was 55.8%. Based on factor loadings we interpreted the second dimension as the latent measure for remoteness and otherness.
Table 3. The extracted principal components (Source: Authors’ own calculations).
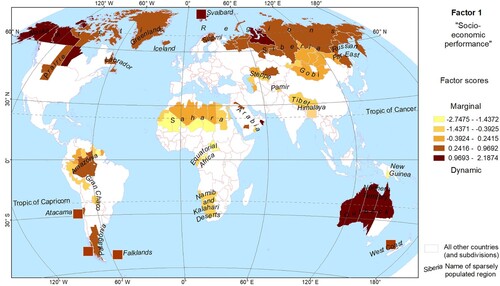
Factor scores for socio-economic performance (F1) represent demographic and wealth differences between nations with SPAs based on the large factor loadings on per capita GRP, life expectancy and particularly HDI. The choice of resource to be exploited, be it minerals or agricultural land, is strongly influenced by these wealth differences through the varying income levels. As shown on , high (positive) scores for this factor are found mostly in areas where high income mineral extractive industries are prominent, such as in the Arctic, North America and Svalbard, Yamalo-Nenets region in Russia and in inland areas of Australia. In contrast, low factor scores represent low income marginal areas, primarily in low income developing countries such as those in Sub-Sahara Africa. Hence, F1 has also high factor loadings on the age composition measures which also reflects the difference between developing and developed countries.
Figure 3. Scores of PC1 – Socio-economic performance factor (Source: Authors’ own calculations).
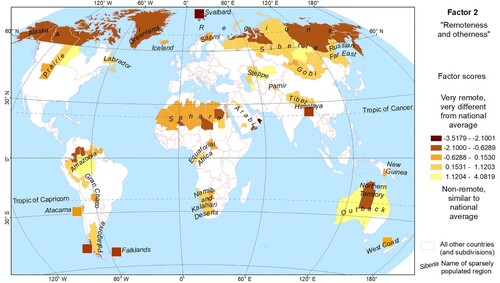
In we mapped factor scores for the remoteness and otherness (F2) which represent differences between SPAs and the respective national averages. Low (negative) scores indicate remote, less accessible regions which are very dissimilar compared to the national averages and found mostly in the Arctic, particularly in Alaska, Greenland, Northern and Eastern Russia, the Northern Territory (NT) of Australia, Southern Chile and in Canada north of the 60° parallel. There are also some local (relative) extremes, such as the Colombian and Venezuelan part of Amazonia. High (positive) scores represent units closer to their national averages, with relatively higher population densities and with significant urban centres within the unit.
Figure 4. Scores the PC2 – Remoteness and otherness factor (Source: Authors’ own calculations).
shows the 3-cluster solution from a hierarchic cluster analysis where the two factors by PCA served as two independent dimensions. The three clusters are mapped and the cluster dendrogram showing the hierarchic relationship between clusters is presented in . To further supplement the interpretation of the three clusters we calculated, along the average factor values, the averages of all the available indicators for each clusters, as seen on .
Figure 5. Three main types (clusters) of socio-economic patterns associated with SPAs (Source: Authors’ own calculations).
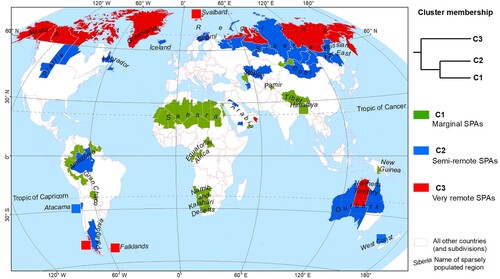
Table 4. Main characteristics of the three clusters and SPAs in general (Source: Authors’ own calculation).
According to the average values listed in , Cluster 1 (C1) SPAs are relatively remote areas with a moderate sized capital city and significant populations scattered across the space outside the capital. We have called these marginal SPAs. These regions have the poorest economic performance among the three clusters and are even less wealthy than their national averages. These C1 SPAs are the least urbanized but are also characterized by the fastest population growth compared to the two other clusters and to their respective national averages. Based on these characteristics, C1 SPAs resemble marginal SPAs with symptoms of social and economic disadvantage. SPAs of this cluster are located typically in low income countries. Examples include Equatorial Africa, Papua New Guinea, the Amazon rainforest and the Gran Chaco in South America (see ). Most of these marginal areas are described by the literature as neo-colonial frontiers in developing countries where the most important resource is agricultural land (see Barbier Citation2005; Geiger Citation2008). Population increases in these SPAs are driven by high natural growth rates or, in some cases, by immigration from overpopulated regions to these marginal frontier areas.
Cluster 2 (C2) represents relatively more populous SPAs characterized by the highest population densities and large capital cities which have significant shares of the SPA’s total population. C2 SPAs have a larger economy and a higher share of working age population and the highest life expectancy and urbanization level compared to the other two clusters. We call these semi-remote SPAs. They are less distinct from their national averages and relatively less remote. Consequently, these C2 SPAs do not in general contribute to significant spatial differentiation and polarization within their sovereign nations, which are sometimes sparsely populated countries on average, such as Australia. In these C2 SPAs, while most of their areas are extremely sparse, significant urban cores are to be found such as Perth (population 2.1 million, ABS Citation2021) in Western Australia, Manaus in the Brazilian Amazon and the major industrial centre of Karaganda in Kazakhstan, or, sometimes a network of significant urban centres such as the coastal cities of Queensland in Australia. Based on the literature, many of these regions still face challenges associated with economic dependence on the resource sector – sometimes also known as the ‘resource curse’ (see Sachs and Warner Citation2001). Examples include Manaus’s 19th century’s rubber boom and many of the Queensland coastal cities, such as Gladstone and Townsville which rely on coal and ore mining and exports. These C2 SPAs represent the edges of macro regions of classical European settler colonization with relatively moderate climates. They have become significant staples regions and by that relatively more populated. These include North America south of the 60° parallel, Argentina and Australia. Kazakhstan, Siberia and the Russian Far East were also subject to significant agricultural colonization and industrialization during the Russian imperial and Soviet rule, while Mongolia served as a frontier between the Russian and Chinese empires (Lattimore Citation1947). In Northern Scandinavia, Sápmi, the land of the Sami people, was also targeted for colonization (see Ween and Lien Citation2012).
Cluster 3 (C3) represents SPAs facing the most extreme challenge of being very remote SPAs. Their economies are dependent on external support and they are without major population centres (on a global scale) but characterized by high levels of economic performance. These regions are very distinct from their respective national averages as SPAs of real extremes. Based on their characteristics they represent the classical ‘remote edges’ with their very distinct economic, demographic and settlement features (see Carson et al. Citation2011; Taylor Citation2016) and include the Northern Territory of Australia, Alaska and Greenland.
The two independent (uncorrelated) dimensions of ‘socio-economic performance’ and ‘remoteness-otherness’ factors are visualized in as two axes of a coordinate system where all 91 geographical units were located by their factor scores. The distance between units within the two-dimensional ‘factor-space’ represent their (dis)similarities in terms of their characteristics. The origin of the coordinate system is the average represented by the 91 units because the factor scores are standardized measures, hence their average is 0. The larger the distance of the unit from the origin the more outlying the SPA is such as the most outlying Queensland in Australia is the least SPA-like unit. Queensland is characterized by densely populated coastal areas with numerous relatively large urban centres such as Brisbane (population 2.5 million, ABS Citation2021). On a 4-clusters solution Queensland would form a separate cluster instead of being member of Cluster 2 (C2). Queensland is the most different, while the far northern Arctic jurisdictions are the most similar to the Northern Territory of Australia, despite the significant climatic differences. Furthermore, the Al Wusta governorate, where most of the country’s oil and gas is mined, is the sparsest region of Oman without any significant settlement making it an extreme outlier. Lastly, the Sahara regions of Chad are extremely marginal and military conflict-prone areas.
Figure 6. Cluster plot demonstrating the analysed units within the two dimensional factor-space (Source: Authors’ own).
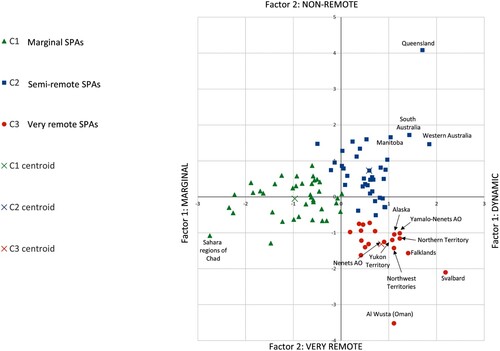
In summary, the results have yielded two uncorrelated dimensions which characterize the sparsest first-tier subnational units globally. The first explains regional dynamism based on economic and demographic performance and reflects the value of the extracted resource in the region, such as difference between mineral resource and land conversion led economies. The second dimension explains the magnitude of their remoteness and otherness: both physical remoteness and demographic otherness when compared to respective national averages.
5. Discussion
This study aimed to fill gaps in global studies on SPAs by providing a comprehensive global-scale quantitative analysis of the demographic and economic characteristics of first tier subnational jurisdictions with extremely low population densities. Principal component analysis and the subsequent cluster analysis produced observable geo-spatial, demographic and economic clustering along two axes (see and ). These indicate the purposefulness of the data sources applied to these analyses, the definitional cut-off (of less than 4 persons/km2) and the choice of methods. At a meta-level, therefore, the study demonstrates that, in spite of there being a wide-range of definitional approaches to SPAs, global comparative research is both worthwhile and revealing. Our results demonstrate that heterogenic characteristics dominate the economic and demographic functioning of SPAs; with these explained in part by their socio-economic dynamism and remoteness-otherness, but by no means exclusively. It is possible to interpret the clusters in the light of historical, political and institutional factors which illustrates their impact on current circumstances such as land conversion for marginal SPAs and staples trap for semi – and very remote SPAs; a theme which is noted in the literature on demographic ‘path dependency’ or economic ‘lock-in’ for SPAs (for example, Carson and Carson Citation2014).
While SPAs are represented as demographic and economic extremes within their respective nations, when we examined the spatial, economic and demographic characteristics of populations and settlement patterns within these we observe diverse outcomes. On average their population densities are about four times less than their respective national densities, but this average includes some outlier regions, such as the sparse desert area of the New Valley governorate of Egypt, which is contrasted to the extremely dense Nile Valley. Furthermore, in Canada there are significant differences between SPAs located north and south of the 60° parallel with the latter ones closer to the national average. By contrast, in nations which are sparsely populated overall, such as for Australia, SPAs usually do not represent extreme intra-national disparities, and these regions are not regarded as problem areas for their remoteness and sparsity at the first-tier subnational level. The most outlying regions are the members of our very remote (C3) SPA category. These regions count almost for one-third of all SPAs in area but just 5.1% of the global SPA-population. Such regions are least equipped to transition from resource dependency and the swings in population and economic growth it brings (Productivity Commission Citation2017).
Despite their image as sparsely populated and vast regions, SPAs may nevertheless be characterized by the large and increasing concentration of a significant proportion of population in the largest settlement. In this sense, there exists a growing spatial inequality within SPAs (Huskey and Taylor Citation2016). identifies that on average one third of the population in all of the SPAs in this study live in the largest settlement. In some extreme cases, such as Boa Vista in the State of Roraima (Brazil), Perth in Western Australia and Whitehorse in the Yukon Territory (Canada), four out of five people live in the SPA’s capital. By contrast, marginal (C1) SPAs have a more dispersed population distribution which is a function of their economic profile focused on agricultural activity (typically cattle or sheep grazing) is spatially more dispersed compared to mineral resource exploitation (Barbier Citation2005; Taylor Citation2016).
It should be added, however, that SPAs in general show lower levels of urbanization compared to their nation’s average, particularly for marginal (C1) and very remote (C3) SPAs in our analysis. These averages hide large differences in urbanization between SPAs globally. For example, SPAs in Russia have significantly higher urbanization levels when compared to those in North America or the Arctic outside of Russia. This is because during the Soviet period of rule, administrations placed a heavy focus on populating these regions for geo-political, economic and policy-related reasons (see Carson et al. Citation2011; Treivish Citation2005; Stepanova et al. Citation2020; Gresina Citation2021 and others). Consequently, several large urban centres such as Novy Urengoy, Norilsk, Magadan and Petropavlovsk-Kamchatsky with more than 100 thousand residents are present in the very remote (C3) areas of Russia.
Extending this, our study has re-enforced that spatial remoteness is a distinguishing feature of SPAs where the average distance between the largest settlement of the SPA and the nearest city with 100 thousand residents is around 500 km. This by far exceeds the definitional and qualifying rules for SPAs in the context of the European Union, Scandinavia and the continental USA excluding Alaska (see ). These distances are the largest, more than double the SPA average, for very remote (C3) SPAs, signifying remoteness is a persuasive challenge for economic and demographic progress in these regions. This extreme level of remoteness for C3 regions also sets them apart from the two other SPA-groups established by our PCA analysis. It means that poor accessibility is not simply one disadvantage among others but is the most significant obstacle to sustaining population and economic growth for very remote SPAs. The interesting sub-text in policies such as Australia’s Our North, Our Future is the inherent recognition that remoteness and sparsity are overwhelming challenges, generating sub-optimal socio-economic and demographic conditions for residents, and in particular Indigenous residents. One of its goals is to grow the population of northern Australia by four-fold by 2060 to a population of between four and five million in order to ‘ … underwrite substantial exports of planning, design, architecture and construction services to the Tropics’ (Australian Government Citation2015, 3). At the time of writing, the population of the north was just 1.2 million (author calculations from ABS Citation2021) and largest city in was Townsville at 180,000 residents (ABS Citation2021). This lofty and pro-growth approach seems to suggest that remoteness can be supplanted through population growth, without qualifying notions of how or why; the unwritten ‘solution’ to the wicked problems SPAs is seemingly to make them less SPA-like.
In contrast to semi – (C2) and very remote (C3) SPAs, marginal (C1) SPAs, for example in Africa (see Abiodun, Oluwasegun, and Adebola Citation2020) and in Amazonia (see Walker et al. Citation2009; Schmink et al. Citation2019; Klingler and Mack Citation2020) are experiencing rapid population growth and settlement expansion which exceeds their national averages. Even though rapid population growth and overgrazing is present in these areas, the direct link between overpopulation and land degradation (deforestation and desertification) is questioned in recent literature. That is, experts highlighted the role of very uneven population distributions within these areas (see Little Citation1994) and the lack of overlap between deforestation and population distribution, mainly because deforestation is driven by big corporations rather than by smallholders or the indigenous populations (see Tritsch and Le Tourneau Citation2016; Hecht Citation2005). Furthermore, grazing is no longer the major livelihood for the majority in these areas as a result of social changes (see Chanda et al. Citation2003; Thomas and Twyman Citation2004). Still, marginal (C1) SPAs are experiencing the most dynamic population growth among SPAs and are likely to be subject to shifts in land use patterns and become more densely populated over time, eventually exceeding semi-remote SPAs (C2) and even the 4 persons/km2 threshold we determined for this study. Examples include SPAs in Equatorial Africa and in Amazonia. The total population of SPAs is also growing in all three categories, while there are some SPAs which are declining in absolute terms. These are mostly in Russia, however, Treivish (Citation2005) highlighted that despite the decline these Russian SPAs are still more densely populated than their counterparts in Canada or Alaska. Furthermore, very remote (C3) SPAs have the slowest growth, lower than the category’s national average, notably in the Northwest Territories (Canada), the Northern Territory (Australia) and Alaska.
In terms of per capita GRP, the very remote (C3) cluster represents the wealthiest SPAs (see Barbier Citation2005 on mineral resources), and these are most different to their national averages in most of the indicators. It should be added, however, that these large differences are because the Russian regions in this cluster have comparably low per capita national GDP compared to particularly high GRP per capita in hydrocarbon-rich regions (see Spies Citation2009; Eilmsteiner-Saxinger Citation2011). In high income countries (we have defined here as >12 000 USD/per capita, 2017), however, the difference is not as significant, impacting on population attraction and retention for very remote (C3) SPAs (Dyrting, Taylor, and Shalley Citation2020). These characteristics are also observable for the HDI index (see ). Greenland and Tibet are the most negatively outlying SPAs in terms of GRP and HDI compared to the national averages of Denmark and China even though they are members of two different clusters, very remote (C3) and marginal (C1) SPAs respectively. Life expectancy is lower in SPAs compared to the respective national averages, particularly in very remote (C3) SPAs, due to lower accessibility to medical services and the presence of socio-economically marginalized indigenous populations (see, for example, Carson et al. Citation2011; Taylor Citation2016; Carson and Koster Citation2012). Life expectancies in marginal (C1) SPAs, however, are relatively close to national averages because they are in developing and poor nations.
SPAs on average have a slightly lower female majority compared to the national average. Nevertheless, gender composition depends on the stage of the demographic transition the nation or the macro-region (continent) is in. High natural increase (the excess of births over deaths) and a higher share of young cohorts delivers a higher male proportion in the population, such as in low income countries where marginal (C1) SPAs are located. In contrast, aging societies have more females, typically in high income countries where very remote (C3) SPAs are also located. Thus the male dominance in C3 is particularly extreme.
Meanwhile, the ratio of working age population (15-64 years) compared to the national averages is lower in SPAs, but there are large regional differences which depend on the economic opportunities to be found in the region. In general, SPAs in high income countries and with significant mineral resource industries (mostly the very remote SPAs) are very attractive for work opportunities and they have higher ratios of working age populations. However, very remote (C3) SPAs have a much lower share of older population as a result of the out-migration of pre – and post-retirees and the relatively high representation of young indigenous people in the population (Dyrting, Taylor, and Shalley Citation2020).
Comparing and contrasting the mean values calculated for each cluster, the discussion of the specific path-dependency of certain regions such as for the Russian Arctic or Sub-Sahara Africa highlighted certain parallels with the existing literature. For instance, it helped to understand the distinct urbanization, population and economic trajectories in the Russian Arctic compared to northern SPAs of high-income nations, such as Canada and the USA, and the role of post-colonial institutional frameworks for the marginal (C1) SPAs in developing nations that Tsing (Citation2003, Citation2005) described as the ‘sphere of friction’ and Barbier (Citation2005) called the land conversion frontier.
Furthermore, very remote (C3) SPAs were found to be extremely different to the other two other clusters as distinct remote ‘edges’ based on their fundamental ‘otherness’. These very remote SPAs can be identified by population (labour force) scarcity (see Glorensen et al. Citation2009), in contrast to rural areas where lesser job and career opportunities generate constant rural to urban migration, or where cheaper rural housing and environmental amenity can lead to counter-urbanization (see Raagmaa Citation2003), attributes which are largely absent at very remote SPAs in particular (see Carson Citation2011).
In contrast, we called Cluster 2 semi-remote SPAs, because their economic and demographic indicators are not too dissimilar to their national averages. These regions represent a combination of significant urban cores and the adjoining rural areas along with extremely sparse areas. These first-tier subnational jurisdictions along with some of the marginal SPAs of the Amazon region resemble what Le Tourneau (Citation2020) called the ‘rural-SPA continuum’ where it is impossible to clearly distinguish that which is rural and that which is ‘beyond’ rural.
The results of our quantitative analysis thus highlighted three different types of demographic and economic patterns present in sparsely populated first-tier subnational jurisdictions and the relationship between these three different types were discussed here in a systematic way, and by that, crosscut the simplistic developed-developing world distinction in relation to SPAs.
6. Conclusions
In this study we have developed a global picture of the economic and demographic characteristics and commonalities for SPAs by applying the technique of PCA to ascertain and differentiate three types for such regions. While purposeful and informative for policy making and in addressing gaps in this area of study, any complex global typology encompassing subnational units with a broad spectrum of diverse demographic, economic and institutional-jurisdictional settings will involve a degree of generalization. Likewise, data used in this study is imperfect in so far as some will represent incomplete coverage of populations or will contain bias or errors. Consequently, we are reluctant to have claimed through our results to have developed an empirically-based geographic typology of first-tier subnational jurisdictions across the globe and instead our typology has identified some of the socio-economic characteristics associated with extremely low jurisdictional population densities. Furthermore, SPAs are specific regions where economic and demographic performance are strongly related to resource booms and rapid changes in population and economic growth in general (Taylor Citation2016). The point-in-time nature of the data modelled here means that model results may differ across time, thus potentially constraining the geographic universality and persistence of the findings herein.
Additionally, regions are non-predetermined social constructs (Murphy Citation1991) and do not exist as an isolated phenomenon (Murphy and O’Loughlin Citation2009) in space or time (Paasi Citation1991). This dynamism is particularly the case in SPAs (Tsing Citation2003; Barbier Citation2005; Geiger Citation2008; Fitjar Citation2013; Woodworth Citation2016; Väätänen Citation2019). Hence our pre-defined ‘theatre’ means some regions might not be in-scope if the study is repeated in future due to population increases, as is the case now with land conversion frontiers in Southeast Asia, mostly in Borneo, Laos and Cambodia which are the focus of much of the contemporary work on neo-colonial frontier studies (Tsing Citation2005; Barney Citation2009). Nevertheless, while our 4 people/km2 threshold could be debated empirically for its subjectivity, its selection is based on the existing literature and it provides a suitable, if not perfect, basis for the analysis presented here. Hence, we do not claim the demographic and economic patterns highlighted here exist exclusively at the first-tier subnational level or exclusively in those jurisdictions we have selected here.
We used first tier subnational jurisdictions because these are legally defined areal units with designated boundaries which are described by spatially discrete statistical data suitable for quantitative research. First-tier subnational level (regions, states, governorates, etc., and in some cases their aggregates) provide a suitable mid-ground for characterizing the problems of intra-national regional inequalities related to sparsity and remoteness, and, at the same time, the number of analysed units is not too large, making it possible to identify and collect data globally. At the first-tier subnational level, however, not all sparse places are part of the selected jurisdictions and vice versa, because spatially discrete data implies a higher level of generalization. This spatial generalization means that averages of spatially discrete data are often unrepresentative for particular places within the jurisdiction (Wakefield Citation2012), which is closely related to the problem of measuring ‘emptiness’ spatially (Le Tourneau Citation2018). For example, the density threshold applied qualifies most of Australia as SPAs since the first-tier subnational units are its seven states and territories. Thus, although these contain large cities (for example, Brisbane and Perth), the overall density of the state is below 4 persons/km2. While this is a limitation necessary for a global study of this nature it also reflects the extremely low densities outside of the cities which dominate the populations of states and qualifying as SPAs. Moreover, scholars in the SPA space have noted the disconnection in SPAs between the very sparse areas and larger cities as they relate to population, capital and education flows (for example, Carson Citation2011). To overcome this issue we calculated a population density without the largest settlement within the SPA as well and used it for our multivariate analysis.
The contribution of this study has been to capture certain phenomena posited by existing literature but never really tested in a global and comprehensive quantitative analysis, where the problem of land conversion frontiers of low-income countries and the mineral resource frontiers of high-income countries are compared and contrasted. All-in-all, SPAs represent ‘otherness’, distinct socio-economic and spatial (remoteness) challenges, particularly for very remote SPAs. Our study has confirmed that these very remote SPAs (and any subnational jurisdictional subsets showing similar demographic and economic patterns) are definitely, as described by Carson et al. (Citation2011), ‘beyond’ peripheral areas, different to rural and importantly are responsible for large intra-national demographic and economic inequalities (Taylor Citation2016; Le Tourneau Citation2020). These outcomes determine that specifically targeted regional policies are needed for these very remote SPAs. These must recognize both their internal diversity and their substantial differences to rural areas. This study highlights that the ubiquitous application of the latter term may help explain why there has been limited sustained success observed in policies for delivering better economic and social outcomes for regions ‘at the edge’. Not least, many SPAs face a volatile and uncertain future from the impacts of climate change due to their fragile desert, permafrost, and other ecosystems and, for some, high growth in human populations.
Acknowledgement
We would like to thank the two anonymous Referees for their comments, which greatly helped to improve the flow of our manuscript. We also thank Dr Sigurd Dyrting and Prof. Ferenc Probáld, emeritus professor at Eötvös Loránd University, Budapest, for helpful comments on an earlier draft of this paper.
Disclosure statement
No potential conflict of interest was reported by the author(s).
Additional information
Funding
References
- Abiodun, T. F., A. J. Oluwasegun, and A. F. Adebola. 2020. “Environmental Problems, Insecurity in the Sahel Region and Implications for Global Security.” Ibadan Journal of Peace and Development 10 (1): 165–180.
- ABS (Australian Bureau of Statistics). 2006. Australian Standard Geographical Classification (ASGC) Remoteness Structure (RA) Digital Boundaries. Accessed November 4, 2021 https://www.abs.gov.au/AUSSTATS/[email protected]/DetailsPage/1259.0.30.0042006?OpenDocument.
- ABS (Australian Bureau of Statistics). 2016. Australian Statistical Geography Standard (ASGS): Volume 5 - Remoteness Structure. Accessed November 4, 2021 https://www.abs.gov.au/ausstats/[email protected]/mf/1270.0.55.005?OpenDocument.
- ABS (Australian Bureau of Statistics). 2021. Regional Population, 2019-2020 Financial Year. Accessed December 20, 2021 https://www.abs.gov.au/statistics/people/population/regional-population/2019-20.
- Alasia, A., F. Bédard, J. Bélanger, E. Guimond, and C. Penney. 2017. Measuring Remoteness and Accessibility - A Set of Indices for Canadian Communities. Statistics Canada.
- ARIA 2001. Measuring Remoteness: Accessibility/Remoteness Index of Australia (ARIA). Occasional Papers: 14. Canberra: Department of Health and Aged Care.
- Australian Government. 2015. Our North our Future. White Paper on Developing Northern Australia. Australian Government, Accessed March 13, 2021 http://northernaustralia.gov.au/files/files/NAWP-FullReport.pdf.
- Barbier, E. B. 2005. “Frontier Expansion and Economic Development.” Contemporary Economic Policy 23 (2): 286–303. doi:10.1093/cep/byi022.
- Barney, K. 2009. “Laos and the Making of a ‘Relational’ Resource Frontier.” The Geographical Journal 175 (2): 146–159. doi:10.1111/j.1475-4959.2009.00323.x.
- Bohl-van den Boogaard, T., J. Carter, and D. Hollinsworth. 2017. “‘Cause We’re Gonna Lose Big Time’: Indigenous Resource Negotiations in Settled Australia.” Geografiska Annaler: Series B, Human Geography 99 (3): 304–318. doi:10.1080/04353684.2017.1294856.
- Brezzi, M., L. Dijkstra, and V. Ruiz. 2011. OECD Extended Regional Typology. The Economic Performance of Remote Rural Regions. OECD Regional Development Working Papers. Accessed November 15, 2021 https://www.oecd.org/regional/regionaldevelopment/48670214.pdf.
- Carson, D. 2011. “Political Economy, Demography and Development in Australia’s Northern Territory.” The Canadian Geographer 55 (2): 226–242. doi:10.1111/j.1541-0064.2010.00321.x.
- Carson, D. B., and D. A. Carson. 2014. “Local Economies of Mobility in Sparsely Populated Areas: Cases from Australia’s Spine.” Journal of Rural Studies 36: 340–349. doi:10.1016/j.jrurstud.2013.10.011.
- Carson, D., P. C. Ensign, R. O. Rasmussen, and A. Taylor. 2011. “Perspectives on ‘Demography at the Edge’.” In Demography at the Edge. Remote Human Populations in Developed Nations, edited by D. Carson, P. C. Ensign, R. O. Rasmussen, L. Huskey, and A. Taylor, 3–20. Farnham/Burlington: Ashgate.
- Carson, D., and A. Koch. 2013. “Divining the Local: Mobility, Scale and Fragmented Development.” Local Economy 28 (3): 304–319. doi:10.1177/0269094212474869.
- Carson, D., and R. Koster. 2012. “Addressing the Problem of Indigenous Disadvantage in Remote Areas of Developed Nations: A Plea for More Comparative Research.” Journal of Rural and Community Development 7 (1): 110–125.
- Chanda, R., O. Totolo, N. Moleele, M. Setshogo, and S. Mosweu. 2003. “Prospects for Subsistence Livelihood and Environmental Sustainability Along the Kalahari Transect: The Case of Matsheng in Botswana's Kalahari Rangelands.” Journal of Arid Environments 54 (2): 425–445. doi:10.1006/jare.2002.1100.
- Cleary, D. 1993. “After the Frontier: Problems with Political Economy in the Modern Brazilian Amazon.” Journal of Latin American Studies 25 (2): 331–349. doi:10.1017/S0022216X00004685.
- Copus, A., and J. Hopkins. 2017. Outline Conceptual Framework and Definition of the Scottish Sparsely Populated Area. Working paper. Aberdeen: James Hutton Institute.
- Dijkstra, L., and H. Poelman. 2008. Remote Rural Regions. How Proximity to a City Influences the Performance of Rural Regions. Brussels: European Union Regional Policy, European Commission.
- Di Tella, G. 1982. “The Economics of the Frontier.” In Economics in the Long View, edited by C. Kindleberger, and G. Di Tella, 210–227. New York: New York University Press.
- Dubois, A., and J. Roto. 2012. Making the Best of Europe’s Sparsely Populated Areas. Nordregio Working Paper 15. Stockholm: Nordregio.
- Dyrting, S., A. Taylor, and F. Shalley. 2020. “A Life-Stage Approach for Understanding Population Retention in Sparsely Populated Areas.” Journal of Rural Studies 80: 439–451. doi:10.1016/j.jrurstud.2020.10.021.
- Eilmsteiner-Saxinger, G. 2011. “'We Feed the Nation': Benefits and Challenges of Simultaneous Use of Resident and Long-Distance Commuting Labour in Russia’s Northern Hydrocarbon Industry.” The Journal of Contemporary Issues in Business and Government 17 (1): 53–67.
- Enequist, G. 1960. “Advance and Retreat of Rural Settlement in Northwestern Sweden.” Geografiska Annaler 42 (4): 211–220. doi:10.1080/20014422.1960.11880945.
- Fitjar, R. D. 2013. “Region-Building in the Arctic Periphery: The Discursive Construction of a Petroleum Region.” Geografiska Annaler: Series B, Human Geography 95 (1): 71–88. doi:10.1111/geob.12010.
- Geiger, D. 2008. “Turner in the Tropics: The Frontier Concept Revisited.” PhD Thesis, Universität Luzern, Luzern.
- Glorensen, E., A. Dubois, A. Copus, and C. Schürmann. 2005. Northern Peripheral Sparsely Populated Regions in the European Union. Nordregio Report Nr. 4. Stockholm: Nordregio.
- Glorensen, E., A. Dubois, J. Roto, R. O. Rasmussen, and J. Sterling. 2009. Development Perspectives for the NSPA: Opportunities and Challenges. Nordregio Working Paper 2009:5. Stockholm: Nordregio. Accessed February 20, 2022 http://norden.diva-portal.org/smash/get/diva2:700379/FULLTEXT01.pdf.
- Gresina, F. 2021. “Chu, P-Y.: The Life of Permafrost: A History of Frozen Earth in Russian and Soviet Science. Book Review.” Hungarian Geographical Bulletin 70 (3): 281–283. doi:10.15201/hungeobull.70.3.6.
- Hayter, R. 2003. ““The War in the Woods”: Post-Fordist Restructuring, Globalization, and the Contested Remapping of British Columbia's Forest Economy.” Annals of the Association of American Geographers 93 (3): 706–729. doi:10.1111/1467-8306.9303010.
- Hecht, S. B. 2005. “Soybeans, Development and Conservation on the Amazon Frontier.” Development and Change 36 (2): 375–404. doi:10.1111/j.0012-155X.2005.00415.x.
- Holmes, J. 1981. “Lands of Distant Promise.” In Settlement Systems in Sparsely Population Regions: The United States and Australia, edited by R. Lonsdale, and J. Holmes, 1–13. New York: Pergamon.
- Howitt, R. 2001. “Frontiers, Borders, Edges: Liminal Challenges to the Hegemony of Exclusion.” Australian Geographical Studies 39 (2): 233–245. doi:10.1111/1467-8470.00142.
- Howitt, R., and S. Jackson. 1998. “Some Things do Change: Indigenous Rights, Geographers and Geography in Australia.” Australian Geographer 29 (2): 155–173. doi:10.1080/00049189808703212.
- Hugo, G. J., D. Griffith, P. Rees, P. Smailes, B. Badcock, and R. Stimson. 1997. Rethinking the ASGC: Some Conceptual and Practical Issues. Final report for Review of the Australian Standard Geographical Classification Project. Monograph series 3. Adelaide: National Key Centre for Social Applications of Geographical Information Systems.
- Huskey, L. 2006. “Limits to Growth: Remote Regions, Remote Institutions.” Annales of Regional Science 40 (1): 147–155. doi:10.1007/s00168-005-0043-5.
- Huskey, L., and T. A. Morehouse. 1992. “Development in Remote Regions: What do we Know?” Arctic 45 (2): 128–137.
- Huskey, L., and A. Taylor. 2016. “The Dynamic History of Government Settlements at the Edge.” In Settlements at the Edge: Remote Human Settlements in Developed Nations, edited by A. Taylor, D. B. Carson, P. C. Ensign, L. Huskey, R. O. Rasmussen, and G. Saxinger, 25–48. Gloucester: Edward Elgar.
- Hutton, T. A. 2007. “Contours of the Post-Staples State: The Reconstruction of Political Economy and Social Identity in 21st Century Canada.” Policy and Society 26 (1): 9–29. doi:10.1016/s1449-4035(07)70098-x.
- Innis, H. 1936. “Approaches to Canadian Economic History.” Commerce Journal 26: 24–30.
- Instone, L. 1999. “Fencing in/Fencing and: Fences, Sheep and Other Technologies of Landscape Production in Australia.” Continuum: Journal of Media & Cultural Studies 13 (3): 371–381. doi:10.1080/10304319909365808.
- Ioffe, G., T. Nefedova, and I. Zaslavsky. 2004. “From Spatial Continuity to Fragmentation: The Case of Russian Farming.” Annals of the Association of American Geographers 94 (4): 913–943. doi:10.1111/j.1467-8306.2004.00441.x.
- Karácsonyi, D., and A. Taylor. 2022. “Reconceptualising Sparsely Populated Remote Edges Through the Concept of Region and Space.” Journal of Rural Studies 92: 395–403. doi:10.1016/j.jrurstud.2022.05.001.
- Kassam, K. A. S. 2001. “North of 60°: Homeland or Frontier?” In Passion for Identity: Canadian Studies for the 21st Century, edited by D. Taras, and B. Rasporich, 433–455. Scarborough: Nelson Thompson Learning.
- Klingler, M., and P. Mack. 2020. “Post-frontier Governance up in Smoke? Free-for-all Frontier Imaginations Encourage Illegal Deforestation and Appropriation of Public Lands in the Brazilian Amazon.” Journal of Land Use Science 15 (2-3): 424–438. doi:10.1080/1747423X.2020.1739765.
- Lattimore, O. 1947. “Inner Asian Frontiers: Chinese and Russian Margins of Expansion.” The Journal of Economic History 7 (1): 24–52. doi:10.1017/S0022050700053432.
- Le Tourneau, F. M. 2018. “Using Small Spatial Units to Refine our Perception of Rural America.” GeoJournal 83: 803–817. doi:10.1007/s10708-017-9802-y.
- Le Tourneau, F. M. 2020. “Sparsely Populated Regions as a Specific Geographical Environment.” Journal of Rural Studies 75: 70–79. doi:10.1016/j.jrurstud.2019.12.012.
- Little, P. D. 1994. “The Social Context of Land Degradation (“Desertification”) in Dry Regions.” In Population and Environment, Rethinking the Debate, edited by L. Arizpe, M. P. Stone, and D. C. Major, 209–251. Boulder: Westview Press.
- Murphy, A. B. 1991. “Regions as Social Constructs: The Gap Between Theory and Practice.” Progress in Human Geography 15 (1): 22–35. doi:10.1177/030913259101500102.
- Murphy, A. B., and J. O’Loughlin. 2009. “New Horizons for Regional Geography.” Eurasian Geography and Economics 50 (3): 241–251. doi:10.2747/1539-7216.50.3.241.
- OECD. 2017. OECD Territorial Review: Northern Sparsely Populated Regions. Paris: OECD Publishing.
- Paasi, A. 1991. “Deconstructing Regions: Notes on the Scales of Spatial Life.” Environment and Planning A: Economy and Space 23 (2): 239–256. doi:10.1068/a230239.
- Paasi, A. 2002. “Place and Region: Regional Worlds and Words.” Progress in Human Geography 26 (6): 802–811. doi:10.1191/0309132502ph404pr.
- Peluso, N. L., and C. Lund. 2011. “New Frontiers of Land Control: Introduction.” Journal of Peasant Studies 38 (4): 667–681. doi:10.1080/03066150.2011.607692.
- Productivity Commission. 2017. Transitioning Regional Economies. Accessed November 15, 2021 https://www.pc.gov.au/inquiries/completed/transitioning-regions#report.
- Pugh, R., and A. Dubois. 2021. “Peripheries Within Economic Geography: Four “Problems” and the Road Ahead of us.” Journal of Rural Studies 87: 267–275. doi:10.1016/j.jrurstud.2021.09.007.
- Raagmaa, G. 2003. “Centre-Periphery Model Explaining the Regional Development of the Informational and Transitional society.” Presented at the 43rd Congress of the European Regional Science Association (ERSA), Jyväskylä, Finnland, August 27-30.
- Rasmussen, M. B., and C. Lund. 2017. “Reconfiguring Frontier Spaces: The Territorialization of Resource Control.” World Development 101: 388–399. doi:10.1016/j.worlddev.2017.01.018.
- Rippa, A. 2019. “Zomia 2.0: Branding Remoteness and Neoliberal Connectivity in the Golden Triangle Special Economic Zone, Laos.” Social Anthropology 27 (2): 253–269. doi:10.1111/1469-8676.12649.
- RRAMA. 1994. Rural, Remote and Metropolitan Areas Classification 1991 Census Edition. Canberra: Australian Government Publishing Service.
- Sachs, J. D., and A. M. Warner. 2001. “Natural Resources and Economic Development. The Curse of Natural Resources.” European Economic Review 45: 827–838. doi:10.1016/S0014-2921(01)00125-8.
- Schmink, M., J. Hoelle, C. V. A. Gomes, and G. M. Thaler. 2019. “From Contested to ‘Green’ Frontiers in the Amazon? A Long-Term Analysis of São Félix do Xingu, Brazil.” The Journal of Peasant Studies 46 (2): 377–399. doi:10.1080/03066150.2017.1381841.
- Schürmann, C., and A. Talaat. 2000. Towards a European Peripherality Index. Final Report for European Commission. Dortmund: Institut für Raumplanung.
- Spies, M. 2009. “Potentials for Migration and Mobility Among Oil Workers in the Russian North.” Geografiska Annaler: Series B, Human Geography 91 (3): 257–273. doi:10.1111/j.1468-0467.2009.00319.x.
- Stepanova, N., D. Gritsenko, T. Gavrilyeva, and A. Belokur. 2020. “Sustainable Development in Sparsely Populated Territories: Case of the Russian Arctic and Far East.” Sustainability 12: 2367. doi:10.3390/su12062367.
- Stone, K. H. 1962. “Swedish Fringes of Settlement.” Annals of the Association of American Geographers 52 (4): 373–393. doi:10.1111/j.1467-8306.1962.tb00420.x.
- Taylor, A. 2016. “Introduction: Settlements at the Edge.” In Settlements at the Edge: Remote Human Settlements in Developed Nations, edited by A. Taylor, D. B. Carson, P. C. Ensign, L. Huskey, R. O. Rasmussen, and G. Saxinger, 3–24. Gloucester: Edward Elgar.
- Taylor, A., D. B. Carson, P. C. Ensign, L. Huskey, R. O. Rasmussen, and G. Saxinger. 2016. Settlements at the Edge: Remote Human Settlements in Developed Nations. Glouchester: Edward Elgar.
- Taylor, A., S. Larson, N. Stoeckl, and D. Carson. 2011. “The Haves and Have Nots in Australia’s Tropical North – New Perspectives on a Persisting Problem.” Geographical Research 49 (1): 13–22. doi:10.1111/j.1745-5871.2010.00648.x.
- Taylor, A., P. Tátrai, and Á Erőss. 2018. “Visible Minorities in Remote Areas: A Comparative Study of Roma in Hungary and Indigenous People in Australia.” Hungarian Geographical Bulletin 67 (1): 43–60. doi:10.15201/hungeobull.67.1.4.
- Thomas, D. S. G., and C. Twyman. 2004. “Good or Bad Rangeland? Hybrid Knowledge, Science, and Local Understandings of Vegetation Dynamics in the Kalahari.” Land Degradation and Development 15 (3): 215–231. doi:10.1002/ldr.610.
- Treivish, A. 2005. “A New Russian Heartland: The Demographic and Economic Dimension.” Eurasian Geography and Economics 46 (2): 123–155. doi:10.2747/1538-7216.46.2.123.
- Tritsch, I., and F. M. Le Tourneau. 2016. “Population Densities and Deforestation in the Brazilian Amazon: New Insights on the Current Human Settlement Patterns.” Applied Geography 76: 163–172. doi:10.1016/j.apgeog.2016.09.022.
- Tsing, A. L. 2003. “Natural Resources and Capitalist Frontiers.” Economic and Political Weekly 38 (48): 5100–5106.
- Tsing, A. L. 2005. Friction: An Ethnography of Global Connection. Princeton and Oxford: Princeton University Press.
- US Census Bureau, 2012. Following the Frontier Line, 1790 to 1890. Accessed July 7, 2022 https://www.census.gov/dataviz/visualizations/001/.
- Väätänen, V. 2019. “Investigating the Particularities of Regionalization: Contested State–Federal Relations and the Politics of Alaska’s Arctic Policy.” Geografiska Annaler: Series B, Human Geography 101 (3): 171–186. doi:10.1080/04353684.2019.1616510.
- Wakefield, M. K. 2012. “Methodology for Designation of Frontier and Remote Areas.” Federal Register 77 (214): 66471–66476.
- Walker, R., J. Browder, E. Arima, C. Simmons, R. Pereira, M. Caldas, R. Shirota, and S. De Zen. 2009. “Ranching and the New Global Range: Amazônia in the 21st Century.” Geoforum; Journal of Physical, Human, and Regional Geosciences 40: 732–745. doi:10.1016/j.geoforum.2008.10.009.
- Ween, G. B., and M. Lien. 2012. “Decolonialization in the Arctic? Nature Practices and Land Rights in the Norwegian High North.” Journal of Rural and Community Development 7 (1): 93–109.
- Wellstead, A. 2007. “The (Post) Staples Economy and the (Post) Staples State in Historical Perspective.” Canadian Political Science Review 1 (1): 8–25.
- Wilger, S. 2016. Definition of Frontier. National Rural Health Association Policy Brief.
- Woodworth, M. D. 2016. “Disposable Ordos: The Making of an Energy Resource Frontier in Western China.” Geoforum; Journal of Physical, Human, and Regional Geosciences 78: 133–140. doi:10.1016/j.geoforum.2016.04.007.