
Abstract
Abstract: Raman spectroscopy investigations of l(+)-ascorbic acid and its mono- and di-deprotonated anions (AH− and A2−) are reviewed and new measurements reported with several wavelengths, 229, 244, 266, 488, and 532 nm. Results are interpreted, assisted by new DFT/B3LYP quantum chemical calculations with 6-311++G(d,p) basis sets for several conformations of ascorbic acid and the anions. Raman spectra were measured during titration with NaOH base in an oxygen-poor environment to avoid fluorescence when solutions were alkaline. The ultraviolet (UV) absorption band for ascorbic acid in aqueous solution at ∼247 nm was found to cause strong resonance enhancement for the ring C‒C stretching mode (called B) at ∼1692 cm−1. The ascorbate mono-anion absorbs at ∼264.8 nm giving Raman resonance enhancement for the same ring C–C bond stretching, downshifted to ∼1591 cm−1. Finally, for the ascorbate di-anion, absorption was found at ∼298.4 nm with molar absorptivity of ∼7,000 L mol−1 cm−1 and below ∼220 nm. With UV light (244 and 266 nm), strongly basic solutions gave pronounced Raman resonance enhancement at ∼1556 cm−1. Relatively weak preresonance enhancement was seen for A2− when excitation was done with 229 nm UV light, allowing water bands to become observable as for normal visible light Raman spectra.
Introduction
Recently, when studying ultraviolet (UV)-Raman spectra of food and beverages, we discovered interesting details in the resonance Raman spectra of the l-enantiomer of ascorbic acid, commonly also called vitamin C: No matter what kind of fruit juice, beer, or wine studied with 229 nm excitation, we did not observe anything other than the ascorbic acid, either naturally present or added for preservation. This nonlinear behavior with respect to Raman spectral intensity motivated the present study of ascorbic acid, C6H8O6 or AH2.
Ascorbic acid is a cyclic lactone (ester) containing an endiol group, ‒C(OH)˭C(OH)‒, as shown in . The compound is acidic, as a consequence of electron delocalization in the ring system, making the OH group—labeled 3—prone to giving off its proton when in contact with neutral or basic solutions (Citation1). Ascorbic acid is also a strong antioxidant, with a high reactivity toward oxygen. The acid participates in many redox reactions in natural biological systems and is commonly found in small concentrations in fruits and vegetables (Citation2–Citation6). The acid is soluble in water and is an important nutrition component for humans, primates, and guinea pigs, which all are incapable of synthesizing it from glucose due to their lack of the enzyme gulonolactone oxidase in the glucoronic acid pathway (Citation7). A deficiency of ascorbic acid in a person's diet causes a hemorrhagic condition (scurvy) of the skin and gums with attack on collagen in binding tissues. The acid is sometimes added to food as a preservative; for example, it helps to decrease the browning of white wines (Citation8) and to protect human skin from degradation in UV light (Citation9).
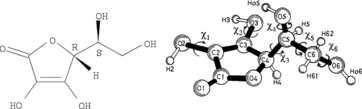
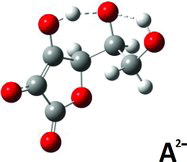
The reducing behavior of AH2—associated with the endiol group in the ring—limits the stability in solution and in the solid state under ambient environments. At physiological pH values, the ascorbic acid AH2, depending on the concentration, splits off a proton to form the ascorbate ion AH−. Chemical evidence, X-ray structure solutions, and ab initio studies indicate that the deprotonation involves the proton H3 on the O3 site; see . The OH group on C3 has an acidity constant of pKa ∼4.1 to ∼4.25, forming a highly stable AH− mono-anion of ascorbic acid (Citation4, Citation10–Citation17). Other tautomers are not so stable; for example, the hydrogen on O2 can be moved to O1, forming a tautomer of ascorbic acid (Citation4), but this is not the only possibility. The so-called iso-ascorbic acid, a stereoisomer of the ascorbic acid, occurs with inversion of the OH group at C5 but behaves in a quite similar way. The ionization of ascorbic acid is accompanied by a distortion of the planarity of the ring (Citation18). In strongly alkaline solutions a further proton is lost to form one or more forms of the ascorbate di-anion A2− (Citation13, Citation19). The most stable di-anion in water solution seems to be obtained by deprotonation of the O2 site or eventually the O6 or O5 sites of the O3 deprotonated ascorbate mono-anion (Citation4); see . Formations of these di-anions are rare under physiological conditions requiring a highly basic environment because pKa for the ascorbate mono-anion is ∼11.5 to ∼11.79 (Citation11, Citation14, Citation16, Citation17, Citation19). At even higher basic pH values isomerization at C4 may take place (Citation20). The acid/base and oxidation/reduction reactions of ascorbic acid are coupled, and in highly basic solutions and under the presence of oxygen the molecules are easily oxidized to various radicals, forming in the end salts of the dehydroascorbic acid, C6H6O6 (ascorbic acid that has lost H2 and H3 protons and two electrons) (Citation19, Citation21–Citation23). Quite stable free radicals of ascorbic acid seem to be formed via ionization of the O3 or O2 anions, and also a stable di-radical seems to exist via ionization of the O3 O2 di-anion (Citation4).
Structural Determinations
The crystal structure of AH2 is known after complete solutions by Hvoslef (Citation24, Citation25), based on X-ray and neutron diffraction data, and a redetermination at 120 K was later obtained (Citation26). The crystal structures of several salts of AH2 have been obtained, including the sodium salt NaAH (Citation10), as well as calcium (Citation27–Citation29), strontium (Citation30), lithium (Citation31), thallium (Citation32), and other ascorbates (Citation33). The crystal structures were often found to contain various amounts of hydrate water in addition to one or more ascorbate ions that look much like the AH2 depicted in , although without H3. Interestingly, in, for example, the calcium dihydrate and thallium salts, two different ascorbate ions are present in the unit cell and—as in AH2—these ions assume quite different conformations (different torsion angles χ1 and χ3 around C2‒O2 and C4‒C5 bonds) (Citation27–Citation29, Citation32). In addition, we note that the hydrogen-bonding tendencies of O2 and O3 in certain ascorbate salts seem to favor the formation of anion dimers in solution (Citation1, Citation12, Citation28, Citation34–Citation37). No salt of the rather unstable A2− ion is at hand, and no crystal structure thereof seems to have been solved.
Raman Vibrational Spectroscopy
In 1943 Edsall and Sagall (Citation38) used filtered light from a mercury arc (the blue e and violet k lines at 435.8 and 404.7 nm, respectively) to excite Raman spectra of aqueous solutions. From comparing three different ascorbic-like compounds, assignments of bands due to AH2 and AH− were made, and it was concluded that the presence of the ring in the structures gave rise to strong signals in the Raman spectra and that signals from the side chains were not nearly as strong. In 1971 Hvoslef and Klæboe used a red helium–neon laser to study AH2 as crystals and in aqueous dilution to supplement infrared absorption experiments. This pioneering work also included deuteration studies (Citation39). Structure clarifications on l-ascorbic acid were later made by infrared (IR) and UV spectroscopy by, for example, Falk and Wojcik (Citation40), Lohmann et al. (Citation41, 42), and Ferrer and Baran (Citation43). The acid and many salts were studied as solids and in aqueous solutions (also in D2O between AgCl windows) by use of IR and 13C-NMR spectroscopy (Citation17, Citation34–Citation37, Citation41–Citation44). Panicker et al. (Citation45) obtained Fourier transform infrared (FTIR) and FT-Raman spectra including surface-enhanced Raman spectra studies with Ag colloids (probably excited with a 1,064 nm Nd-YAG laser), and many of the vibrational modes of the acid were confirmed or reassigned. The influence of high pressures (up to 5.9 GPa) on the hydrogen bonding in AH2 crystals has been studied (Citation46), and extreme experiments have been performed with simple equipment in cold environments and at high altitudes (Citation47). The temperature dependence (from 15 to 418 K) of the AH2 Raman spectrum has been investigated, and a crystal phase change in the temperature range 200–270 K has been identified (Citation48). (It is interesting that this phase change, detected by short time scale spectroscopy, did not influence the average structure—based on long timescale diffraction experiments—compare (Citation24)–(Citation26)—but such behaviors have been seen for others crystals, as discussed in, for example, (Citation49–Citation51).) Infrared spectra of AH2 in the polycrystalline state and in aqueous solution have been presented by Bichara et al. (Citation52). Most recently, IR and Raman spectra of ascorbic acid were given and their vibrational origin discussed by Singh et al. (Citation53) and Yadav et al. (Citation54) (the last report repeats much of the work in the first, including some printing errors).
Many Raman spectra in the published literature are incomplete or of minor quality and the ascorbate salts have not been well studied. Consequently, we found it necessary to critically review the literature and perform new measurements as reported in the following sections.
Quantum Chemical Modeling
Early ab initio calculations for AH2 and AH− were reported in 1976 by Carlson et al. (Citation55), who started from the molecular geometry of the crystallographic data. Later, Al-Laham et al. (Citation56) performed an STO-3G conformational analysis of the acid by forcing the ring geometry to be constant and optimizing only the conformation of the side chain. In 1997, Milanesio et al. (Citation26), apparently not aware of the previous works, made extensive Hartree-Fock (HF) and density functional theory (DFT) calculations with B3LYP/6-311+G(2d,2p) basis sets. They described several conformers of the isolated AH2 molecule, including a global minimum conformation called G, characterized by four intramolecular hydrogen bonds. Apparently independent of this, in 1998 Mora and Melendez (Citation57) optimized 36 conformers of the AH2 molecule at different levels of theory (RHF/6-31G, RHF/6-31G(d,p), RHF/6-311+G(d,p), and MP2/6-31G(d,p)) and described several optimized molecular geometries of low energy, including one close to the so-called crystallographic B structure of the solid (note that their results are given for the mirror image D-AH2). O’Malley (Citation58) modeled the effect of hydrogen bonding by considering up to three water molecules in the first solvation shell. In 2003, Juhasz et al. (Citation15), based on DFT/B3LYP/6-31G(d) type calculations, elaborated on the effects of conformation on the acidity of the AH2 acid and found a global minimum with a minimum energy of −684.755581553 Ha in the gas phase. Later, in 2006, Dimitrova (Citation59), not citing these previous works, reported results based on SCF/6-31G(d,p), B3LYP/6-31G(d,p), and B3LYP/6-31++G(d,p) models, and she obtained vibrational frequencies of L-AH2 (alone and with five nearby water molecules) and correlated her frequencies with the experimental results of Hvoslef and Klæboe (Citation37). Because the ascorbic acid has several hydrogen bond accepting and donating sites, these few water molecules are not sufficient for a good model, and more water molecules should be necessary to complete the first solvation shell. Geometry optimization of species in aqueous solution by use of a continuum model offers an attractive alternative. Accordingly, Allen et al. (Citation4) have made a comprehensive study of ascorbic acid conformers, including some tautomers, some anions, and radical species in an aqueous conducting polarization continuum model and in the gas phase, using the DFT/B3LYP/6-311++G(d,p) high level method. Costanzo et al. (Citation23) have added a further study of much the same content in the gas phase but including molecular dynamics on AH− and the radical anion A*− modeled in aqueous solution. Shimada et al. (Citation46) also calculated the Raman spectrum of AH2 starting from the established crystal structure, and Bichara et al. (Citation52) reported further DFT calculations without referencing much of the previous work. Finally, Singh et al. (Citation53) and Yadav and others (Citation54) have reported comprehensive structural and vibrational studies of AH2 and the AH2− and AH2+ radical ions using DFT methods and reporting optimized geometric structural, experimental vibrational spectra (harmonic frequencies along with IR intensities and Raman activities and depolarization ratios), as well as thermodynamic properties.
By reviewing these reports, it seems that many of the researchers have not read most of the prior literature on the subject. This is reflected in the many different numbering schemes for the atoms in the ascorbic acid and is why we are motivated to give a preferred definition of the atom numbers—based on Hvoslef's work (Citation24, Citation25)—as proposed in . The numbering problem makes it rather cumbersome to compare the many different previous reports, but in general the researchers have obtained rather consistent results.
To complement the many previous calculations we found it necessary to perform a comparative study on the AH− and A2− anions, as well as similar recalculations on the AH2 molecule. It appeared that the Gaussian 03W program (Citation60) could give reasonably reliable results at the DFT/B3LYP/6-311++G(d,p) level (Citation61).
UV Resonance Raman Spectroscopy
In 1946, Harrand and Lennuier (Citation62)—when exciting some yellow crystals with yellow light—noticed an intimate connection between the absorption and an enhancement of certain vibrational transition bands related to the chromophore. The effect was later named resonance Raman (RR) and a short review was recently given (Citation63). The enhancement means that much more intensive spectra can be obtained and applied analytically but an inevitable problem is that samples get heated and often destroyed because of the absorption; however, certain samples can intentionally be moved, thereby avoiding decomposition (Citation64–Citation66).
It has been known for long time that ascorbic acid absorbs in deep UV; the UV spectra of ascorbic acid/ascorbate in aqueous solution, for example, show π → π* absorption peaks at ∼243.5 and ∼265.5 nm (Citation11) while being transparent in other ranges. Large variations in peak position and absorptivity have been reported, with values depending on concentration and pH, due to dissociation of the acid and the reactivity with oxygen. The molar absorptivity at these wavelengths is perhaps about ∼9,560 and ∼14,560 L mol−1 cm−1, respectively (Citation9, Citation11, Citation14, Citation67). The absorption bands have been used for analytical purposes in many investigations (Citation22, Citation68, Citation69).
In a search for UV absorbers it was recently discovered that divalent ascorbate anions embedded in a calcium carbonate lattice could be used (Citation16). The filter solid was prepared by dripping aqueous solutions of CaCl2 into Na2CO3 solutions containing dissolved ascorbic acid that is transformed into divalent ascorbate anions by the base. The filter material gains stability due to the absence of O2 molecules inside CaCO3. The optical absorption was seen in the UV B region (280–315 nm) and was ascribed to the absorption of A2− ions at 292 nm in the CaCO3 lattice and at 297.5 nm in aqueous solution (Citation16).
Interestingly, there has been little specific mention in the literature that RR spectroscopy could be useful for studies on ascorbic acid compounds. According to the strong UV light absorptions, AH2, AH−, and A2− should exhibit strong RR enhancements when excitation is done with wavelengths within the UV range. The close connection between the absorption process and the resonance enhancement has been examined comprehensively by, e.g., Albrecht (Citation70) and Hassing and Sonnich Mortensen (Citation71).
By resonance Raman spectroscopy it may be possible to detect the presence of very small amounts of compounds due to the strong signal enhancement. For instance, Tuschel et al. (Citation72) have shown that small amounts of explosives could be detected by using resonance-enhanced Raman spectroscopy with a 229 nm deep ultraviolet (DUV) laser. However, it must be done with care because the RR effect may destroy the normal Beer-Lambert-Bouguer type of relation. The signal needs not be linearly related to the concentration of the resonating chromophore (Citation63, Citation73–Citation75) and the resolution of UV Raman spectra may sometimes be limited (Citation76). Raman spectroscopy performed with DUV laser lines is known to have the possibility to give spectra with little fluorescence (Citation77). Thus, Loppnow et al. (Citation78) reported several UV Raman spectra of aromatic hydrocarbons with very little fluorescence for compounds like toluene and naphthalene excited within their absorption bands. These aromatic hydrocarbons exhibit bands at about 1600 cm−1, assignable to the C˭C vibration or ring stretching, and these modes are strongly active in RR (Citation78).
Therefore, it seemed worthwhile to examine ascorbic acid by DUV Raman spectroscopy.
Experimental
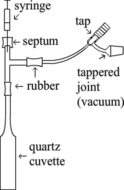
The compounds l(+)-ascorbic acid (C6H8O6, CAS Reg. No. 50-81-7) and l(+)-sodium ascorbate (NaC6H7O6, CAS Reg. No. 134-03-2) were obtained in highly pure states from Sigma Aldrich (St. Louis, MO, USA), and spectra were obtained directly on the solid salts or on solutions in cuvettes. Solutions of AH2 in H2O were prepared by use of freshly boiled cold deionized and pure normal or heavy water (∼90% D2O). Control of pH was obtained by titration of AH2 solutions with 1.0 M and 4.2 M oxygen free NaOH solutions, which were standardized with 1.0 M HCl solution. A tight titration apparatus (illustrated in ) was needed to prevent oxygen from the air penetrating into the solution and forming radicals due to oxidation. Suprasil quartz cuvettes with stems were fitted via rubber tubing to Pyrex glass tube T-connections with two entrances. One entrance was fitted to a valve for evacuation and oxygen-free argon atmosphere refilling. The second entrance was a closed rubber septum that allowed for injection of solutions of ascorbic acid, HCl, or NaOH, respectively. In this way titrations in highly oxygen-poor environments could be performed () by adding ascorbic acid and/or NaOH solutions through the syringe and intensively shaking to obtain solutions of l(+)-sodium ascorbate and l(+)-disodium ascorbate (Na2C6H6O6, CAS Reg. No. 21547-69-3).
Visible light Raman measurements were carried out directly on the powders or on solutions in quartz cuvettes. We used a DILOR-XY Raman spectrometer with a macroscopic sampling stage from Horiba-Jobin-Yvon, Ltd. (Villeneuve d'Ascq, France) (Citation79) and a green 532 nm wavelength Spectra-Physics (Santa Clara, CA, USA) Millennia module based on a 1,064 nm Nd:YVO4 laser and a crystalline LiB3O5 frequency-doubling device for the excitation. A Supernotch-Plus filter (Kaiser Optical Systems, Inc., Ann Arbor, MI, USA) was used to filter off the Rayleigh scattered light. The spectrometer grating 10 × 10 cm2 had 1,800 grooves per millimeter and spherical mirrors in Czerny-Turner configuration (Citation76) to disperse the remaining light onto a charge-coupled device detector cooled to 140 K with liquid nitrogen. The entrance slit was set to 200 μm to obtain a resolution of about 8 cm−1. Raman lines of liquid cyclohexane were used for calibration (Citation80).
Ultraviolet Raman experiments were carried out with several UV laser lines and an InVia Reflex UV-Raman spectrometer from Renishaw plc (Gloucestershire, UK). The excitation light was filtered in a quartz prism monochromator with several slits and sent into the InVia instrument and through the attached microscope equipped with a traditional 15× UV lens objective. The laser output power was adjusted to about 5–15 mW, of which about 20% or less reached the sample surface. UV excitation light of 229 and 244 nm was obtained by frequency-doubling of continuous 457.9 and 488.0 nm light from a Lexel Ar+ gas laser (95-SHG-QS from Cambridge Laser Laboratories Inc., Fremont, CA) working by intracavity second harmonic generation in a β-Ba2O4 borate crystal (Citation81). A solid-state FQCW 266-50 laser from CryLaS GmbH (Berlin, Germany) was used to obtain 266 nm. This laser emitted a highly stable continuous wave beam with a fixed wavelength generated as the fourth harmonic from a strong 1,064 nm laser (an Nd:YVO4 crystal system in single frequency longitudinal mode operation, pumped by 808 nm from solid-state laser diodes and doubled in two stages). The light scattered from the sample was conducted from the microscope, through UV dielectric filters with long wavelength bandpass, dispersed in a single-stage spectrograph and detected with a UV-enhanced charge-coupled device detector, thermoelectrically cooled to a low temperature (−40°C). The entrance slit width was set to 40 μm to obtain a resolution of ∼8 cm−1 (Citation76). The acquisition time was 2 × 20 s with automatic removal of cosmic spikes. The spectra were scaled but not further corrected for monochromator and detector efficiencies. Other experimental details are given elsewhere (Citation81).
The UV absorption spectra of the solutions were measured through Suprasil quartz cuvettes by use of a UV-Vis recording double beam spectrophotometer (UV-2401PC) from Shimadzu Corporation (Tokyo, Japan). The thickness b of the sample layer in the cuvette was 5 mm. The absorbance A was measured during titration and was used to obtain the molar absorptivity ϵ by applying Beer's law (A = ϵ b c, where c is the concentration) and taking the stepwise dilution into account.
Results and Discussion
The calculations on the structures and the corresponding IR and Raman spectra are presented in this section and then the spectral measurements follow. We also describe what occurs with the spectra when AH2 molecules react with base.
Calculations—Structures
Data from solved crystal structures are listed in together with the model calculation results. Selected bond lengths, bond angles, and dipole moments are given with obtained corresponding minimum energies at the DFT/B3LYP/6-311++G(d,p) level (the lower the minimum energy, the more stable the configuration). The calculations were performed for the AH2 molecule, the AH− anion, and the A2− di-anion, all assumed to be in free gas-phase states (vacuum) as well as in hypothetical dissolved isotropic aqueous situations simulated by use of the polarizable continuum model (PCM) as implemented in the Gaussian program (Citation60). Different starting point conformations were tried for the AH2 species: First the average geometry of the Hvoslef crystal structure (Citation10, Citation25) and then the “most stable molecule” identified by several researchers (e.g., Milanesio et al. (Citation26), Singh et al. (Citation53), and Yadav et al. (Citation54)). For the AH− and A2− anions, the optimizations started from similar geometries, after leaving out the H3 proton for AH− as well as the H2 proton for A2−, as shown in the Figures 3–10.
Table 1 Selected structure data in solved crystal structures compared to DFT calculateda results for AH2, AH−, and A2−
The values for calculated geometries, bonds, and angles (see ) differ somewhat from the crystal structure values and depend on the kind of model used and the starting point. The problem of the calculation ending in a nonglobal minimum also needs to be addressed, as pointed out by many of the previous researchers.
For the AH2 molecule optimizations, starting from an average conformation as in the crystal structure, there was hardly any influence of the kind of model (gas phase versus PCM). Specifically, the obtained minimum geometry (see ) did not depend on the presence or absence of the solvent (, columns 3–4), but the result did not give the global minimum. The most stable molecule could only be obtained starting from other guessed conformations. Moreover, the resulting minimum conformation was quite dependent on the kind of modeling used, the environment being either a vacuum or a PCM continuum; see , columns 5–6. As seen in , the most stable AH2 conformer (the global minimum) has five hydrogen bond interactions and does not look like the molecules in the crystal structure. The molecule in the “crystal” conformation, when alone as seen in , forms only three intramolecular hydrogen bond interactions and is only in a local minimum state. In the crystalline state further intermolecular stabilizations are realized, thereby making the crystal the stable phase in reality. Data for the obtained most stable hydrogen bonds and the corresponding energies are summarized in (columns 2–5).
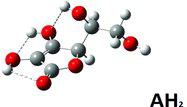
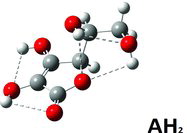
Table 2 Intramolecular hydrogen bond distances for AH2, AH−, and A2− molecules in different minimizeda conformations
For the AH− anion it was possible in a similar way among the calculated results to find low energy conformers with 3–4 intramolecular hydrogen bond interactions (see – and ). In particular, the global minimum energy conformer () has an interesting geometry with protons bound as O1 … .H2–O2, O3 … .Ho5–O5, and O5….Ho6–O6. This conformation deviates markedly from the geometry found in the crystal structures of several known ascorbate salts. A brief summary of the geometries of these crystal structures is given in . The reason for the different values found for the torsional angles (defined in ) is that the realized energy minimum in each crystal depends on the particular interactions in that crystal. In contrast, the global minimum conformation of our single molecular AH− anion looked different, independent of whether the environment was modeled in the gas phase or by the PCM (compare columns 8–9 in ). This puts a limit on the applicability of our simple one-molecule modeling results with respect to predicting the excact properties of the different crystals.
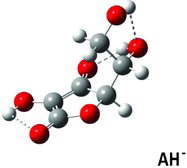
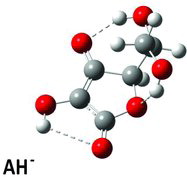
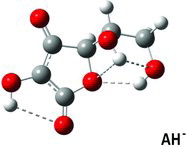
Table 3 Calculated dihedral (torsion) angles χ1, χ3–χ6 for the ascorbate ion minimum energy conformer (Figure 5) compared with similar angles in selected crystal structuresa
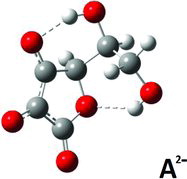
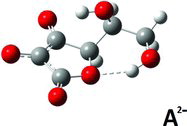
Finally, for the A2− di-anion, low energy conformers with intramolecular hydrogen bond interactions were found in the gas phase and in the aqueous PCM environment models. In the gas phase, the global minimum energy conformation was not particulary distinct: Different conformations gave energies not much different (an example is given for the gas phase in , column 12). When the modeling was done via PCM, the situation was about the same. Selected results are shown in (columns 10–12) and (columns 10–13) and corresponding structures are depicted in –. One PCM minimum conformer (depicted in , and rather similar to the gas-phase conformer; see , columns 10–11) has protons bound as O3 … .Ho5‒O5 and O5 … .Ho6–O6 (, column 13), but this is not the global minimum conformer; that honor must be shifted to the conformer shown in . The conformer in presumably owes its stability to its two short internal hydrogen bond interactions O3 … .Ho5…O5 and O4 … .Ho6 … .O6. In addition, the conformer in is more stable than the conformer depicted in , which only has a single O4….Ho6‒O6 interaction and some additional stabilization from its Ho5 placed centrally above the resonance ring system, at a distance of 2.38 Å from C3.
When trying to understand the behavior of ascorbate salts in solution it is worth remembering that the O2 and O3 charges seem to favor the formation of anion dimers via hydrogen bonding, and this tendency tends to complicate things further, as discussed in the literature (Citation1, Citation12, Citation28, Citation34–Citation37). These features have not been studied here.
Calculations—Spectra
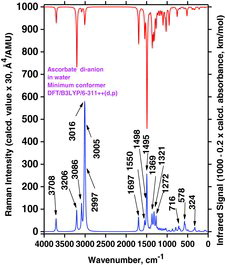
Infrared absorption and Raman scattering spectra were calculated for the different conformations of AH2, AH−, and A2−. Selected calculated spectra are shown in and the data are summarized in , to facilitate mutual comparisons. Selected modeling results for ions AH− and A2− are detailed in with emphasis on the dihedral angles and the O‒H modes.
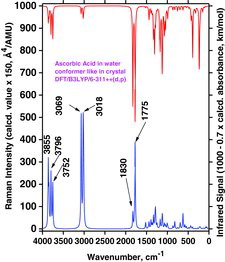
Table 4 Selected wavenumber dataa for IR absorption and Raman scattering strong bands of AH2, AH−, and A2− compounds dissolved in water. Data were calculated by the Gaussian 03/DFT/B3LYP/6-311++G(d,p)/PCM
Table 5 Selected model results for ions AH− and A2− in water (PCM)a,b
By comparing spectra in and , calculated for the water medium (PCM) as an example, we clearly see differencies: Strong Raman bands are predicted for the “crystal conformation” (in ), at OH− strechings at 3855, 3796, and 3752 cm−1, whereas analogous bands are predicted at 3500, 3359, and 3307 cm−1 for the global minimum conformer (see ). Accordingly, the AH2 spectra are significantly conformer dependent, as also expected. The same was true for the gas-phase results (not shown). The reason is that differences in the conformation geometry are substantially reflected in the couplings among the vibrational modes, leading to noticeable differencies in frequencies and intensities. This is similar to what has been found for other molecules such as amphetamine (Citation82, Citation83) or for ionic liquids (Citation84, Citation85).
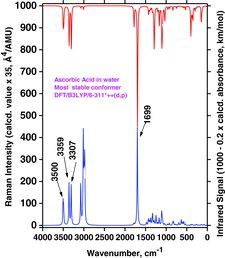
Considerable changes also appeared in the spectra when the proton H3 was removed to simulate the ascorbate anion formation (see and ). We compared the global minima conformers found for the water medium (PCM modeling) shown in and , trying to understand this quite complex process. When the H3 is lost, apparently Ho5 after energy minimization takes over the interaction with O3 (see ). In for AH2 we see that three strong OH stretching Raman bands at 3500 cm−1 (from O5 and O6), 3359 cm−1 (from O2), and 3307 cm−1 (from O3) are transformed to two strong OH stretching bands for the AH− ascorbate anion: A high-frequency band at 3772 cm−1 (from O2 and O6) and one at 3455 cm−1 (from O5; see also ).
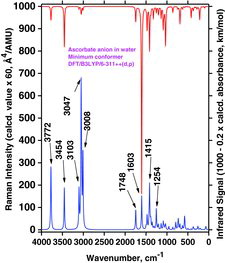
This quite complicated situation is carried further on when another proton (H2) is removed (from the ascorbate anion to form the ascorbate di-anion); see the A2− global minimum conformer shown in . The spectrum, shown in , now contains only two strong OH stretching Raman bands, predicted at 3708 cm−1 (from O6) and 3206 cm−1 (from O5) in the PCM water solution simulation (see and ).
Comparisons between Experimental Measurements and DFT Results
Reference Raman spectra for AH2 and NaAH solids were measured for comparison with both the previous literature and the calculations. As always, the spectra consist of strong, medium, and weak intensity peaks corresponding to the vibrational transitions in the molecules (shown in ). In the measured Raman shifts are compared to literature values and the bands are assigned to transitions between various levels corresponding to the respective stretching, bending, and deformation vibrations. As one can see in , band positions of the literature spectra and the measured values are often in excellent accordance, although minor disagreements can be seen in some cases. Explanations for this could be that the known low crystal symmetries may make the spectra dependent on the crystallite orientations, and double refraction of the nonisotropic material may further influence the spectral appearances (Citation86). This is probably why the careful and reliable results obtained by Hvoslef and Klæboe in 1971 (Citation39) sometimes differ from certain newer measurements; in some cases our results are reminiscent of these old data but sometimes we obtained very good agreement with newer data; for example, those of Saraiva et al. (Citation48) (except their instrument was probably miscalibrated to give wavenumbers consistently some 5 ± 4 cm−1 too high; see ). Our general explanation for these deviations must be that the spectra depend heavily on wavenumber scale calibration, polarization, anisotropy, and crystallite orientation, as previously seen for many other crystal cases (Citation87–Citation89).
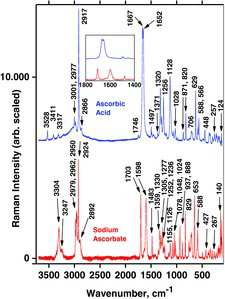
Table 6 Measured Raman spectral bands (in cm−1) and assignments for ascorbic acid and sodium ascorbate solids, compared to literature values (39, 44–46, 48). Some data can also be found in Jehlička et al. (Citation47)
In , it is clearly seen that ascorbic acid shows a weak band at 1746 cm−1 and a broad doublet band at 1667–1653 cm−1. The doublet band is not present in sodium ascorbate, which only has a strong band at 1703 and another strong one at 1598 cm−1 (see the inset in ). According to the modeling for AH2 and AH−, these bands originate from coupled modes of C1˭O1 and C2˭C3 stretchings (). The splitted doublet in AH2 most probably is due to intermolecular couplings between C1˭O1 and C2˭C3 stretchings in two adjacent AH2 molecules. This doublet band of AH2 (at ∼1660 cm−1) can be used analytically; for example, to examine whether neutral vitamin C tablets contain mixtures of AH2/NaAH crystals or a mixture of the acidic AH2 and a base such as a carbonate.
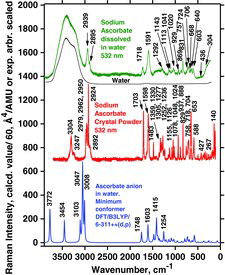
Measured Raman spectra of AH2 dissolved in water and as crystal powder are shown in , together with the Raman spectrum calculated for the minimum conformation simulated within the PCM aqueous environment (geometry as in ). As seen in , the spectrum in the aqueous solution (top) is comparable to that of the crystalline phase (middle), except for the broad OH stretching feature at ∼3650 to ∼3070 cm−1, as already discussed by Hvoslef and Klæboe (Citation39). This means that no drastic rearrangement of the structure occurs by dissolution in water compared with the crystal, although the conformer equilibrium might shift. The experimental spectrum in solution is, of course, dominated by the presence of H2O molecules giving rise to the water bands, with an envelope depending on temperature, pH, and presence of solutes (Citation90, Citation91). We note that H2O molecules were not directly incorporated into the modeling in (bottom) and therefore the OH stretching band envelope is absent from the calculated spectrum. In addition, there are AH2 spectral differences and shifts between the aqueous solution and the crystal, indicating that the vitamin C molecules must be strongly affected by hydrogen bonding to the water molecules. Most distinctive in this respect are the Raman shifts from 2917 and 1667–1653 cm−1 for the solid, compared to 2945 and 1692 cm−1 for the acid in solution (). These peaks represent the side chain C‒H stretchings and the ring C1˭O1 and C2˭C3 stretchings, respectively, and it therefore seems natural that these peaks change upon dissolution in water.
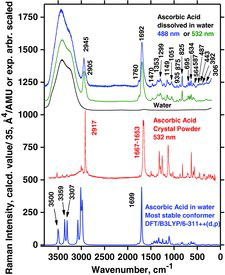
Table 7 Measured Raman spectral bands (in cm−1) and assignments for aqueous solutions of ascorbic acid and sodium ascorbates, compared to literature values (39, 44, 46, 48). Some data can be found in Jehlička et al. (Citation47). Water bands are not included. For abbreviations, see Table 6
No distinct sign was observed of any dissociation reaction of ascorbic acid to ascorbate, caused by the protolytic equilibrium with the water (Citation1):
(1)
The solution spectrum in did not seem to change significantly when we added HCl, as also seen previously (Citation39). The wavenumber values are given in (solid) and (solution). The overall similarity between the spectra—from powder, solution, and as calculated—indicates that the PCM aqueous environment model works reasonably well. Note that entirely correct wavenumber positions cannot be expected to result from the modeling, due to its simplicity and the fact that only a single molecular entity was considered. It has often been the practice in similar cases to “calibrate” the wavenumber scales by multiplying by a rather arbitrary constant near one (Citation61), but we preferred not to do so (an extra parameter would, of course, make a better fit). Still, the accordance between the DFT calculations with water as solvent and the experimental Raman spectrum of AH2 in real water solution seems rather remarkable (see ).
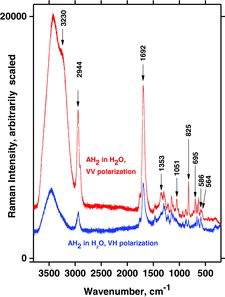
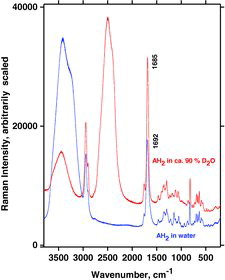
Visible laser lines of 532 (green) and 488 nm (blue) were used for the Raman measurements, giving quite identical results. The dependence on polarization was also studied (see ). Some of the bands (arrows) were highly polarized, and the observations were used to confirm the assignments by comparison to the calculated polarization values. Raman spectra of deuterated and normal aqueous AH2 solutions are shown and compared in , complementing the results of Hvoslef and Klæboe (Citation39). The comparison reveals that many bands from isotopically undisturbed AH2 molecules are still present in the freshly made D2O solution. Thus, the exchange of hydroxyl protons with deuterium in D2O solution is incomplete, in support of the previous conclusion by Hvoslef and Klæboe (Citation39) based on neutron diffraction and deuteration IR absorption spectra. In particular, hydrogen-bonded O–H…O stretching bands seem to show their presence in at around 3440 cm−1, in addition to the expected O–D…O stretching bands from D2O seen at ∼2400 cm−1. The broad 3440 cm−1 band shape is interpreted as due to the many O–H…O microstates of hydrogen bonding interactions between AH2 and the solvent OD2. The AH2 oxygen-bound hydrogens (or at least some of them) are not exchanged fast with deuterium. The O–D…O stretching band is broad as in ordinary water, and for the same reasons. The fact that the O–H…O stretching band envelope occurs at higher wavenumbers in D2O solution than in ordinary water (at 3440 cm−1 compared to 3410 cm−1) shows that it is not just the hydrogen content in our (∼90%) D2O/H2O solvent mixture, although some part of the band may have that origin. The 1692 cm−1 band assigned to the ring C1˭O1 and C2˭C3 stretchings (mode B) is shifted to ∼1685 cm−1, and this shift—not surprisingly—shows that the C1˭O part of the ring must also be interacting with the solvent.
Sodium ascorbate results are shown in and the wavenumber data are included in . The only Raman data available in the literature on ascorbate salts are those of Hvoslef and Klæboe (Citation39).
To sum up, our observed bands for AH2 and AH− compare quite well with other spectral modeling results (Citation4, Citation15, Citation23, Citation26, Citation46, Citation52–Citation59) and with the available experimental bands in the literature (Citation39–Citation45). We note, however, that the AH2 sample of Panicker et al. (Citation45), presumably solid, seems to have been not entirely pure, because the Raman spectrum showed signs of ascorbate ions at ∼1484 cm−1 and their spectral resolution was low (doublet at 1667–1653 cm−1 not resolved).
Titration Experiments
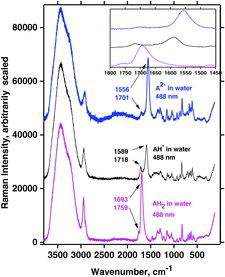
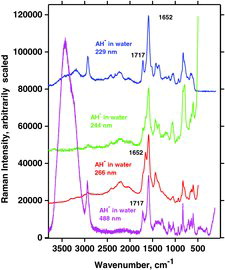
To investigate more closely the behavior of AH2 and the deprotonated forms AH− and A2− in water, we conducted titrations by adding small aliquots of NaOH solution. Oxygen-poor conditions were maintained inside quartz cuvettes as described in the Experimental section. During the titrations, typical Raman spectra were obtained using 488 and 532 nm laser excitation, as shown in and . The bottom spectra clearly show the dissolved AH2 with the characteristic ∼1692 cm−1 band present before the start of titration (pH ∼2). Vibration bands occurred at ∼1757, ∼1692, and ∼1353 cm−1, respectively, for both the visible and DUV spectra, which is comparable with the literature (Citation39). Then, along with addition of NaOH, the spectrum gradually changed to that of AH−, developing the characteristic bands at ∼1719 and ∼1591 cm−1 (pH = ∼9, ). A weak vibration band was observed at 1430 cm−1 in the UV spectra and in the visible spectra, which also occurred between 1430 and 1440 cm−1. As expected, there was no indication of any intermediate species. By further titration beyond the AH− state (pH > 12), a strong fluorescence soon appeared and it became increasingly difficult to obtain good spectra, especially with the green laser line.
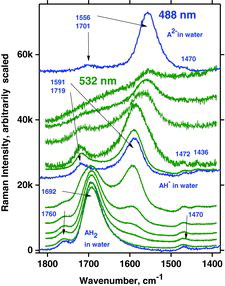
To avoid the fluorescence we were motivated to use deep UV excitation. Three different laser lines (229, 244, and 266 nm) were available, allowing for a study of the influence of these short wavelengths on the appearance of the spectra during the titration. Hence, spectra were recorded during the titration at times when the compositions corresponded to the presence of AH2, AH−, and A2− in water solution. The results obtained with these wavelengths are illustrated in – and are discussed in the following.
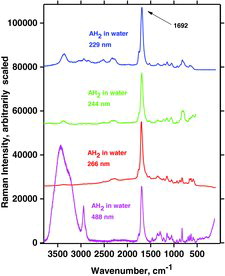
AH2
The results for AH2 are given in . The water bands around 3440 cm−1 are clearly observable in spectra obtained with the visible laser line at 448 nm (as with other visible laser lines). In contrast, when the three UV wavelengths were used, the water bands were absent or not remarkable. The reason for this is that the UV light is absorbed and the occurrence of significant absorption-associated resonance Raman enhancement: The RR spectrum simply becomes so strong that the spectrum of water is not seen. The spectrum of the ascorbic acid is observed and must hence be enhanced to a considerable extent.
As mentioned an intense band occurs in all of the AH2 spectra at ∼1692 cm−1. This band, due to a mode called B, is also visible in , at 1699 cm−1 and is assigned to the ring C1˭O1 and C2˭C3 in-phase stretching mode, no. 45. This mode and two other interesting vibrations called A and C, involving the ring in resonance, are depicted in . The respective calculated wavenumbers, as well as the IR and Raman signal strength for the modes called A, B, and C, are given in . Mode 45 (B) is quite polarized (polarization ratio calculated to 0.21) in accordance with what is also observed; see . Modes A and C are not as intense as mode B for AH2 in water, probably because the three vibrations involve different variations of symmetry couplings between the electronic transition under absorption and the vibrations of C1‒O1, C2‒O2, and C3‒O3, as shown in . Mode C is not only related to the ring but also involves the side chain.
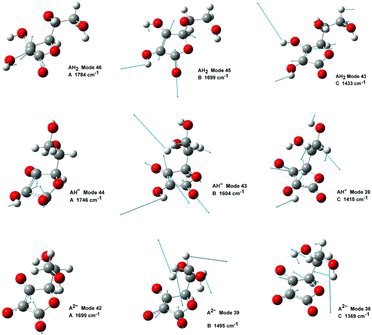
Table 8 Wavenumber values (cm−1) and calculated Raman intensity (int, in units of Å2/amu) of vibration bands A, B, and C for AH2, AH−, and A2− in water. Observed wavenumber values (Obsd.) from Table 7. For intensity abbreviations see Table 6
AH−
By the titration with OH−, a single proton can be removed from AH2 to form AH− and water (pH ∼9). Four such typical experiments are shown in .Again, very distinct water bands were seen near 3440 cm−1 for measurements done with visible wavelengths. The water bands disappeared from the spectra when UV excitation wavelengths 266 and 244 nm were used; the rest of the spectrum of the ascorbate was observed and must hence be enhanced to a considerable extent. For measurements excited with the 229 nm line, water bands became perhaps weakly observable. The mode B vibration gave a very intense signal, occurring at a wavenumber shift of ∼1591 cm−1 (as for all measurements done on AH−). Compared to AH2, vibration B for the deprotonated form, AH−, is shifted to a slightly lower wavenumber. Vibration A occurred at a wavenumber shift of ∼1717 cm−1, also the same for all four excitation lines. The only signal not accounted for is the one occurring at 1652 cm−1 between bands for vibrations A and B when the excitation wavelength was 266 nm. This signal is probably due to a resonance enhancement of some overtone or combinational mode and is enhanced only for the 266 nm excitation.
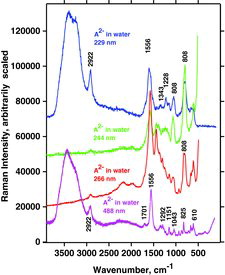
A2−
When the titration was continued, one more proton was withdrawn from AH− to form A2−. The study of A2− in a strong alkaline environment (pH > 12) is complicated due to fast reaction with even small amounts of O2. The A2− ion is only stable for a short amount of time after addition of NaOH to a AH− solution. To exclude O2 as much as possible the method described in the Experimental section was absolutely necessary. We assume that A2− ions react with electrons to form radicals (Citation19, Citation23), and the radicals emit fluorescence, which makes it impossible to obtain Raman spectra with visible laser lines shortly after the NaOH addition. It was, however, possible for some minutes to obtain Raman data for the A2− ion before the solution was ruined by fluorescing radicals.
Characteristic measurements on such basic solutions are shown in . It appears that the water bands were distinct with visble (488 nm) and very deep UV excitation (229 nm), whereas they were not visible when excition was done with the 266 and 244 nm lines. Again, the reason is ascribed to the resonance phenomena and absorption. The experimentally measured Raman spectrum of A2− isdepicted in , which also shows the DFT calculated spectrum with water as solvent. We note a good agreement between the measured and calculated spectra for A2−. It seems that the resonance Raman spectra are reminiscent of much of the normal Raman spectra except that they are much more intense.
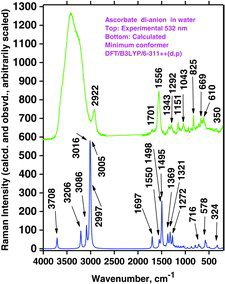
The OH stretching mode calculated at ca. 3708 cm−1 (Figure 26, bottom) in practice is so weak and broad (hydrogen bonding) that it is not observable under the broad water OH-stretching band (top). The rest of the theoretical spectrum is not very far from the observations. Taking into account that the solution probably is an ensemble of different conformations, the fitting seems surprisingly good. In our opinion this shows that the measured bands characteristic for A2− can be satisfactorily assigned using the DFT calculated Raman spectrum.
Vibration modes A, B, and C for AH2 and AH− can also be identified for A2−. For visible excitation the Raman bands occur at about 1697, 1556, and 1353 cm−1, respectively. Measurements of the A2− solutions show that several of the DUV spectral signals are slightly altered and do not occur at excactly the same positions and the band shapes do not correspond entirely to the results obtained with visible laser light (compare spectra in in the fingerprint range 1600–500 cm−1).
The explanation is that different modes are more or less in resonance for different excitation wavelengths.
The measurements with visible excitation wavelengths stand out as reference non-resonance-enhanced Raman spectra.
Discussion of Resonance Raman Spectra and UV-Vis Absorption Spectra
UV-Vis absorption spectra are needed to fully understand the differences between visible and UV Raman spectra for the ascorbate compounds. As pointed out ealier, absorption plays an important role in relation to the excitation wavelength chosen. Accordingly, we remeasured the absorption spectra during the titration, as shown in , and the details are given in . As expected, the absorption spectra varied according to the different ascorbic species formed. The acid itself (AH2) was found to have its absorption band positioned in deep UV, at a wavelength between ∼210 and ∼290 nm, and with a maximum at ∼247 nm; see . The position of the band maximum depends somewhat on the concentration, so the values in must be taken with caution. The ascorbate mono-ion (AH−) was found to absorb light between ∼230 and ∼295 nm with a maximum at ∼264.8 nm. The ascorbate di-ion (A2−) gave an absorption band between ∼260 and ∼330 nm with a maximum at about ∼298.4 nm. In addition to this band, A2− was found to have a deep UV band below ∼220 nm. A reasonable consistency is seen between our absorption data reported in and the values given in the literature (no data seem to exist for A2−). We note that the absorption maxima show a trend toward lower absorption energy (longer wavelength) along the series E(AH2) > E(AH−) > E(A2−).
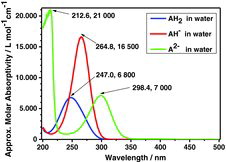
Table 9 Ultraviolet absorption data of ascorbic acid species; see Figure 27
Resonance Raman effects typically occur when the excitation wavelength lies at a wavelength where the molecule absorbs. What happened in the present case versus shifts in excitation wavelength is illustrated in –.
The Raman spectrum of AH2 obtained with 229 nm lies inside the absorption range between 210 and 290 nm, and accordingly the water bands (appearing from about 3000 to 3500 cm−1) are completely drowned out and only the strongly resonant AH2 bands appear. The Raman spectrum of AH− lies just on the edge where absorption starts for AH− (between 230 and 295 nm; ). Only measurements of the three species conducted with the visible laser lines have significant water bands. Absorption is apparently enough to make the water signal disappear and the resonance is strong enough to let the Raman spectrum stay essentially persistent. The Raman spectrum of A2− recorded with an excitation wavelength of 229 nm has a significantly intensive water band compared to AH2 and AH−. The absorption band of A2−, between 260 and 330 nm (see ) is so far away from the excitation wavelength at 229 nm that no significant absorbance occurs and resonance enhancement for the A2− molecule ion is hence absent.
The UV wavelengths 244 and 266 nm are within the range where absorption takes place, making the water Raman signal disappear in all cases ( and ). In contrast, measurements conducted with visible wavelengths occur without absorbance and RR enhancement. The same experiments conducted with UV laser lines showed no sign of the water band for AH2 and AH−. The A2− measurement with 229 nm excitation was the only UV experiment that showed a clear water band, whereas when conducted with the 244 nm laser line no sign of the water band was seen. This is a consequence of absorption in combination with the RR phenomenon.
Discussion of Modes A, B, and C
We have dealt with three specific vibrational modes called A, B, and C, illustrated in (data given in ). The vibration A in the AH2 molecule in solution (mode no. 46) was approximately described as C1 = O1 + C2 = O2 + C2 = C3 in-phase ring stretching or briefly as C1–C2–C3 ring breathing. For AH− and A2− similar motions occurred as mode nos. 44 and 42. For A (and B) only the atoms in the π-bonded lactone ring system moved, but not the atoms in the side chain. Because the absorption bands are due to π → π* transitions in the ring, it is to be expected that modes A and B are exhibiting the strongest resonance Raman effects. According to , the A modes were calculated at 1784, 1746, and 1699 cm−1 in the DFT/B3LYP/6-311++G(d,p)/PCM. The second vibration (mode B) is the C2 = C3 stretching coupled out-of-phase with the C1 = O1 stretching and with the C2–O2–H2 and C3–O3–H3 bending for AH2 or only with C3–O3 stretching in-phase for AH−. For A2−mode B in the ring was not very distinctly seen in the spectra and was coupled to OH motions of the side chain. gives calculated modes B (number 45, 43, and 39, respectively) at 1699, 1604, and 1495 cm−1. The third vibration (mode C) is an in-plane deformation of the lactone ring in combination with the C2–O2–H2, C3–O3–H3, and ring–C4–H4 angle bendings in the ring, coupled to side chain hydrogen angle deformations (see ). Modes C (number 43, 39, and 36 for the AH2, AH−, and A2−, respectively) were calculated to occur at 1433, 1415, and 1369 cm−1 ( and ).
Because of the deprotonation along the series AH2 > AH− > A2− (when protons successively split off), the coupling patterns of the atomic motions vary and hence the normal modes and their eigenvalues, but recognizable vibrations A, B, and C occurred in all of the species. The trend is an irregular shift to lower band wavenumbers values.
Conclusion
shows the UV-Vis absorption spectra of aqueous solutions of AH2, AH−, and A2−. AH2 absorbs between 210 and 290 nm with a maximum at ∼247 nm for concentrated solutions, AH− absorbs between 230 and 295 nm with a maximum at ∼265 nm, and A2− absorbs between 260 and 330 nm with a maximum at about 298.4 nm.
The RR phenomena can be documented in – showing the Raman spectra of AH2, AH−, and A2− recorded with excitation wavelengths 229 and 488 nm. The spectra can be rationalized in combination with the UV-Vis spectrum of the three compounds: The spectra recorded with 229 nm excitation wavelength gave resonance enhancements for AH2 and AH− but not for A2−. This fits with the fact that AH2 and AH− absorb light at 229 nm but A2− absorbs little light at 229 nm. Accordingly, the UV-Vis spectra hint at which excitation wavelengths are most useful for resonance enhancement of the specific compounds.
On the other hand, the presented results show what excitation wavelengths should not be used if one wants to see what an ascorbic acid-containing sample contains: In the early stages of this work we realized that no matter what kind of fruit juice, beer, or wine studied with 229 nm excitation we did not observe anything other than the ascorbic acid, naturally present or added for preservation. This effect of nonlinearity in Raman spectral intensities, here exemplified in the disappearance of the water signals, has been seen before, as recently discussed in a case where up to high concentrations of heptane could not be seen in 229 nm excited Raman spectra when toluene was present (Citation63).
Acknowledgments
The author thanks Christian Kistrup Hansen for carefully doing most of the experiments in this research. The author also thanks Peter Wood from CCSD (http://www.ccdc.cam.ac.uk/free_services/mercury; Cambridge Crystallographic Data Centre, 12 Union Road, Cambridge CB2 1EZ, UK) for confirming the late Jan Hvoslef's use of left-handed coordinate systems (Citation10, Citation25).
References
- Tolbert, B.M., Downing, M.R., Carlson, W., Knight, M.K., and Baker, E.M. (1975) Chemistry and metabolism of ascorbic acid and ascorbate sulfate. Ann. New York Acad. Sci., 258: 48–69.
- Neta, P., Huie, R.E., Mosseri, S., Shastri, L.V., Mittal, J.P., Maruthamuthu, P., and Steenken, S. (1989) Rate constants for reduction of substituted methylperoxyl radicals by ascorbate ions and N,N,N,N-tetramethyl-p-phenylenediamine. J. Phys. Chem., 93: 4099–4104.
- Zapata, S. and Dufour, J.-P. (1992) Ascorbic ascorbic, dehydroascorbic and lsoascorbic, acid simultaneous determinations by reverse phase ion interaction HPLC. J. Food Sci., 57 (2): 506–511.
- Allen, R.N., Shukla, M.K., Reed, D., and Leszczynski, J. (2006) Ab inito study of the structural properties of ascorbic acid (vitamin C). Int. J. Quantum Chem., 106 (14): 2934–2943.
- Amorati, R., Pedulli, G.F., and Valgimigli, L. (2011) Kinetic and thermodynamic aspects of the chain-breaking antioxidant activity of ascorbic acid derivatives in non-aqueous media. Org. Biomol. Chem., 9: 3792–3800.
- Schlueter, A.K. and Johnston, C.S. (2011) Vitamin C: overview and update. J. Evid. Base. Compl. Alternative Med., 16 (1): 49–57.
- Padayatti, S.J., Katz, A., Eck, P., Lee, J., Chen, S., Corpe, C., Dutta, S.K., and Levine, M. (2003) Vitamin C as an antioxidant: evaluation of its role in disease prevention. J. Am. Coll. Nutr., 22: 18–35.
- Peng, Z., Duncan, B., Pocock, K.F., and Sefton, M.A. (1998) The effect of ascorbic acid on oxidative browning of white wines and model wines. Aust. J. Grape Wine Res., 4 (3): 127–135.
- Darvin, M.E., Sterry, W., and Lademann, J. (2010) Resonance Raman spectroscopy as an effective tool for the determination of antioxidative stability of cosmetic formulations. J. Biophoton., 3 (1–2): 82–88.
- Hvoslef, J. (1969) Changes in conformation and bonding of ascorbic acid by ionization. The crystal structure of sodium ascorbate. Acta. Crystallogr., B25: 2214–2223.
- Ogata, Y. and Kosugi, Y. (1970) Ultraviolet spectra of L-ascorbic acid and cupric ascorbate complex. Tetrahedron, 26: 4711–4716.
- Forsberg, O., Johansson, K., Ulmgren, P., and Wahlberg, O. (1973) Equilibrium studies of l-ascorbate ions. Chem. Scripta, 3: 153–158.
- Berger, S. (1984) 13C, 13C spin coupling constants as a probe for mesomeric structures: vitamin C. J. Chem. Soc., Chem. Comm., 1252–1253.
- Karayannis, M.I., Samios, D.N., and Gousetis, C.P. (1997) A study of the molar absorptivity of ascorbic acid at different wavelengths and pH values. Anal. Chim. Acta, 93: 275–279.
- Juhasz, J.R., Pisterzi, L.F., Gasparro, D.M., Almeida, D.R.P., and Csizmadia, I.G. (2003), The effect of conformation on the acidity of ascorbic acid: a density functional study. J. Mol. Struct., 666–667: 401–407.
- Sato, H. and Ikeya, M. (2004) Organic molecules and nanoparticles in inorganic crystals: vitamin C in CaCO3 as an ultraviolet absorber. J. Appl. Phys., 95 (6): 3031–3036.
- Köse, D.A. and Zümreoglu-Karan, B. (2009) Complexation of boric acid with vitamin C. New J. Chem., 33 (9): 1874–1881.
- Kanters, J.A., Roelofsen, G., and Alblas, B.P. (1977) Changes in conformation and bonding of D-isoascorbic acid by ionisation. The crystal structure of sodium d-isoascorbate monohydrate. Acta Crystallogr., B33: 1903–1912.
- Njus, D. and Kelley, P.M. (1993) The secretory-vesicle ascorbate-regenerating system: a chain of concerted H+/e− transfer reactions. Biochim. Biophys. Acta, 1144 (3): 235–248.
- Brenner, G.S., Hinkley, D.F., Perkins, L.M., and Weber, S. (1964) Isomerization of the ascorbic acids. J. Org. Chem., 29: 2389–2392.
- Njus, D. and Kelley, P.M. (1991) Vitamins C and E donate single hydrogen atoms in vivo. FEBS Lett., 284 (2): 147–151.
- Washko, P.W., Welch, R.W., Dhariwal, K.R., Wang, Y., and Levine, M. (1992) Review: ascorbic acid and dehydroascorbic acid analyses in biological samples. Anal. Biochem., 204: 1–14.
- Costanzo, F., Sulpizi, M., Vandevondele, J., Della Valle, R.G., and Sprik, M. (2007) Ab initio molecular dynamics study of ascorbic acid in aqueous solution. Mol. Phys., 105 (1): 17–23.
- Hvoslef, J. (1968) The crystal structure of L-ascorbic acid, “vitamin C.” I. The X-ray analysis. Acta Crystallogr., B24: 23–35.
- Hvoslef, J. (1968) The crystal structure of L-ascorbic acid, “vitamin C.” II. The neutron diffraction analysis. Acta Crystallogr., B24: 1431–1440.
- Milanesio, M., Bianchi, R., Ugliengo, P., Roetti, C., and Viterbo, D. (1997) Vitamin C at 120 K: experimental and theoretical study of the charge density. J. Mol. Struct. (Theochem), 419: 139–154.
- Hearn, R.A. and Bugg, C.E. (1974) Calcium binding to carbohydrates: crystal structure of calcium ascorbate dihydrate. Acta Crystallogr., B30: 2705–2711.
- Hvoslef, J. and Kjellevold, K.E. (1974) The crystal structure of calcium ascorbate dihydrate. Acta Crystallogr., B30: 2711–2716.
- Abrahams, S.C., Bernstein, J.L., Bugg, C.E., and Hvoslef, J. (1978) Comparison of two independent determinations of the structure of calcium L-ascorbate dihydrate. Acta Crystallogr., B34: 2981–2985.
- Ståhl, K., Andersen, J.E.T., and Christgau, S. (2006) Strontium diascorbate dihydrate. Acta Crystallogr., 62: m144–m149.
- Koziol, A.E., Stepniak, K. and Lis, T. (1992) The crystal structure of lithium L-ascorbate dihydrate. Carbohydr. Res., 226: 43–48.
- Hughes, D.L. (1973) Crystal structure of thallium(I) L-ascorbate. J. Chem. Soc. Dalton Trans., 2209–2215.
- McClelland, B.W. (1974) Crystal and molecular structure of barium 2-O-sulfonato-L-ascorbate dihydrate. Acta Crystallogr., B30: 178–186.
- Tajmir-Riahi, H.A. (1990) Coordination chemistry of vitamin C. Part I–III. J. Inorg. Biochem., 40: 181–188.
- Tajmir-Riahi, H.A. (1991a) Coordination chemistry of vitamin C. Part II. J. Inorg. Biochem., 42: 47–55.
- Tajmir-Riahi, H.A. (1991b) Coordination chemistry of vitamin C. Part III. J. Inorg. Biochem., 44: 39–45.
- Tajmir-Riahi, H.A. and Boghai, D.M. (1992) Coordination chemistry of vitamin C. Part IV. J. Inorg. Biochem., 45: 73–84.
- Edsall, J.T. and Sagall, E.L. (1943) Raman spectra of L-ascorbic acid, tetronic acid and related compounds. J. Am. Chem. Soc., 65 (7): 1312–1316.
- Hvoslef, J. and Klæboe, P. (1971) Vibrational spectroscopic studies of L-ascorbic acid and sodium ascorbate. Acta Chem. Scand., 25: 3043–3053.
- Falk, M. and Wojcik, M.J. (1979) Effect of temperature and hydrogen-bond strength on the i.r. absorption of isolated OH oscillators: crystalline L-ascorbic acid. Spectrochim. Acta, 35: 1117–1123.
- Lohmann, W., Pagel, D., and Penka, V. (1984) Structure of ascorbic acid and its biological function. Determination of the conformation of ascorbic acid and isoascorbic acid by infrared and ultraviolet investigations. Eur. J. Biochem., 138 (3): 479–480.
- Lohmann, W., Beinhauer, K., and Sapper, H. (1984) Proton- and carbon-13-NMR spectra of ascorbate and isoascorbate. Naturwissenschaften, 71 (9): 477–478.
- Ferrer, E.G. and Baran, E.J. (2001) Reduction of vanadium(V) with ascorbic acid and isolation of the generated oxovanadium(IV) species. Biol. Trace Elem. Res., 83: 111–119.
- De Gelder, J., De Gussem, K., Vandenabeele, P., and Moens, L. (2007) Reference database of Raman spectra of biological molecules. J. Raman Spectros., 38: 1133–1147.
- Panicker, C.Y., Varghese, H.T., and Philip, D. (2006) FT-IR, FT-Raman and SERS spectra of vitamin C. Spectrochim. Acta, 65: 802–804.
- Shimada, H., Nibu, Y., and Shimada, R. (2008) Pressure effects on inter- and intramolecular vibrations in hydrogen-bonded L-ascorbic acid crystal. J. Raman Spectros., 39: 32–39.
- Jehlička, J., Vítek, P., and Edwards, H.G.M. (2010) Raman spectra of organic acids obtained using a portable instrument at −5°C in a mountain area at 2000 m above sea level. J. Raman Spectros., 41: 440–444.
- Saraiva, G.D., Lima, J.A., Jr., de Sousa, F.F., Freire, P.T.C., Mendes Filho, J., and Souza Filho, A.G. (2011) Temperature dependent Raman scattering study of L-ascorbic acid. Vib. Spectros., 55: 101–106.
- Adams, D.M. and Berg, R.W. (1976) Low-temperature far-infrared spectra of some tetrachloropalladate(II) and tetrachloroplatinate(II) salts. J. Chem. Soc. Dalton Trans., 1976: 52–58.
- Krebs Larsen, F. and Berg, R.W. (1977) A neutron diffraction study of the crystal structure of deuterated ammonium tetrachloropalladate(II) at low and ambient temperature. Acta Chem. Scand., A31: 375–378.
- Krebs, B., Greiwing, H., Brendel, C., Taulelle, F., Gaune-Escard, M., and Berg, R.W. (1991) Crystallographic and 27A1-NMR study on premelting phenomena in crystals of sodium tetrachloroaluminate. Inorg. Chem., 30: 981–988.
- Bichara, L.C., Lanus, H.E., Nieto, C.G., and Brandan, S.A. (2010) Density functional theory calculations of the molecular force field of L-ascorbic acid, vitamin C. J. Phys. Chem., A144: 4997–5004.
- Singh, P., Singh N.P., and Yadav, R.A. (2010) Study of the optimized molecular structures and vibrational characteristics of neutral L-ascorbic acid and its anion and cation radical using density functional theory. J. Chem. Pharm. Res., 2 (5): 656–681.
- Yadav, R.A., Rani, P., Kumar, M., Singh, R., Singh, P., and Singh, N.P. (2011) Experimental IR and Raman spectra and quantum chemical studies of molecular structures, conformers and vibrational characteristics of L-ascorbic acid and its anion and cation radical. Spectrochim. Acta, A84 (1): 6–21.
- Carlson, G.L., Cable, H., and Pedersen, L.G. (1976) An ab initio study of ascorbic acid. Chem. Phys. Lett., 38 (1): 75–78.
- Al-Laham, M.A., Petersson, G.A., and Haake, P. (1991) Ab initio study of ascorbic acid conformations. J. Comput. Chem., 12(1): 113–118.
- Mora, M.A. and Melendez, F.J. (1998) Conformational ab initio study of ascorbic acid. J. Mol. Struct. (Theochem), 454: 175–185.
- O’Malley, P.J. (2001) Density Functional calculations modelling the spin density distribution, hyperfine couplings, and hydrogen bonding environment of the ascorbate (vitamin C) free radical. J. Phys. Chem., B105: 11290–11293.
- Dimitrova, Y. (2006) Theoretical study of the changes in the vibrational characteristics arising from the hydrogen bonding between vitamin C (L-ascorbic acid) and H2O. Spectrochim. Acta, A63: 427–437.
- Frisch, M.J., Trucks, G.W., Schlegel, H.B., Scuseria, G.E., Robb, M.A., Cheeseman, J.R., Montgomery, J.A., Jr., Vreven, T., Kudin, K.N., Burant, J.C., Millam, J.M., Iyengar, S.S., Tomasi, J., Barone, V., Mennucci, B., Cossi, M., Scalmani, G., Rega, N., Petersson, G.A., Nakatsuji, H., Hada, M., Ehara, M., Toyota, K., Fukuda, R., Hasegawa, J., Ishida, M., Nakajima, T., Honda, Y., Kitao, O., Nakai, H., Klene, M., Li, X., Knox, J.E., Hratchian, H.P., Cross, J.B., Bakken, V., Adamo, C., Jaramillo, J., Gomperts, R., Stratmann, R.E., Yazyev, O., Austin, A.J., Cammi, R., Pomelli, C., Ochterski, J.W., Ayala, P.Y., Morokuma, K., Voth, G.A., Salvador, P., Dannenberg, J.J., Zakrzewski, V.G., Dapprich, S., Daniels, A.D., Strain, M.C., Farkas, O., Malick, D.K., Rabuck, A.D., Raghavachari, K., Foresman, J.B., Ortiz, J.V., Cui, Q., Baboul, A.G., Clifford, S., Cioslowski, J., Stefanov, B.B., Liu, G., Liashenko, A., Piskorz, P., Komaromi, I., Martin, R.L., Fox, D.J., Keith, T., Al-Laham, M.A., Peng, CY., Nanayakkara, A., Challacombe, M., Gill, P.M.W., Johnson, B., Chen, W., Wong, M.W., Gonzalez, C., and Pople, J.A. (2004) Gaussian 03 W, Rev. E.01. Gaussian, Inc.: Wallingford, CT.
- Fairchild, S.Z., Bradshaw, C.F., Su, W. and Guharay, S.K. (2009) Predicting Raman spectra using density functional theory. Appl. Spectros., 63 (7): 733–741.
- Harrand, M. and Lennuier, R. (1946) Exaltation of the intensity of certain bands in the Raman spectra emitted from solids with an absorption band near the excitation wavelength. Compt. Rend. Acad. Sci., 223: 356–357 ( in French).
- Liu, C. and Berg, R.W. (2013) Nonlinearity in intensity versus concentration dependence for the deep UV resonance raman spectra of toluene and heptane. Appl. Spectros. Rev., 48: 425–437.
- Shriver, D.F. and Dunn, J.B.R. (1974) The backscattering geometry for Raman spectrometry of colored materials. Appl. Spectros., 28 (4): 319–323.
- Asher, S.A., Ludwig, M., and Johnson, C.R. (1986) UV resonance Raman excitation profiles of the aromatic amino acids. J. Am. Chem. Soc., 108: 3186–3197.
- Asher, S.A. (2002) Ultraviolet Raman spectroscopy. In Handbook of Vibrational Spectroscopy, vol. 50. Chalmers, J.M. and Griffiths, P.R. Eds. J. Wiley & Sons: New York, pp. 557–571.
- Wittine, K., Gazivoda, T., Markus, M., Mrvos-Sermek, D., Hergold-Brundic, A., Cetina, M., Ziher, D., Gabelica, V., Mintas, M., and Raic-Malic, S. (2004) Crystal structures, circular dichroism spectra and absolute configurations of some L-ascorbic acid derivatives. J. Mol. Struct., 687 (1–3): 101–106.
- Davey, M.W., Bauw, G., and Van Montagu, M. (1996) Analysis of ascorbate in plant tissues by high-performance capillary zone electrophoresis. Anal. Biochem., 239: 8–19.
- Kimoto, E., Terada, S., and Yamaguchi, T. (1997) Analysis of ascorbic acid, dehydroascorbic acid, and transformation products by ion-pairing high-performance liquid chromatography with multiwavelength ultraviolet and electrochemical detection. Meth. Enzymol., 279: 3–12.
- Albrecht, A.C. (1961) On the theory of Raman intensities. J. Chem. Phys., 34: 1476–1484.
- Hassing, S. and Sonnich Mortensen, O. (1980) Kramers-Kronig relations and resonance Raman scattering. J. Chem. Phys., 73 (3): 1078–1083.
- Tuschel, D.D., Mikhonin, A.V., Lemoff, B.E., and Asher, S.A. (2011) Deep ultraviolet resonance Raman excitation enables explosive detection. Appl. Spectros., 64 (4): 425–432.
- Vickers, T.J., Mann, C.K., Zhu, J., and Chong, C.K. (1991) Quantitative resonance Raman spectroscopy. Appl. Spectros. Rev., 26 (4): 341–375.
- McHale, J.L. (2002) Resonance Raman spectroscopy. In Handbook of Vibrational Spectroscopy, vol. 50. Chalmers, J.M. and Griffiths, P.R., Eds. J. Wiley & Sons: New York, pp. 534–556.
- Efremov, E.V., Ariese, F. and Gooijer, C. (2008) Achievements in resonance Raman spectroscopy. Review of a technique with a distinct analytical chemistry potential. Anal. Chim. Acta, 606: 119–134.
- Liu, C. and Berg, R.W. (2012) Determining the spectral resolution of a charge-coupled device (CCD) Raman instrument. Appl. Spectros., 66 (9): 1034–1043.
- Asher, S.A. and Johnson, C.R. (1984) Raman spectroscopy of a coal liquid shows that fluorescence interference is minimized with ultraviolet excitation. Science, New Series, 225 (4659): 311–313.
- Loppnow, G.R., Shoute, L., Schidt, K.J., Savage, A., Hall, R.H., and Bulmer, J.T. (2004) UV Raman spectroscopy of hydrocarbons. Phil. Trans. R. Soc. Lond., A362: 2461–2476.
- Berg, R.W., Ferré, I.M., and Schäffer, S.J.C. (2006) Raman spectroscopy evidence of 1:1:1 complex formation during dissolution of WO3 in a melt of K2S2O7:K2SO4. Vib. Spectros. 42: 346–352.
- Berg, R.W. and Nørbygaard, T. (2006) Wavenumber calibration of CCD detector Raman spectrometers controlled by a sinus arm drive. Appl. Spectros. Rev., 41: 165–183.
- Liu, C. (2012) Implementation of Deep Ultraviolet Raman Spectroscopy, Ph.D. Thesis, Printed at DTU Chemistry: Lyngby, Denmark.
- Berg, R.W., Nørbygaard, T., White, P.C., and Abdali, S. (2011) Ab initio calculations, Raman and SERS spectral analyses of amphetamine species. Appl. Spectros. Rev., 46 (2): 107–131.
- Berg, R.W., Shim, I., White, P.C., and Abdali, S. (2012) ROA and Raman spectra of amphetamine species—quantum chemical model calculations and experiments. Am. J. Anal. Chem., 3: 410–421.
- Berg, R.W., Deetlefs, M., Seddon, K.R., Shim, I., and Thompson, J. (2005) Raman and ab initio studies of simple and binary 1-alkyl-3-methylimidazolium ionic liquids. J. Phys. Chem. B, 109 (40): 19018–19025.
- Berg, R.W. (2007) Raman spectroscopy and ab-initio model calculations on ionic liquids: a review. Monatsh. Chem. Chem. Mon., 138: 1045–1075.
- Turrell, G. (1984) Analysis of polarization measurements in Raman microspectroscopy. J. Raman Spectros., 15 (2): 103–108.
- Porto, S.P.S., Giordmaine, J.A., and Daman T.C. (1966) Depolarization of Raman scattering in calcite. Phys. Rev., 147: 608–611.
- Porto, S.P.S. and Krishnan, R.S. (1961) Raman effect of corundum. J. Chem. Phys., 47: 1009–1012.
- Dawson, P. (1972) Polarisation measurements in Raman spectroscopy. Spectrochim. Acta, 28: 715–723.
- Brooker, M.H., Hancock, G., Rice, B.C., and Shapter, J. (1989) Raman frequency and intensity studies of liquid water (H2O, H218O and D2O). J. Raman Spectros., 20 (10): 683–694.
- Baschenko, S.M. and Marchenko, L.S. (2011) On Raman spectra of water, its structure and dependence on temperature. Semiconductor Physics, Quantum Electronics and Optoelectronics, 11 (1): 77–79.