
Abstract
Abstract: Tooth enamel is the most mineralized tissue in the human body, and in this article the use of Raman spectroscopy for the analysis of tooth structure, a comparison with synthetic apatites, and use in dentistry are described. Spectral peaks that are related to dental hard and soft tissues are discussed, which provide crucial data in understanding the chemical structural properties of dentin and enamel. The Raman spectrum of dentin confirms the presence of crystalline phosphate-based minerals in dentin. Both dentin and enamel consist of two primary components: an inorganic or mineral phase that closely resembles hydroxyapatite and the Raman spectrum of dentin that confirms the presence of crystalline phosphate-based minerals in dentin. Hence, the mineral phase in dentin and enamel may be characterized essentially as nonstoichiometric substituted apatite. The presence of carbonate (A and B type) incorporated in the hydroxyapatite lattice is also confirmed by the presence of spectral bands. The organic phase, which is mainly composed of type I collagen, is confirmed by the spectral bands of amide I and amide II bands, tryptophan, and phenylalanine. Furthermore, these spectral bands associated with organic and inorganic parts of the enamel and dentin are useful in predicting early formation of carries formation.
Introduction
Vibrational spectroscopic techniques such as Raman and Fourier transform infrared (FTIR) spectroscopy for analysis of biological tissues are emerging as possible alternatives to traditional diagnostic techniques (Citation1). Raman and FTIR are complementary techniques; in the case of FTIR, a change in the dipole moment of the molecule is observed, whereas in Raman spectroscopy a change in the polarization of molecules is assessed. Recently, the use of Raman spectroscopy for biomedical applications including dentistry has significantly increased (Citation2–Citation5) due to the advances in instrumentation and development of fiber optic probes. Its applications have been expanding into biomaterials, structural chemistry, and surface analysis (Citation6).
Diseased or malignant tissues are known to cause changes in cellular orientation and biochemical changes in the body, which are termed tumor markers; these changes cause variation in the vibrational spectra, and the spectrum obtained from diseased tissue can be compared with the baseline spectrum of normal tissue to differentiate between the two (Citation6). The spectral changes are unique and specific for the given sample; hence, they are called fingerprints and thereby Raman spectroscopy has proved highly specific and sensitive compared to other spectroscopic analysis in the biomedical field (Citation3, Citation6). Diagnosing diseased tissue is limited not only to external tumors but with the introduction of specially designed miniature fiber optical probes, the technique can be employed to diagnose pathologies of the oral cavity, gastrointestinal tract, brain tissue, and ocular tissue (Citation5, Citation7–Citation14). Other advantages of Raman spectroscopy are that the technique is noninvasive, nondestructive, and simple and the results obtained are reproducible (Citation1) and require minimal or no sample preparation (Citation1, Citation6). The applications are limited not only to soft tissues but expanded research has been carried out to characterize and diagnose hard tissue pathologies such as normal and diseased bones and tooth tissues (Citation15).
Initially, when Raman spectroscopy was introduced in the biomedical field, several drawbacks such as fluorescence from the biological tissues and lack of sensitive instruments were the major concerns. In the past 10 years, advances in the development of Raman spectroscopy have gained attention in biomedical fields, compared to infrared (IR) spectroscopy. This is due to the fact that biological hard and soft tissues contain a significant amount of water and water has minimal interference in Raman spectra, whereas there is a strong spectral band in the case of IR spectroscopy (Citation6). Furthermore, IR spectroscopy requires significant sample preparation, thin sectioning of samples (Citation5–10 μm) to be analyzed in transmission mode, dilution with KBr, and grinding, which may lead to spectral changes in chemical characterization (Citation6). Spectral analysis in Raman spectroscopy is carried out in reflection mode and tissues can be probed in their native state without any or minimal sample preparation.
Several modifications in Raman spectroscopic imaging have been made to characterize a specific area of interest in the medical and dental fields; all of the modifications are ultimately aimed to determine the specific peaks in the spectrum, which are used as fingerprints to differentiate diseased tissues from normal tissues. This article reviews applications of Raman spectroscopy in dentistry and identifies important peaks and the related assignments in the spectrum of Raman spectroscopy to diagnose dental hard and soft tissue pathologies. By identifying the relevant peaks, this article serves as a guide for further studies concentrated on diagnosing diseased dental hard and soft tissues using Raman spectroscopy.
Raman Spectroscopic Investigations of Teeth
Tooth enamel is the most mineralized tissue of human body. The composition is 96 wt% inorganic material and 4 wt% organic material and water. In dentin, the inorganic material represents 70 wt%. This inorganic material is mainly composed of calcium phosphate related to the hexagonal hydroxyapatite, whose chemical formula is [Ca10(PO4)6(OH)2].
A number of methods have been used for the characterization of dental tissues. For example, mass spectrometry has been successfully used in the medical domain, considerably increasing the power of analysis; IR spectroscopy, which is used very often for analysis of biomaterial, as well as in pharmacology and geology; and, more recently, Raman spectroscopy, which have proved to be rather good techniques for the molecular analysis of dental tissues (Citation16). Raman spectroscopy and imaging have been used to characterize the mineral phase in synthetic compounds and natural tissues. Raman spectroscopy provides better spatial resolution than IR, making it a technique of choice for chemical structural analysis of such tissues. As described above, the vibrational activity is different in IR and Raman, and some spectral modes are more active in Raman than in IR. The band positions in both spectroscopies are influenced by composition and structure, especially symmetry changes, and the interpretation of these spectral bands can be challenging (Citation17). Therefore, it is extremely important to understand the spectral bands related to specific chemical structures.
Raman spectroscopy, in combination with other vibrational spectroscopy techniques such as FTIR spectroscopy, has been used extensively for the study of proteins. The peak assignments for spectral observation are well established and can be divided into vibrations associated with the -CO-NH- bonds that form the peptide backbone and those associated with the side chains of the amino acids. Two vibrations associated with the peptide bonds are strong in visible Raman scattering: amide I (1675–16755 cm−1 in solution), which is mostly an in-plane carbonyl stretch, and amide III (1240–1260 cm−1 in solution), which involves C-N stretching and N-H bending. The frequency of these peaks depends on the secondary structure of the protein. For this reason, a visible Raman spectroscopic method has been developed for the quantitative evaluation of a secondary structure (Citation18).
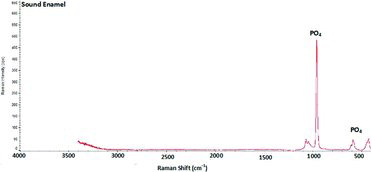
The Raman spectrum from any mineral structure and especially from human teeth can reveal its chemical composition and is a highly selective technique for investigating molecular species. The Raman analysis only concerned the dentinal part of the tooth and its chemical composition evolves with increasing age. In Raman spectroscopy, fluorescence spectra due to organic materials often dominate the much weaker Raman signals. Therefore, Raman spectroscopic studies have been limited to enamel, which contains only a small percentage of organic material. Ionita (Citation19) reported Raman spectrum of healthy enamel and carious teeth and observed a well-defined peak at 959 cm−1 vibration both at the external surface of the enamel and in sectioned enamel (). Changes in Raman spectra were observed in PO43− vibrations arising from hydroxyapatite of mineralized tooth tissue. Examination of various intensities of the PO43− vibrations (1043, 590, and 431 cm−1) showed a consistent change in the intensities of spectra of carious lesions compared to healthy enamel. The spectral changes are attributed to demineralization-induced alterations of enamel crystallite morphology and/or orientation. Any change in the hard tissue of the enamel produced by caries will result in increasing the depolarization ratio. Bands of regions ν3, ν2, and ν4 do not exhibit significant alteration in the spectral profile with a change in orientation. On the other hand, there are some changes in relative intensity of the bands, which can be attributed to their complex structure.
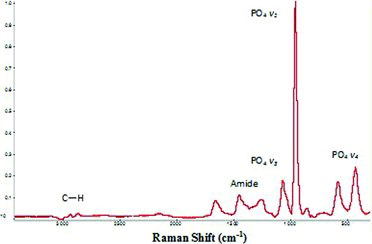
The hydroxyapatite in the dentin or enamel has been characterized by Raman spectroscopy (Citation20–Citation22). Our group at the Kroto Research Institute, University of Sheffield, conducted Raman spectroscopy of healthy intact enamel and dentin observing the characteristic peaks as shown in and , respectively. In the dentin spectrum, four main bands were observed, corresponding to the fundamental frequency modes v1, v2, v3, v4. The sharpest and most intense band, v1, relates to the symmetrical stretching of the tetrahedron of oxygen atoms surrounding the phosphorous atom. It has been observed that in the v1 spectral region (1000–900 cm−1), Raman spectra always contain detailed band peaks with a relatively narrow line width (<12 cm−1 full width at half maximum for the major peaks at 968 and 951 cm−1). There were always accompanying bands in the lower and higher wavenumbers, which probably correspond to the v2, v4, and v3 modes, respectively. However, these bands are weaker in intensity and maintain a relatively well-resolved band structure. These indicate the presence of crystalline phosphate-based minerals in dentin. The ratio of the area of the v1, v3 phosphate vibration (1200–900 cm−1) to that of the amide I vibration is directly related to the chemically determined mineral content. Carbonate-to–amide I ratios or carbonate-to-phosphate ratios indicate the extent of carbonate incorporation in the hydroxyapatite lattice, and curve-fitting of the carbonate band reveals whether the carbonate has replaced hydroxide (A-type) or phosphate (B-type) in the apatite lattice. The stretch bands assigned in tooth structure are 965–955 cm−1 (PO4 from apatite), 1255–1245 cm−1 (amide III from peptide bonds), 2940 cm−1, 1465–1455 cm−1 (CH2 wag), 1565–1555 cm−1 (amide II from peptide bonds), 1620–1610 cm−1 (Y8a, tyrosine side chain vibration), and 1665–1655 cm−1 (amide I from peptide bonds). Type I collagen accounts for 90% of the dentin protein fraction. The four main amide bands are amide I (1700–1600 cm−1), amide II (1600–1500 cm−1), amide A (3400–3350 cm−1), and amide B (3085–3070 cm−1). The amide I band is representative of the secondary structure of proteins. It can be decomposed into three main components; the most intense is the central one at about 1660 cm−1, which has low- and high-frequency shoulders. Their assignments are, respectively, C2O2…H4N4, C101…water, and C3O3…water. Usually a shoulder peak is observed near 1620 cm−1, which is attributed to the amide I feature of dentin and hydrated gel-like collagen. The frequency of this feature corresponds to the spectral peak that is assigned to the Y8a tyrosine side chain of solution-phase collagen. The tryptophan and phenylalanine also have ring-breathing vibrations near Y8a and on the low levels of tryptophan in collagen. It is likely that most of the spectral intensity comes from Y8a. Based on these assignments, nonlinear least-squares fitting was used to extract the heights of the overlapping 1580 cm−1 (amide II), 1610 cm−1 (Y8a), and amide I (1660 cm−1) bands (Citation18).
Dentin dehydration did not remove the water strongly bound to collagen and therefore did not affect the triple helical structure. The amide I bands always give three peaks typical of collagen, the 1694 cm−1 component attributed to C3O3…H2O, the 1662 cm−1 peak attributed to C2O2…H4N4, and the 1637 cm−1 peak attributed to C1O1…H2O. Collagen mineralization is thought to begin in the whole zone, and the crystals are oriented with their c axes parallel to the long axis of the collagen molecules. These results were obtained on mature erupted teeth in which the advancement of the mineralization front is essentially nil and the crystals at the mineralization front are nearly as old as those at the dentin/enamel junction and these crystals retain the nonstoichiometric apatite. Because these crystals retain the nonstoichiometric apatite, their conversion to a more crystalline apatite must not only be a mere aging process and must be regulated by their surrounding environment, which is at the mineralization front mainly composed of collagen and phosphophoryn. It is suggested that collagen regulates mineralization, and a single mutation on a gene that encodes for an α-chain is responsible for dentinogenesis imperfecta type I. In dentin, phosphophoryn has a critical role in the control of mineralization. It is secreted at the mineralization front and it binds collagen in the whole region, where mineralization is supposed to be initiated. Phosphoryn in low concentration promotes de novo apatitic formation; at higher concentrations, it inhibits crystal multiplication, probably through its capacity to bind the first crystals (Citation23).
Applications of Raman Spectroscopy for Oral Hard Tissue Pathologies
Oral cavity is composed of both hard and soft tissues. Bone supporting the teeth, which is referred as alveolar bone, constitutes hard tissues. Among the various pathologies affecting hard tissues of the oral cavity, dental caries and periodontitis, which affect teeth and alveolar bone, respectively, are the most commonly encountered clinical problems.
Application for Diagnosing Early Dental Caries
Dental caries is an irreversible microbial disease that affects the calcified structures of the tooth. Despite several preventive measures taken to reduce the incidence of dental caries, improved oral health education, and community water fluoridation, it is still one of the most common diseases experienced by most individuals at some point in their life (Citation24). Dental caries has a multifactorial etiological background, such as dental plaque (Citation25–Citation27), dietary carbohydrates, saliva, tooth morphology, and pH lowering and cariogenic potential of the dental plaque (Citation28). Clinically, dental caries is characterized by progressive demineralization of inorganic structures and destruction of the organic structure of the tooth (Citation29). Initially dental caries affects enamel and remains asymptomatic until it reaches the dentin and pulp. By the time a patient experiences symptoms, caries clinically shows a large cavity with 30 to 40% demineralization of inorganic matter, which is when it will be evident radiographically (Citation30). Presently there are various techniques to diagnose dental caries (Citation31). Current diagnostic methods can identify dental caries in advanced stages (Citation3, Citation32) where prevention can only stop the progression but cannot revert the destruction. Hence, early detection of dental caries and its prevention are necessary because early dental caries (incipient lesion) are noncavitated (Citation33, Citation34) and characterized by visible white spots when the enamel surface is dry.
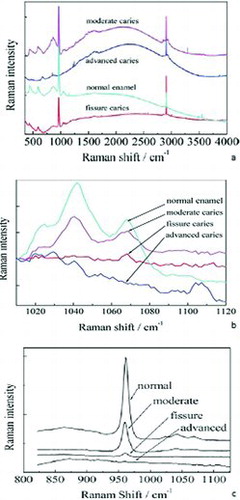
Recent studies on Raman spectroscopy have shown promising results in diagnosing early dental caries (Citation3, Citation6, Citation24, Citation35–Citation37). As stated previously, dental caries is characterized by demineralization of inorganic substance (hydroxyapatite crystals) and destruction of organic substance (collagen matter). Raman spectroscopy helps in characterizing hydroxyapatite crystals (Ca10(PO4)6(OH)2). Hydroxyapatite crystals undergo dissolution in acidic pH, and phosphate ions, (PO4)3− and hydroxyl ions (OH−) react with the hydrogen ions (H+) in the tooth–biofilm interface and form H2PO42− (Citation38). The (PO4)3− forms dissolved crystals, which shows several increased Raman peaks at 1043, 590, and 431 cm−1 (Citation3, Citation36, Citation39). Several studies strongly recommend Raman spectroscopy as an effective and relatively easy tool for early diagnosis of dental caries (Citation32, Citation40–Citation50) because during the caries process the inorganic matter of the tooth is gradually replaced by organic matter, which shows stronger organic peaks than normally seen. These changes are characterized by studying material compositions by exciting chemical bonds in the specimen (Citation51). Bulatov et al. (Citation48) studied normal and carious teeth and found that the carious process affects the phosphate and carbonate phase () of enamel and dentin, which represent the mineral phase of tooth structure.
Ko et al. (Citation3) studied extracted natural teeth with incipient carious lesion using polarized Raman spectroscopy. These teeth demonstrated white spots and areas of demineralization with an intact surface, which were not diagnosed by routine caries diagnostic techniques. They noted a change in the peak intensities at 1104, 1069, 959, 608, and 590 cm−1 as a result of a change in crystal orientation due to the demineralization process. Reduced Raman polarization anisotropy was demonstrated at 959 cm−1, which refers to phosphate ions within the hydroxyapatite crystals. Their results showed sensitivity of 97% and specificity of 100% in detecting early dental caries. This study also provided ρ959 or A959 as a single numerical value to quantitatively measure the destruction process due to caries. Ko et al. also developed new fiber optic–coupled polarization-resolved Raman spectroscopic system to simultaneously record orthogonally polarized spectra. They used a combination of multimode optical fibers and polarizing beam splitters and reported a higher depolarization ratio of 959 cm−1 peak (Citation52).
Ionita (Citation19) examined extracted natural teeth with questionable caries and observed reduced anisotropy of Raman spectra due to demineralization by the caries process and increased scattering of light due to fluorescence process. This study examined the fluorescence using a spectrofluorometer. Choo-Smith et al. attributed this increased red fluorescence to the presence of organic waste in the caries-affected area, such as advanced glycation end products (Citation43). This study also showed a similar change in the polarization of the Raman peak at 959 cm−1, which referred to PO4, and was present as a result of altered integrity of the hydroxyapatite crystals. Similar results were presented by Hewko et al. (Citation53).
Kozloff et al. (Citation54) conducted a comparative study between histological appearance, optical coherence tomography (OCT), and Raman spectroscopic findings and concluded that the peaks observed by Raman spectroscopy confirms the diagnosis of early dental caries. The conclusion was supported by the findings of histological sections and OCT imaging. Alias et al. (Citation40) studied caries-affected natural teeth and categorized extracted teeth as unaffected, affected, and heavily affected according to FT Raman spectroscopy analysis. The results of their study showed no significant difference between the three groups; however, they categorized the intensities between the three groups using Wallis and Wilcoxon rank sum tests. The intensity arbitrary unit (au) of the heavily caries-affected enamel was 5528.72, which was much higher than affected (5047.75) and unaffected enamel surfaces (5013.03).
de Carvalho et al. (Citation32) compared the fluorescence value recorded by Raman spectroscopy and an advanced caries detection aid (Diagnodent, Lake Zurich, Illinois) as shown in . The fluorescence readings of the enamel caries, dentin caries, and sound dental structure were measured and the values were compared with the Raman spectroscopy readings. The study showed a significant difference in the fluorescent readings between enamel caries (16.4 ± 2.3) and dentin caries (57.6 ± 23.7). They noticed higher fluorescence values in the samples with low Raman peaks of phosphate (960 cm−1) and fluoridated apatite (575 cm−1); the change in fluorescence values was attributed to the higher bacterial metabolic activity and organic content. This study also compared the sensitivity of Diagnodent and Raman spectroscopy in diagnosing dental caries. The study concluded that Raman spectroscopy can serve as valuable tool in diagnosing early dental caries and Diagnodent readings can diagnose at advanced stages when there is extreme demineralization and higher organic matter instead of inorganic matter.
Choo-Smith et al. (Citation43) employed polarized Raman spectroscopy (PRS) in conjunction with OCT to detect early dental caries and used polarized Raman spectroscopy to prevent false-positive results. They derived an optical attenuation coefficient parameter from high-resolution images of OCT and differentiated caries-affected and -unaffected teeth. In addition to OCT, the Raman depolarization ratio of the phosphate vibration at 959 cm−1 measured from parallel and cross-polarized Raman spectroscopy provided valuable information to diagnose early dental caries with high specificity and sensitivity. Similar research conducted by Prabhakar et al. (Citation44) also proved Raman spectroscopy as a valuable modern tool.
All of the studies discussed above have proved the specificity, sensitivity, and effectiveness of Raman spectroscopy in diagnosing dental caries; however, these initial studies have developed instruments for ex vivo studies of human teeth. Vigorous research has been ongoing to produce and commercialize more advanced and sensitive probes that can be used intraorally in different areas such as occlusal and interproximal areas (Citation6). The feasibility and preliminary study of an optical fiber designed for intraoral purposes has shown successful results (Citation44).
Applications of Raman Spectroscopy for Diagnosing Developmental Disorders of Enamel and Dentin
Raman spectroscopy will not only be useful in diagnosing dental caries; in addition, other developmental defects affecting enamel, dentin, and bone that demonstrate reduced mineral content can also be diagnosed (Citation55). Among the different developmental disorders affecting teeth, amelogenesis imperfecta is a rare developmental disorder affecting enamel. This disorder is characterized by hypomineralization and/or hypoplasia of enamel and may be associated with morphological and biochemical changes in the teeth and other structures elsewhere in the body (Citation56). Early diagnosis of these genetic disorders will not only enable a dentist to take measures to restore affected teeth but will help to diagnose other defects affecting elsewhere in the body. On the other hand, dentinogenesis imperfecta is a disorder affecting dentin and is frequently associated with defects in the jaw bones. Dentinogenesis imperfecta is characterized by the presence of translucent teeth with an opalescent sheen, demonstrating reduced mineral content, making the teeth more prone to fracture and wear. Raman spectroscopy will be very useful in these conditions to study the mineral content and severity of the disorder and can specifically identify the type of disorder and associated enzyme by studying the extracellular matrix protein. One such study was done by Renugopalakrishnan et al. on bovine amelogenin. They studied the structural characteristics of amelogenin using Raman spectroscopy and FTIR and they initiated research to obtain DNA sequence from blood samples of patients affected by amelogenesis imperfecta to subsequently clone the defective protein (Citation56).
Zavala-Alonso et al. (Citation49) studied the molecular structure of human enamel affected by fluorosis. They studied mild, moderate, and severe cases of fluorosis using micro-Raman spectroscopy and compared the structural difference in phosphate (960 cm−1) and B-type carbonate (1070 cm−1) peaks with healthy enamel. Although their study did not find a significant difference in phosphate ion peaks, there was a significant difference in B-type carbonate peaks of the fluorosis group when compared with healthy enamel, suggesting that carbonate ions are easily dissolved in the presence of fluoride.
Developmental disorders affecting the teeth usually show hypomineralization; the severity of hypomineralization varies depending on the affected genetic pattern of the particular enzyme and from patient to patient. Similarly, treatment modalities to restore the teeth vary. Hence, knowing the extent and severity of the disorders provides valuable information for treatment procedures. Raman spectroscopy characterizes and provides complete data on the mineral map and the data acquired are compared with the baseline data of healthy teeth. The Raman spectral peaks and their relative assignments of normal human enamel, dentin (Citation24), and cementum (Citation58) are shown in .
Table 1 The Raman spectra peaks and their assignments
Applications of Raman Spectroscopy for Identification of Oral Microbial Flora
The oral cavity is the entrance to the digestive system and harbors around 1 × 10¹⁴ microorganisms (Citation59). It is a complex ecological system due to its anatomy, physiology, and varied microbial flora (Citation60). With respect to the microbial flora, the oral cavity is one of the most highly populated parts of the human body (Citation59). Microorganisms are present in various parts of the oral cavity such as tooth surfaces above the gum line, tooth surfaces below the gum line, dorsum and lateral surfaces of the tongue, palate, and floor of the mouth. Oral infections constitute chronic infections of the body, and the main etiological factor for dental caries, gingivitis, and periodontitis is bacterial plaque and calculus. However, several factors influence the severity of the infection, such as oral hygiene, site of infection, type of microorganism involved, and overall oral health of the patient (Citation61). Microbial ecologists and dental scientists have identified several species of microorganisms. More than 700 bacterial species have been identified (Citation62) from samples collected from different sites in the oral cavity. Streptococcus mutans and Streptococcus sobrinus has been identified as primary etiological agents causing coronal and root dental caries; however, other organisms such as Lactobacillus, Streptococcus sanguis, Streptococcus gordonii, and Streptococcus oralis have also been reported as secondary etiologic agents (Citation60, Citation63–Citation70). Porphyromonas gingivalis, Camphylobacter, Fusobacterium, Bacteroids, and Actinobacillus actinomycetemcomitans are known microorganisms that cause gingival and periodontal infections.
Identification of microorganism is the first and foremost procedure in the treatment plan of any infections to deliver proper treatment. It is also relevant for microbiological research, food safety, industrial cleanroom maintenance, and water contamination control purposes (Citation71–Citation73). Currently, identification of microorganisms involves culture of the sample, followed by staining and observation under a microscope. These procedures are time-consuming and laborious and have limited accuracy, leading to diagnostic delay. Furthermore, the procedures of collecting the sample such as biopsy are costly and induce significant patient trauma. Recently introduced techniques such as selective plating, polymerase chain reaction, and fluorescence in situ hybridization have gained more attention in terms of speedy identification and accuracy. Recently, optical spectroscopic techniques like Raman spectroscopy have been successfully employed and are said to be accurate and also allow rapid identification and classification of a microorganism's genre, species, and strain. Studies conducted by several researchers have noted that different microbial species produce different vibrational spectra, which are specific and can identify a sample as small as 1 μm3. The advantages of Raman spectroscopy are that it is fast, precise, and low cost and organisms can be identified without tissue removal, use of dyes, labels, and contrast-enhancing agents.
In a preliminary study, Berger et al. (Citation73) employed Raman spectroscopy to measure the varying concentrations of the two most common and relevant microorganisms of Streptococcus found in the oral cavity. They used evaporated droplets of centrifuged mixtures of Streptococcus sanguis and Streptococcus mutans and determined an r2 value of 0.98 using partial least squares cross-validation. Furthermore, they measured the relative concentration of these potential caries-causing microorganisms from solid mixtures. They identified streptococcal species in various ratios by employing a home-built Raman spectroscope. The results showed a root mean squared error of 5%, which will enable clinicians to differentiate between a normal concentration level and a dangerously elevated level (Citation73). Furthermore, this research team analyzed specimens containing different species of microorganisms using optical Raman spectroscopy. They quantitatively analyzed samples of oral plaque for oral bacterial species, S. mutans, S. sanguis, and S. gordonii using near-infrared Raman spectroscopy without any reagent. The spectrum was obtained within 200 s and an error of ±0.07 was seen with a concentration scale of 0 to 1. The spectral region of 890–940 cm−1 revealed the distinctive spectral features of S. mutans and the number of cells required was found to be realistic for clinical collection of oral plaque. They concluded that Raman technique is an ideal technique for the quantitative measurement of bacterial concentration fractions in a low or high percentage of microbial specimens (Citation73).
Beier et al. (Citation70) conducted a study on mapping multiple species of oral bacteria in intact biofilms applying the optical technique of confocal Raman microscopy. Classification of the species algorithm that was developed on dried biofilms was analyzed with the spectra of hydrated biofilms for two microbial species, Streptococcus sanguinis and Streptococcus mutans. On analysis it was seen that identification of the species was accurate and spatial mapping was created within these biofilms with an accuracy of 93%. They concluded that this technique had the ability to use intrinsic chemical differences between the cells to create multidimensional maps of microbial structures without extensive knowledge of the cells’ genomes and without requiring any invasive sample preparation wherein the results would be affected and questionable.
Microorganisms living as normal indigenous oral flora can be isolated in almost all areas of the oral cavity, including the surfaces of the teeth. Initially microorganisms adhere to the salivary mucinous glycoprotein layer, termed dental pellicle, and gradually microorganisms multiply and develop as well-defined soft dental plaque (Citation75), which is determined as the sole etiologic factor for dental caries, gingivitis, and periodontitis. Furthermore, dental plaque acts as host for pathogenic microorganisms and attracts food particles to ultimately form hard dental calculus by precipitation of calcium phosphate (Citation75, Citation76), which is resistant to removal by routine tooth brushing. Maturation of dental plaque into dental calculus involves various stages, and during this procedure minerals from saliva are deposited to form a hard mass. Tsuda and Arends observed human dental calculus and characterized phosphate bands using Raman spectroscopy (Citation76). They studied spectral lines of calculus for a period of 6 months and observed no significant change. Hayashizaki et al. investigated the chemical composition, crystallinity, and crystal size with respect to site specificity using FTIR spectroscopy (Citation77). They identified four types based on the calcium phosphate crystal phase and though they did not find a significant difference in crystal size, they found a significant difference in composition of the crystal phase obtained from different sites. They also observed a difference in the degree of crystallinity; the calculus obtained from upper molars was greater than that obtained from the lower anterior teeth in terms of degree of crystallinity. Kakei et al. studied lattice images of crystallites of calculus using FTIR and their study demonstrated a central dark line that was similar to that observed in bone and synthetic hydroxyapatite crystals (Citation78). Their study concluded that the formation of dental calculus takes place similar to other calcified structures of the body but in association with microorganisms. Raman and FTIR spectroscopy provides complementary results by identifying oral microbial flora from the microbial mixture of the dental plaque and yields valuable information to provide targeted treatment of gingival and periodontal infections.
Applications of Raman Spectroscopy for Dental Biomaterials Characterization
Dental disorders such as dental caries, abnormally positioned teeth, gingivitis, periodontitis, oral tumors, and partial and complete loss of teeth require the use of various materials to restore the form and function. Materials such as waxes, acrylic resins (poly methyl methacrylate), composite resins, ceramics, metals (cobalt chromium, nickel chromium, titanium, and gold alloys), mineral bone graft materials, and regenerative membranes are currently widely used in the field of dentistry to treat different dental disorders. Performance of these materials in the oral cavity during function, including physical, mechanical, and biocompatible properties, are the prime requisites for the success of the treatment. These properties mainly depend on the composition of the materials. Though literature can provide the general composition of dental materials, they vary widely from one manufacturer to another within the same material. The composition of the dental materials remains a trade secret and dentists have limited control over changing the properties of the dental materials without knowing the exact chemical composition. Hence, knowing the composition of dental materials is very important to be able to alter the properties. Energy-dispersive X-ray spectroscopy (EDS) is the most commonly employed technique for elemental analysis or chemical characterization of the dental materials; however, EDS requires time-consuming specimen preparation for nonconducting surfaces, and detection of lighter elements is extremely difficult by standard EDS technique. Recently, several studies reported successful characterization using laser-induced breakdown spectroscopy (Citation80–Citation84).
Raman spectroscopy is the method of choice for exact identification of chemical compounds, especially the functional group of organic compounds and their interaction with human enamel and dentin. This technique is widely employed and several studies have been reported to study the chemical characteristics of dental materials. Hedzelek et al. evaluated seven groups of most commonly used dental materials using infrared spectroscopy in the range of 4000 to 400 wave numbers. Their study provided spectral line database of 23 dental materials that facilitated fast identification of chemical characteristics of organic and inorganic compounds of dental restorative materials such as acrylic resins and porcelains (Citation84). The characteristics of the Raman spectral peaks such as frequency, change in frequency, polarization, width of the peaks, and intensity of the peaks provides the composition of the material, stress/strain state, inorganic filler particle symmetry/orientation, quality of the inorganic filler particles, and amount of material, respectively. Fong et al. used a real-time near-infrared technique to study the degree of methacrylate double-bond conversion and the polymerization rate of novel polymeric dental restorative composites (Citation85).
Microcharacterization of biomaterials not only helps researchers to better understand the interaction of biomaterials with tissues but also helps to modify their properties to suit the intraoral condition (Citation87). Penel et al. performed a complete intravital study of bone and calcium phosphate biomaterial over a period of 8 months; they investigated the interaction of biomaterial with the bone of calvaria of New Zealand rabbits. Their study identified the main PO4, CO3, and collagen Raman spectral bands in both bone and biomaterials (Citation86). Seah et al. (Citation87) studied the biomimetic growth of carbonated hydroxyapatite on bioactive glass using Raman microscopy; they immersed samples in simulated body fluid for 17 days. They were able to identify amorphous calcium phosphate, transient octacalcium phosphate, matured hydroxyl apatite crystals, calcite, silica glass, and some organic impurities. Their results strongly supported the application of Raman spectroscopy to characterize chemical species present in the biologic samples and their phase transformation (Citation87).
Miyazaki et al. (Citation2) studied the dentin–resin interface using laser Raman spectroscopy. The purpose of their study was to analyze the chemical composition of two resin systems impregnated in the dentin layer. They employed bovine dentin bonded with resin composites and sectioned these samples parallel to dentinal tubules to analyze the relative quantity of hydroxyapatite, adhesive resin, and organic substrate in the dentin–resin interface. The results of this study showed inhomogeneity of dentin–resin layer and detected poor saturation of adhesive resin with a one-bottle adhesive system (Citation2). Wang and Spencer (Citation88) investigated the changes and composition of an acid-treated dentin smear layer intended for bonding purposes using confocal Raman spectroscopy. They found a mixture of disorganized and denatured collagen and minerals.
Raman spectroscopy has also been applied successfully for the nondestructive, confirmatory identification of body fluids. In a preliminary study, Virkler and Lednev (Citation89) investigated the spectral variation of one sample. Further study investigated spectroscopic signature of pure dried saliva samples collected from multiple donors using near-infrared Raman spectroscopy and confirmed that the spectral lines of the Raman spectroscopy can provide data to identify an unknown suspect in forensic investigations (Citation89).
Application of Raman Spectroscopy in Oral Soft Tissue
The oral cavity is believed to have an influence on systemic health. Various studies have shown that oral cavity plays a significant role in providing predictions and also the prognosis of underlying systemic health (Citation91–Citation93). Tissue defects range from minimal changes in microanatomy of the cell such as nuclear and cytoplasmic ratio, redox status of the cell, expression of biomarkers, composition and tissue architecture, chemical changes, and the vascularity or neo angiogenesis, and cellular perfusion. These characteristics of changes at the cellular level can be implicated in the detection of the early changes that occur in the cell periphery of the lesion and to see the presence of subclinical abnormalities. A noninvasive or minimally invasive approach to analyzing tissues requires a natural orifice or opening to gain access and the oral cavity serves as a relatively accessible site.
Future Trends in Raman Spectroscopy in Dentistry
Raman spectroscopy can be a valuable diagnostic aid in patient selection for dental implant cases. With available advanced intraoral probes, a patient's bone quality and quantity can be analyzed. Therefore, the clinician can predict the prognosis and success rate of the implant osseointegration. Fine intraoral probes can also be used to study the composition and other critical characteristics of the newly formed bone adjacent to the implant (osseointegrated bone). This provides an idea on how to better modify the surface characteristics of the implant to achieve better bone bonding properties.
Osteomyelitis and osteoradionecrosis are common complications that are seen in the oral region, commonly involving the mandible, and, when not identified at an early stage, pose a challenging clinical situation. In studies on osteomyelitis in the diabetic foot, which initially provided limited understanding of early-stage infection, a hypothesis was made that bone composition measurements would serve as an aid in the early pathophysiology of diabetic osteomyelitis. Identification of pathological minerals by Raman spectroscopy may serve as an early-stage diagnostic approach. Transcutaneous Raman spectroscopy would serve as a valuable adjunct in in vivo management and treating the scenario in cases of the mandible and maxilla. The transcutaneous approach could also pave its way in the application of spectral analysis of the blood supply of the free flap for reconstruction and analysis of the proximity of the blood vessels in cases of infections involving the facial spaces. Dicalcium phosphate dihydrate (brushite) crystals were seen to be associated with the maxillary bone in a case of fibrous dysplasia, which was also seen to be associated with diabetic foot leading to osteomyelitis. It has been proved that the presence of brushite at the bone site results in inflammation, affecting normal bone healing. Therefore, Raman spectroscopy serves as an important diagnostic aid in early detection and prognosis of disease. Recently, it has been used for the detection of oral cancer and to determine the biochemical changes in oral diseases.
Funding
Five of the authors extend their sincere appreciation to the Deanship of Scientific Research at King Saud University for its funding of this research through the Research Group Project No. RGP-VPP-152.
References
- Movasaghi, Z., Rehman, S., and Rehman, I.U. (2008) Fourier transform infrared (FTIR) spectroscopy of biological tissues. Appl. Spectros. Rev., 43: 134–179.
- Miyazaki, M., Onose, H., and Moore, B.K. (2002) Analysis of the dentin–resin interface by use of laser Raman spectroscopy. Dent. Mater., 18: 576–580.
- Ko, A.C.T., Choo-Smith, L.P., Hewko, M., and Sowa, M.G. (2006) Detection of early dental caries using polarized Raman spectroscopy. Optic. Express, 14 (1): 203–215.
- Venkatakrishna, K., Kurien, J., Pai, M.K., Valiathan, M., Nagesh Kumar, N., Murali Krishna, C., Ullas, G., and Kartha, V.B. (2001) Optical pathology of oral tissue: A Raman spectroscopy diagnostic method. Curr. Sci., 80 (5): 665–669.
- Kah, J.C.Y., Kho, K.W., Lee, C.G.L., Richard, C.J., Sheppard, R., Shen, Z.X., Soo, K.C., and Olivo, M.C. (2007) Early diagnosis of oral cancer based on the surface plasmon resonance of gold nanoparticles. Int. J. Nanomed., 2 (4): 785–798.
- Krafft, C. and Sergo, V. (2006) Biomedical applications of Raman and infrared spectroscopy to diagnose tissues. Spectroscopy, 20: 195–218.
- Li, X.Z., Bai, J., Lin, J., Liu, H., and Ding, J. (2001) Serum fluorescence and Raman spectra for diagnosis of cancer. Proc. SPIE, 4432: 124–130.
- Shim, M.G., Wilson, B.C., Marple, E., and Wach, M. (1999) Study of fiber-optic probes for in vivo medical Raman spectroscopy. Appl. Spectros., 53: 619–627.
- Shim, M.G., Song, L.M., Marcon, N.E., and Wilson, B.C. (2000) In vivo near-infrared Raman spectroscopy: Demonstration of feasibility during clinical gastrointestinal endoscopy. Photochem. Photobiol., 72: 146–150.
- Schut, T.C.B., Witjes, M.J.H., Sterenborg, H.J.C.M., Speelman, O.C., Roodenburg, J.L.N., Marple, E.T., Bruining, H.A., and Puppels, G.J. (2000) In vivo detection of dysplastic tissue by Raman spectroscopy. Anal. Chem., 72: 6010–6018.
- Buschmann, H.P., Marple, E.T., Wach, M.L., Bennet, B., Schut, T.C.B., Bruining, H.A., Bruschke, A.V., van der Laarse, A., and Puppels, G.J. (2000) In vivo determination of the molecular composition of artery wall by intravascular Raman spectroscopy. Anal. Chem., 72: 3771–3775.
- Boere, I.A., Schut, T.C.B., van den Boogert, J., de Bruin, R.W.F., and Puppels, G.J. (2003) Use of fiber-optic probes for detection of Barrett's epithelium in the rat oesophagus by Raman spectroscopy. Vib. Spectros., 32: 47–55.
- Molckovsky, A., Song, L.M.W.K., Shim, M.G., Marcon, N.E., and Wilson, B.C. (2003) Diagnostic potential of near infrared Raman spectroscopy in the colon: Differentiating adenomatous from hyperplastic polyps. Gastrointest. Endosc., 57: 396–402.
- Crow, P., Molckovsky, A., Stone, N., Uff, J., Wilson, B., and Song, L.M.W.K. (2005) Assessment of fiber-optic near infrared Raman spectroscopy for diagnosis of bladder and prostate cancer. Urology, 65: 1126–1130.
- Boskey, A.L. and Mendelsohn, R. (2005) Infrared spectroscopic characterization of mineralized tissues. Vib. Spectros., 38: 107–114.
- Tramini, P., Bonnet, B., Sabatier, R., and Maury, L. (2001) A method of age estimation using Raman microspectrometry imaging of the human dentin. Forensic Sci. Int., 118: 1–9.
- Penel, G., Leroy, G., Rey, C., and Bres, E. (1998) Micro-Raman spectral study of the PO4 and CO3 vibrational modes in synthetic and biological apatites. Calcif. Tissue Int., 63: 475–481.
- Ager, J.W., Nalla, R.K., Breeden, K.L., and Ritchie, R.O. (2005) Deep-ultraviolet Raman spectroscopy study of the effect of aging on human cortical bone. J. Biomed. Optic., 10: 034012.
- Ionita, I. (2009) Diagnosis of tooth decay using polarized micro-Raman confocal spectroscopy. Rom. Rep. Phys., 61: 567–574.
- Pezzotti, G. (2005) Raman piezo-spectroscopic analysis of natural and synthetic biomaterials. Anal. Bioanal. Chem., 381: 577–590.
- Kirchner, M.T., Edwards, H.G.M., Lucy, D., and Pollard, A.M. (1997) Ancient and modern specimens of human teeth: A Fourier transform Raman spectroscopic study. J. Raman Spectros., 28: 171–178.
- Boskey,A.L. and Mendelsohn, R. (2005) Infrared spectroscopic characterization of mineralized tissue. Vib. Spectros., 38: 107–114.
- Magne, D., Weiss, P., Bouler, J.M., Laboux, O., Daculci, G. (2001) Study of the maturation of the organic (type I collagen) and mineral (nonstoichiometric apatite) constitutents of a calcified tissue (dentin) as a function of location: A Fourier transform infrared microspectroscopic investigation. J. Bone Miner. Res., 16: 750–757.
- Matousek, P., and Morris, M.D. (2010) Emerging Raman applications and techniques in biomedical and pharmaceutical field. In Emerging Dental Applications of Raman Spectroscopy, Choo-Smith, L.P., Hewko, M., and Sowa, M.G., Eds. Springer: Heidelberg, pp. 263–284.
- Kutsch, V.K. and Yong, D.A. (2011) New directions in the etiology of dental caries disease. J. Calif. Dent. Assoc., 39 (10): 716–721.
- Stewart, R.E. and Hale, K.J. (2003) The paradigm shift in the etiology, prevention, and management of dental caries: Its effect on the practice of clinical dentistry. J. Calif. Dent. Assoc., 31 (3): 247–251.
- Loesche, W.J. (1979) Clinical and microbiological aspects of chemotherapeutic agents used according to the specific plaque hypothesis. J. Dent. Res., 58 (12): 2404–2412.
- Van Houte, J. (1994) Role of microorganisms in caries etiology. J. Dent. Res., 73 (3): 672–681.
- Shafer, Hine., and Levy. (2006) Dental caries. In Textbook of Oral Pathology, Sivapathasundaram, B. and Raghu, A.R., Eds. Elsevier: New Delhi, pp. 567–557.
- White, S.C. and Pharoah, M.J. (2004) Oral Radiology: Principles and Interpretation. 7th ed. Mosby: Toronto.
- Pretty, I.A. (2006) Caries detection and diagnosis: Novel technologies. J. Dent. 34: 727–739.
- de Carvalho, F.B., Barbosa, A.F.S., Zanin, F.A.A., Junior, A.B., Junior, L.S., and Pinheiro, A.L.B. (2013) Use of laser fluorescence in dental caries diagnosis: A fluorescence × bimolecular vibrational spectroscopic comparative study. Braz. Dent. J., 24 (1): 59–63.
- Gomez, J., Tellez, M., Pretty, I.A., Ellwood, R.P., and Ismail, A.I. (2013) Non-cavitated carious lesions detection methods: A systematic review. Community Dent. Oral Epidemiol., 41: 55–73.
- Brown, J.P., Amaechi, B.T., Bader, J.D., Gilbert, G.H., Makhija, S.K., Lozano-Pineda, J., Leo, M.C., Chen, C., and Vollmer, W.M. (2013) Visual scoring of non cavitated caries lesions and clinical trial efficiency, testing xylitol in caries-active adults. Community Dent. Oral Epidemiol. doi:10.1111/cdoe.12082.
- Ko, A.C.T., Choo-Smith, L.P., Hewko, M., Leonardi, L., Sowa, M.G., Dong, C.C.S., Williams, P., and Cleghorn, B. (2005) Ex vivo detection and characterization of early dental caries by optical coherence tomography and Raman spectroscopy. J. Biomed. Optic., 10: 031118.
- Hill, W. and Petrou, V. (2000) Caries detection by diode laser Raman spectroscopy. Appl. Spectros., 54: 795–799.
- Izawa, T. and Wakaki, M. (2005) Lasers in dentistry XI: Application of laser Raman spectroscopy to dental diagnosis. Proceedings of SPIE 5687, March 31, San Jose, CA.
- Usha, C. and Sathyanarayan, R. (2009) Dental caries—A complete changeover part I. J. Conserv. Dent., 12 (2): 46–54.
- Hill, W. and Petrou, V. (1997) Detection of caries and composite resin restorations by near-infrared Raman spectroscopy. Appl. Spectros., 51: 1265–1268.
- Alias, A., Mohd Hashim, S.R., Mihaly, J., Wajir, J., and Abdul Aziz, F. (2009) An exploratory study of human teeth enamel by using FT-Raman spectroscopy. Journal of Nuclear and Related Technologies, 6 (1): 141–146.
- Ionita, I. (2009) Early diagnosis of tooth decay using fluorescence and polarized Raman spectroscopy. Optoelectron. Adv. Mater., 3 (10): 1122–1126.
- Panayotov, I., Terrer, E., Salehi, H., Tassery, H., Yachouh, J., Cuisinier, F.J.G., and Levallois, B. (2012) In vitro investigation of fluorescence of carious dentin observed with a Soprolife® camera. Clin Oral Invest. doi:10.1007/s00784-012-0770-9.
- Choo-Smith, L.P., Hewko, M., and Sowa, M. (2010) Towards early dental caries detection with OCT and polarized Raman spectroscopy. Head Neck Oncol., 2 (Suppl. 1): O43.
- Prabhakar, N.K., Kiran Kumar, N., and Kala, M. (2011) A review of modern non-invasive methods for caries diagnosis. Arch. Oral Sci. Res., 1 (3): 168–177.
- Hassanein, O.E. and El-Broloss, T.A. (2006) An Investigation about the remineralization potential of bio-active glass on artificially carious enamel and dentin using Raman spectroscopy. Egypt. J. Solid., 29 (1): 69–80.
- Zhu, Q., Quivey, R.G., and Berger, A.J. (2007) Raman spectroscopic measurement of relative concentrations in mixtures of oral bacteria. Appl. Spectros., 61 (11): 1233–1237.
- Yeager, Y. (2008) Raman spectroscopy may offer doctors, dentists and forensic scientists a better tool for molecular detection. Sci. News, 174 (3): 22–25.
- Bulatov, V., Feller, L., Yasman, Y., and Schechter, I. (2008) Dental enamel caries (early) diagnosis and mapping by laser Raman spectral imaging. Instrum. Sci. Technol., 36: 235–244.
- Zavala-Alonso, V., Loyola-Rodríguez, J.P., Terrones, H., Patino-Marin, N., Martinez-Castanon, G.A., and Anusavice, K. (2012) Analysis of the molecular structure of human enamel with fluorosis using micro-Raman spectroscopy. J. Oral Sci., 54 (1): 93–98.
- Meshram, P., Meshram, V., Soni, A., Sundarkar, P., Thombre, A., Thombre, V., and Ghom, S. (2011) Recent trends in caries diagnosis. J. Indian Acad. Oral Med. Radiol., 23 (3): 373–376.
- Ko, A.C.T., Hewko, M., Sowa, M.G., Dong, C.C.S., Cleghorn, B., and Choo-Smith, L.P. (2008) Early dental caries detection using fiber-optic coupled polarization-resolved Raman spectroscopic system. Optic. Express, 16 (9): 6274–6284.
- Mohanty, B., Dadlani, D., Mahoney, D., and Mann, A.B. (2013) Characterizing and identifying incipient carious lesions in dental enamel using micro-Raman spectroscopy. Caries Res., 47: 27–33.
- Hewko, M.D., Choo-Smith, L.P., Ko, A.C., Leonardi, L., Dong C.C., Cleghorn, B., and Sowa, M.G. (2005) Lasers in dentistry XI: OCT of early dental caries: A comparative study with histology and Raman spectroscopy. Proceedings of SPIE 5687. March 31, San Jose, CA.
- Kozloff, K.M., Carden, A., Bergwitz, C., Forlino, A., Uveges, T.E., Morris, M.D., Marini, J.C., and Goldstein, S.A. (2004) Brittle IV mouse model for osteogenesis imperfecta IV demonstrates postpubertal adaptations to improve whole bone strength. J. Bone Miner. Res., 19 (4): 614–622.
- Crawford, P.J.M., Aldred, M., and Bloch-Zupan, A. (2007) Amelogenesis imperfect. Orphanet Journal of Rare Diseases, 2: 17. doi:10.1186/1750-1172-2-17.
- Renugopalakrishnan, V., Garduno-Juarez, R., Guerrero, J.C.H., Lavin, P.N.C., and Ilangovan, K. (1999) An integrated, holistic experimental and theoretical approach applied to the derivation of the 3D structure of bovine amelogenin implicated in amelogenesis imperfecta, a molecular disease characterized by a single point mutation. Rev. Soc. Quim. Mex., 43 (1): 24–29.
- Ho, S.P., Senkyrikova, P., Marshall, G.W., Yun, W., Wang, Y., Karan, K., Li, Chang., and Marshall, S.J. (2009) Structure, chemical composition and mechanical properties of coronal cementum in human deciduous molars. Dent. Mater., 25 (10): 1195–1204.
- Takahashi, N. (2005) Microbial ecosystem in the oral cavity: Metabolic diversity in an ecological niche and its relationship with oral diseases. Int. Congr, 1284: 103–112.
- Liljemark, W.F. and Bloomquist, C. (1996) Human oral microbial ecology and dental caries and periodontal diseases. Crit. Rev. Oral Biol. Med., 7 (2):180–198.
- Sharma, M., Tiwari, S.C., Singh, K., and Kishor, K. (2011) Occurrence of bacterial flora in oral infections of diabetic and non-diabetic patients. Life Sci. Med. Res., 32: 1–6.
- Aas, J.A., Paster, B.J., Stokes, L.N., Olsen, I., and Dewhirst, F.E. (2005) Defining the normal bacterial flora of the oral cavity. J. Clin. Microbiol., 43 (11): 5721–5732.
- Bowden, G.H.W. (1990) Microbiology of root surface caries in humans. J. Dent. Res., 69: 1205–1210.
- Ellen, R.P., Banning, D.W., and Fillery, E.D. (1985) Longitudinal microbiological investigation of a hospitalized population of older adults with a high root surface caries risk. J. Dent. Res., 64: 1377–1381.
- Loesche, W.J. (1986) Role of Streptococcus mutans in human dental decay. Microbiol. Rev., 50: 353–380.
- Sansone, C., van Houte, J., Joshipura, K., Kent, R., and Margolis, H.C. (1993) The association of mutans streptococci and non mutans streptococci capable of acidogenesis at a low pH with dental caries on enamel and root surface. J. Dent. Res., 74: 508–516.
- Socransky, S.S. and Haffajee, A.D. (1992) The bacterial etiology of destructive periodontal disease: Current concepts. J. Periodontol., 63: 322–331.
- van Houte, J. (1994) Role of microorganisms in caries etiology. J. Dent. Res., 73: 672–681.
- van Houte, J., Sansone, C., Joshipura, K., and Kent, R. (1991) In vitro acidogenic potential and mutans streptococci of human smooth-surface plaque associated with initial caries lesions and sound enamel. J. Dent. Res., 70: 1497–1502.
- van Houte, J., Lopman, J., and Kent, R. (1994) The predominant cultivable flora of sound and carious human root surfaces. J. Dent. Res., 73: 1727–1734.
- Beier, B.D., Quivey, R.G., and Berger, A.J. (2012) Raman microspectroscopy for species identification and mapping within bacterial biofilms. AMB Express, 2: 1–6. doi:10.1186/2191-0855-2-35
- Zhu, Q., Quivey, R.G., Jr., and Berger, A.J. (2007) Raman spectroscopic measurement of relative concentrations in mixtures of oral bacteria. Appl. Spectros., 61: 1233–1237.
- Zhu, Q., Quivey, R.G., Jr., and Berger, A.J. (2004) Measurement of bacterial concentration fractions in polymicrobial mixtures by Raman microspectroscopy. J. Biomed. Optic., 9 (6): 1182–1186.
- Berger, A.J., Zhu, Q., and Quivey, R.G. (2003) Raman spectroscopy of oral bacteria. European Conference on Biomedical Optics. Munich, Germany, June 22.
- Jin, Y. and Yip, H.K. (2002) Supragingival calculus: Formation and control. Crit. Rev. Oral Biol. Med., 13 (5): 426–441.
- Pearce, E.I., Gordon, J.A., and Sissons, C.H. (2001) Plaque mineral induction and inhibition properties in the formation of supragingival calculus. N Z Dent. J., 97 (427): 9–14.
- Tsuda, H. and Arends, J. (1993) Raman spectra of human dental calculus. J. Dent. Res., 72 (12): 1609–1613.
- Hayashizaki, J., Ban, S., Nakagaki, H., Okumura, A., Yoshii, S., and Robinson, C. (2008) Site specific mineral composition and microstructure of human supragingival dental calculus. Arch. Oral Biol., 53 (2): 168–174.
- Kakei, M., Nakahara, H., Kumegawa, M., Yoshikawa, M., and Kunii, S. (2000) Demontration of the central dark line in crystals of dental calculus. Biochim. Biophys. Acta, 1524 (2–3): 189–195.
- Samek, O., Telle, H.H., and Beddows, C.S. (2001) Laser induced breakdown spectroscopy: A tool for real time, in vitro and in vivo identification of carious teeth. BMC Oral Health, 1: 1–9.
- Harmon, R.S., Delucia, F.C., Lapoite, A., Winkle, R.J., and Miziolek, A.W. (2006) LIBS for land mine detection and discrimination. Anal. Bioanal. Chem., 385: 1140–1148.
- Singh, V.K. and Rai, A.K. (2011) Potential of laser induced breakdown spectroscopy for the rapid identification of carious teeth. Laser Med. Sci., 26 (3): 307–315.
- Walid, T. and Saafan, A. (2006) A quantitative analysis of mercury in silver dental amalgam alloy using laser induced breakdown spectroscopy with a portable Echelle spectrometer. Int. J. Pure Appl. Phys., 2 (3):195–203.
- Ramakrishnaiah, R., Farooq, W.A., Al Kheraif, A.A., Qasim, S., and Aldwayyan, A.S. (2012) Laser induced breakdown spectroscopic analysis of dental elastomeric impression materials. Middle East J. Sci. Res., 11 (8): 1003–1008.
- Hedzelek, W., Wachowiak, R., Marcinkowska, A., and Domka, L. (2008) Infrared spectroscopic identification of chosen dental materials and natural teeth. Acta Phys. Pol., 114 (2): 471–484.
- Fong, H., Dickens, S.H., and Flaim, G.M. (2005) Evaluation of dental restorative composites containing polyhedral oligomeric silsesquioxane methacrylate. Dent. Mater., 21 (6): 520–529.
- Penel, G., Delfosse, C., Descamps, M., and Leroy, G. (2005) Composition of bone and apatite biomaterials as revealed by intravital Raman microspectroscopy. Bone, 36 (5): 893–901.
- Seah, R.K., Garland, M., Loo, J.S., and Widjaja, E. (2009) Use of Raman microscopy and multivariate data analysis to observe the biomimetic growth of carbonated hydroxyapatite on bioactive glass. Anal. Chem., 81 (4): 1442–1449.
- Wang, Y. and Spencer, P. (2002) Analysis of acid-treated dentin smear debris and smear layers using confocal Raman microspectroscopy. J. Biomed. Mater. Res., 60 (2): 300–308.
- Virkler, K. and Lednev, I.K. (2010) Forensic body fluid identification: The Raman spectroscopic signature of saliva. Analyst, 135 (3): 512–517.
- Li, X., Kolltveit, K.M., Tronstad, L., and Olsen, I. (2003) Systemic diseases caused by oral infection. Clin. Microbiol. Rev., 13 (4): 547–558.
- Rautemaa, R., Lauhio, A., Cullinan, M.P., and Seymour, G.J. (2007) Oral infections and systemic disease—An emerging problem in medicine. Clin. Microbiol. Infect., 13 (11): 1041–1047.
- Iacopino, A.M. (2008) Surveillance spotlight: Current concepts in oral–systemic health. J. Can. Dent. Assoc., 74 (5): 418–420.
- Warnakulasuriya, S., Johnson, N.W., and Van der Waal, I. (2007) Nomenclature and classification of potentially malignant disorders of the oral mucosa. J. Oral Pathol. Med., 36 (10): 575–580.