Abstract
In a typical irrigation practice the soil water content is maintained at or near field capacity, which can affect hydrological processes such as deep percolation and runoff in different ways. The aim of this study was to evaluate these effects for a partially irrigated, small watershed in the Canadian prairie using the Soil Water Assessment Tool (SWAT). The watershed was defined by upstream (inlet) and downstream (outlet) monitoring stations located along a short reach of a river. SWAT was calibrated and validated using the net flow between the upstream (inlet) and downstream (outlet) locations because the watershed was defined by this reach. Runoff contribution to the incremental streamflow was minimal, as indicated by the reduced values of the calibrated initial curve number (CNII) (CNII range 49–59). Irrigation activity increased runoff depth but the differences between irrigated and non-irrigated areas were not statistically (α ≤ 0.05) significant. The low runoff contribution was also corroborated by the streamflow record that demonstrated the low potential for runoff generation in the watershed. The only apparent runoff occurred after a major rainfall event of a cumulative depth of more than 200 mm. The modelling also showed that the shallow aquifer discharge was the main streamflow constituent. Precipitation during May to July was responsible for 70–90% of the seasonal deep percolation. By the end of the season the deep percolation from the irrigated areas exceeded that of the non-irrigated areas by up to 70%. Thus, the irrigation activity in the watershed did not change the water partitioning among the existing hydrological pathways but had temporal effects on the magnitudes of runoff and, more importantly, deep percolation and the subsequent groundwater discharge in the main reach.
Dans une pratique d’irrigation type, l’hydratation du sol est maintenue à une capacité au champ ou à un état hydrique proche de la capacité au champ, ce qui peut influer de différentes manières sur les processus hydrologiques tels que la percolation profonde et le ruissellement. La présente étude avait pour but d’évaluer ces effets pour un petit bassin hydrographique partiellement irrigué, dans les Prairies canadiennes, à l’aide de l’outil d’évaluation de l’eau et du sol SWAT (Soil and Water Assessment Tool). Le bassin a été défini grâce à des stations de surveillance en amont (entrée) et en aval (sortie), situées le long d’un court tronçon de rivière. Le modèle SWAT a été étalonné et validé à l’aide du débit net entre les emplacements en amont (entrée) et en aval (sortie) parce que le bassin hydrographique a été défini en fonction de ce tronçon. L’apport d’eaux de ruissellement à l’écoulement fluvial marginal était minime, comme l’indiquent les valeurs réduites de l’indice initial étalonné (CNII) (étendue de l’indice : 49 à 59). Les activités d’irrigation ont eu pour effet d’augmenter la profondeur de ruissellement. Cependant, les différences entre les zones irriguées et les zones non irriguées n’étaient pas statistiquement significatives (α ≤ 0.05). Le faible apport d’eaux de ruissellement a également été corroboré par l’enregistrement des débits du cours d’eau, lequel a démontré le faible potentiel de production d’écoulements dans le bassin hydrographique. Le seul écoulement apparent s’est produit après un événement de précipitation majeur d’une profondeur cumulative de plus de 200 mm. La modélisation a également révélé que le débit de l’aquifère peu profond était le constituant principal de l’écoulement. Les précipitations de mai à juillet étaient responsables de 70 à 90 % de la percolation profonde saisonnière. À la fin de la saison, la percolation profonde des zones irriguées dépassait celle des zones non irriguées dans une proportion allant jusqu’à 70 %. Par conséquent, les activités d’irrigation dans le bassin hydrographique n’ont pas modifié la répartition de l’eau entre les trajectoires hydrologiques existantes, même si elles ont eu des effets temporels sur l’ampleur de l’écoulement et, qui plus est, sur la percolation profonde et la décharge d’eau souterraine consécutive dans le tronçon principal.
Introduction
Quantification of the components of the hydrological balance equation is important to understanding hydrological processes, and is the prime objective for hydrologists (Klemeš Citation1988). However, quantification of hydrological components solely by field measurements is often a formidable task in terms of time, effort and cost. Therefore, researchers routinely employ hydrological models to gain a better understanding of water movement and distribution. Modelling results are often corroborated with available field observations. Mishra et al. (Citation2005) calibrated and validated a lumped rainfall runoff model for several watersheds in India using streamflow as an indicator and used the results to hypothesize about the effect of deep percolation on base flow. Guan et al. (Citation2010) found through numerical modelling using HYDRUS (Software by PC-Progress, www.pc-progress.com) that a semi-permeable layer was restricting approximately 95% of the percolation that could have occurred without the presence of the impeding layer. Mattern and Vanclooster (Citation2010) combined a stochastic function with HYDRUS 1-D to estimate the travel time of percolating water through the vadose zone. A stochastic approach was also used by Janssen et al. (Citation2010) to evaluate the effect of heterogeneity of saturated hydraulic conductivity and crack formation on deep percolation in paddy soils. Gomez-Delgado et al. (Citation2010) calibrated the Soil Vegetation Atmosphere Transfer (SVAT) model against observed streamflow for a micro watershed of 1 km2 in area. The intermediate output of the model reasonably matched the observed evapotranspiration, soil water content and water table. Further conclusions concerning the origins of streamflow and the relative importance of deep percolation were inferred from model output rather than based on field measurements. Fujieda et al. (Citation1997) combined field measurements of canopy interception and streamflow with conceptual modelling of the soil water content to quantify the components of streamflow in two forested subtropical catchments. They concluded that approximately 50–60% of annual precipitation contributes to the streamflow as base flow via subsurface routes, while 5 and 6% of the total precipitation converts to surface runoff and subsurface flow, respectively.
Irrigation in Alberta comprises two-thirds of the irrigated area in Canada. Approximately 112,000 ha are developed by private enterprises and more than 500,000 ha of irrigated land are organized in 13 irrigation districts in the South Saskatchewan River basin (Technology & Innovation Branch of Alberta Agriculture and Food Citation2000). Southern Alberta’s irrigation infrastructure consists of a network of on- and off-stream reservoirs to divert and store excess spring water for use during the crop growing season, combined with a comprehensive system of surface and subsurface pipelines to deliver the irrigation water to the farms and return the excess water to the river (Technology & Innovation Branch of Alberta Agriculture and Food Citation2000). Irrigation supports an abundance of crop production in the dry southern part of Alberta and allows farmers to get through extended periods of drought. However, studies have shown that irrigation and its related management practices artificially change the river storage and pose contamination hazards to the surface water and shallow aquifers. Long-term water monitoring by Beke et al. (Citation1993) showed that precipitation and irrigation contributed directly to the water table. Little et al. (Citation2003), investigating the relationships between landuse and surface water quality, found positive correlations between total phosphorus and total nitrogen concentrations with the proportions of cereals and irrigated lands. Rodvang et al. (Citation2004) established the vulnerability of shallow groundwater contamination under irrigated, manured farms, and McCallum et al. (Citation2008) showed evidence of local denitrification as a result of the mixing between percolated water and shallow groundwater. Therefore, study of hydrological pathways by which irrigation may affect shallow aquifers and surface water is warranted.
The Soil Water Assessment Tool (SWAT) (Arnold et al. Citation1998) has been extensively used worldwide in watershed hydrological modelling (Gassman et al. Citation2007). The review of SWAT conducted by Gassman et al. (Citation2007) showed that most SWAT calibration-verification studies used streamflow or runoff as an indicator, but the model was used for a wide range of hydrological applications. These included simulation of soil water content (Deliberty and Legates Citation2003; Mapfumo et al. Citation2004; Narasimhan et al. Citation2005), the evaluation of the effect of agricultural and structural Beneficial Management Practices (BMPs) on water quality (Stewart et al. Citation2006; Gollamudi et al. Citation2007; Gitau et al. Citation2008) and the assessment of the effectiveness of structural BMPs on reducing soil erosion (Bracmort et al. Citation2006; Yang et. al. Citation2009).
This study considers a small prairie watershed within the Lower Little Bow (LLB) watershed, which is a part of the Watershed Evaluation of Beneficial Management Practices (WEBs) program in Canada. This watershed is unique because it is not a typical “pear-shaped” watershed with a single outlet, but rather is a small watershed associated with a short-reach on a small river that contains upstream and downstream monitoring stations. The objective of this study is to evaluate the effect of irrigation on the runoff and groundwater recharge from deep percolation in the LLB watershed using SWAT.
Methods
Site description
The study watershed is part of the LLB watershed, located in southern Alberta, Canada, approximately 40 km north of Lethbridge, comprising an area of approximately 34 km2 (Figure ). The watershed contains cereals, pasture and forages. About half of the watershed is irrigated by centre pivot systems. A portion of the irrigated water is supplied by the Lethbridge Northern Irrigation District, and the remainder comes directly from the river main reach. Excess irrigation water is returned to the river. Two-thirds of the watershed is comprised of Orthic Dark Brown Chernozems, while Rego Dark Chernozems and Orthic Regosols comprise the remaining third (according to the Canadian Soil System Classification, Alberta Agriculture and Rural Development Citation2007).
Description of SWAT model
The SWAT model is based on the following surface water balance equation (Neitsch et al. Citation2002):(1)
where SWt is the soil water content (mm) at the end of the simulation period, SWo is the initial soil water content (mm), P is the total precipitation on day i (mm), R is the amount of surface runoff generated on day i (mm), E is the actual evapotranspiration on day i (mm), DP is the amount of water percolating to the vadose zone (mm), defined in SWAT as the unsaturated zone between the bottom of the soil profile and the top of the shallow aquifer, on day i, and Q is the amount of lateral flow on day i (mm).
In SWAT the watershed is subdivided into different sub-watersheds; in turn each sub-watershed can be divided into several Hydrological Response Units (HRU), which are the basic simulation units in SWAT. The hydrological components of Equation (Equation1(1) ) are calculated for each HRU (Neitsch et al. Citation2002). A storage routing method is used to determine the deep percolation (DP), where DP is a function of soil water content (mm) (SWC), field capacity (mm) (FC) and saturated hydraulic conductivity (mm/hr) (Ksat). Water percolates out of a soil layer when the SWC in that layer exceeds FC. The amount of water (mm) percolating (PERCl) to the next layer is determined as:
(2)
where △t is the length of the time step (hrs), ESWl is the excess soil water content in the layer l (mm) defined as:
and Tperc is percolation travel time (hrs) and calculated for each layer as:(3)
where SSW is the saturated water content for each layer. The water that percolates from the bottom layer and enters the vadose zone is considered as DP.
In SWAT the groundwater system consists of two aquifers in each subbasin: a shallow unconfined aquifer and a deep confined aquifer. Water seeps from the shallow to the deep aquifer according to a fixed aquifer percolation coefficient. The water entering the deep aquifer is assumed to move out of the system or contributes to the streamflow somewhere outside the watershed. On the other hand, the shallow unconfined aquifer discharges to the main reach of the watershed provided that the water level threshold in the shallow aquifer is met or exceeded. The water stored in the vadose zone is eventually converted to recharge into the shallow aquifer. This recharge is determined according to the following equation:(4)
where wrchg,i is the amount of water entering the shallow aquifer as recharge on day i (mm), δgw is the delay drainage time (days), and wseep is the total amount of recharge (mm) entering the aquifer from deep percolation and bypass flow, which in SWAT accounts for seepage through shrinkage cracks formed in Vertisols. Bypass flow is not an issue in this study because of the absence of Vertisols in the LLB watershed.
The shallow aquifer discharge is estimated by SWAT according to the following equation:(5)
where Qgw,i is the groundwater flow (mm) into the main reach on day i, αgw is the base flow recession curve, and Δt is the time step (days).
SWAT model construction and inputs
The SWAT model was constructed using ArcSWAT Version Beta 0.7.1, an interface between the Geographic Information System (GIS) software ArcGis 9.1 platform and SWAT. The data requirement for the ArcSWAT interface consisted of climatic data, on-farm agricultural practices and three GIS layers: the Digital Elevation Model (DEM), a soil map and a landuse map.
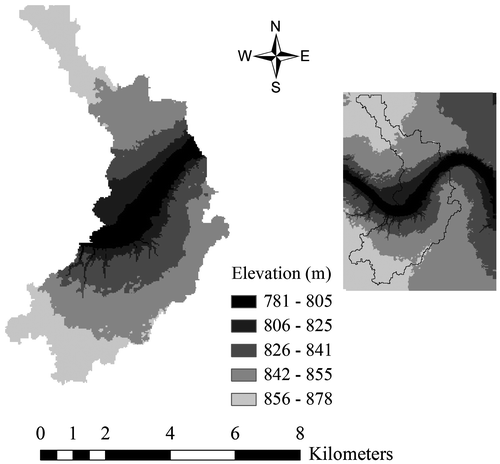
The DEM was created using air photos at a scale of 1:30,000. The data were initially collected at a mesh spacing of 10 m and refined using information on the slope, channels and drainage divides. The resulting DEM was imported into ArcView and interpolated using the Inverse Distance Weight (IDW) method. To delineate the WEBs watershed, the upstream (LB4-14) and downstream (LB4) monitoring points were considered as the watershed inlet and outlet, respectively (Figure ).
The resulting DEM (Figure ) was used to delineate the LLB watershed. The watershed stream network generated during the delineation process was compared to the actual hydrological network by superimposing the predicted stream network over an air photo image of the project area.
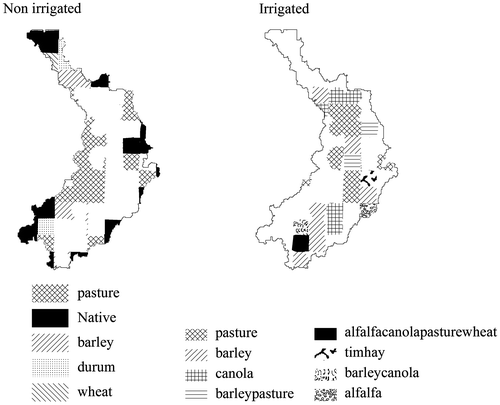
The landuse and crop cover map was based on the Alberta township system (36 sections of land; each township is 6 × 6 miles). A survey of the farmers in the watershed was used to obtain their on-farm agricultural practices which included the type and rate of fertilizer applications, and the types of crops cultivated in each quarter. Therefore, a GIS polygon shape layer was prepared; each quarter section (0.5 × 0.5 miles) was represented by a polygon, and the appropriate attributes and properties were added to each polygon. Figure shows the resulting landuse map.
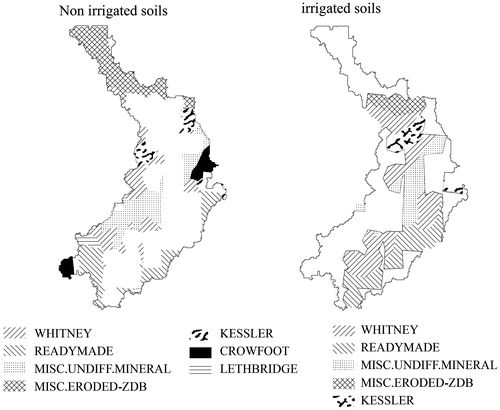
Soil data from the Alberta soil inventory database (Agrasid 3.0) were obtained in the form of GIS polygon shape files representing the soil series, and database tables containing the attributes and properties of the available soil series. The database tables were linked with the shape files, and then the major soil information was extracted. Figure shows the resulting soil series map.
Figure 1. The location of the Watershed Evaluation of Beneficial Management Practices program (WEBs) Lower Little Bow study area; the delineated watershed and the locations of monitoring sites. LB4-14 and LB4 are the upstream and downstream streamflow monitoring sites, respectively. Data from both sites were provided by Agricultural and Agri-Food Canada.
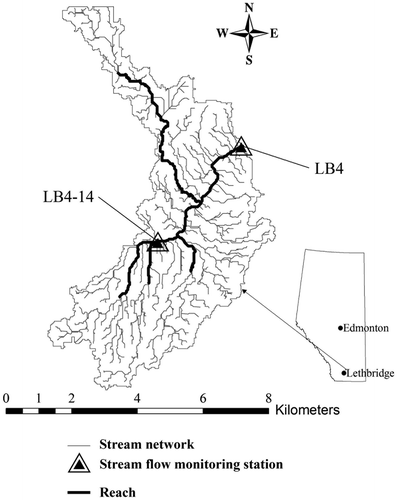
Figure 2. The Digital Elevation Model (DEM) for the WEBs Lower Little Bow watershed (left hand side) clipped from the DEM created for the anticipated area (right hand side) from which the watershed was delineated.
The soil series in the watershed belong to three main soil types at the subgroup level: Orthic Dark Brown Chernozems, Rego Dark Chernozems and Orthic Regosols, encompassing 63.4, 16.9 and 19.4% of the watershed area, respectively.
Soil depth and texture are the main differentiating factors of Orthic Dark Brown Chernozems. The Kessler (KSR) soil series has a predominantly sandy loam soil profile. The soil texture of all other soil series is medium- to fine-textured material, mainly loamy to clay loam. For example, the texture of the Whitney (WNY) soil series is very similar to that of the Lethbridge (LET) soil, but the Whitney soil profile is shallower than the Lethbridge profile. The Whitney soil series is distinguished by the layering of medium-textured materials over medium- to fine-textured materials. Approximately 17% of the watershed area is comprised of Rego Dark Brown Chernozems, which are characterized by the lack of a B horizon. The soil along the main reach is an Orthic Regosol. The soils adjacent to the main reach belong to the misc.undiff.mineral soil series characterized by a shallow soil profile of approximate depth of 1 m.
Comparing Figures and shows that contrasting all combinations of irrigated and non-irrigated areas with respect to soil type and landuse is not possible. For example, canola and the KSR soil are within the irrigated areas. However, some comparisons are possible. These are irrigated and non-irrigated barley in WNY soil, irrigated and non-irrigated pasture in WNY soil, and irrigated and non-irrigated pasture in Misc.Undiff.Mineral soil (ZUN).
A total of 251 soil textural samples were collected in the fall of 2006 in order to refine the watershed’s soil characterization. The clay and sand contents were determined at the soil sample locations and then interpolated for the entire watershed using the IDW method. Both sources of information were used to establish reasonable ranges of soil input parameters for further use in the SWAT model calibration. Figure shows the distribution of the sand and clay fractions in the watershed. The northern part of the watershed is characterized by low clay (4–15%) and high sand (55–88%) fractions. South of the main reach, however, the soils adjacent to the main reach are mostly sandy (loamy sand to sandy) close to LB4; farther upstream the texture is finer (sandy loam).
Figure 5. The clay (left hand side) and sand (right hand side) fractions distribution of the top soil layer interpolated from 251 samples using the IDW (Inverse Distance Weight) method.
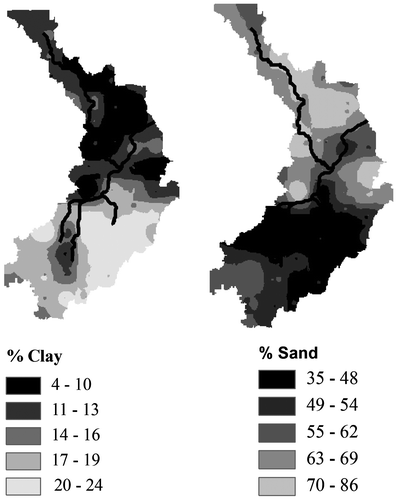
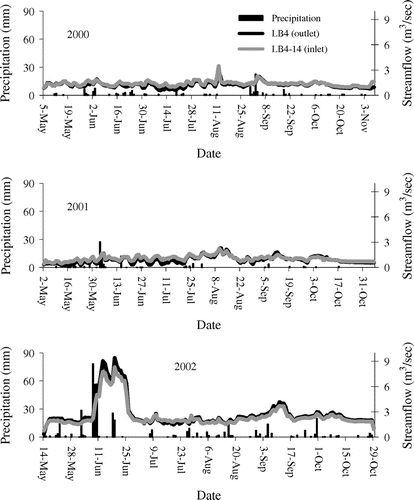
Figure shows the flow rate during 2000–2002 at the upstream and downstream stations, LB4-14 and LB4, respectively. Comparing the flow rates at the two locations reveals that approximately 10% of streamflow had originated within the watershed area. This close magnitude of the flow rates at the downstream and upstream sites could prevent meaningful simulation of the flow rate at the outlet since most of the flow was coming from the upstream site. Therefore, the purpose of the hydrologic modelling was to simulate the net streamflow defined as the difference in the volume discharge between the inlet (upstream site) and the outlet (downstream site). Another important reason is that the watershed is superimposed on the reach of the river; therefore, for the purpose of using the model in the future for evaluating BMPs in the watershed, it was necessary to calibrate and validate the model against the differences between the inlet and the outlet. Because of the low magnitude of the daily net streamflow, the model was calibrated and validated based on the monthly sum of the daily net streamflow. Running the model on a daily time step and calibrating and validating on monthly sum is common in the published literature, for example Spruill et al. (Citation2000).
Figure 6. The observed streamflows during 2000–2002 at the inlet (LB4-14) and outlet (LB-4) of the watershed. The solid vertical bars represent the precipitation observed at iron spring station.
The irrigation water comes from two sources: (1) from an outside source (862 ha) provided by the Lethbridge Northern Irrigation District (LNID) located south of the main reach and (2) for the remaining 700 ha of irrigated land in the watershed, water is diverted from the main reach of the river. Irrigation return flow is calculated at the end of each SWAT run as the difference between the estimated potential water requirements supplied by the LNID and actual irrigation (found in output.hru SWAT output file) in the watershed and added to the observed incremental stream flow balance.
The weather data, consisting of precipitation, relative humidity, wind speed, solar radiation, and minimum and maximum air temperatures were acquired from the Iron Springs weather station (approximately 16 km from the main reach), available online from the Irrigation Management Climate Information Network (IMCIN) managed by Alberta Agriculture and Rural Development. The climatic record was also supplemented with data collected from the Lethbridge weather station that was available online from Environment Canada National Climate Data and Information Archive. The high monthly precipitation in June 2002 is especially notable (Table ).
Table 1. Total monthly precipitation, and average monthly minimum and maximum temperatures for the simulation period of 2000–2002.
The extent of the irrigation activity is visible from the photo images, which were used to delineate the irrigated areas. Information from farmers and field observations was also gathered and compiled with the initial delineation from the photo images to obtain the full extent of the irrigation activity in the watershed. The irrigated areas comprised 1562 of 3318 ha, or approximately 47% of the watershed area. The two main irrigated landuses were barley and pasture.
Farmers north of and adjacent to the main reach diverted their irrigation water directly from the watershed’s main reach; however, the Lethbridge Northern Irrigation District (LNID) supplied farmers south of the main reach with irrigation water. Based on the LNID boundaries, the district supplied 50% of the irrigation demand by farmers south of the main reach.
The farmers in the LLB watershed usually irrigate on a weekly basis with irrigation depths of 38 and 44 mm for cereals and grasses, respectively. The irrigation schedule for the years 2000–2002 was reconstructed based on the average daily evaporation published by Alberta Agriculture, Food, and Rural Development, which is used by the farmers in the LLB as a guideline. The average potential daily evaporation was compared with rainfall depth, and an irrigation event was considered whenever the deficit, defined as the difference between cumulative potential evapotranspiration and cumulative rainfall, exceeded 38 mm for cereals and 44 mm for grasses. Furthermore, it was assumed that withdrawal from the main reach occurred over a period of few days to avoid an undue demand and thus the risk of drying up the river.
The reconstructed irrigation schedule approximately represented the irrigation practices in the watershed; however, the exact timing of the irrigation events may have differed from the actual unknown schedule. This uncertainty was minimized for the calibration and validation of the SWAT model by using the monthly sum of the net streamflow. Interpretations can still be obtained from the daily output of the model; however, they should be restricted to the discussion of average trends or processes occurring in time frames equal to or greater than one month due to uncertainty of the reconstructed irrigation schedule.
The watershed was subdivided into seven sub-basins to coincide with water quality and streamflow monitoring sites. The irrigated areas were merged with landuse maps, and HRUs were defined using thresholds of 14 and 25% for the landuse and soil type, respectively. The resulting 29 HRUs consisted of four types of landuse (pasture, barley, irrigated pasture and irrigated barley) and seven soil series (Kessler, Whitney, misc. undiff. Mineral, Crowfoot, misc. eroded, Lethbridge and Readymade). However, some of the HRUs were redrawn manually to preserve the total irrigated areas, resulting in a final count of 40 HRU(s).
The starting day of the simulation was set as 1 January 1990 to allow for the equilibrium of the initial soil moisture content and shallow and deep aquifer storages. It was assumed that the pasture was established before 2000, and a “no kill harvest” operation was simulated on 30 September of every year with a harvest efficiency of 80% removed biomass and 20% as residue conversion. The agricultural practices for barley consisted of primary and secondary tillage on 20 and 25 April, respectively, followed by seeding on 1 May (Table ). The crop was harvested on 15 August. The potential heat units (PHUs) for each crop were calculated from the average cumulative heat units during the simulation. The default values of the SWAT crop database were accepted for the base temperature for plant growth, maximum leaf areas index (LAI) and other plant parameters. For the fertilized farms, nitrogen and phosphorus fertilizers were applied on 15 April of each year.
Table 2. The on-farm agricultural practices and the crop parameters.
Statistics of the input and ouput parameters
The SWAT parameters were calibrated by an automatic procedure which was described in detail by Rahbeh et al. (Citation2011). The procedure aimed at finding appropriate statistical distributions for the input variables instead of seeking an optimal set of input variables. This was achieved by keeping the best 100 performing parameter sets and output associated with each set; thus each input and output was represented by 100 values. These values were used to calculate the means, variances and confidence intervals weighted over the watershed area or the areas of the different types of crop cover or irrigation practices. The weighted averages of SWAT parameters were calculated for each data set as:(6a)
If the parameters are defined on the watershed level:(6b)
where Pavg is the weighted average for a SWAT parameter, Arean is the n HRU area, nHRU is the total number of the HRUs, Pn is a parameter defined on an HRU level, Areat is the total area of the HRU(s) involved in the calculation, and PL is a parameter defined on the watershed level.
Then, the mean, variance, and confidence intervals were calculated using the 100 data sets:(7)
where N is the total number of data sets (N =100) and denotes the mean of Pavg values. The variance is determined as:
(8)
The confidence intervals, at which the parameter value and its simulated estimates are not statistically significant at 5% level (α = 0.05) or 1-α = 0.95 probability, are expressed as: (9)
where z is the inverse cumulative probability of 1–α/2, t
(1 - α/2) =
(0.975) = z = 1.96.
SWAT model calibration and validation
The model was calibrated automatically based on the concepts of competitiveness and complex shuffling (Duan et al. Citation1992; Tolson and Shoemaker Citation2007). One of the main difficulties in calibrating this study site was the short observed record and climatic variability manifested by the 2000 and 2001 below average precipitation seasons, and the above average precipitation season of 2002. In an earlier research endeavour, we attempted to tackle this large variability in the observed record by splitting the record evenly into two groups. Then we proceeded with a two-way calibration validation process where the model was calibrated, then validated each time on the opposite group. This method clearly demonstrated the effect of the climatic variability on the validity of the calibration results. A full discussion of the two-way calibration validation scheme and its implications as well as a detailed description of the automatic calibration method was presented in a previous publication (Rahbeh et al. Citation2011). In this study, however, we opt for the more traditional split-sample method that utilizes the main portion of the observed record for calibration and reserves the remaining fraction for validation. As such, the data of 2000 and 2001 were used for the model calibration, while 2002 was reserved for validation.
Table shows the SWAT input parameters selected for model calibration. A sensitivity analysis indicated that the streamflow simulations were most sensitive to the initial curve number (CNII) and available water content (AWC). Other sensitive parameters included: (1) the deep aquifer percolation fraction (RECHRG_DP), which denotes the fixed fraction of the deep percolation water allocated for the recharge of the deep aquifer, (2) the REVAPMN (mm) which is defined as the depth of water in the unconfined aquifer at which water will start moving from the unconfined aquifer to the soil profile to offset water deficiencies, (3) GW_DELAY (day), represented by δgw in Equation (Equation4(4) ), which is the time required for the deep percolation water to start recharging the unconfined aquifer, (4) GWQMN (mm) which is the minimum depth of water in the confined aquifer for discharge to occur into the main reach, (5) ALPHA_BF (day), represented by αgw in Equation (Equation5
(5) ), which is the base flow recession index and (6) GW_REVAP which is a coefficient that denotes the fraction of daily potential evapotranspiration offset by water in the unconfined aquifer when GWQMN is attained or exceeded.
Table 3. The definition and range of values of the parameters used in Soil Water Assessment Tool (SWAT) calibration.
The soil saturated hydraulic conductivity (Ksat) was also included as a calibration parameter for its significance in determining the deep percolation as stated in Equation (Equation3(3) ).
The plant uptake compensation factor (EPCO) was included as a plant-related factor. EPCO values can range from 0.01 to 1. EPCO values approaching 1.0 allow the plant to uptake more water from the lower soil layer to meet the transpiration demand. Similarly, ESCO, defined as the soil evaporation compensation coefficient, was also included in the calibration to allow the model to determine the soil water depth distribution to meet the evaporative demand. The maximum ESCO value is 1.0. As ESCO is reduced, the model is allowed to draw more water from the lower soil layers to meet evaporative demand (Neitsch Citation2002).
The streamflow during the growing season was not sensitive for the snowmelt parameters; therefore, these parameters were not calibrated. However, snowmelt does affect the soil water content during spring and soil water level at the beginning of the growing season; therefore, snowmelt was simulated using the default values for snow melt. These are the base temperature (°C) (SMTMP), melt factor for snow on 21 June (mm/°C) (SMFMX), melt factor for snow on December 21 (mm/°C) (SMFMN) and snow pack temperature lag factor (TMP). The default values were 0.5, 4.5, 4.5 and 1 for SMTMP, SMFMX, SMFMN and TMP respectively.
The soil profiles were split into a surface layer (representing 30 cm of the upper soil profile) and a subsurface layer (from the bottom of the surface layer to a depth of 100–150 cm depending on the soil type) to minimize the number of calibrated parameters and to simplify the vertical heterogeneity within the soil profiles. The calibration ranges of Ksat and AWC were initially selected based on the values reported in the Agrasid 3.0 database, then adjusted based on the textural analysis of the 251 soil samples collected from the watershed that indicated lighter soil textures than those suggested by the Agrasid 3.0.
Including the surface and subsurface AWC and Ksat, a total of 13 parameters were considered for the calibration process, and minimum and maximum values were assigned for each parameter, except for CNII as demonstrated in Table . The CNII values were assigned according to the soil hydrologic group and soil cover (Neitsch Citation2002), and modified during the calibration using multiplier values between 0.62 and 1.1 to maintain CNII values between 30 and 91.
Results and Discussion
Calibration and verification
SWAT suitably simulated the monthly incremental changes in the streamflow (Figure ). The model accurately predicted the decreases in incremental flows during July 2000, 2001 and 2002 at the height of the irrigation season. It also predicted the peak increase in incremental flow associated with 250 mm of rainfall (Table ) during June 2002.
Figure 7. The comparison between the observed simulated monthly incremental changes in streamflow. Negative incremental values indicate a net decrease in river storage.
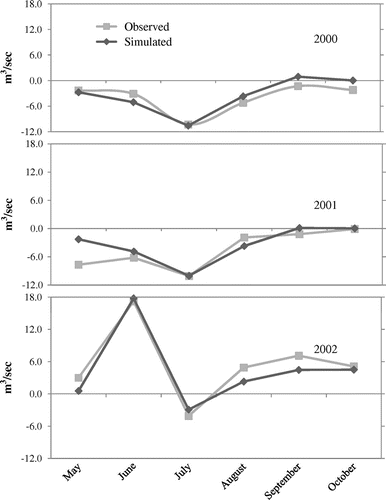
Nash-Sutcliffe Efficiency (NSE) coefficients of 0.61 and 0.83 were obtained for the calibration and validation periods, respectively. Gassman et al. (Citation2007) considered an NSE value of equal to or greater than 0.50 satisfactory for SWAT calibration and validation.
The calibrated input parameters are demonstrated in Table as weighted averages for the watershed and based on the plant/crop cover and irrigation practices. The overall CN range of 49–59 (Table ) as indicated by confidence intervals was due to low runoff generation within the watershed. The simulated return flow values (i.e., excess irrigation water) were also consistent (within a range of –55 to –54 mm) for 2000 and 2001. The return flow for 2002 (a wet year) was approximately –33.1 mm (Table ). The total runoff depth for 2002 was 44 mm, compared to less than 1 mm for 2000 and 2001. Also, the simulated groundwater recharge was 163 mm for 2002, i.e., at least 80% higher than the dry years (2000 and 2001). Groundwater recharge magnitudes suggested the changes in streamflow are likely caused mainly by groundwater discharge, and the management practices of withdrawing irrigation waters from the main reach and return of excess water to the river.
Table 4. Calibrated input parameters weighted averages and confidence intervals for the whole watershed, and based on the plant/crop cover and irrigation practices. Confidence intervals are calculated at probability level of α = 0.05.
Table 5. The area weighted average (mm) of the watershed outputs. Confidence intervals are calculated at probability level of α = 0.05.
Evapotranspiration
The leaf area index (LAI), the actual evapotranspiration (AET) and the potential evapotranspiration (PET) for irrigated and non-irrigated barley and forages during 2002 are given in Figure . The irrigated barley and forages reached near-maximum LAI (Table ) when the crops were under irrigation, as water stress (water stress occurs when actual transpiration is less than the potential transpiration) was not observed or promptly relieved either by rainfall or irrigation. The non-irrigated areas endured a drought period that extended from late June till the end of the growing season, reducing AET (zero AET indicates the soil water content level is at or below the permanent wilting point) and subsequently plant growth, especially for forage, which showed a severely depressed LAI (Figure ). The differences in AET between the irrigated and non-irrigated areas are also reflected in Table , which shows the annual AET for irrigated pasture is at least three times the AET of non-irrigated forages. Similarly, the annual AET of the irrigated barley is at least twice that of non-irrigated barley.
Figure 8. The 2002 actual evapotranspiration (AET), potential evapotranspiration (PET), Leaf Area Index (LAI) and water stress for (a) irrigated barley, (b) irrigated pasture, (c) non-irrigated barley and (d) non-irrigated pasture.
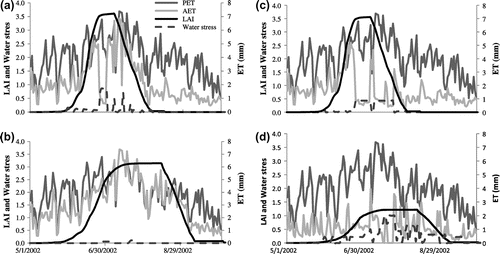
Table 6. Generated runoff and groundwater discharge based on irrigation practice. Confidence intervals are calculated at probability level of α = 0.05.
Runoff
Runoff simulated for 2002 was 44 mm (Table ), constituting less than 10% of the total precipitation of 453 mm. Less than 1% of the total precipitation during 2000 and 2001 was simulated as runoff. Chanasyk et al. (Citation2003) reported similar observation for a grassland in southern Alberta. The average runoff predicted for 2002 was approximately 42 and 46 mm for the irrigated and non-irrigated areas respectively, but the 4-mm difference was within the confidence intervals (at a probability level of α = 0.05); thus it was statistically insignificant (Table ). The 2002 predicted runoff from the WNY soil cultivated with barley suggested the runoff from the irrigated WNY was approximately 6 mm higher than the non-irrigated WNY; however, this difference was also insignificant due to the large confidence interval associated with runoff generated for the irrigated barley in WNY soil.
The runoff generated from ZUN soils was also similar for the irrigated and non-irrigated pasture, although the model predictions suggested that the 2002 runoff from non-irrigated pasture was significantly higher than that from the irrigated pasture. However, a gap of approximately 1 mm prevented the confidence intervals from overlapping; therefore, for practical purposes this difference was considered marginal.
These results can be explained by the increased vegetative growth of the irrigated barley and pasture which resulted in increased evapotranspiration that countered the effect of irrigation water on the antecedent soil water conditions.
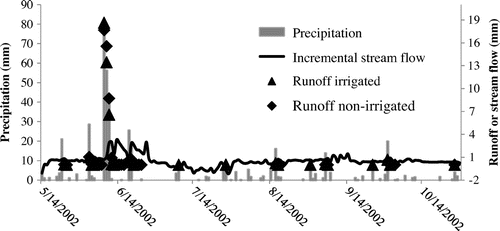
Because the CNII values are generally higher for the cereals than forages, the runoff generated for the WNY soils cultivated with barley was significantly higher than the runoff from the WNY soils cultivated with forages. Figure shows daily incremental flows and the predicted runoff contribution to the streamflow of the 2002 wet season. In early June, SWAT simulated three major runoff events of 18.6, 13.4, and 6.6 mm peak depth from the irrigated areas and 17.6, 15.6, and 8.7 mm from the non-irrigated areas. They were preceded by 78, 56, and 40 mm of precipitation, respectively. These events were associated with an increase in the observed incremental record; however, it is obvious from Figure that the model overestimated these runoff events.
Deep percolation and groundwater recharge
The daily soil water content (SWC, at the end of a time step, i.e., day) and the daily percolation are shown in Figure . Simulated percolation in 2002 was much larger than the amounts simulated for the other seasons. However, the percolation results for 2001 and 2002 reflected similar characteristics. The first observation is that approximately 70–90% of the total percolation occurs at the beginning of the growing season, more specifically between the end of May and the beginning of June. By the end of August, the percolation for the irrigated areas started to exceed that of the non-irrigated areas by 20–30%. The percolation during 2000 was delayed until September as a result of a low and sporadic rainfall pattern; however, the fall percolation from the irrigated areas exceeded that of non-irrigated areas by approximately 70%.
Figure 10. Weighted average daily soil water content (SWC), expressed as fraction of the field capacity (FC), and deep percolation (DP) for the irrigated and non-irrigated areas at the end of each simulation day. The weighted averages were based on the irrigation practice.
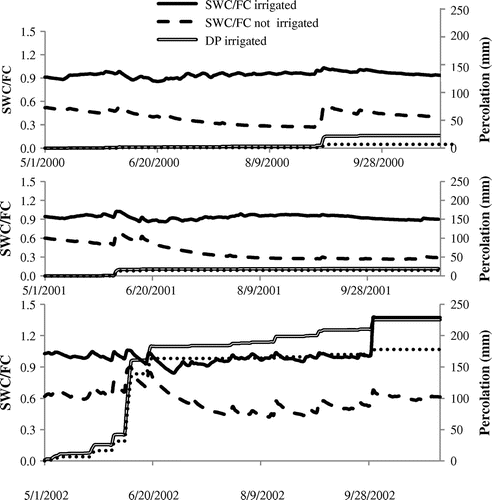
The time required for the full conversion of percolation to recharge water is exponentially dependent on the GW_DELAY parameter as stated in Equation (Equation4(4) ). A GW_DELAY value of 91.4 ± 27.8 days means that 920–1730 days are required for a unit volume of percolation water to be fully released into the unconfined aquifer; however, 90% of that unit will be available for recharge after 145–275 days. As stated in Equation (Equation5
(5) ), an additional 10 to 30 days are required for the available recharge to discharge in the main reach according to the calibrated ALPHA_BF value of 0.32 ± 0.15. This indicates that some of the groundwater recharge early in the growing season may originate from winter percolation and in early spring as a result of snow melt. Rodvang et al. (Citation2004) indicated the presence of a thick glacial till layer characterized by fine textured sediments. Therefore, the high GW_DELAY value (i.e., > 60 days) and the resulting relatively long time frame for the precipitation and/or irrigation to move through the vadose zone and reach the streamflow via groundwater discharge seems justified.
The effect of percolation occurring in early to late June may continue until the end of the growing season. Figure shows that the peak recharge rate occurs at the beginning to the middle of June (for 2001 and 2002), and this coincides with the time period when most of the percolation occurs. That is expected because the Ksat values of 42 and 76 mm hr−1 for the surface and subsurface layer, respectively, dictate an instantaneous percolation of the excess water throughout the soil profile as indicated by Equations (Equation2(2) ) and (Equation3
(3) ). High Ksat values minimize Tperc (Equation Equation3
(3) ), subsequently eliminating the exponential expression in Equation (Equation2
(2) ).
Figure 11. The daily groundwater recharge for four growing season during 2000–2002. The recharge from the irrigated and non-irrigated areas are represented by the dotted and solid lines, respectively. The grey bars represent precipitation.
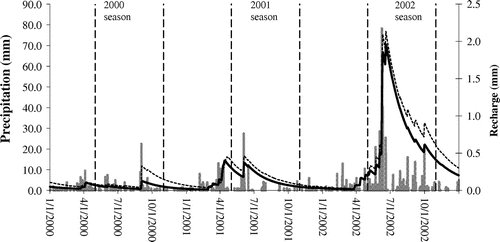
Recharge from the irrigated areas was higher than that from the non-irrigated areas; this difference was also a function of landuse. The model results suggested that recharge from the irrigated and non-irrigated areas cultivated with barley was significantly different, but no such difference existed when pasture was considered as a landuse (Table ). Irrigated areas would be more prone to contribute percolation water to the vadose zone than the non-irrigated areas. However, the model weighted this effect against the increased evaporatranspiration from the irrigated pasture, thus minimizing the deep percolation and groundwater recharge. Irrigation also increased barley evapotranspiration. However, the crop water requirement for barley is less than pasture and, therefore, barley irrigation caused a net increase in the groundwater recharge.
On 2 September 2000, peak recharge rates of 0.29 and 0.09 mm day−1 for the irrigated and non-irrigated areas respectively were simulated after 26 mm of rainfall. For 2001 and 2002 the peak recharge rates were simulated in June, but with varying magnitudes. During 2001 the peak rates were 0.36 and 0.46 mm day−1 for the irrigated and non-irrigated areas, respectively.
During 2002, the recharge rate increased from approximately 0.3 mm day−1 in early May to approximately 2 mm day−1 by the second week of June as a result of 206 mm of precipitation that occurred between 2 and 10 June. Mid June also marked the onset of the decline for the recharge from the irrigated and non-irrigated areas; however, these trends were distinguished from each other as recharge from the irrigated area exceeded that from the non-irrigated areas for the summer and early fall precipitation.
Effect of irrigation on hydrologic components
Previous research has generally reported that irrigation increases the antecedent soil water and increases the potential for runoff. For example, Ozdogan et al. (Citation2010) observed that irrigation increased runoff by an average of 0.3 mm day−1 in the western United States. Our results indicated that the difference in runoff depth between the irrigated and non-irrigated areas was insignificant (Figure ). The total runoff during the dry years (2000 and 2001) was less than 1 mm, and increased to approximately 44 mm during 2002 (Table ). However, the only dynamic change that can be attributed to runoff in the observed record occurred in early June 2002 after 175 mm of rainfall over a 3-day period. The SWAT model calibration reflected the low potential of runoff generation in the watershed evident from the low CNII values although the model overestimated the event in June 2002. The SWAT model also simulated that the main contribution to the streamflow was the shallow aquifer discharge to the main reach.
There are two probable factors that could have contributed to the low observed runoff generation from the watershed. The first is the coarse soil texture (Figure ) that dominates the soils north of the main reach where the longest tributary runs approximately 7.8 km in the north-south direction to the main reach (Figure ). The soil textures adjacent to the main reach are also coarse, ranging from sandy loam at the inlet (LB4_14) to sand and loamy sand at the watershed outlet specified as the LB4 streamflow monitoring station. A riparian zone characterized by coarse textures and high infiltration rates may have contributed to low runoff because most of the runoff in the early stages of the storm is usually initiated at areas adjacent to main reach (Bernier Citation1985).
The second probable factor is the variability of stream network density during rainfall storms. Observations reported by Day (Citation1978) and Tischendorf (Citation1969) (as reviewed by Bernier Citation1985) indicated that the stream network expands gradually during the storm and reaches its maximum density just before the occurrence of the peak flow. However, the manner of expansion depends on the geomorphological features of the watershed (e.g., slope, plant cover and soil properties), and rainfall depth and duration. Day’s (Citation1978) findings also indicated irregular expansion of the stream network, resulting in discontinuous streamflow from the ephemeral channels. For example, some of generated runoff eventually infiltrated at the disjoints of the lower-order streams, as these streams fail to join any of the higher-order tributaries flowing to the main reach. The stream networks shown in Figures and were extracted from the watershed DEM based on the threshold area concept defined as the “minimum support area required to drain to a point to form a channel” (Da Ros and Borga Citation1997). The stream network demonstrated in Figure represents a threshold area ≥ 3.3% of the watershed area, whereas one-tenth of that threshold area was used to obtain the extended stream network shown in Figure . This seems dense enough to deliver the generated runoff to the main reach; however, the lower-order channels of this network may only be flowing at the late stages of the rainfall storms. Thus, the actual density of the stream network, and therefore the actual contribution area, may be much smaller than the potential stream network density indicated in Figure . Although a variable stream network remains a theory that requires further field assessments, it holds at least a partial explanation for the low runoff generation, and the exceptional runoff event observed in June 2002.
SWAT cannot be used to examine the theory of expanding stream networks because SWAT lacks the mathematical framework to accommodate such a complex process. The effect of the variable stream network density and any irregularities in the expanding ephemeral channels will trickle down to the calibration of the empirical variables like the CNII.
The irrigation activity in the watershed had a temporal influence on the magnitudes of the various hydrological components but did not change water partitioning among the existing hydrological pathways. The differences in simulated runoff between the irrigated and the non-irrigated areas were statistically insignificant (Table ). The increase in actual evapotranspiration in irrigated areas may partially or fully counter the effect of increased antecedent soil water content on runoff generation. The model results showed that irrigation increased the evapotranspiration as it replenished the soil water content to meet the water requirements for the various stages of crop development.
The results also demonstrated that all irrigation water was stored in the soil profile as it was presumed that farmers would irrigate to maintain the soil water content at or near the field capacity, but below the saturation limit required for the occurrence of deep percolation. However, such soil water status increased the deep percolation potential, resulting in greater seasonal deep percolation from the irrigated than from the non-irrigated area. However, due to the increased evapotranspiration from irrigated pasture, similar recharge was predicted from the irrigated and non-irrigated pasture; therefore, the increase in recharge from irrigated areas can be mainly attributed to barley irrigation.
The potential for deep percolation also existed at the beginning of the season in both the irrigated and non-irrigated areas due to the wet conditions resulting from winter precipitation; therefore, most of the early summer precipitation was readily converted to deep percolation. Further precipitation during the growing season caused additional deep percolation from the irrigated areas. Therefore, although statistically significant, there were marginal differences between the irrigated and non-irrigated areas (Table ). Beke et al. (Citation1993) also attributed the deep percolation in southern Alberta to the combined effect of irrigation and precipitation during May–July. This pattern was repeated each year in the observed record from 2000 to 2002. The deep percolation stored in the vadose zone provided a slow but continuous contribution to the shallow groundwater aquifer, which in turn contributed water discharge to the main reach.
Conclusions
The irrigation activity in the LLB watershed did not increase runoff. In addition, irrigation activity in the watershed did not change the water partitioning among the existing hydrological pathways, but it had temporal effects on the magnitudes of deep percolation and subsequent groundwater discharge in the main reach. The model results indicated that irrigating barley increased the aquifer recharge; however, the simulated differences in groundwater recharge were insignificant for pasture. Therefore, the recharge is a function of irrigation practice and landuse.
The importance of groundwater recharge in the LLB watershed should prompt further investigations to assess the effect of percolated water on the shallow aquifer and streamflow water quality.
One reason for the relative importance of the subsurface pathways was the modest effect of irrigation on runoff and the apparent low impact of runoff on the observed streamflow; therefore we recommend further field investigations to study the effect of the stream network on the hydrology of the Canadian prairies.
Acknowledgements
This study was made possible by funding from the Watershed Evaluation of Beneficial Management Practices program (WEBs) of Agriculture and Agri-Food Canada. We thank Alberta Agriculture and Rural Development for providing the streamflow data and Dwayne Rogness of the County of Lethbridge for collecting the landuse information from the producers in the watershed.
References
- Alberta Agriculture and rural development. 2007. Agricultural region of Alberta soil inventory database (AGRASID), Version 3.0. www.agric.gov.ab.ca. ( accessed June, 2010).
- Arnold, J.G., R. Srinivasan, R.S. Muttiah, and J.R. Williams. 1998. Large area hydrologic modelling and assessment. Part I: Model development. Journal of the American Water Resources Association 34(1): 73–9.
- Beke, G.J., T. Entz, and D.P. Graham. 1993. Aquifer characteristics and long-term ground-water levels. Journal of Irrigation and Drainage Engineering 119(1): 129–41.
- Bernier, P.Y. 1985. Variable source areas and storm-flow generation: An update of the concept and simulation effort. Journal of Hydrology 79 : 195–213.
- Bracmort, K.S., M. Arabi, J R. Frankenberger, B.A. Engel, and J.G. Arnold. 2006. Modelling long-term water quality impact of structural BMPs. Transactions of the American Society of Agricultural and Biological Engineering 9 (2): 367–74.
- Chanasyk, D.S., E. Mapfumo, and W. Wilms. 2003. Quantification and simulation of surface runoff from fescue grassland watersheds. Agricultural Water Management 59(2): 137–53.
- Da Ros, D., and M. Borga. 1997. Use of digital elevation model data for the derivation of the geomorphological instantaneous unit. Hydrological Processes 11(1): 13–33.
- Day, D.G. 1978. Drainage density changes during rainfall. Earth Surface Processes 3: 319–26.
- Deliberty, T.L., and D.R. Legates. 2003. Interannual and seasonal variability of modelled soil moisture in Oklahoma. International Journal of Climatology 23 : 1057–86. doi:10.1002/joc.904.
- Duan, Q., S. Sorooshian, and V. Gupta. 1992. Effective and efficient global optimization of conceptual rainfall-runoff models. Water Resources Research 28(4): 1015–31.
- Fujieda, M., T. Kudoh, V. de Cicco, and J.L. de Calvarcho. 1997. Hydrological processes at two subtropical forest catchments: The Serra do Mar, Sao Paulo, Brazil. Journal of Hydrology 196 : 26–46.
- Gassman, P.W., M.R. Reyes, C.H. Green, and J.G. Arnold. 2007. The Soil and Water Assessment Tool: Historical development, applications, and future research directions. Transactions of the American Society of Agricultural and Biological Engineering 50(4): 1211–50.
- Gitau, M.W., W.J. Gburek, and P.L. Bishop. 2008. Use of the SWAT model to quantify water quality effects of agricultural BMPs at the farm scale level. Transactions of the American Society of Agricultural and Biological Engineering 49(2): 367–74.
- Gollamudi, A., C.A. Madramootoo, and P. Enright. 2007. Water quality modelling of two agricultural fields in southern Quebec using SWAT. Transactions of the American Society of Agricultural and Biological Engineering 50(6): 1973–80.
- Gomez-Delgado, F., O. Roupsard, R. Moussa, G. le Maire, S. Taugourdeau, J.M. Bonnefond, A. Perez, et al. 2010. Modelling the hydrological behaviour of a coffee agroforestry basin in Costa Rica. Journal of Hydrology and Earth System Science Discussion 7: 3015–71. doi:10.5194/hessd-7-3015-2010.
- Guan, H., J. Simunek, B.D. Newman, and J.L. Wilson. 2010. Modelling investigation of water partitioning at a semiarid ponderosa pine hillslope. Hydrological Processes 24: 1095–1105. doi:10.1002/hyp.7571.
- Janssen, M., B. Lennartz, and T. Wohling. 2010. Percolation losses in paddy fields with a dynamic soil structure: Model development and applications. Hydrological Processes 24: 813–24. doi:10.1002/hyp.7525.
- Klemeš, V. 1988. A hydrological perspective. Journal of Hydrology 100(1–3): 3–28.
- Little, L.J., K.A. Saffran, and L. Fent. 2003. Landuse and water quality relationships in the Lower Little Bow River watershed, Alberta, Canada. Water Quality Research Journal of Canada 38(4): 563–84.
- Mapfumo, E., D.S. Chanasyk, and W.D. Willms. 2004. Simulating daily soil water under foothills fescue grazing with the soil and water assessment tool model (Alberta, Canada). Hydrological Processes 18: 2787–800. doi:10.1002/hyp.1493.
- Mattern, S., and M. Vanclooster. 2010. Estimating travel time of recharge water through a deep vadoze zone using a transfer function model. Environmental Fluid Mechanics 10: 121–35. doi:10.1007/s10652-009-9148-1.
- McCallum, J.E., M.C. Ryan, B. Mayer, and S.J. Rodvang. 2008. Mixing-induced groundwater denitrification beneath a manured field in southern Alberta, Canada. Applied Geochemistry 23: 2146–55. doi:10.1016/j.apgeochem.2008.03.018.
- Mishra, S.K., K. Geetha, A.K. Rastogi, and P.P. Pandey. 2005. Long-term hydrologic simulation using storage and source area concepts. Hydrological Processes 19: 2845–61. doi:10.1002/hyp.5735.
- Narasimhan, B., R. Srinivasan, J.G. Arnold, and M. Di Luzio. 2005. Estimation of long-term soil moisture using a distributed parameter hydrologic model and verification using remotely sensed data. Transactions of the American Society of Agricultural and Biological Engineering 48(3): 1101–13.
- Neitsch, S.L., J.G. Arnold, J.R. Kiniry, J.R. Williams, and K.W. King. 2002. Soil and water assessment tool theoretical documentation. College Station, TX: Texas Water Resources Institute.
- Ozdogan, M., M. Rodell, H.K. Beaudoing, and D.L. Toll. 2010. Simulating the effects of irrigation over the United States in a land surface model based on satellite-derived agricultural data. Journal of Hydrometeorology 11(1): 171–84. doi:10.1175/2009JHM1116.1.
- Rahbeh, M., D.S. Chanasyk, and J. Miller. 2011. Two-way calibration-validation of SWAT model for a small prairie watershed with short observed record. Canadian Water Resources Journal 36(3): 247–70.
- Rodvang, S.J., D.M. Mikalson, and M.C. Ryan. 2004. Changes in groundwater quality in an irrigated area in southern Alberta. Journal of Environmental Quality 33: 476–87.
- Schmalz, B., F. Tavares, and N. Fohrer. 2008. Modelling hydrological processes in mesoscale lowland river basins with SWAT – Capabilities and challenges. Hydrological Sciences 53(5): 989–1000. doi:10.1623/hysj.53.5.989.
- Spruill, C.A., S.R. Workman, and J.L. Taraba. 2000. Simulation of daily and monthly stream discharge from small watersheds using the SWAT model. Transactions of the American Society of Agricultural and Biological Engineering 43(6): 1431–9.
- Stewart, G.R., C.L. Munster, D.M. Vietor, J.G. Arnold, A.M.S. Macfarland, R. White, and T. Provin. 2006. Simulating water quality improvements in the upper north Bosque river watershed due to phosphorus export through turfgrass sod. Transactions of the American Society of Agricultural and Biological Engineering 49(2): 357–66.
- Technology & Innovation Branch of Alberta Agriculture and Food. 2000. Irrigation in Alberta. Lethbridge, AB: Alberta Agriculture and Food.
- Tischendorf, W.G. 1969. Tracing stormflow to varying source areas in a small forested watershed in the southeastern Piedmont. PhD diss.: University of Georgia, Athens, GA.
- Tolson, B.A., and C.A. Shoemaker. 2007. Dynamically dimensioned search algorithm for computationally efficient watershed model calibration. Water Resources Research 43(W01413): 1–16. doi: 10.1029/2005WR004723.
- Yang, Q., Z. Zhao, T.L. Chow, H.W. Rees, C.P.A. Bourque, and F. Meng. 2009. Using GIS and a digital elevation model to assess the effectiveness of variable grade flow diversion terraces in reducing soil erosion in north-western New Brunswick, Canada. Hydrological Processes 23: 3271–80. doi:10.1002/hyp.7436.
