
Abstract
The Upper Qu’Appelle River conveys water from Lake Diefenbaker to Buffalo Pound Lake, which is a major source of water for domestic, industrial, agricultural and recreational use in southern Saskatchewan. Water demand continues to increase with time and additional conveyance capacity may be required during the winter months. Flows in the Upper Qu’Appelle are usually below 2 m3 s–1 from December to March; however, an increase in this flow rate will be needed to meet future water demands. A numerical modelling study was carried out to simulate the degree of ice cover thickening and backwater staging during freeze-up at various discharge scenarios (up to 6 m3 s–1). The Monte Carlo framework was used to capture the variability of possible parameter ranges within various freeze-up scenarios. A bottleneck to flow conveyance is a short 4-km stretch along the river (between the Prairie Farm Rehabilitation Administration [PFRA] and Tugaske Bridges) which is infested with macrophyte growth. Results show that the probability of overbank flow greatly increases with the presence of macrophytes in the channel, even at freeze-up conditions. Dredging was deemed the best mitigation option to reduce macrophyte density and remove nutrient-rich sediment to increase flow capacity.
Le cours supérieur de la rivière Qu’Appelle amène l’eau du lac Diefenbaker au lac Buffalo Pound, qui est une source d’eau majeure pour l’usage domestique, industriel et agricole et pour les usages récréatifs dans le sud de la Saskatchewan. La demande en eau continue de s’accroître avec le temps et une capacité de transport supplémentaire pourrait s’avérer nécessaire au cours des mois d’hiver. Les débits dans le cours supérieur de la rivière Qu’Appelle se situent en général sous les 2 m3 s–1 de décembre à mars. Cependant, une hausse de ce débit sera nécessaire pour faire face aux futures demandes en eau. Une étude de modélisation numérique a été menée afin de simuler le degré d’épaississement de la couverture de glace et le niveau des remous au cours de la période d’englacement selon divers scénarios de débit (jusqu’à 6 m3 -1s–1). Le cadre de simulation de Monte Carlo a été employé afin de saisir la variabilité des plages de paramètres possibles dans divers scénarios de prise de la glace. Il existe un goulot d’étranglement qui entrave le débit. Il s’agit d’un petit tronçon de la rivière de 4 km (entre les ponts de l’Administration du rétablissement agricole des Prairies [ARAP] et de Tugaske) qui est infesté de macrophytes. Les résultats révèlent que la probabilité de débordement augmente grandement avec la présence de macrophytes dans le canal, même dans des conditions de prise de la glace. Le dragage a été considéré comme la meilleure option d’atténuation pour réduire la densité de macrophytes et éliminer les sédiments riches en nutriments afin d’accroître la capacité de débit.
Introduction
The Upper Qu’Appelle River conveys water from Lake Diefenbaker to Buffalo Pound Lake, an important water source in southern Saskatchewan, particularly for the Regina-Moose Jaw region, with municipal, industrial, agricultural and recreational usage. The discharge through the river is controlled by the Qu’Appelle River Dam on the Gordon McKenzie (northeast) arm of Lake Diefenbaker. Industrial development in the region has resulted in an increased demand for water. At present, approximately 25% of the province’s population relies on Buffalo Pound Lake as a source of their water. Buffalo Pound Lake is also a major recreation area in southern Saskatchewan and flows are often passed down the system to stabilize the lake’s water levels. It is anticipated that improvements and changes to the water conveyance capability will have to be completed within the next 10 years to meet this growing demand for water.
Currently, discharges of less than 2 m3 s–1 are typically conveyed along the river in winter to ensure a safe ice cover formation. However, increasing water demand for municipal and industrial use requires that discharges be increased up to 6 m3 s–1 during the winter season. A modelling study was carried out to determine the river’s ice cover behavior during its formation at the onset of winter. The numerical river ice model RIVICE was implemented which dynamically simulates the formation of an ice cover at freeze-up. The model mimics ice processes of ice cover formation and calculates backwater levels and excessive ice thickening along the cover that could potentially lead to freeze-up ice jamming. Data collected during a flow test during winter 2012–2013 of up to 4 m3 s–1 contributed to the calibration of the model. Once calibrated, the model could then be used to run scenarios of future dam operations with different freeze-up discharges of up to 6 m3 s–1.
The channel conveyance capacity is substantially decreased due to the prolific growth of aquatic macrophytes, in particular along one short reach between the Prairie Farm Rehabilitation Administration (PFRA) and Tugaske Bridges. The macrophytes increase flow resistance, decrease cross-sectional area and limit the channel capacity to less than 4 m3 s–1. Macrophytes senesce under naturally low winter flows in both natural and artificial conveyance channels (Madsen and Adams Citation1988; Riis et al. Citation2003; Alberta Government pers. comm.). However, under augmented winter flows, macrophytes can persist throughout the winter (Rørslett Citation1988). Frazil ice can form and adhere to macrophytes and develop anchor ice (Prowse Citation1994; Qu and Doering Citation2007). Anchor ice can accumulate creating ice dams (Stickler et al. Citation2008), constricting flow (Hirayama et al. Citation2002; Smith and Pearce Citation2002), thereby increasing wetted area and water depth because of backwater effects (Stickler et al. Citation2010). For example, wetted area and water depth increased up to 43 and 241%, respectively, in boreal streams because of anchor ice-induced backwater effects (Stickler et al. Citation2008). Overbank flow due to ice dams can erode banks, remove riparian vegetation and deposit sediment onto the channel bed (Ettema Citation2002; Smith and Pearce Citation2002). River ice has profound effects on in-stream hydraulics and should be considered in freshwater stream management. Winter flows are less than 2 m3 s–1 in the Upper Qu’Appelle River, typically; however, greater winter flows must be sustained to support future water demands. This has raised concerns over the persistence of macrophytes throughout the winter and their impact on winter flow capacity and ice formation. The Upper Qu’Appelle River provides an ideal system to assess the challenges of augmenting winter flows in Northern climates. The objective of this paper is to determine how much this macrophyte growth increases the probability of overbank flooding during winter.
Study site
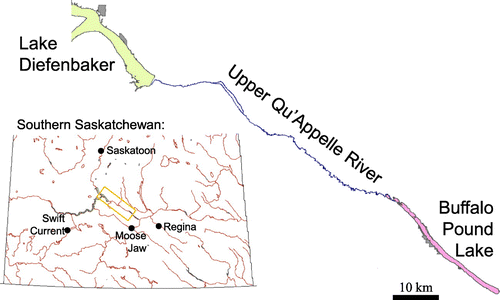
The Upper Qu’Appelle River (see Figure ) is located in southern Saskatchewan and conveys water from Lake Diefenbaker to Buffalo Pound Lake. The river is approximately 97 km long: the first 35 km is channelized with a design capacity of 14 m3 s–1; the lower 62 km stretch is a natural river course experiencing much erosion, sloughing and siltation compounded by deteriorating water quality. Since the 1960s, flows have been augmented by interbasin transfers from the South Saskatchewan River system. Conveying these augmented flows required the extensive channelization in the uppermost reach. The channel conveyance capacity has since decreased due to erosion, sedimentation and the prolific growth of aquatic macrophytes.
Figure 1. The Upper Qu’Appelle River flows from Lake Diefenbaker to Buffalo Pound Lake.
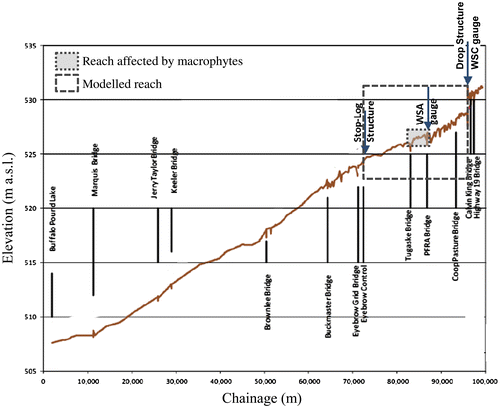
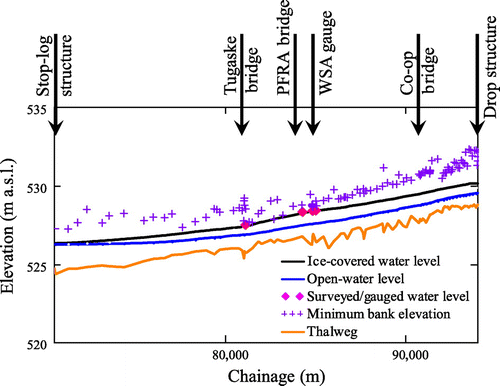
A longitudinal profile of the river’s thalweg is provided in Figure . Many river crossings labeled with the bridges’ names are indicated on the figure. A flow discharge gauge (#05JG006) operated by the Water Survey of Canada (WSC) is located at the Drop Structure. A water level gauge (#05JG010) operated by the Water Security Agency (WSA) is located immediately upstream of the PFRA Bridge.
Figure 2. Longitudinal profile of the Upper Qu’Appelle River’s thalweg including the location of bridges and gauges (modified from HATCH Citation2012).
The channel reach most prone to heavy aquatic growth is approximately 4 km in length and extends from 400 m upstream of the PFRA Bridge downstream to the Tugaske Bridge (Sereda Citation2012). The upper portion of this reach was constructed to have a 9.1-m-wide bottom with a channel slope of 0.03%. The downstream portion has a slope of 0.01% and widens out to a 15.2-m-wide bottom. A change in grade and the wide channel results in slower-moving waters and deposition of silt and clay material, a favourable substrate for macrophyte growth. Fine sediments provide an ideal rooting medium for macrophytes and retain greater concentrations of nutrients than other bed materials (Sereda Citation2012). The combination of these two factors has led to the excessive macrophytic growth within this reach. Six macrophyte species have been identified within the Upper Qu’Appelle River (see Table ). Two of these species, Chara spp. and Northern Water Milfoil, account for ~85% of the macrophyte biomass (Sereda Citation2012). Macrophytes within the Upper Qu’Appelle River reproduce vegetatively (i.e. spread through tubers, rhizomes or fragmentation) and thrive under the conditions typical of this reach of the river (shallow, alkaline and with an abundance of organic sediments).
Table 1. Preferred environmental conditions for colonization and growth and the reproductive strategy for the predominant plant species present within the study area.
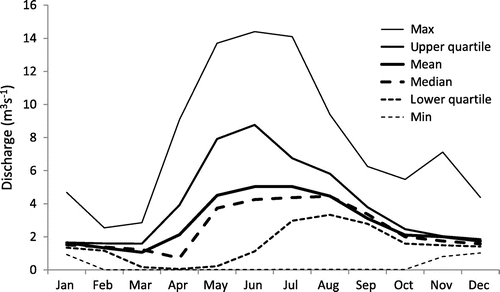
Monthly discharge statistics from the WSC gauge between 1968 and 2011 are provided in Figure . In the earlier years of the series, the channel did have a conveyance capacity of up around 14.5 m3 s–1. However, due to siltation and macrophyte growth, the capacity has decreased to approximately 3 m3 s–1 in the summer. Flows through the channel during the winter months between November and March were higher in earlier years as well, up to 7 m3 s–1, but are now typically below 2 m3 s–1.
Figure 3. Monthly statistics of discharge recorded at the Water Survey of Canada (WSC) gauge (#05JG006) from 1968 to 2011.
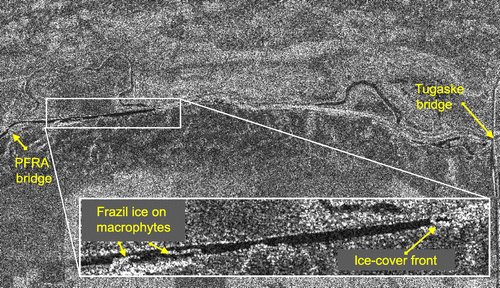
Freeze-up usually occurs in November, which has average mean and minimum air temperatures of –4.9 and –9.8°C, respectively (compiled from daily records measured between 1971 and 2000 at Tugaske, about 11 km south of the study site). In November, most of the precipitation is snow with an average accumulation of 32.2 cm. Macrophytes typically freeze and senesce as flows within the Upper Qu’Appelle River are reduced late fall. With winter flows greater than normal required to meet water demands, concerns were raised that macrophytes may persist throughout the winter, impeding flow and disrupting ice formation. Therefore, before freeze-up commenced at the beginning of November 2012, the discharge along the upper Qu’Appelle River had been reduced to 0.5 m3 s–1 in an attempt to kill off the macrophytes still present between the PFRA and Tugaske Bridges. The first cold spell began on 9 November 2012, when air temperatures dropped to –20°C by 12 November 2012, during which time the flow was stepped up to approximately 2.55 m3 s–1. This allowed an ice cover to begin forming along the river. By 19 November 2012, the ice cover front had progressed upstream of the Tugaske Bridge, as shown in the satellite imagery in Figure . The inset highlights the ice cover front and frazil ice adhering to residual macrophyte plants. By 13 December 2012, the flow was stepped up to 4 m3 s–1 in increments of 0.25 m3 s–1 every few days following the guideline provided by Beltaos (Citation2008, 151): “The flow increment should, ordinarily, be a small fraction of the flow prior to the beginning of runoff; however, it could be well in excess of 10% in shallow rivers with thick ice covers”.
Figure 4. RADARSAT-2 U78 image between the PFRA and Tugaske Bridges acquired 19 November 2012. RADARSAT-2 Data and Products © MacDonald, Dettwiler and Associates Ltd. (2012). All Rights Reserved. RADARSAT is an official trademark of the Canadian Space Agency.
RIVICE description
The numerical model RIVICE was used to simulate longitudinal profiles of backwater levels and ice thicknesses during the formation of an ice cover along the upper reach of the Qu’Appelle River. This summary of the model’s description is a compilation of excerpts drawn from Environment Canada (EC) (Citation2013), Lindenschmidt et al. (Citation2012) and Lindenschmidt and Chun (Citation2013). RIVICE is a one-dimensional hydrodynamic computer model developed by Environment Canada which simulates major ice phenomena and processes along rivers, such as ice cover formation and ablation, frazil ice formation, border ice advancement, anchor ice, ice transport, hanging dams and ice jams (Lindenschmidt et al. Citation2012; EC Citation2013; Lindenschmidt and Chun Citation2013). The solver is based on an implicit finite-difference scheme with the fundamental premise that the calculations of ice generation and evolution can be separated from the hydraulic processes if they are carried out frequently and a selection of the length and time step is carefully made for the situation at hand (“loosely-coupled” relationship). Under conditions of very rapid ice cover formation, the time-step varies from seconds to a few minutes to best capture these rapidly changing events.
Ice cover formation
The ice cover is initiated by inserting an ice bridge at a cross-section where the flow of ice is to be arrested. Multiple bridges can be inserted in succession at different locations along the river. Once a bridge is established, ice begins to accumulate at the leading edge of the stationary ice segments, a process referred to as juxtaposition. Advancement from one cross-section to the next can occur and the length of the leading edge depends on the incoming ice volume, in addition to what might have existed in the previous time step. The model also computes how far each parcel of ice that is generated or transported in the open-water area upstream of the ice cover will travel during the time step, with the assumption that the ice pans in the open water areas travel at the same velocity as the water. The user can select a leading edge thickness FT with downstream thickening of this edge occurring by shoving, as described in the next section.
At each time step, a volume of frazil or slush ice is produced in each upstream open-water cross-section from which heat is lost from the water to the atmosphere. This forms slush pans with a thickness ST and a porosity PS, both input parameters selected by the user. The porosity is used to augment the actual volume taken up by the slush ice within the pans. The pan thicknesses are used to compute the surface area of the water covered by the slush ice pans through which heat loss from the water to the atmosphere is assumed to be negligible. The total volume of slush (ice + water) accumulating at the ice front is converted to actual volume of ice within the consolidated ice cover, which is augmented by the value of the ice cover porosity PC.
Ice cover shoving due to hydraulic loading
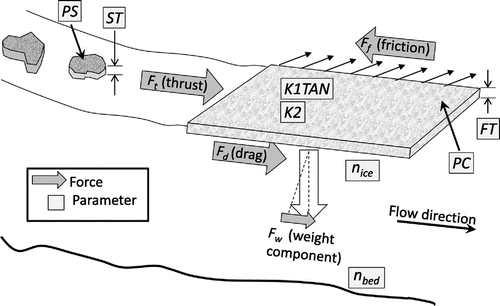
An ice cover on flowing water is subjected to hydraulic forces which can cause deformation and thickening. The algorithm used in RIVICE involves the incremental summation of computed forces on the ice cover in a step-mode fashion beginning from the leading edge and advancing from cross-section to cross-section in the downstream direction. The forces include (referring to Figure ):
Hydrodynamic thrust Ft on the leading edge (Michel Citation1971):
Figure 5. External forcing applied on the ice cover (thrust, friction, drag and weight of the ice cover) and parameters used in the Monte Carlos analysis (porosity and thickness of the slush ice pans, respectively PS and ST, porosity of the ice cover PC and its thickness at its front FT, strength parameters K1TAN and K2, and the roughness coefficients of the river bed nbed and ice cover nice); modified from Lindenschmidt et al. (Citation2012) and Lindenschmidt and Chun (Citation2013).
(1)
where H is the depth of water upstream of the leading edge (m), d is the depth of flow under the leading edge (m), VU is the velocity under the leading edge and is equivalent to the mean value across the width of the channel (m s-1), B is the width of ice cover (m), γ is the specific weight of water (9800 N m-3) and g is the acceleration due to gravity (9.8 m s-2). The flow depth under the leading edge d can be derived from the thickness of the ice front FT, which is an input parameter:(2)
where γi is the specific weight of ice (9020 N m-3).
Hydraulic drag Fd of the flow along the underside of the ice cover (Michel Citation1971):
(3)
where S is the slope of the hydraulic grade line, nice is Manning’s roughness coefficient of the ice under-surface, nc is Manning’s roughness coefficient of the composite cross-section (equation given below), dt is the depth of flow under the ice cover (m) and Aiw is the under-surface area of ice exposed to flow (m2).
Weight component Fw of the ice cover and the water contained in its voids acting along the hydraulic gradient:
(4)
where Vo is the volume of ice cover between the banks (m3) including voids infilled with water and voids above the phreatic line.
Hydraulic forces exerted on the ice cover in the stream-wise direction create stresses in the ice, which are spread laterally towards the riverbanks. The lateral stress results in a reaction of static friction at the bank Ff which acts as a stabilizing influence on the cover (Pariset et al. Citation1966):
(5)
where f is the compressive stress in the ice cover along the channel (Pa), L is the distance between cross-sections (m), t is the average ice thickness between sections (m), K1 is a coefficient equal to the ratio of lateral stress to longitudinal stress in the ice cover and is the angle of friction between the ice cover and river bank. The last two variables are multiplied together in the parameter K1TAN, which is used for calibration.
As the calculation proceeds downstream, the stress in the ice cover fi is determined from:(6)
where t is the ice thickness and B is the width of the ice cover. Shoving or telescoping occurs when the sum of the forces exerted on the ice cover exceed the internal resistance of the ice cover Fir (Pariset et al. 1966):(7)
where K2 is the passive pressure coefficient equivalent to the ratio of longitudinal to vertical stress at the time of failure (White Citation1999; see also Uzuner and Kennedy Citation1976; Flato and Gerard Citation1986; Beltaos Citation1995). K2 is used as a calibration parameter in RIVICE and is designated as K2. Rearranging the previous equation and inserting the values for the specific gravities of ice and water, the required thickness of the ice cover can be simplified to:(8)
Thickening of the ice cover at an unstable location persists until the internal resistance balances the forces exerted on the ice cover.
Hydraulic roughness of ice cover and riverbed
An ice cover over a river channel creates an additional fixed boundary and subjects the channel flow to additional frictional resistance. The conveyance coefficient ki of an ice-covered channel is calculated using an adjusted form of Manning’s equation:(9)
where nc is the composite Manning’s roughness, Ai is the cross-sectional flow area underneath the ice cover (m²) and Ri is the hydraulic radius under the ice cover which includes the wetted perimeter of the channel bottom and side slopes that lie beneath the ice cover, and the width of the underside of the ice cover from river bank to river bank. The composite roughness nc is estimated using the Belokon-Sabaneev formula (Ashton Citation1986, 312; Beltaos Citation2013, 222).
Monte Carlo analyses for scenarios
A Monte Carlo analysis was carried out in which an ensemble of output water level profiles were produced, each ensemble simulated from a different parameter setting. The parameters for each simulation were chosen randomly from uniform probability distributions within certain ranges. The parameters that were used for the global sensitivity analysis are summarized pictorially in Figure and include:
flowing slush pan ice with porosity of the slush PS and thickness of the slush pans ST;
consolidated ice cover with its porosity PC and its thickness at the ice cover front FT;
hydraulic roughness along the river bed nbed and the underside of the ice cover nice;
strength parameters of the ice cover: K1TAN represents the transfer of longitudinal forces along the ice cover laterally towards the bank and K2 is a coefficient pertaining to the internal resistance of the ice cover to external forcing.
An initial calibration of the model was carried out to obtain an orientation of the ranges of the uniform distributions of each parameter.
The ranges of values used for the uniform distribution of each parameter in the Monte Carlo simulation are provided in Table . The calibration exercise provided an orientation to a plausible range of parameter values. Additional guidance regarding possible parameter ranges was obtained from the literature (e.g. Lindenschmidt et al. Citation2012; EC Citation2013; Lindenschmidt and Chun Citation2013). A review of values found in the literature for PS, PC, K1Tan and K2 is provided by White (Citation1999).
Table 2. Parameters and their range of values used in the Monte Carlo simulations.
RIVICE model calibration
The river stretch most vulnerable to overbank flooding is the reach extending from just upstream of the PFRA Bridge (in the vicinity of the WSA gauge) to downstream of the Tugaske Bridge. Compared to other sections of the river, this stretch has banks with the least amount of freeboard. The following data was used for the calibration of the model:
Water level and ice thickness profiles surveyed 10 December 2012 at PFRA and Tugaske Bridges, approximately 3 weeks after initial freeze-over. Due to safety concerns, water levels could not be surveyed during freeze-up. However, this data could still be drawn upon to help guide the calibration process.
Water levels recorded by the WSA gauge in the upper reach of the river.
Flows recorded at the WSC gauge located at the Drop Structure, used as a flow boundary condition. Usually, during the beginning of winter, the ice cover has not extended upstream to the Drop Structure or further upstream (see Figure , top panel) and an open-water rating curve applies. However, as winter progresses, an ice cover may form upstream from the structure (see Figure , bottom panel) and a shift in the rating curve may be required.
Simulation results from a previous HEC-RAS open-water modelling exercise of the Upper Qu’Appelle River (provided by WSA) was used to calibrate the RIVICE open-water simulations.
Figure 6. RADARSAT-2 images of the river at the Drop Structure. Open water conditions prevail at the beginning of winter (top); only a short period of time did an ice cover form upstream of the Drop Structure (bottom). RADARSAT-2 Data and Products © MacDonald, Dettwiler and Associates Ltd. (2012 & 2013). All Rights Reserved. RADARSAT is an official trademark of the Canadian Space Agency.
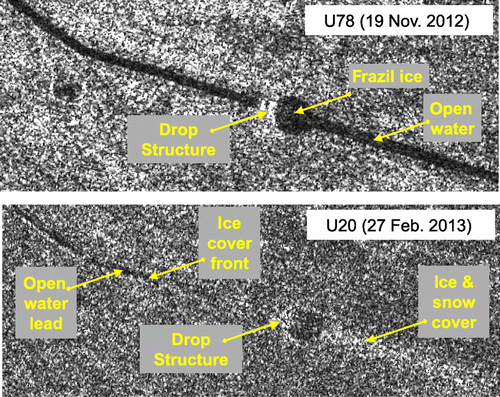
Figure 7. Average flow velocity, maximum depth and Froude number along the modeled reach for a discharge of 4 m3s–1.
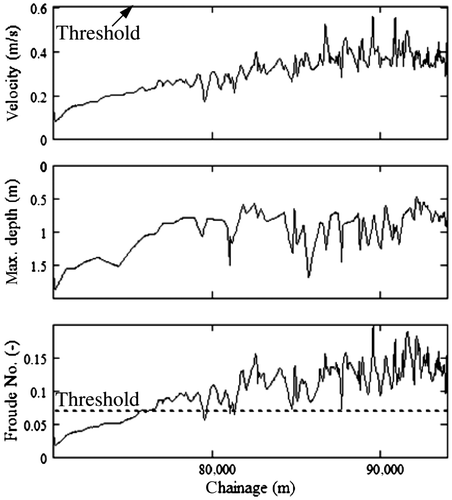
Figure shows the calibrated ice-covered water and open-water profiles for the reach between the Drop Structure and the Stop-Log Structure along which the PFRA and Tugaske Bridges are situated. The calibrated ice-covered water and open-water profiles for a flow of 4 m3 s–1 are shown in the figure. Included are also the river’s thalweg profile and the maximum bank crest elevations at surveyed cross-sections along the stretch. Water profiles surveyed at the PFRA and Tugaske Bridges plus water levels recorded at the WSA gauge were available for calibration. The stretch between the two bridges is plagued with prolific growth of macrophytes, most of which are still intact and rooted to the river bed at freeze-up. Macrophytes provide extra surfaces to which frazil ice can adhere, causing high resistance to flow (as shown in Figure and confirmed by personal observations). Manning’s roughness coefficient of the channel bed for the stretch with macrophyte growth ηmacro was calibrated to be 0.06 – to match the ice-covered water profile to the surveyed and gauged water level data. Values for ηbed of 0.03 downstream of Tugaske Bridge and 0.04 upstream of the PFRA Bridge provided the best fit to the model.
Figure 8. Calibrated ice-covered water and open-water profiles for Section 2 between the Drop Structure and Stop-Log Structure.
Ice type analysis
Rivers normally freeze up in an upstream direction in a highly complex and dynamic process. Full-width ice covers can start by gradual extension and closure of border ice, or by ice bridging caused by the arrest of a moving ice sheet or the congestion of ice pans. Of particular concern is the production of frazil ice which forms consolidated ice covers, which in turn can cause ice damming and flooding over large areas. If the leading edge of this type of cover arrives at an area where the flow velocity is greater than a critical value, the incoming floes will submerge and ice jamming may occur, depending on local conditions. Critical velocities are typically 0.6–0.7 m s-1 for frazil and slush (EC Citation2011, 19). A rule of thumb established by hydraulic engineers of the St. Lawrence Waterway states that a smooth ice cover may be anticipated up to a flow velocity of 0.4 m/s, if there is no wind generating wave action at the time of freezing, and that for flow velocities up to 0.7 m/s the ice cover grows in the upstream direction with no ice being carried under the existing cover (Starosolszky Citation1969). The US Army Corps of Engineers additionally states that a thicker shoved ice accumulation usually forms at flow velocities between about 0.7 and 1.5 m/s and, in most cases, reaches will remain open all winter where the flow velocity exceeds about 1.5 m/s (Tuthill Citation1999).
The modeled longitudinal profiles of mean open-water flow velocity for a discharge Q = 4 m3 s–1 (planned for autumn freeze-up 2012) are given in Figure . The velocities are under the 0.6 m/s threshold, meaning, according to the above rules of thumb, that the ice cover should form mostly by juxtaposition. A critical Froude number also provides a threshold between an ice cover forming by juxtaposition or by submergence-deposition. The Froude number Fr is calculated using:(10)
where v is the flow velocity, g is the gravitation acceleration and H is the flow depth. “When Fr is less than about 0.08–0.15, individual ice floes, and frazil pans, gather at a downstream barrier as a more-or-less single layer that develops upstream forming a so-called accumulation cover of juxtaposed floes” (Jain and Ettema Citation1989, 1256–1274). Others have suggested a more conservative range of 0.08–0.10 (EC 1989) or less (Tuthill Citation1999). Figure also shows the open-water Froude numbers at a discharge of 4 m3 s–1. Many stretches along the river have Froude numbers nearing or exceeding the threshold when the ice cover no longer forms by juxtaposition alone, but additional thickening can occur when incoming ice approaching the ice front submerges under the leading edge and deposits under the downstream ice cover to potentially cause freeze-up jamming.
RIVICE model scenarios
Calibration provides one set of parameter values for one particular freeze-up event. However, these conditions may change and be different for future freeze-up events. For example, the drop in air temperature may be more (or less) severe, thus affecting frazil ice generation and ice cover formation, the bottom substrate may have a different texture and plant growth in the channel may be more (or less) prolific. Changes in freeze-up conditions will require changes in the parameter settings in order for the model to mimic the event. Parameters that can be affected are, for example, bed and ice cover roughness, porosity and thickness of frazil ice pans, initial ice cover and strength properties of the ice cover.
Hence, Monte Carlo simulations were carried out to capture the variability of different freeze-up conditions. In this method, model simulations are repeated many times (up to 100 times in this case) with each simulation using a different parameter setting. The parameters were chosen randomly from a uniform distribution within a range of plausible values that may occur at freeze-up. This yields an ensemble of model output, for example, 100 longitudinal water level and ice thickness profiles. The number of simulations whose water level elevations exceed the minimum bank elevations anywhere along the channel are counted to provide a percentage, or probability, of overbank flooding occurring along that river section. The probability of potential excessive ice cover thickening, which can lead to freeze-up jamming, can also be determined in the same manner.
The Monte Carlo simulations were repeated for discharge scenarios of 4, 5 and 6 m3 s–1. In its current form, the channel is not expected to have a higher conveyance capacity, particularly in the reach between the PFRA and Tugaske Bridges.
Some sections of the river bed consist of gravel and cobble/rock substrate to which anchor ice can attach and cause additional backwater effects. Rocks are particularly prevalent under bridges. Variables that can affect anchor ice growth are the intensity of vertical mixing of the flow, the size of frazil particles and the size and geometrical distribution of the bed roughness to “catch” frazil (Hammar and Shen Citation1995). Kerr et al. (Citation2002) state that, initially, anchor ice growth can increase the bed surface roughness but, as the spaces between gravel particles are gradually filled with ice, the bed surface roughness gradually decreases. Anchor ice raises and smooths the effective bottom, causing a decrease in the flow depth over the top of the gravel or anchor ice surface. The detachment of anchor ice from the bottom (anchor ice rafting) can greatly augment fluvial sediment transport (Kempema and Ettema Citation2011). The Monte Carlo simulations were complemented by the possibility of anchor ice forming along the bottom of the channel during freeze-up. The anchor ice was modeled by raising the bottom elevation of input cross-sections by 20 to 30 cm. These values stem from the literature where anchor ice of up to 20 cm thick in the Niuppu River, Hokkaido, Japan (during freeze-up, average discharge = 1.5–2.2 m3 s–1) (Hirayama et al. Citation1997), and as thick as 30 cm in the Laramie River, Wyoming (average discharge = 3.7 m3 s–1) (Kempema and Ettema Citation2011), have been reported.
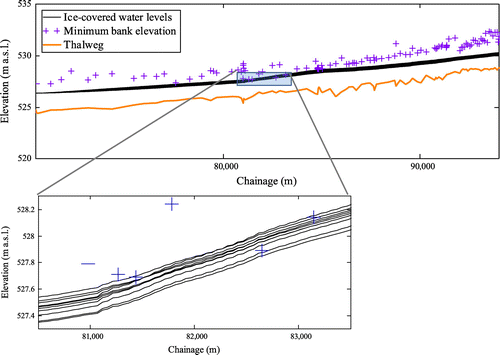
At many points along this reach, the minimum bank elevations are relatively low. Figure shows the results of the Monte Carlo analysis carried out for this river section for a discharge of 6 m3 s–1 with macrophyte growth between the PFRA and Tugaske Bridges. The results are displayed as an ensemble of 100 ice-covered water surface profiles derived from simulations each carried out with randomly selected parameter settings. A zoomed inset better shows the differentiation between the simulation results.
Figure 9. Ensemble of 100 simulations with macrophytes at a discharge of 6 m3s–1. Box indicates zoomed inset provided in the next figure. The zoomed inset only shows 10 of the entire ensemble of 100 simulations for better display purposes. Over 80% of the simulations with macrophytes at 6 m3s–1 produced water surface profiles (solid black lines) extending above the minimum bank elevations (crosses). a.s.l., above sea level.
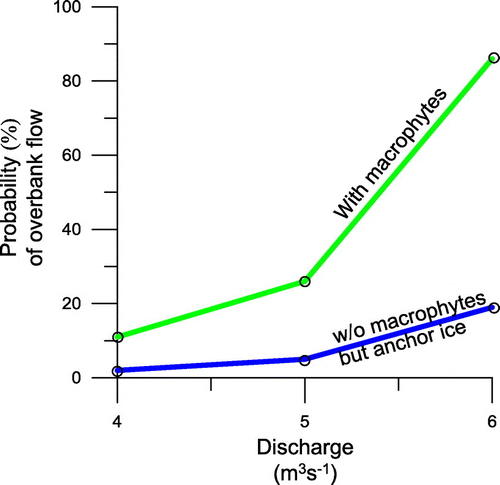
Eleven ensembles of the 100 simulations resulted in water profiles raised above minimum bank elevations along the river; hence, a probability of 11% of overbank flow is possible at a discharge of 4 m3 s–1. The same analysis was carried out for 5 and 6 m3 s–1 and compiled in Figure . The same analyses for all three discharge scenarios were repeated with parameter and model settings mimicking no macrophyte growth but with the possibility of anchor ice forming along the river, also shown in Figure . The figure shows how high the probability of overbank flow is with macrophyte growth, especially at higher discharges (probability > 80% for a flow of 6 m3 s–1). The probability drops substantially when the channel is cleared of macrophytes; however, some risk remains due to the possibility of the formation of anchor ice. In particular, dredging would expose coarse material along the river bed.
Figure 10. Probability of overbank flow of the river between Prairie Farm Rehabilitation Administration (PFRA) and Tugaske Bridges for discharge scenarios 4, 5 and 6 m3s–1. The analyses are presented for (1) macrophyte growth and (2) no macrophyte growth but the potential for the formation of anchor ice.
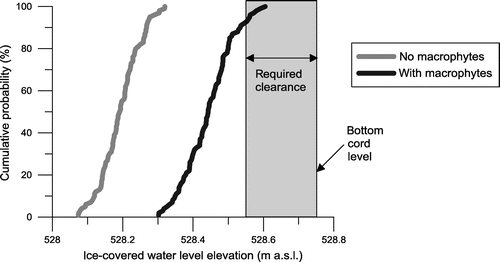
The clearance between the PFRA Bridge and the channel’s water surface is relatively low. The capacity of the system was based on the maintenance of a 0.2-m clearance between the ice surface and the bottom of the PFRA Bridge girder. It was judged that, given expected modelling accuracies/errors, this small clearance should be maintained to reduce the risk of the ice cover impacting the bridge (HATCH Citation2012). There is a low probability (≈10%) that the backwater levels will encroach into the allotted clearance (see Figure ), in which case ice may reach and damage the PFRA Bridge deck.
Figure 11. Ice-covered backwater level elevations at the Prairie Farm Rehabilitation Administration (PFRA) Bridge. a.s.l., above sea level.
The same Monte Carlo analyses with the potential for anchor ice formation were carried out for the other river sections assuming no macrophyte growth. The probability of overbank flow is low even at the high discharge scenario of 6 m3 s–1 because the minimum bank elevations are higher relative to the adjacent water surface profiles. However, should macrophytes establish themselves along these sections, an increased probability of overbank flow would ensue.
Mitigation options
For this particular setting, several options exist for restricting growth and/or removing the macrophytes along this river section:
Nutrient removal
Macrophyte control through nutrient amendment is most successful when macrophyte biomass is strongly correlated with sediment nutrient concentration. Such relationships do not always exist because other environmental or biological variables may exert greater influence over macrophyte biomass. Sediment nutrient concentrations were available for 13 sites within the Upper Qu’Appelle River (Sereda Citation2012); however, a strong nutrient-macrophyte biomass relationship did not exist. Additionally, reducing the nutrient load goes hand in hand with sediment load reductions to the macrophyte-infested river stretch, requiring some form of mechanism to trap the sediments upstream (e.g. small dam with reservoir). However, such a measure would likely shift the macrophyte problem upstream where the sediments would be deposited.
Mechanical harvesting
The mechanical removal of macrophytes using a boat harvester may be an effective measure for controlling macrophyte biomass. The feasibility of mechanical harvesting, however, may be limited by the frequency of harvesting required to provide sufficient control. For example, several studies have determined that cutting bi-annually was insufficient to control macrophyte biomass (Madsen et al. Citation1988) and that harvesting on a monthly basis was required to sustain sufficiently low macrophyte biomass. Additionally, the actual response to cutting is variable (i.e. response may be species specific) and may reflect site-specific conditions (i.e. water velocity, temperature, light, nutrient concentrations, etc.).
Freezing macrophyte roots
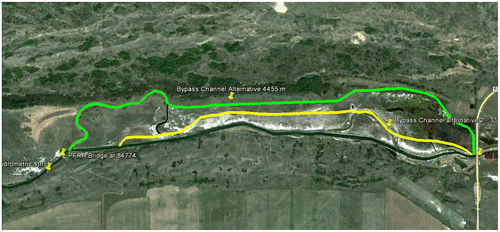
Exposing the roots to freezing temperatures is another option to kill the macrophytes. The roots can be exposed by diverting the river water and drying the river bed for the winter season. Figure shows two options for a bypass channel including oxbow lakes that may be reinstated for the diversion flow. The green option is the preferred option for the following reasons:
The soils along the yellow option will present considerable construction issues and dikes would need to be constructed on both sides of the channel to confine the flows. Material for the dike construction would need to be imported. As a result, it is considered to be the most expensive option.
The green option would follow the edge of the flood plain and thus have better access for construction. The excavated material would be used to build the adjacent dike on the south side.
Figure 12. Proposed bypass channel options.
Complete dewatering of the river bed and sediments is required to successfully freeze the bed deep enough to ensure complete freezing of the roots. Due to the high groundwater table in the river valley, complete dewatering may prove to be difficult. The high cost of dike construction for channel diversion also makes this option less viable.
Dredging
Dredging this reach will effectively remove both the macrophytes and the nutrient-rich sediments which enhance excess macrophyte growth. Water velocity should increase through this reach once the grade is restored, which in turn will reduce the deposition of fine sediments and the re-establishment of macrophytes. Lining of the channel with geotextile or a “new” substrate such as gravel or coble could further decrease the rate and/or likelihood of macrophytes re-establishing; however, gravel may increase the river’s susceptibility to anchor ice formation. Since the stretch requiring dredging is relatively short, it is anticipated that this will have minimal impact on fish and/or fish habitat.
The last option was deemed the most feasible and cost effective. Dredging was carried out on half the channel along the north side of the macrophyte-affected area in spring 2013. The effectiveness of dredging in controlling macrophyte biomass was assessed in the summer of 2013 (approximately 2 months post dredging). Quadrates (1m×1m) were set within reaches that had been dredged and sites immediately adjacent that had not been dredged (n = 6 in both dredged and un-dredged sites). Macrophytes had reestablished in dredged sites although biomass was considerably lower than in un-dredged sites (2.3 kg m2 versus 8.6 kg m2). An unexpected outcome was the shift in macrophyte assemblage composition, from a reach dominated by milfoil to one dominated by Chara spp.; 72% Chara and 86% milfoil (by mass) for dredged and un-dredged sites, respectively. The shift to a Chara spp.-dominated assemblage should increase flow capacity and reduce flood risk, as Chara rises ~30 cm above the channel bed, whereas milfoil extends from the channel bed to the water surface.
Conclusions
The numerical model RIVICE was implemented to dynamically simulate backwater levels and excessive ice thickening during freeze-up and the establishment of the ice cover. A model could be set up and, within the framework of a Monte Carlo analysis, scenarios were run at discharges of 4, 5 and 6 m3 s–1 to determine the probability of overbank flow and excessive ice thickening that could lead to ice jamming. Due to the low crest elevations relative to the water surface, the river stretch between the WSA gauge just upstream of the PFRA Bridge and the Tugaske Bridge is particularly vulnerable. Along this stretch without macrophytes, the probability of overbank flow increases from 2 to 11% for discharges ranging from 4 to 6 m3 s–1; with the presence of macrophytes, the probability increases from 11 to over 80% for the same range of increase in discharge. The freeboard along the levees between the PFRA and Tugaske Bridges is low, making this reach the most vulnerable to overbank flooding. Raising the dikes would reduce this vulnerability. In summary, increased winter flow prevents macrophyte senescence that occurs under naturally low winter flow. The persistence of macrophtyes throughout the winter decreases channel capacity and increases the probability of overbank flow. Macrophyte control measures are necessary to achieve winter flows required to meet future water demands. Although macrophytes were not eliminated via dredging, the shift in composition from milfoil to Chara is expected to increase channel capacity, significantly decreasing the probability of overbank flow. As water demands increase in semi-arid regions, water managers are anticipated to face similar challenges in attempting to sustain greater winter flow. To control macrophtytes where channel capacity may be an issue, preemptive measures are recommended.
Acknowledgements
The authors wish to thank the Saskatchewan Water Security Agency for funding this project.
References
- Ashton, G. D. 1986. River and lake ice engineering. Littleton, CO: Water Resources Publications.
- Beltaos, S. 1995. River ice jams. Littleton, CO: Water Resources Publications, LLC.
- Beltaos, S. 2008. River ice breakup. Littleton, CO: Water Resources Publications, LLC.
- Beltaos, S. 2013. River ice formation. Edmonton, AL: Committee on River Ice Processes and the Environment, Canadian Geophysical Union Hydrology Section. http://cripe.civil.ualberta.ca/ (accessed 9 August, 2014).
- Environment Canada (EC). 2011. New Brunswick river ice manual. The New Brunswick Subcommittee on River Ice, Environment Canada NB, Inland waters Directorate, Department of Environment, re-formatted and re-published in 2011. http://www2.gnb.ca/content/dam/gnb/Departments/env/pdf/Publications/RiverIceManual.pdf ( accessed 9 August, 2014).
- Environment Canada (EC). 2013. RIVICE model – user’s manual. Environment Canada. http://giws.usask.ca/rivice/ ( accessed 9 August, 2014).
- Ettema, R. 2002. Review of alluvial-channel responses to river ice. Journal of Cold Regions Engineering 16: 191–217.
- Flato, G. M., and Gerard, R. 1986. Calculation of ice jam profiles. In Proceedings of 4th Workshop on River Ice, Paper C-3. Montreal: Subcommittee on Hydraulics of River Ice, National Research Council Canada.
- Hammar, L., and Shen, H. T. 1995. Anchor ice growth in channels. 8th workshop on the Hydraulics of Cie Covered Rivers. Kamloops, BC: Committee on River Ice Processes and the Enviroment.
- HATCH. 2012. Upper Qu’Appelle River winter hydraulic efficiency investigation. Final report to Saskatchewan Watershed Authority, Calgary, AB, Canada.
- Hirayama, K., M. Yamazaki, and H. T. Shen. 2002. Aspects of river ice hydrology in Japan. Hydrological Processes 16: 891–904.
- Hirayama, K., K. Terada, M. Sato, K. Hirayama, M. Sasamoto, and M. Yamazaki. 1997. Field measurements of anchor and frazil ice. 9th Workshop on River Ice. Fredericton, N.B., 24–26 September 1997. http://cripe.civil.ualberta.ca/Downloads/09th_Workshop/Hirayama_et_al_1997.pdf (accessed 9 August, 2014).
- Jain, S. C., and R. Ettema. 1989. Minimization of frazil-ice production by river-flow regulation. Journal of Hydraulic Engineering 115(9): 1256–1274.
- Kempema, E. W., and R. Ettema. 2011. Anchor ice rafting: observations from the Laramie River. River Research and Applications 27(9): 1126–1135.
- Kerr, D. J., H. T. Shen, and S. F. Daly. 2002. Evolution and hydraulic resistance of anchor ice on gravel bed. Cold Regions Science and Technology 35: 101–114.
- Lindenschmidt, K.-E., and K. P. Chun. 2013. Evaluating the impact of fluvial geomorphology on river ice cover formation based on a global sensitivity analysis of a river ice model. Canadian Journal of Civil Engineering 40(7): 623–632.
- Lindenschmidt, K.-E., M. Sydor, and R. Carson. 2012. Modelling ice cover formation of a lake-river system with exceptionally high flows (Lake St. Martin and Dauphin River, Manitoba). Cold Regions Science and Technology 82: 36–48.
- Madsen, J. D., and M. S. Adams. 1988. The seasonal biomass and productivity of the submerged macrophytes in a polluted Wisconsin stream. Freshwater Biology 20: 41–50.
- Madsen, J. D., M. S. Adams, and P. Ruffier. 1988. Harvest as a control for sago pondweed (Potamogeton pectinatus L.) in Badfish Creek, Wisconsin: Frequency, efficiency and its impact on the stream community oxygen metabolism. Journal of Aquatic Plant Management 28: 20–25.
- Michel, B. 1971. Winter regime of rivers and lakes. Cold Regions Research and Engineering Laboratory, Publ. No. AD 724121. Hanover, NH: US Army Corps of Engineers.
- Pariset, E., R. Hausser, and A. Gagnon. 1966. Formation of ice covers and ice jams on rivers. Journal of the Hydraulics Division 92(HY6): 1–24 ( Proceedings of the American Society of Civil Engineers).
- Prowse, T. D. 1994. Environmental significance of ice to streamflow in cold regions. Freshwater Biology 32: 241–259.
- Qu, Y. X. and J. Doering. 2007. Laboratory study of anchor ice evolution around rocks and on gravel beds. Canadian Journal of Civil Engineering 34: 46–55.
- Riis, T., B. Biggs, and M. Flanagan. 2003. Seasonal changes in macrophyte biomass in South Island lowland streams, New Zealand. New Zealand Journal of Marine and Freshwater Research 37: 381–388.
- Rørslett, B. 1988, Aquatic weed problems in a hydroelectric river: The R. Otra, Norway. Regulated Rivers: Research & Management 2: 25–37.
- Sereda, J. 2012. Assessment of macrophyte control options in the Upper Qu’Appelle conveyance channel: nutrient amendments and harvesting. Saskatchewan Water Security Agency report. Unpublished.
- Smith, D. G., and C. M. Pearce. 2002. Ice jam-caused fluvial gullies and scour holes on northern river flood plains. Geomorphology 42: 85–95.
- Starosolszky, Ö. 1969. Ice in hydraulic engineering. Trondheim, Norway: Division of Hydraulic Engineering, Norwegian Institute of Technology, University of Trondeim.
- Stickler, M., K. T. Alfredsen, T. Linnansaari, and H. Fjeldstad. 2010. The influence of dynamic ice formation on hydraulic heterogeneity in steep streams. River Research and Applications 26: 1187–1197.
- Stickler, M., E. C. Enders, C. J. Pennell, D. Cote, K. T. Alfredsen, and D. A. Scruton. 2008. Habitat use of Atlantic salmon Salmo salar in a dynamic winter environment: the influence of anchor-ice dams. Journal of Fish Biology 73: 926–944.
- Tuthill, A. M. 1999. Flow control to manage river ice. US Army Corps of Engineers Cold Regions Research and Engineering Laboratory, Special Report 99-8. http://www.dtic.mil/cgi-bin/GetTRDoc?AD=ADA366402 (accessed 9 August, 2014).
- Uzuner, M. S. and J. F. Kennedy. 1976. Theoretical model of river ice jams. Journal of the Hydraulics Division, ASCE 102(HY9): 1365–1383.
- White, K. D. 1999. Hydraulic and physical properties affecting ice jams. US Army Corps of Engineers, Cold Regions Research and Engineering Laboratory Report 99-11. http://www.dtic.mil/cgi-bin/GetTRDoc?AD=ADA375289 (accessed 9 August, 2014).