
Abstract
Spring flooding and water availability during the summer are two major concerns in southern Québec. Climate change is expected to further exacerbate shortages of fresh water resources in Québec. Therefore, the impacts of climate change on the hydrology of the Pike River watershed were projected for the 2041–2070 time horizon using a version of the Soil and Water Assessment Tool (SWATqc) adapted to Québec’s agroclimatic conditions. SWATqc was driven by inputs from four climate projections created with the fourth-generation Canadian Regional Climate Model (CRCM4) and the Arpège regional climate model. CRCM4 was driven at the border of its domain by three members of the Canadian Coupled Global Climate Model (CGCM3). The Arpège model, which has a variable grid, is not driven by another model. The gas emissions scenario used to drive climate models was scenario A2. Regional climate data sets were bias-corrected with the delta method prior to being used to drive SWATqc. Projected changes in precipitation and temperatures were analysed for their effects on evapotranspiration, surface and subsurface runoff, and streamflow. Mean annual streamflow was projected to increase between 9 and 19%. All future simulations projected significant increases or decreases in evapotranspiration, surface and subsurface runoff, and streamflow at the monthly time scale. Winter streamflow, for example, increased by 2- to 3-fold compared with the historical values. In addition, future spring floods started earlier and peaked in March instead of April. The four simulations were named ADC, ACU, AFA/AFD, and ARP. All but the ACU simulation projected a decrease in peak flow, while the ADC, AFD and ARP simulations suggested an increase. Although the majority of the simulations pointed to decreases in summer streamflows, the changes were not all significantly different from historical values. Results from this study not only show that climate change has a strong potential to exacerbate seasonal water availability and flooding issues in the watershed, but also provide conservative numbers that could be used in developing improved watershed management plans adapted to future climate change impacts.
Les inondations et la disponibilité d’eau douce en été sont deux préoccupations majeures dans le sud du Québec. On craint que les changements climatiques aggravent les déficits d’eau douce au Québec. Les impacts des changements climatiques sur l’hydrologie du bassin de la rivière Aux Brochets ont donc été simulés pour l’horizon 2041–2070 avec le modèle hydrologique SWATqc (Soil and Water Assessment Tool pour le Québec) adapté pour les conditions agroclimatiques du Québec. Quatre projections climatiques produits avec le Modèle Régional de Climat Canadian (MRCC4) et le modèle de climat français Arpège ont été insérés dans SWATqc. Le MRCC4 était piloté par trois membres du Model de Climat Global Couplé (MCCG3). Arpège, dont la grille de résolution spatiale varie, n’est pas piloté par un autre modèle. Le scenario d’émission de gaz à effet de serre utilisé pour piloter les modèles climatiques est le scénario A2. Le biais des sorties des modèles climatiques a été corrigé avec la méthode du delta. Les changements en température et précipitation projetés ont été analysés pour leur effet sur l’évapotranspiration, le ruissellement de surface, l’écoulement souterrain et le débit. Les simulations obtenues avec SWATqc et les quatre projections climatiques projetèrent une augmentation significative du débit annuel moyen de 9 à 19%. Sur une base mensuelle, les débits hivernaux seront de 2 à 3 fois plus élevés que les débits actuels selon les quatre simulations. La crue printanière se fera plus hâtive avec un pic en mars plutôt qu’en avril. Les quatre simulations ont été nommées ADC, ACU, AFA/AFA et ARP. La simulation ACU suggère une augmentation du pic printanier alors que les simulations ADC, AFD et ARP suggèrent une diminution. Bien que la majorité des simulations montrent une diminution des débits en été, les changements ne sont pas significatifs pour chaque mois et chaque scénario. Les résultats de cette étude non seulement montrent que les changements climatiques peuvent fortement accentuer la saisonnalité de la disponibilité de l’eau fraîche et des inondations dans le bassin mais aussi fournit des chiffres conservateurs sur lesquels se baser pour développer un plan amélioré de la gestion de l’eau tenant compte des changements climatiques.
Introduction
Climate change is expected to negatively impact the quantity and quality of the fresh water resources in Québec (Bates et al. Citation2008; Ouranos Citation2010). Two major concerns related to water quantity in southern Québec are spring flooding and water shortages during summer. Spring rainfall and snowmelt in this region often exceeds evapotranspiration and can lead to major flood events such as the flooding of the Richelieu River valley in 2011 (Madramootoo Citation2011). In Québec, the flood damaged 6000 houses and 6000 ha of corn fields, and resulted in the evacuation of 1000 persons and about CAD$78 million in financial losses (Environment Canada Citation2013).
The potential for spring flooding notwithstanding, low summer streamflows account for the drawdowns observed in some rivers in this region (D’Auteuil Citation2011). Southern regions of Québec, on average, face a water deficit (evapotranspiration exceeds precipitation) ranging from 33 to 92 mm between May and October (Agroclimatic Atlas of Québec Citation2012). Projections for the 2050 horizon from the Canadian Regional Climate Model (CRCM) show that climate-induced changes could exacerbate this deficit by 92 to 113 mm (the lower scenario from a series of 15 simulations) or attenuate this deficit by 17 to 37 mm (higher scenario) (Agroclimatic Atlas of Québec Citation2012). The Atlas also projects a possible 7% increase in the intensity of annual maximum precipitation (of 12 h and 24 h duration) which could lead to increased runoff rather than soil and aquifer recharge. This might limit water availability for irrigated agriculture, especially in high-elevation areas with low water tables, as well as other parts of the Montérégie region where vegetables are grown (D’Auteuil Citation2011).
Mindful of the importance of water resources for the region’s human, ecosystem and economic health, the Québec government has enacted legislation aimed at the development of watershed master plans (WMPs). This initiative encourages basin stakeholders to define actions aimed at the protection and management of water resources (Auger and Baudrand Citation2004). Most of these WMPs, however, do not take into account the potential impacts of climate change on water availability. An understanding of the potential impact of climate change on hydrological processes is an essential first step towards the development of management practices for the protection of watershed water quantity in a future changing climate (Stager and Thill Citation2010). The Organisme de Bassin Versant de la Baie Missisquoi (OBVBM), a local watershed management body within our study area, seeks to initiate actions to prepare and support its population in incorporating climate change adaptation into the watershed’s WMPs (OBVBM Citation2011).
Assessments of impacts of climate change on water quantity are typically performed by forcing hydrological models with time series of climate data produced by one or several regional climate models (RCMs) for a reference and future period. RCMs improve global climate model (GCM) simulations at the regional and local scales by dynamically downscaling GCM climate variables (Fowler et al. Citation2007). RCMs better represent the local topography, land use and interactions between the land surface and the atmosphere. The strong influence of these components on hydrologic variables such as rainfall suggests that RCM-based estimation of local precipitation should generate more accurate data. RCMs outputs, however, are known to encompass biases (Boé et al. Citation2009; Gagnon et al. Citation2009) and should preferably be corrected prior to introduction into hydrological models (Bordoy and Burlando Citation2012; Schoetter et al. Citation2012; Teutschbein and Seibert Citation2012). Although both simple and complex approaches to bias correction have been explored (Diaz-Nieto and Wilby Citation2005; Graham et al. Citation2007; Choi et al. Citation2009), most of the existing methods not only add some degree of uncertainty to the results but also have inherent limitations (Boé et al. Citation2009). The delta correction methods, for example, do not account for changes in precipitation frequency (Boé et al. Citation2009; Sulis et al. Citation2011). Precipitation frequency and intensity are important factors in flood and water shortage forecasting. Complex downscaling methods, on the contrary, account for changes in precipitation intensity and frequency but require high statistical expertise and computing resources that are not often available to watershed management bodies. The choice of bias correction approach in climate impact studies therefore depends on the availability of resources and the purpose of the project outcomes.
Simple bias correction methods that generate reproducible data, using limited resources, were therefore chosen for this study in order to provide small watershed management bodies with reliable and sustainable tools that could be used to incorporate climate change impacts into the development of WMPs. Robust climate change signals that stand out from modeling uncertainties are believed to be generated by this approach, which still allows the results to be used in decision making provided these uncertainties are acknowledged and assessed (Boé et al. Citation2009).
The aims of this study were twofold: (1) to assess SWAT’s (Soil and Water Assessment Tool) capability to reproduce past and current hydrological flows using corrected and uncorrected RCM projections and (2) to evaluate the impacts of future climate projections on key hydrological processes within the Pike River watershed, in order to inform the development of watershed management plans that incorporate climate change considerations.
Tools and methods
Description of the study site
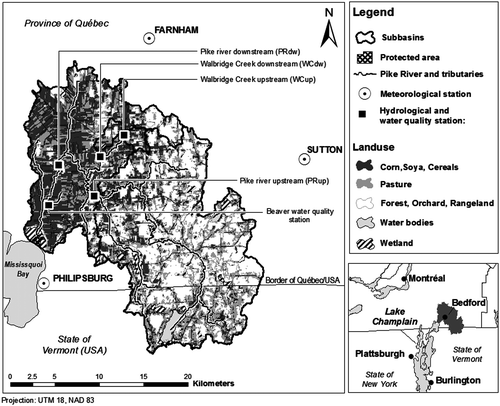
The Pike River watershed spans the Québec/Vermont border and drains into the Missisquoi Bay located in the northern portion of Lake Champlain (Figure ). Eighty-four percent of the watershed’s 630-km2 area lies in the Eastern Townships/Montérégie region of southern Québec. The town of Bedford, which is located at the centre of the watershed, separates the geophysically distinct upstream (390 km2) and downstream (240 km2) portions of the watershed.
Figure 1. Maps of the Pike River watershed indicating the location of meteorological and hydrological stations. The land-use data are derived from a landsat image taken in July 1999 (Cattaï Citation2004).
The Pike River watershed is believed to be an important contributor to the recurrent contamination of Missisquoi Bay by toxic cyanobacteria, and has been the focus of several multi-scale hydrological studies. Detailed descriptions of the watershed can be found in Deslandes et al. (Citation2007) and Michaud et al. (Citation2007). The downstream portion of the watershed has a flat topography and fertile soils, and is mostly (75%) devoted to intensive agricultural activities. Fifty percent of the surface area under crop cultivation is devoted to annual crops, particularly grain and silage corn, and soybean production. Intensive animal operations predominate the rugged, steeper and mostly forested upstream portion of the watershed, although some annual crops are also cultivated.
The hydrological regime of the 65-km-long Pike River is characteristic of snowmelt basins, with one major peak flow during the snowmelt season (mostly in April), and a lower discharge during the summer. The mean annual discharge of 8.9 m3 s−1 at the outlet can be 3 to 4 times higher during spring (OBVBM Citation2011). The climate is temperate, with short humid summers (mean daily maximum temperature of 20°C) and cold dry winters (mean daily maximum temperature of –10°C). Snowfall accounts for approximately 20% of the annual precipitation. Climate normals (1971–2000) for annual rainfall at the Farnham and Sutton weather stations (Figure ) are respectively 1095 and 1272 mm. Similarly, annual normals for snowfall at the two weather stations are 204 and 281 cm. One half of the precipitation falls during the growing season, which extends from May to September (Environment Canada Citation2012).
Hydrological modelling
The SWAT model (Arnold et al. Citation1998) was chosen for use in the present study because of its sound conceptual and physical foundations as well as its ability to simulate the hydrologic response of large, heterogeneous and agriculturally intensive watersheds (Borah and Bera Citation2003, Citation2004; Deslandes et al. Citation2007). This model has been successfully applied to simulate different water quality processes within the Pike River watershed (Deslandes et al. Citation2007; Eastman Citation2007; Gollamudi et al. Citation2007). Some studies have equally used SWAT for climate change studies (Douglas-Mankin et al. Citation2010). The superiority of SWAT in simulating best management practices (BMP) makes it a candidate of choice for the assessment of climate change adaptation strategies (Borah and Bera Citation2004) in intensively cultivated watersheds like the Pike River watershed.
Although Deslandes et al. (Citation2007) used SWAT 2000 (Arnold et al. Citation1998) to successfully simulate the hydrology and phosphorus (P) loss within the Pike River watershed (Deslandes et al. Citation2007), the model was not adapted to Québec soils and drainage conditions. In the present study, a modified version of SWAT 2005, known as SWATqc, with customized algorithms to improve subsurface tile drainage flow and surface runoff predictions in Southern Québec (Michaud et al. Citation2008), was used to study the impact of climate change on hydrological processes in the Pike River watershed of southern Québec.
SWAT input data
Data for the spatial parameterization of the model was retrieved from Deslandes et al. (Citation2007) and transferred from SWAT2000 to a SWAT2005 platform (Arnold et al. Citation1998; http://swatmodel.tamu.edu/contact/). Spatial data were entered into SWAT through a graphical interface (ArcSWAT) linked to Arcview 3.3 (ESRI, Redlands CA, http://www.esri.com/). The data consisted of a digital elevation model (DEM) with a spatial resolution of 30 ± 1.3 m (Deslandes et al. Citation2002), a digital hydrographic network with 99 sub-watershed outlets, a land-use layer derived from the classification of Landsat 7 ETM+ (Enhanced Thematic Mapper Plus) imagery acquired in July 1999 (Cattaï Citation2004), and digital soil layers and soil physical properties extracted or estimated from various soil surveys and studies conducted in this region (Thériault et al. Citation1943; Cann et al. Citation1948; Bernard Citation1996; United States Department of Agriculture – Natural Resources Conservation Service [USDA-NRCS] Citation1999; United States Department of Agriculture – Soil Conservation Service [USDA-SCS] Citation2006), and a soil degradation inventory (Tabi et al. Citation1990).
Daily precipitation and temperatures from 1970 to 2006 for the Farnham, Phillipsburg and Sutton meteorological stations closest to the watershed (Figure ) were extracted from the National Climate Archives Database (Environment Canada Citation2007). The precipitation and temperature data were entered into SWAT via the ArcSWAT interface.
Information pertaining to initial soil nutrient content and field management operations (such as tillage, sowing, fertilizing, harvest and the schedule of these operations) were obtained from Deslandes et al. (Citation2007). But for the scheduling of management operations, which was updated to correspond to the calibration and validation periods used in this study, all management parameters were maintained as reported in Deslandes et al. (Citation2007). Probable schedules of field management were determined by overlaying information from reports on the state of the crops (La Financière agricole Citation2008), rainfall events and observed management practices. These reports contained general information about the evolution/state of field work, and crop growth in the fields throughout the year. The 1998–2006 schedules were applied to the period from 1971 to 1998 due to a lack of data for the years prior to 1998.
SWAT set-up and calibration
The Hydrological Response Unit (HRU; a unique combination of soil and land use type within a sub-watershed) is the calculation unit in the SWAT model. Using the automatic delineation option of SWAT, 99 sub-watersheds were delineated for the study watershed based on the input DEM and digital hydrological network data. Overlay of the land-use and soil digital maps resulted in the creation of 1872 HRUs.
Runoff and evapotranspiration were estimated by the Soil Conservation Service (SCS) curve number (USDA-SCS Citation2006) and Hargreaves (Hargreaves et al. Citation1985) methods, respectively, while flow routing through the hydrological network was performed using the Muskingum method (Overton Citation1966).
Model calibration and validation were performed using daily streamflow data from the four Centre d’Expertise Hydrique du Québec (CEHQ Citation2013) monitoring gauges: Pike River upstream (PRup), Pike River downstream (PRdw), Walbridge Creek upstream (WCup) and Walbridge Creek downstream (WCdw) (Figure ). The available observed data were split into two data sets spanning the periods from November 2001 to May 2003 and November 2004 to May 2006, and used for SWAT calibration and validation, respectively.
Climate projections and impact assessment
The validated SWAT model was run with four climate projections provided by the Ouranos Consortium – a Quebec-based consortium of experts on climate science and modelling which provides regional climate data sets (projections) for numerous research groups (Ouranos Citation2013).
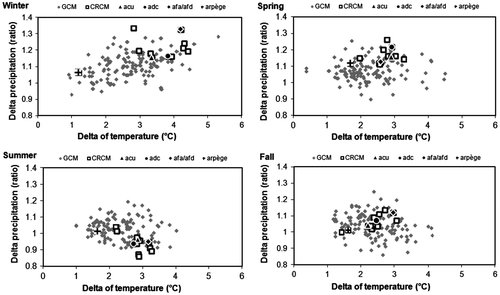
Climate impact assessments nowadays are usually performed using a large number of plausible climate projections in order to capture as many sources of uncertainty as possible. This approach, however, is time consuming and requires large computational resources. To circumvent these constraints, only four climate change projections were used in this study. Figure shows how the four climate projections used in the present study compare to an ensemble of 140 projections from other global and regional climate models (including the well-known CSIRO (Commonwealth Scientific and Industrial Research Organisation), ECHAM (European Centre Hamburg Model) and HadCM3 (Hadley Centre Coupled Model, version 3) models driven by various emission scenarios (A2, B1 and A1B). The four projections were purposely chosen to cover a spectrum of temperature and precipitation changes (low, medium and high increases as depicted in Figure ) and uncertainties that may arise from modelling techniques. Detailed descriptions of the climate models and attendant data sets are presented in the sections that follow.
Figure 2. Average changes in temperatures and precipitation in Missisquoi Bay watershed between 1971–2000 and 2041–2070. Projections ADC, ACU, AFD and ARP were chosen for the study. ADC, ACU, AFD and ARP are the four projections chosen for the study. The name of the projections were arbitrarily given by the consortium Ouranos provider of the climate data.
Climate data sets and impact assessment
Ouranos produced four pairs of climate data sets for the periods 1971–2000 and 2041–2070 using the French Arpège model – a global model with a variable resolution grid (Douville et al. Citation2002; Gibelin and Déqué Citation2003) – and the fourth-generation Canadian Regional Climate Model (CRCM4) (Caya and Laprise Citation1999; Plummer et al. Citation2006) driven by the third version of the Coupled Global Climate Model (CGCM3) (Scinocca and McFarlane Citation2004; McFarlane et al. Citation2005).
RCMs are subject to systematic errors (biases) transferred from the GCMs driving them (Déqué and Piedelievre Citation1995), or due to the RCMs themselves (Jha et al. Citation2004; Gagnon et al. Citation2009). Other uncertainties come from the connection between them (driving method) and the greenhouse gas (GHG) emission scenarios. Generally, bias correction techniques are applied to resolve these issues (Graham et al. Citation2007; Boé et al. Citation2009; Prudhomme and Davies Citation2009). At the time of the study, there was no widely recognized method for bias correction capable of preserving changes in the distribution of rainfall intensity and frequency. The simple delta correction described in the proceeding sections was therefore used to correct RCM biases.
For the future (2041–2070) climate simulations, the climate models were supplied with the Intergovernmental Panel on Climate Change (IPCC) Special Report on Emissions Scenarios (SRES) A2 (Nakicenovic et al. Citation2000), while measured GHG emission concentrations were used for the historical (1971–2000) period. The A2 scenario represents a world development scenario that produces one of the highest continual increases in GHG emissions. Other SRES scenarios present only minor differences in the global surface warming for the time horizon chosen in this study (Figure 10.4 in IPCC Citation2007); hence, it was assumed that the inclusion of all SRES scenarios would not result in significant improvements in the capture of uncertainties. In our view, the use of this worst-case scenario (A2) should permit the development of robust WMPs to withstand future climate-induced impacts. The characteristics of the four climate data sets, ADC, ACU, AFA/AFD and ARP (Ouranos Citation2010), are presented in Table . All simulations have distinct characteristics and equal probability of occurrence. Simulations ADC and ACU differed in their initial starting date only. AFD was produced from a different version of CRCM4 while ARP was generated with a completely different model (Arpège). Before comparing the future hydrological simulation to the historic, the combination of SWAT-RCM climate was validated by comparing the resulting historical outputs to a reference simulation driven by observed climate only. A supplemental data set known as ERA40 (Uppala et al. Citation2005) was also used to assess the influence of the CRCM4 on the hydrological results. The ERA40 is a reanalysis of observed data spanning the period 1971–2000. The code name for the CRCM4 climate data set derived from ERA40 is ACZ.
Table 1. Characteristics of the climate data sets driving SWAT (Soil and Water Assessment Tool). CRCM: Canadian Regional Climate Model; CGCM3: Coupled Global Climate Model version 3; SRES: Special Report on Emissions Scenarios; AMNO: Domain of North America for Climate Model.
The four data sets were chosen because of their distinct characteristics (e.g. different domain, model version or type, and different initial conditions). The use of simulations produced with existing techniques resulted in different climate outcomes and allowed for the inclusion of the main sources of uncertainty. Furthermore, the four projections (ADC, ACU, AFA/AFD and ARP) used in this project were chosen from over 140 simulations of temperature and precipitation produced with 20 recognized GCMs and the CRCM run with different parameterizations and greenhouse gas emission (GHGE) scenarios to account for various uncertainties mentioned previously.
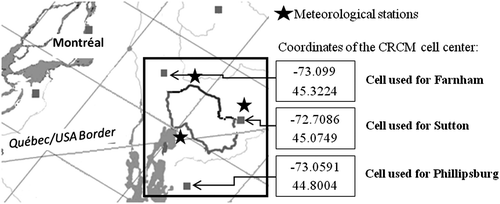
Daily precipitation, maximum and minimum temperatures (at 2 m above ground) and the maximum half-hour rainfall for the historical and future periods were transferred from three CRCM grid points into SWAT. The grid points were chosen such that their centres coincided with the locations of the meteorological stations used to calibrate the modelled hydrology. Grid cells were therefore centred over the geographical coordinates for Farnham (–73.099, 45.3224), Sutton (–72.7086, 45.0749) and Philipsburg (–73.0591, 44.8004) (Figure ).
Figure 3. Map of the Canadian Regional Climate Model (CRCM) grid cells providing the simulated climate data. Stars represent the meteorological stations from which observed precipitation and temperature data were obtained.
Climate data correction
The so-called perturbation or delta change method was used to correct the climate series whenever historical simulations produced with RCM data were not representative of current and past hydrology, during the validation step. To at least include changes in precipitation intensity, the maximum half-hour rainfall values produced by the RCM for historical and future simulations were used.
In the delta correction method, mean monthly changes in temperature and precipitation emanating from use of historical and future climate data sets were calculated and applied to the observed daily series (climate data used in SWAT1, long-term simulation [1971–2000] using observed climate data). Briefly, to correct for temperature, temperature changes (deltas) were calculated by averaging the daily temperature for each month for the historical and future periods and then subtracting the mean monthly temperature for the historical period from that of the future period. These deltas were subsequently added to the daily temperature for the corresponding month and used in running SWAT. Correction for precipitation was performed by multiplying the respective precipitation deltas (a ratio of the mean future monthly precipitation value to mean historical monthly value) with the corresponding observed daily values.
Summary of SWAT simulations
Figure summarizes the various SWAT simulations together with their climate input data sets. SWAT1 is a long-term (1971–2000) simulation obtained with the observed climate data and it corresponds to the calibrated reference simulation. SWAT2 is the simulation obtained with the reanalysis simulation ACZ. The output for the historical period simulations with the climate model data sets was defined as SWAT3 and those for the future period (2041–2070) simulations using the delta corrected climate inputs were defined as SWAT4.
Figure 4. Schematic diagram of the simulations performed in this study (adapted from Jha et al. Citation2004). Members refer to an initial condition (i) defined by the starting date and the parameterization of the CGCM. X is the name ADC, ACU, AFA/AFD or ARP given by Ouranos. Members used for this project are described in Scinocca and McFarlane (Citation2004). RCM: Regional Climate Model; GCM: Global Climate Model; SWAT: Soil and Water Assessment Tool. SWAT1 represents the hydrological results obtained with the calibrated simulation of reference. SWAT2 represents results obtained with the simulation ran with reanalysis climate data. SWAT3 represents results with simulations ran with climate model data for the reference period (1971-2000). SWAT 4 represents results obtained with simulations ran with climate model data for the future period (2041-2070).
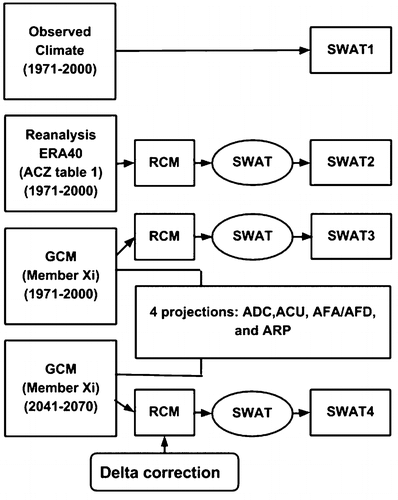
SWAT1 was only used to determine biases arising from SWAT, by comparing SWAT1 output with observed streamflow. SWAT2 was employed to validate the use of SWAT with CRCM data and to potentially highlight sources of error in the resulting SWAT and CRCM predictions. Because reanalysis ERA40 are close to observed data, the influence (or bias) of CRCM4 on the hydrological results can be assessed by comparing SWAT2 to SWAT1. SWAT3 were used to validate historical simulations while SWAT4 were compared to SWAT 1 and used to assess the impact of climate change. Paired t-tests (or the non-parametric Wilcoxon test when data were not normally distributed) were applied to streamflow and water yield (defined as total runoff) to determine if mean changes between the future (2041–2070) and the historical (1971–2000) periods were significant. The threshold of significance was 5%. Non-significant changes were attributed to the natural variability in climate over the 30-year span.
Results and discussions
SWAT performance with observed climate inputs
The coefficients of performance for streamflow computed on a daily, monthly and annual basis for the calibration period (November 2001 to May 2003) were all above the criteria of acceptability proposed by Moriasi et al. (Citation2007). Whereas monthly and yearly R2 values exceeded 0.7, Nash Sutcliff efficiency (NSE) values were always above 0.5, with the absolute percentage deviation remaining below 25%. The coefficients of performance for streamflow for the validation period (November 2004 to May 2006) did not meet acceptability criteria, probably due to SWAT’s inability to effectively capture high-intensity, short-duration rainfall events at the daily time step. Validation of the model performance over a longer validation period (1980–2000) nonetheless resulted in relatively good coefficients (R2, NSE, and % deviation coefficients of 0.6, 0.55 and 14%, respectively). This longer period was used in a second validation aimed at testing the robustness of the calibration parameters to long-term changes in climatic conditions, taking into account natural climatic variability.
The calibrated SWAT model was able to simulate components of the water budget consistent with those from other studies (den Harog Citation1975; Michaud et al. Citation2008). Twenty percent of annual precipitation, for example, occurred in the form of snow in agreement with data recorded at meteorological stations in the study area (Environment Canada Citation2012). Fifty percent of precipitation left the watershed through evapotranspiration while surface runoff accounted for 30% of the water yield (total runoff) (Table ). These values were also reported on the map created by den Harog (Citation1975). For the study, the averaged water balance error computed with Equation (1) was 3%.(1)
Table 2. Simulation of the water cycle components over the entire Pike River watershed between 1971 and 2000 for the different climate data sets. Values are 30–year annual averages in mm/yr.
SWAT Performance with climate model inputs for the reference period (1971–2000)
Average water cycle components
Table shows annual averages for the main water cycle components for the historical period (1971–2000) simulated using observed data as well as the various climate data sets presented in Table .
The ACU and ARP simulations predicted the lowest (1227 mm) and highest (1476 mm) annual precipitation, respectively, in the Pike River watershed (Table ). The historic (1971–2000) precipitation for the study watershed derived from the SWAT3 simulations driven by the four climate model data sets (ADC, ACU, AFA and ARP) were between 80 mm (7%) and 329 mm (29%) higher than the SWAT1 simulation. This precipitation overestimation by the four climate projections during the reference period is likely attributable to less-than-perfect parameterization of the climate model’s physical processes and its attendant biases. The bias might also have emanated from the spatial resolution of the RCM (45 × 45-km grid) used to model processes at the local scale (climate at a weather monitoring station).
The biases from the four simulated climates affected absolute values of the water cycle components, but not necessarily the overall hydrological processes. In fact, the proportional distribution of the watershed moisture through the water cycle was rather well simulated with SWAT2, SWAT3-ADC and SWAT3-ACU, given their close agreement with values obtained from SWAT1. Annual surface runoff was slightly overestimated by SWAT2, with 39% of the water yield (total runoff) leaving the watershed as surface runoff compared to 32% from SWAT1. The fact that other components of the water cycle were satisfactorily reproduced suggests that the overestimation was probably caused by differences in the distribution of precipitation events which affected soil moisture and water infiltration.
SWAT3-AFA and SWAT3-ARP, on the contrary, presented a relatively high water yield (60% of the total water balance) and low evapotranspiration (40% of the water balance) (Table ). This imperfect allocation of precipitation to the water cycle components may be attributed to (1) a negatively biased temperature, especially during the summer months and/or (2) a positively biased summer precipitation coupled with insufficiently high temperatures to evaporate the resulting surplus moisture. A comparison of CRCM simulated precipitations and temperatures to measured data showed that whereas temperatures were, on average, under-predicted by 2°C throughout the year, a 60-mm average over-prediction of precipitation was observed during the May–August period. These results suggest that RCM biases were probably transferred to hydrological results. CRCM bias alone (SWAT2) did not seem to significantly impact annual hydrological processes. Nevertheless, the fact that temperature and precipitation data generated by the AFA and ARP simulations were very different from observed data suggests that the GCMs that drive the RCM may sometimes negatively affect hydrological simulations.
Annual streamflow
Figure depicts annual streamflows simulated with SWAT2 (reanalysis or ACZ) and SWAT1 simulations together with the streamflow data recorded at station PRup during the period 1980–2000 (the longest available streamflow observation data). Observed flows were, on average, higher than SWAT simulated flows. The major biases in the simulation data were probably introduced by the inability of SWAT to accurately reproduce the wettest years.
Figure 5. Long-term comparison (1980–2000) of observed and simulated annual streamflow with observed climate data (SWAT1) and reanalysis data (SWAT2) at the hydrological station PRup. PRup: Pike River upstream station; SWAT: Soil and Water Assessment Tool.
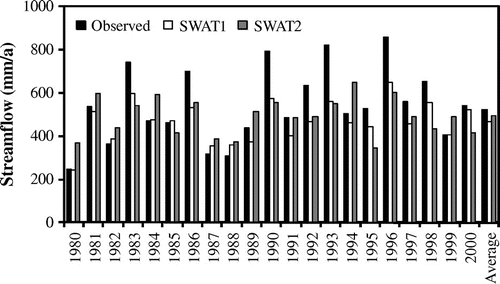
Annual streamflows predicted by SWAT2 (CRCM with reanalysis) did not necessarily match observed flows or those predicted with observed climate data (SWAT1). This temporal mismatch may be explained by the fact that the spatial resolution of RCMs does not allow for the satisfactory capture of local climatic events. Summer rainfall, for example, can vary significantly between points within the same watershed; hence, there are bound to be discrepancies between a station (a point) and the 45 × 45-km tile simulated by RCMs. Furthermore, sequences of precipitation events and temperature from climate runs produced with a set of varying conditions (such as our four climate runs) may differ substantially from observed climate data (de Elia et al. Citation2009). Comparison of SWAT2 and SWAT3 simulated flows to observed flows produced R2 and NSE values (Table ) below the thresholds of confidence (R2 and NSE < 0.5), probably because of the sensitivity of these two statistical indices to the magnitude and the order in which events occur (Moriasi et al. Citation2007). The NSE statistical index was thus deemed unsuitable for the assessment of the performance of these simulations.
Table 3. SWAT coefficients of performance for monthly streamflow when simulated using RCM historical runs.
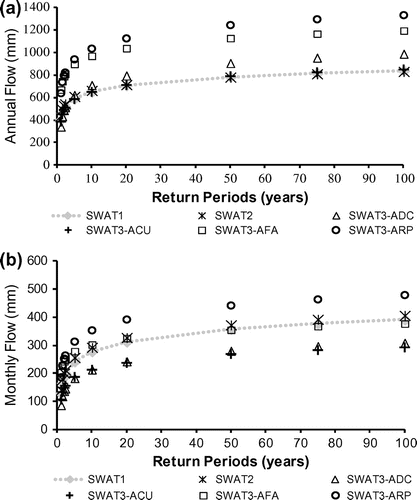
A visual inspection of the hydrographs, however, suggested that SWAT2 and SWAT1 produced similar annual flow averages and interannual variability over the past 30 years. To validate this, return periods for annual and highest monthly spring flows were analyzed for each simulation using the Gumbel probability function developed for extreme values (Bedient et al. Citation2008). The analysis focused on high flows because of their primary importance in determining flood occurrences. The difference in magnitude of flow predicted by SWAT1 and SWAT2 simulations for each return period fell within ± 10% (Figure a). SWAT3-ADC and SWAT3-ACU showed fairly close agreement with SWAT1. ADC over- or underestimated streamflows by 17% and ACU by 4%, whereas SWAT3-AFA and SWAT3-ARP systematically overestimated the magnitude of annual flows by about 50% for most return periods. These results are consistent with the water budget which showed similar trends in the overestimation of precipitation and water yield. The discrepancies recorded between simulations may thus emanate from biases generated by the parameterization of global climate models, or the use of different RCM versions (CRCM4.2.3 and Arpège 4.4 in SWAT3-AFA and SWAT3-ARP simulations, respectively).
Figure 6. Comparison of (a) annual and (b) monthly streamflow for diverse return periods for the historical simulations 1971–2000. SWAT1 is the calibrated simulation of reference. SWAT2, the simulation obtained with reanalysis climate and SWAT3-ADC, ACU, AFA or ARP are the historical simulations obtained with the 4 climate model projections.
Seasonal and monthly streamflows
SWAT1 and SWAT2 performed similarly in predicting historical average monthly streamflow at PRup and the outlet of the Pike River during most of the year, but not for the spring snowmelt months (March, April and May) (Figure ). Furthermore, SWAT2 simulated a delayed flood period, with larger spring flood peaks (Figure ). This phenomenon is probably explained by the fact that the mean daily temperatures for March produced by the CRCM and used to drive SWAT were too low (–3°C on average) compared to the snowmelt temperature threshold (–1°C) established during SWAT calibration. This therefore led to the underestimation of March snowmelt by SWAT2 and, consequently, an increase in snowpack and shifting of the snowmelt runoff to April and May. This probably accounted for the overestimation of simulated streamflows for April and May observed in this present study. This temperature bias may be due to the spatial resolution of the CRCM. It is indeed conceivable for temperatures simulated for one tile (45 × 45 km) to not accurately represent the exact local conditions at the weather stations or over the watershed. In order to initiate melting, the entire grid of the CRCM must receive enough energy to achieve a temperature that starts the melting (one tile equals one homogeneous climate) which takes more time than supplying energy to a smaller grid.
Figure 7. Comparison of monthly observed and simulated mean streamflow for the period 1980–2000, at the PRup hydrological station and the Pike River outlet. SWAT1 PRup is the simulation performed with observed climate data; SWAT2 PRup is the simulation performed with reanalysis climate data for the PRup gauge. PRup: Pike River upstream gauge; SWAT: Soil and Water Assessment Tool.
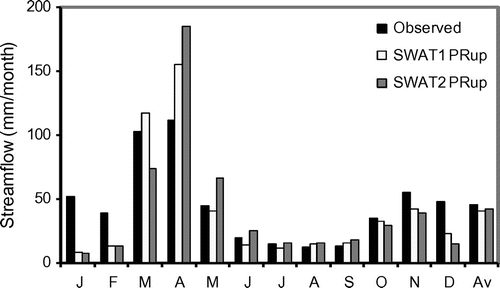
It is also important to note that the observed winter streamflow values shown in Figure are atypically high, probably due to interferences resulting from the presence of ice on the river during measurements. This therefore suggests that the magnitude of underestimation for the simulated winter streamflows might, in reality, not be as high as it appears in Figure .
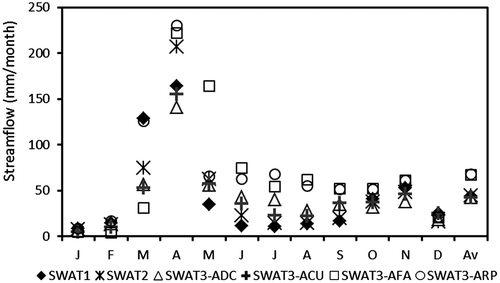
There were equally notable discrepancies between SWAT1 and the four simulations driven by the climate model data (SWAT3) (Figure ). The SWAT3 simulations also predicted generally higher delayed snowmelt and summer streamflows values than those from SWAT1. This overestimation was, however, attributable to biases introduced by the CGCM3. Comparison of observed and simulated precipitation series, for example, showed that all the climate simulations used in this study over-predicted summer monthly precipitation by 25 mm (20%) to 75 mm (75%). This resulted in similar overestimation of spring and summer flows. The fact that SWAT2 did not over-predict flows during these periods suggest that systematic biases in the GCMs were solely responsible for overestimating summer flows while CRCM4 biases were responsible for the spring flood delay (Figures and ). It should be noted that, inasmuch as combination of the CRCM and CGCM can potentially reduce the impact of the bias on hydrological results (e.g. ADC and ACU peak flows), it might well amplify the bias in some instances (e.g. AFA and ARP peak flows).
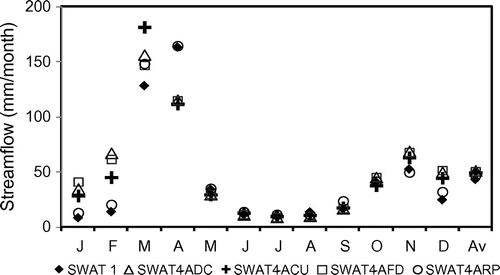
Figure 8. Mean annual streamflow simulated with observed climate and the five datasets produced by the RCMs for the historical period (1971–2000). SWAT1 was produced with observed climate data, and SWAT2 with reanalyzed data of observed climate (Table ). SWAT3 are historical simulations produced with each of the four climate projections ADC, ACU, AFA/AFD and ARP. RCM: Regional Climate Model; SWAT: Soil and Water Assessment Tool.
In order to have a rough estimate of spring flood frequency, the peak flow magnitudes for the March and April flows for various return periods were calculated using the Gumbel probability method. The differences in the magnitude of spring peak flows simulated by SWAT1 and SWAT2 for 1.1, 1.5, 2, 5, 10, 20, 50 and 100-year return periods, just like annual flows, did not exceed + 10% (Figure b).
It can be concluded from these results that the SWAT model driven by the CRCM was able to reproduce current interannual streamflow variability, flood frequency and average monthly and annual streamflows over a 30-year period, albeit with some biases in summer and spring which were probably introduced by the climate models. The findings from this study highlight the potential for the transfer of systematic biases from climate models into SWAT, especially in the study of a meso-scale watershed such as the Pike River (630 km2). Although the use of RCMs compared to GCMs results in improvements in the resolution of data needed for hydrological studies, results from our study showed that further downscaling or bias correction remains essential given that biases affected winter temperatures, which in turn affected winter snowpack, and later spring snowmelt and streamflow, significantly. Summer streamflow, which, unlike snowfall and snowmelt, is not governed by temperature thresholds, seems to be affected more by precipitation (precipitation overestimation similar to streamflow overestimation) than temperature, although very low temperature could potentially induce low evapotranspiration and lead to streamflow overestimation.
Impacts of climate change on the study area
Temperature and precipitation
The four climate projections chosen in this study predicted the greatest changes in precipitation and temperature in winter (December, February and March). Projection AFA predicted the greatest changes in temperature and precipitation for all seasons except spring. Projection ARP had the smallest changes in temperature and precipitation for all seasons, while ADC projected the greatest increases in temperature and precipitation for spring only. The average changes in temperatures and precipitation for the Missisquoi Bay based on ACU, ADC, AFA/AFD and ARP projections are presented in Table .
Table 4. Average changes in temperature and precipitation for the Missisquoi Bay based on ACU, ADC, AFA/AFD and ARP projections. ACU, ADC, AFA/AFD and ARP are the names of the climate projections.
Watershed hydrology
Improvements in climate change results due to the delta correction
This section compares climate change impacts resulting from the direct use of the climate data set to those resulting from use of the bias corrected (delta method) climate data set. Figure shows the range of future monthly streamflow predicted using the two methods and the four climate projections.
Figure 9. Comparison of streamflow changes simulated using corrected (delta method) versus uncorrected RCM data for (a) November to April months and (b) May to October months. SWAT: Soil and Water Assessment Tool; RCM: Regional Climate Model.
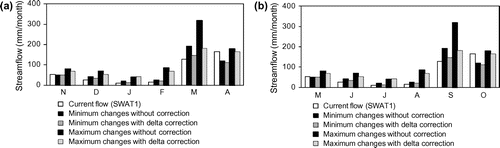
Figure 10. Mean annual streamflow simulated with RCM bias (delta) corrected climate data for the 2041–2070 period. SWAT1 was produced with observed climate data, while SWAT4 are the future simulations produced with each of the four climate projections ADC, ACU, AFA/AFD and ARP. RCM: Regional Climate Model; SWAT: Soil and Water Assessment Tool; SWAT1 is the calibrated simulation of reference; SWAT4 are the projected simulations in the future. ADC, ACU, AFD, and ARP are the name of the simulations.
The main difference between the two methods occurred in March, where streamflow predictions emanating from simulations with bias-corrected data showed a much smaller increase compared to the direct entry of uncorrected data into SWAT (Figure ). This is due to the fact that negative biases within uncorrected data resulted in very low late-winter and early-spring temperatures which limited the melting of the snowpack compared to the simulations with the delta-corrected data. As a result, when temperatures rose above 0°C in spring, all the accumulated snowpack predicted by simulations with uncorrected data melted at once, producing higher flows in March. The predicted range of monthly minimum and maximum streamflows based on the bias-corrected data was also much narrower, indicating fewer uncertainties within the results. The fact that the use of delta-corrected climate data resulted in the prediction of slightly higher summer streamflows than the uncorrected climate data suggests a smaller climate-induced impact on water availability during this season.
Annual changes in the hydrologic cycle components
Except for snowfall and snowmelt which decreased up to 15% or 39 mm in snow water equivalent, all the components of the hydrologic cycle showed annual increases under future climatic conditions (Table ). Annual precipitation increases of 7 to 12% led to a streamflow increase of 9 to 19%. Surface runoff increased by 11 to 21%, with the highest increase, surprisingly, predicted by the ARP simulation, which projected the smallest increase in precipitation. Interestingly, the ARP simulation equally predicted the smallest increases in total runoff (a surrogate for streamflow in this analysis), groundwater flow and recharge compared to the other three simulations. This leads us to suggest that ARP future precipitation must have been of higher intensity, leading to increased runoff and less soil infiltration. Another possible explanation for this observation could be that the lower spring temperature projected by ARP caused the soils to remain frozen for longer periods, thereby promoting runoff instead of soils and aquifer recharge. The other three simulations, by contrast, showed greater increases in groundwater flow than surface runoff. The fact that a large part of the watershed under cultivation is artificially drained, with tile drains accounting for 28 to 35% increase in water export, probably explains the greater increase in groundwater flow prediction by ADC, ACU and AFD. Evapotranspiration on an annual scale seemed to barely affect the hydrological cycle, given that all four simulations projected only small increases (2 to 7%).
Table 5. Relative changes witnessed by the water cycle components (SWAT1 vs. SWAT4). SWAT: Soil and Water Assessment Tool; SWAT1 is the calibrated simulation of reference and SWAT4 are the projected simulations in the future. ADC, ACU, AFD, and ARP are the name of the simulations.
Overall, the proportions of simulated components of the hydrologic cycle in the future climate remained comparable to the historical simulations, with 50% of precipitation still leaving the watershed by evapotranspiration and 45 to 50% via water yield (total runoff) while losses to the deep aquifer accounted for 6%. The projected proportions of surface to subsurface runoff were similar for all simulations but ARP.
Seasonal changes in streamflow
The majority of the four simulations typically projected significant monthly streamflow increases between September and March (Table ). The greatest increases were generally projected in January or February (54 to 375% increase) while the smallest significant changes occurred during fall (decreases of 5 to 7%).
Table 6. Changes (%) in mean monthly streamflow for delta corrected simulations (Corr) vs. simulations driven with direct entry of RCM data (Raw). Bold values represent significant changes at p < 0.05 (paired t-test). Values in italics show changes. RCM: Regional Climate Model; ADC, ACU, AFA-AFD and ARP are the name of the simulations.
March recorded the highest flows (peak) under future climatic conditions, as opposed to April peaks for historical/current conditions (Figure 0). All but the ACU simulation projected decreases in average peak flows under future conditions. As a consequence of the shift in peak flow towards March, the ADC, ACU and AFD simulations projected significant decreases in April streamflows, while ARP showed no significant changes. The highest absolute decrease in streamflow occurred in April, with a magnitude similar to the February increase. Although decreases in streamflow were also projected for the remainder of the year (May to August), the differences were not statistically significant for all simulations. The significant summer streamflow decreases projected by ADC and ACU ranged between –13 and –26%. The absolute decrease in summer streamflow never exceeded 5 mm because of the already low summer flows. This decrease, coupled with existing river drawdowns in the study watershed, however, suggests that climate change might exacerbate water scarcity; hence the need to develop WMPs that take into account this new reality.
It is interesting to note that whereas ACU projected the greatest increase in March spring flooding, it nevertheless showed temperature increases akin to ADC but slightly lower precipitation in spring. Furthermore, the increases in winter precipitation and temperature were much lower for the ACU than ADC and AFD climate projections, probably because of the higher average spring flood projected by ACU. In fact, the higher winter temperatures projected by ADC and AFD promoted rainfall and runoff, thereby diminishing water storage in the snowpack and reducing spring flood in March and April. ACU, on the contrary, suggested the storage of higher precipitation amounts on the soils during winter because the lower temperatures projected allowed for more snow accumulation, which subsequently melted and contributed to the spring flood at the onset of spring. The greatest effects of climate change on seasonal streamflow therefore did not emanate from the projections with the greatest temperature and precipitation increases.
The overall pattern of changes reported here has also been observed in studies performed in other watersheds in Québec (Minville et al. Citation2008; Boyer et al. Citation2010). Minville et al. (Citation2008) summarized these trends as an increase in winter flow, an earlier spring flood and a decrease in summer–fall flow. Boyer et al. (Citation2010), on the other hand, projected ± 10% changes in mean annual discharge for the entire Richelieu River valley depending on the model and GHGE scenarios used. Possible doubling or tripling of winter stream flow and a 40% increase or decrease in spring peak flow were further suggested (Boyer et al. Citation2010).
The changes observed in our study are mostly attributable not only to higher precipitation but also to higher winter temperatures which increase liquid precipitation and snowmelt episodes, thus reducing water storage in the snowpack. The early onset of spring flooding can be attributed to an increase in the daily mean temperatures during the month of March. These temperatures often exceeded the snowfall/snowmelt temperatures, thereby triggering earlier snowmelt runoff. The general decrease in spring peak flow is a direct result of winter changes (an increase in temperature) which shift spring snowmelt runoff from April to March. The decreases in summer streamflows can be attributed to the higher evapotranspiration, which resulted from an increase in temperature and a decrease in rainfall.
Conclusions
The present study employed the SWATqc model linked to regional climate models to assess the impacts of climate change on the hydrology of the Pike River watershed, an important agricultural watershed located in southern Quebec. SWAT simulations with uncorrected RCM outputs successfully reproduced the seasonality of hydrological flows and interannual variability. The transfer of RCM biases into SWAT, however, significantly impacted the model’s ability to predict not only the timing but also the magnitude of spring peak floods, suggesting the need for bias correction of RCM-generated climate data prior to use in hydrological modelling.
SWAT simulations with delta-corrected RCM data showed that the climate change projection for the 2041–2070 horizon could significantly affect the timing of spring floods, winter runoff and streamflow in the Pike River watershed. All four climate-driven simulations predicted a 9–19% increase in future annual streamflows and an 11 to 21% increase in surface runoff.
On a seasonal basis, winter runoff witnessed a 2- to 3-fold increase attributable to the temperatures, rainfall and snowmelt increase and numerous freeze–thaw events projected for this season. A noticeable shift in the peak discharge from April to March was equally envisioned by the ADC (obtained with the climate projection from CRCM4 version 1.1 driven by member 1 of the CGCM3), ACU (also obtained with the climate projections from CRCM4 version 1.1 but driven by member 4 of the CGCM3) and AFD (obtained with climate projections from the CRCM4 version 2.3 run on a larger domain than for the ADC and ACU) SWAT simulations that projected higher winter and spring temperatures and precipitations. The two climate projections (ADC and AFD) projecting the greater increase in winter temperature also projected a decrease in the magnitude of the spring peak flow attributable to more gradual snow melt processes. Projection ACU, with a moderate increase in winter temperature, on the other hand, projected a higher spring flood and consequently higher risks of flooding.
The projected decreases in late spring and summer streamflows suggests that climate change could potentially increase risks of water stress during periods when the resource is most needed for agricultural productivity and recreation in this region. An important caveat to consider when interpreting these results is the fact that changes in precipitation frequency were not incorporated into the analyses; hence, the results may represent rather conservative estimations of the potential climate change impacts on the hydrology of the study watershed.
Acknowledgements
This study was sponsored by a Natural Sciences and Engineering Research Council of Canada (NSERC) grant to C. Madramootoo. The authors also thank the Ouranos Consortium for providing data, sound advice and technical assistance as well as funding for the realization of the project. Special thanks to L’Institut de Recherche et Développement en Agroenvironnement (L’IRDA) for providing the modified SWAT model, data for its parameterization and technical assistance for hydrological modelling.
References
- Agroclimatic Atlas of Québec. 2012. http://dev.agrometeo.org/atlas/category/precipetp/hyd/false) ( accessed April, 2014).
- Arnold, J. G., R. Srinivasan, R. S. Muttiah, and J. R. Williams. 1998. Large area hydrologic modelling and assessment. Part I: Model development. Journal of the American Water Resources Association 34(1): 73–89.
- Auger, P., and J. Baudrand. 2004. Gestion Intégrée de l’eau par bassin versant au Québec: Cadre de référence pour les organismes de bassins versants prioritaires. In Direction des politiques de l’eau, (Ed.). Ministère de l’Environnement, Québec. Envirodoq ENV/2004/0009. http://www.mddelcc.gouv.qc.ca/eau/bassinversant/cadre-reference-giebv.pdf ( accessed April, 2011).
- Bates, B. C., Z. W. Kundzewicz, S. Wu, and J. P. Palutikof. 2008. Climate change and water. Technical Paper of the Intergovernmetal Panel on Climate Change, IPCC Secretariat, Geneva, 210 pp.
- Bedient, P. B., W. C. Huber, and B. E. Vieux. 2008. Hydrology and floodplain analysis. 4th ed. Upper Saddle River, NJ: Prentice Hall.
- Bernard, C. 1996. Estimation de l’érodabilité des principales séries de sol du Québec, à l’aide du nomographe de Wischmeier [Estimation of different Quebec soil types’ erodibility, with the aid of Wishmeier’s nomograph]. Agrosol 9: 6–12.
- Boé, J., L. Terray, E. Martin, and F. Habets. 2009. Projected changes in components of the hydrological cycle in French river basins during the 21st century. Water Resources Research 45: W08426.
- Borah, D. K., and M. Bera. 2003. Watershed-scale hydrologic and nonpoint-source pollution models: Review of mathematical bases. Transactions of the American Society of Agricultural Engineers 46(6): 1553–1566.
- Borah, D. K., and M. Bera. 2004. Watershed-scale hydrologic and nonpoint-source pollution models: Review of applications. Transactions of the American Society of Agricultural Engineers 47(3): 789–803.
- Bordoy, R., and P. Burlando. 2012. Bias correction of regional climate model simulations in a region of complex orography. Journal of Applied Meteorology and Climatology 52: 82–101.
- Boyer, C., D. Chaumont, I. Chartier, and A. G. Roy. 2010. Impact of climate change on the hydrology of St. Lawrence tributaries. Journal of Hydrology 384(1–2): 65–83.
- Cann, D. B., P. Lajoie, and P. C. Stobbe. 1948. Soil survey of Shefford, Brome and Missisquoi counties in the Province of Québec. 3M-10358-12-47. Experimental Farms Services, Dominion Department of Agriculture in Co-operation with the Québec Departement of Agriculture and Macdonald College, McGill University. 94 pp.
- Cattaï, J. 2004. Contour detection in a stratified field-scale approach to the classification of an agricultural landscape from LANDSAT TM data: Case study of the Pike River Watershed, southern Québec. Msc. thesis, Département de Géographie et Télédétection, Faculté des Lettres et Sciences Humaines. Université de Sherbrooke.
- Caya, D., and R. Laprise. 1999. A semi-implicit semi-lagrangian regional climate model: The Canadian RCM. Monthly Weather Review 127: 341–362.
- Centre d’Expertise Hydrique du Québec (CEHQ). 2013. Historique des niveaux et des débits de différentes stations hydrométriques. http://www.cehq.gouv.qc.ca/hydrometrie/historique_donnees/default.asp ( accessed May, 2013).
- Choi, W., P. F. Rasmussen, A. R. Moore, and S. J. Kim. 2009. Simulating streamflow response to climate scenarios in central Canada using a simple statistical downscaling method. Climate Research 40: 89–102.
- D’Auteuil, C. 2011. Le diagnostique du bassin versant de la Baie Missisquoi. Document 4 Plan directeur de l’eau. Organisme de Bassin Versant de la Baie Missisquoi. Bedford. 200 pp.
- de Elia, R., and H. Cote. 2009. Climate and climate change sensitivity to model configuration in the Canadian RCM over North America. Meteorologische Zeitschrift 19(4): 325–339.
- den Harog, G. 1975. Plate 25 – Water balance: derived precipitation and evapotranspiration. Canada. Atmospheric Environment Service. Department of Fisheries and Environment.
- Déqué, M., and J. P. Piedelievre. 1995. High resolution climate simulation over Europe. Climate Dynamics 11(6): 321–339.
- Deslandes, J., I. Beaudin, A. Michaud, F. Bonn, and C. A. Madramootoo. 2007. Influence of landscape and cropping system on phosphorus mobility within the Pike River Watershed of Southwestern Quebec: Model parameterization and validation. Canadian Water Resources Journal 32(1): 21–42.
- Deslandes, J., A. Michaud, A.,and F. Bonn. 2002. Développement et validation des indicateurs agroenvironnementaux associés aux pertes diffuses de phosphore dans le bassin-versant de la rivière aux Brochets. Agrosol 13(2): 111–123.
- Diaz-Nieto, J., Wilby, R., 2005. A comparison of statistical downscaling and climate change factor methods: Impacts on low flows in the River Thames, United Kingdom. Climatic Change 69: 245–268.
- Douglas-Mankin, K. R., R. Srinivasan, and J. G. Arnold. 2010. Soil and water assessment tool (SWAT) model: Current developments and applications. Transactions of the ASABE 53(5): 1423–1431.
- Douville, H., F. Chauvin, S. Planton, J.-F. Royer, D. Salas-Mélia, and S. Tyteca. 2002. Sensitivity of the hydrological cycle to increasing amounts of greenhouse gases and aerosols. Climate Dynamics 20(1): 45–68.
- Eastman, M., 2007. Field-scale nutrient transport monitoring and modelling of subsurface and naturally drained agricultural lands. Msc. thesis. Bioresource Engineering Department, McGill University, Montréal.
- Environment Canada. 2007. Canadian climate data on-line customized search – Canada’s National Climate Archive. National Climate Data and Information Archive. Environment Canada. http://www.climate.weatheroffice.gc.ca/climateData/canada_e.html ( accessed July, 2008).
- Environment Canada. 2012. Canadian climate normals or averages 1971–2000. National Climate Data and Information Archive. Environment Canada. http://www.climate.weatheroffice.gc.ca/climate_normals/index_e.html (accessed January, 2012).
- Environment Canada. 2013. Les dix événements métérologiques les plus marquants au Canada. 3. Innondation du Richelieu: la plus longue catastrophe au Québec. http://www.ec.gc.ca/meteo-weather/default.asp?lang=Fr&n=D7CF8BE3-1 ( accessed May, 2014).
- Fowler, H. J., S. Blenkinsop, and C. Tebaldi. 2007. Linking climate change modelling to impacts studies: Recent advances in downscaling techniques for hydrological modelling. International Journal of Climatology 27(12): 1547–1578.
- Gagnon, P., B. Konan, A. N. Rousseau, and M. Slivitzky. 2009. Hydrometeorological validation of a Canadian regional climate model simulation within the Chaudière and Châteauguay Watersheds (Québec, Canada). Canadian Journal Civil Engineering 36(2): 253–266.
- Gibelin, A.-L., and M. Déqué. 2003. Anthropogenic climate change over the Mediterranean region simulated by a global variable resolution model. Climate Dynamic 20: 327–339.
- Gollamudi, A., C. A. Madramootoo, and P. Enright. 2007. Water quality modelling of two agricultural fields in southern Quebec using SWAT. Transactions of the ASABE 50(6): 1973–1980.
- Graham, L. P., L. Andréasson, and B. Carlsson. 2007. Assessing climate change impacts on hydrology from an ensemble of regional climate models, model scales and linking methods: A case study on the Lule River basin. Climatic Change 81(Supplement): 293–307.
- Hargreaves, G. L., G. H. Hargreaves, and J. P. Riley. 1985. Agricultural benefits for Senegal River Basin. Journal of Irrigation and Drainage Engineering 11(2): 113–124.
- Intergovernmental Panel on Climate Change (IPCC). 2007. Climate change 2007: The physical science basis. In Contribution of Working Group I to the fourth assessment report of the Intergovernmental Panel on Climate Change, eds. S. Solomon, D. Qin, Z. Manning, Z. Chen, M. Marquis, K. B. Averyt, M. Tignor and H. L. Miller, 760–782. Cambridge, UK and New York: Cambridge University Press.
- Jha, M., Z. Pan, E. S. Tackle, and R. Gu. 2004. Impacts of climate change on streamflow in the Upper Mississippi River Basin: A regional climate model perspective. Journal of Geophysical Research-Atmospheres 109: D09105.
- La Financière agricole. 2008. Événements – État des cultures. Gouvernement du Québec. http://www.fadq.qc.ca/acces_medias/evenements/etats_des_cultures/etat_des_cultures_2012.html ( accessed July, 2011).
- Madramootoo, C. A. 2011. Richelieu River flood observation report. MacDonald Campus: McGill University. 24 pp.
- McFarlane, N. A., J. F. Scinocca, M. Lazare, R. Harvey, D. Verseghy, and J. Li. 2005. The CCCma third generation atmospheric general circulation model. Rapport interne du Centre Canadien de la Modélisation et de l’Analyse Climatique, 25 pp.
- Michaud, A. R., I. Beaudin, J. Deslandes, F. Bonn, and C. A. Madramootoo. 2007. SWAT-predicted influence of different landscape and cropping system alterations on phosphorus mobility within the Pike River watershed of south-western Québec. Canadian Journal of Soil Science 87(3): 329–344.
- Michaud, A., S. Seydoux, I. Beaudin, and C. Gombault. 2008. Beneficial management practices and water quality: Hydrological modelling of two basins in the Montérégie Region (Québec). National Agri-Environmental Standards Initiative Technical Series Report No. 4-65. Québec. Institut de Recherche et Développement en Agroenvironnemnt. 129 pp.
- Minville, M., F. Brissette, and R. Leconte. 2008. Uncertainty of the impact of climate change on the hydrology of a nordic watershed. Journal of Hydrology 358(1–2): 70–83.
- Moriasi, D. N., J. G. Arnold, M. W. Van Liew, R. L. Bingner, R. D. Harmel, and T. L. Veith. 2007. Model evaluation guidelines for systematic quantification of accuracy in watershed simulations. Transactions of the ASABE 50(3): 885–900.
- Nakicenovic, N., J. Alcamo, G. Davis, B. de Vries, J. Fenhann, S. Gaffin, K. Gregory, et al. 2000. IPCC special report on emissions scenarios. Cambridge, UK: Cambridge University Press.
- Organisme de Bassin Versant de la Baie Missisquoi (OBVBM). 2011. Rapport annuel. Assemblée Générale du 16 Juin 2011. Saint-Armand. 32 pp.
- Ouranos. 2010. Savoir s’adapter aux changements climatiques, rédaction: C. DesJarlais, M. Allard, D. Bélanger, A. Blondlot, A. Bouffard, A. Bourque, D. Chaumont, P. Gosselin, D. Houle, C. Larrivée, N. Lease, A.T. Pham, R. Roy, J.-P. Savard, R. Turcotte et C. Villeneuve, Montréal, 128 pp. http://www.ouranos.ca/fr/pdf/53_sscc_21_06_lr.pdf ( accessed November, 2011).
- Ouranos. 2013. Climate science. Climate simulation and analysis. http://www.ouranos.ca/en/scientific-program/climate-science/climate-simulations/default.php ( accessed July, 2014).
- Overton, D. E. 1966. Muskingum flood routing of upland stream flow. Journal of Hydrology 4: 185–200.
- Plummer, D. A., D. Caya, A. Frigon, H. Côté, M. Giguère, D. Paquin, S. Biner, et al. 2006. Climate and climate change over North America as simulated by the Canadian RCM. Journal of Climate 19(13): 3112–3132.
- Prudhomme, C., and H. Davies. 2009. Assessing uncertainties in climate change impact analyses on the river flow regimes in the UK. Part 2: Future climate. Climatic Change 93(1–2): 197–222.
- Schoetter, R., P. Hoffmann, D. Rechid, and K. H. Schlünzen. 2012. Evaluation and bias correction of regional climate model results using model evaluation measures. Journal of Applied Meteorology and Climatology 51: 1670–1684.
- Scinocca, J. F., and N. A. McFarlane. 2004. The variability of modeled tropical precipitation. Journal of the Atmospheric Sciences 61(16): 1993–2015.
- Stager, C. T. and M.Thill. 2010. Climate change in the Champlain Basin: What natural resource managers can expect and do. The Nature Conservancy. 44 pp.
- Sulis, M., C. Paniconi, C. Rivard, R. Harvey, and D. Chaumont. 2011. Assessment of climate change impacts at the catchment scale with a detailed hydrological model of surface-subsurface interactions and comparison with a land surface model. Water Resources Research 47: W01513.
- Tabi, M., L.Tardif, D.Carrier, G.Laflamme, and M.Rompré. 1990. Inventaire des problèmes de dégradation des sols agricoles du Québec – Région agricole 6, Richelieu, Saint-Hyacinthe [Quebec inventory of agricultural soil degradation problems – Agricultural Region 6, Richelieu, Saint-Hyacynthe]. Government of Quebec Publication 91–0025. Quebec City, QC.
- Teutschbein, C., and J. Seibert. 2012. Bias correction of regional climate model simulations for hydrological climate-change impact studies: Review and evaluation of different methods. Journal of Hydrology 456–457: 12–29.
- Thériault, J. E., L.Choinière, E.Pageau, and H.Talbot. 1943. Carte des sols du comté d’Iberville. Service de la grande culture du Ministère de l’agriculture du Ministère de l’agriculture et Service de la cartographie économique du Ministère de l’industrie et du commerce, Québec, QC, Canada.
- United States Department of Agriculture – Natural Resources Conservation Service (USDA-NRCS). 1999. Soil survey geographic (SSURGO) Database for Franklin County VT011.
- United States Department of Agriculture – Soil Conservation Service (USDA-SCS). 2006. Section 4–10. Hydrology. In National Engineering Handbook, Part 630. Washinghton DC.
- Uppala, S. M., P. W. KÅllberg, A. J. Simmons, U. Andrae, V. Da Costa Bechtold, M. Fiorino, J. K. Gibson, et al. 2005. The ERA-40 re-analysis. Quarterly Journal of the Royal Meteorological Society 131(612): 2961–3012.