
Abstract
The 2011 Richelieu River (Québec, Canada) spring flood was unprecedented in terms of destruction of property and negative impacts on agricultural as well as fish habitat within its watershed, costing an estimated CAD $90 million. The combined effect of various meteorological conditions that took place during the winter and the following spring season contributed to both the occurrence of a peak flow with a return period of 90 years and long flood duration. Due to the strong damaging effects of spring floods on both human and natural systems, the need for proper assessment of flood risks with a particular emphasis on the underlying key meteorological causes is pressing. The current study quantifies these flood risks as well as the main hydro-meteorological causes and consequences of the 2011 record spring flood of the Richelieu River using a two-component statistical and deterministic approach.
L’inondation de la rivière Richelieu au printemps 2011 est une première en terme de destruction de propriété et d’impact négatif sur l’agriculture et sur la faune du bassin versant, coutant ainsi environ 90 millions de $CAD au gouvernement du Canada et des États-Unis d’Amérique. Les effets combinés des différentes conditions météorologiques ayant eu lieu durant l’hiver et au printemps 2010–2011 ont contribué à l’occurrence d’une pointe de crue caractérisée par une période de retour de 90 ans et d’une longue durée de crue. Les dommages importants subis aux systèmes naturel et humain causés par cette inondation printanière mettent de l’avant le besoin pressant d’évaluer les risques d’inondation avec un accent particulier sur les causes et les conséquences hydro-météorologiques de la crue record de 2011 de la rivière Richelieu en utilisant une approche combinée statistique et déterministe.
Geographic–hydrological facts
The Lake Champlain and Richelieu River drainage basin (LCR) is composed of two interconnected sub-basins: the Richelieu River (lower) and the Lake Champlain (upper) watersheds. The Richelieu River stretches out about 124 km from its outlet at Sorel, on the south shore of the St. Lawrence River (Quebec, Canada), to Lake Champlain (straddling the states of Vermont and New York, USA), extending the LCR watershed for another 190 km southward near Lake George (Figure ). About 16% of the 23,900 km2 LCR drainage basin lies in Canada and the remaining 84% in the United States of America. Therefore, about 10% of the total discharge of the Richelieu River into the St. Lawrence River originates from the Richelieu River watershed, while the remaining 90% of the total discharge comes from water flowing northward through the natural reservoir of the Lake Champlain watershed (International Joint Commission [IJC] Citation2013). The overall time it takes for water to flow from the most distant part of the upper watershed (i.e. Glens Falls, NY; station 25 in Figure ) to the outlet of the Richelieu River, the time of concentration, is approximately 10 days.
Figure 1. The Lake Champlain and Richelieu River watershed.
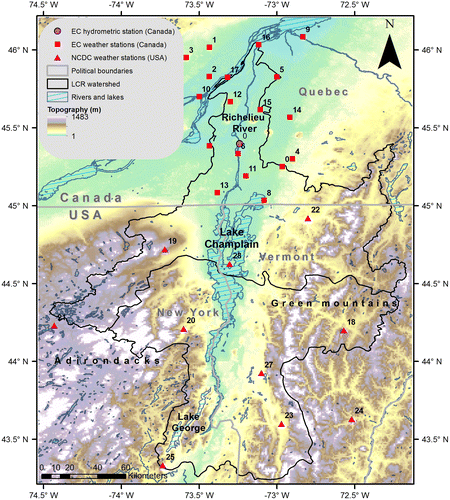
Aside from Lake Champlain (21,326 km2 drainage basin) and three other small streams, there are four main tributaries that drain into the Richelieu River (2506 km2), including the Acadie River (530 km2), the Huron River (334 km2), the South River (145 km2) and the Lacolle River (126 km2), according to a recent report by the Comité de concertation et de valorization de la rivière Richelieu (COVABAR Citation2011). The Richelieu River has a mean slope of 0.3 m/km (COVABAR Citation2011). The river is unregulated with very little obstruction along the stream with the exception of a 210-m-wide and 3.2-km-long shallow river bed near the city of Saint-Jean-Sur-Richelieu (station 6 in Figure ), which has the effect of retaining some of the water upstream of that segment.
The LCR watershed is characterized by various topographic features with mountain chains in the upper watershed (i.e. surrounding Lake Champlain) and low-lying flat lands in the lower watershed (i.e. downstream of Lake Champlain). Moreover, the Adirondack and Green mountains lie respectively to the west and east of Lake Champlain with a peak altitude of approximately 1629 m at Mount Marcy, NY (about 20 km southwest of station 20 in Figure ), whereas the lower watershed is comprised of the uniform low-altitude plains of the St. Lawrence valley. The total surface area of the watershed is covered by approximately 85% of vegetated land, 10% non-vegetated surfaces and 5% lakes and wetlands. The region is characterized by a moderate sub-humid continental climate with cold winters, warm summers and a long season favorable to agricultural growth (COVABAR Citation2011). The flow regime of the Richelieu River is conditioned by the snow accumulation in winter as well as by the precipitation and snowmelt in spring, which contributes to the average inter-annual peak flow (1981–2011) of 918 m3/s in the spring (i.e. flood-prone) season.
Causes of the flood
The temperate climate of northeast America consists of four distinct seasons with snow and ice accumulations occurring in winter as well as intense precipitation in spring, which, combined with snowmelt from rising spring temperatures, drive the flow regime of the LCR watershed. Although floods in this type of climate often occur in spring due to ice jams along the river channel, such conditions were not identified as causes of the Richelieu River record flood (Environment Canada Citation2014). The antecedent conditions of this extreme event included record cumulated winter snowfall in the upper watershed of Lake Champlain, particularly in the elevated peaks of the Adirondack and Green mountains. In addition, less frequent thawing conditions during the late 2010–2011 winter and early spring seasons favored the accumulation of snowpack in the region, thereby maintaining a large supply of water within the watershed.
In early April, as a sudden and early melt of the snowpack took place in the upper basin, the snowmelt runoff quickly reached Lake Champlain due to steep mountain slopes, and contributed to the rapid saturation of the watershed. The lake water levels increased and remained high due to sustained intense precipitation throughout the spring season. Consequently, the excessively high water volumes of Lake Champlain flooded its only outlet, the Richelieu River.
The 2011 record spring flood was therefore a consequence of a combination of the following meteorological conditions, which took place in the 2010–2011 winter and spring seasons (Environment Canada Citation2014; Saad et al. Citation2014):
| • | Large amounts of snow accumulated during winter; | ||||
| • | High snowmelt rate in spring; | ||||
| • | Large amounts of rainfall in spring in intense and sustained events; | ||||
| • | Strong and sustained southerly winds over the Lake Champlain valley in spring (i.e. through few persistent strong southerly wind events occurring during the peak flow). | ||||
Flood time course
The Richelieu River flow reached the critical surveillance level set forth empirically by the Ministère de la Sécurité Publique du Québec (MSP; Q > 900 m3/s) on 13 April 2011, at Fryer Rapids (QC; station #0 in Figure ). This initial spike in the river’s flow was partially caused by the joint occurrence of a temperature shift from mostly negative to positive mean daily temperatures, generating important amounts of snowmelt runoff as of the beginning of April, and by a rainfall event of 26.7 mm at South Hero (VT) on 11 April 2011 (Figure ).
Figure 2. Hydrograph (in m3/s), hyetograph (in 0.1 mm) and daily temperature variability (in 0.1°C) recorded by the South Hero weather station and the Fryers Rapids hydrometric station in 2011.
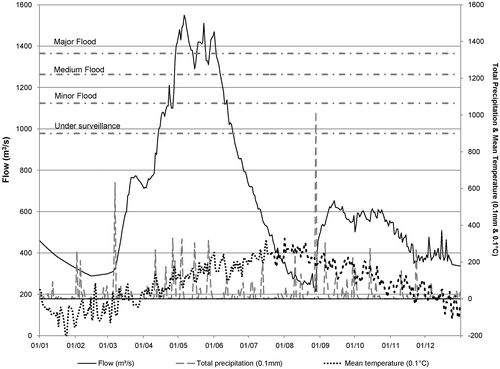
The continuously rising temperatures over the following week instigated additional snowmelt, which combined with sustained precipitation events, produced the first instances of a minor flood at Fryer Rapids as empirically determined by the MSP (Q > 1064 m3/s), on 20 April 2011 (Figure ). Such a discharge and associated water levels lead to bank overflows, inundating adjacent fields, roads and possibly threatening, isolating or slightly flooding waterfront properties.
The Lake Champlain and Richelieu River water levels increased notably throughout April 2011 due to continuous snowmelt and intense precipitation events, which took place on 20, 26 and 28 April (i.e. 17, 33 and 21 mm/day, respectively), quickly reaching major flood levels by 29 April (Q > 1335 m3/s; see Figure ). Consequently, the inhabited sectors over a larger surface area, mostly to the north of Lake Champlain and to the south of the Saint-Jean-Sur-Richelieu shoals, around the Missisquoi Bay and along the Richelieu River, were affected, with hundreds of residences, businesses and infra-structures isolated, threatened and flooded by overflowing water (MSP Citation2013). More than 1600 residents living along the major water bodies were evacuated (IJC Citation2013); human and economic activities were halted due to power failures and closed road networks.
Following the intense precipitation that fell on 3 and 4 May of 20.8 and 32.5 mm/day, respectively, the Richelieu River reached a peak flow of 1550 m3/s on 6 May 2011 (Figure ), and a record water level at Rouses Point, exceeding the previous record set in 1869 (Environment Canada Citation2014). The previous record was determined using traces of high water levels left on the train bridge near the actual station. The major flood status persisted until early June due to intense rainfall events that occurred in the middle and the end of May, in addition to strong and sustained southerly wind events, blowing at 46 to 65 km/h for more than 6 hours on 23 May. These conditions are suspected to have provoked a 0.3-m rise in water level at Rouses Point (NY), the Richelieu River inlet. Moreover, the 80 km/h southerly winds observed on 1 June contributed to an increase in the water level by 0.15 m on the coast of the Missisquoi Bay (Environment Canada Citation2014). The elevated water saturation level and time of concentration of the LCR watershed prolonged the flood until 14 June, when the Richelieu River flow fell below the minor flood threshold at Fryer Rapids (QC), and by 28 June, the water level finally decreased to values lower than bankfull (Figure ).
Statistical assessment
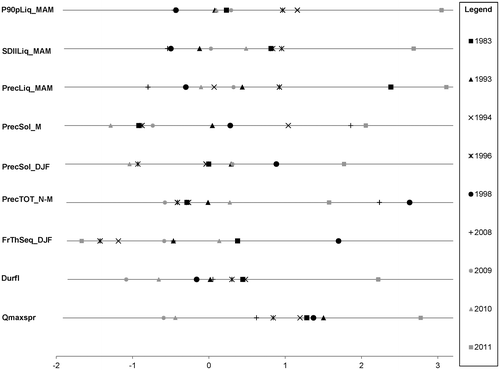
The inter-annual standardized anomalies of hydrological and meteorological indicators (defined in Table ) calculated according to the 1981–2011 period from observed daily precipitations and temperatures at South Hero (VT; station #28 in Figure ), and from daily flows recorded at the Fryer Rapids hydrometric station (QC; station #0 in Figure ), provide quantitative characterization of some of the hydro-meteorological events that took place during the 2011 record year in comparison with other flood events of the 1981–2011 period. A year characterized by a normal hydrological or meteorological event has a standard anomaly value of 0 such as the flood duration in 1993 (Figure ), which reflects the normal cumulated total precipitation of the corresponding winter and spring seasons. Figure presents the inter-annual standardized anomalies of certain hydro-meteorological events for 1983, 1993, 1994, 1996 and 1998 years that are characterized by particularly high spring peak flows of 1210, 1260, 1190, 1110 and 1230 m3/s, respectively. Additionally, the standardized anomalies of the more recent and less abnormal spring seasons of 2008, 2009 and 2010 with peak flows of only 1060, 783 and 818 m3/s, respectively, are also included for comparison purposes, along with the spring season of 2011. Strong positive standardized anomalies of peak flow and flood duration such as those observed in 2011 indicate an abnormally high peak flow and long flood duration relative to the 31-year study period. As illustrated in Figure , the abnormally high total cumulated precipitation that fell from November to March 2010, combined with the abnormally low number of frost/thaw episodes and high intense liquid rainfall of those winter and spring seasons, respectively, may partially explain the extreme hydrological events of the Richelieu River in 2011.
Table 1. Definition and description of hydro-meteorological indicators.
Figure 3. Dot plot of the inter-annual standardized anomalies of hydrometeorological events according to the 1981–2011 reference period; all abbreviations are defined in Table .
Frequency analyses were performed by Saad (Citation2014) using hydro-meteorological indices listed in Table in order to quantify the probability of occurrence of the extreme events of 2011 based on observed records of 1981–2011. The probability distributions used for these frequency analyses were mostly heavy-tailed distributions; they were selected and adjusted according to the semi-automated approach developed by El Adlouni et al. (Citation2008) and are summarized in Table . The criteria used to compare and select the best-fitted distribution for each variable consist of the Akaike and Bayesian information criteria (AIC and BIC, respectively; Akaike Citation1974; Schwarz Citation1978).
Table 2. Scale, shape and location parameters (respectively given in parentheses) of marginal distributions fitted to hydrometeorological indices and stations.
It is estimated that the 2011 spring flood was partially caused by 354.7 mm of cumulative total precipitation (i.e. solid and liquid) fallen between November 2010 and March 2011 (PrecTOTN-M; i.e. a 1-in-14-year event). About 75% of this precipitation was in the form of snow, since 199.2 cm of solid precipitation fallen in winter of 2010–2011 (PrecSol_DJF) and 63 cm of solid precipitation fallen in March 2011 (PrecSol_M) were recorded in South Hero, VT, both events corresponding to 12-year recurrences. Environment Canada (Citation2014) reported that the Lake Champlain basin (i.e. upper portion of the watershed) received more than 150% the normal snowfall quantities and 3 times the normal amount of snowfall recorded in Burlington, VT. Furthermore, during 2010–2011 winter, the Richelieu River watershed (i.e. lower portion of the watershed) also received 120 to 140% of the normal amount of snowfall observed in the basin.
Solid precipitation accumulated during the extended 2010–2011 winter season due to the relatively low number of days with frost/thaw cycles (FrThSeq_DJF of 19 days), which has an estimated recurrence of 1 in 20 years (Saad Citation2014), and due to cold temperatures that persisted until early April 2011 (Environment Canada Citation2014).
In addition to these 2010–2011 winter conditions, large amounts of liquid precipitation had fallen intensely during the spring season, contributing to the severity of the 2011 spring flood (Saad Citation2014; Saad et al. Citation2014). In fact, a 1-in-120 year event of mean daily liquid precipitation intensity (SDIILiq_MAM) of 12.1 mm/wet day and a 260-year recurrence event of extreme precipitation intensity (P90pLiq_MAM) of 31.1 mm/day were recorded at the South Hero weather station (VT). Taking the latter into account, the 2011 spring season was the rainiest in the 31-year record for the Lake Champlain basin, with 2.5 times the normal precipitation quantities fallen between mid-April and mid-May 2011 (Environment Canada Citation2014).
Furthermore, the elevated water levels at Rouses Point, where Lake Champlain drains into the Richelieu River, were temporarily amplified by wind stresses and surge effects. The sustained and intense southerly winds ranging from 46 to 65 km/h observed for more than 6 hours on 23 May 2011 near Burlington, VT, and the southerly winds of up to 80 km/h observed a week later on 1 June, caused an increase in the water level downstream of Lake Champlain, thereby amplifying the flood severity at the intersection of the lower and upper watersheds during both these events (Environment Canada Citation2014).
In order to quantify the individual and combined effects of some of the 2010–2011 meteorological conditions on the record spring flood, Saad (Citation2014) evaluated the impact of probable flood attenuating meteorological scenarios on the daily spring flows. The five scenarios described in Table and illustrated in Figure are generated using the 2010–2011 observed time series of daily precipitation, and/or minimum and maximum temperatures as a basis, while other meteorological conditions remain unchanged. Fixed monthly increments were applied to these variables in order to meet P90pLiqMAM, PrecTOTN-M and/or FrThSeqDJF target values corresponding to events that occur on average once every 2 years, instead of the abnormal conditions observed in 2010–2011 (Table ). Consequently, these synthetic time series are used as meteorological input to the Centre Quebecois des sciences de l’Eau (CEQUEAU) hydrological model (Morin and Paquet Citation2007) in order to evaluate their attenuating impacts on daily flows (i.e. the difference between observed extreme and less abnormal conditions). This approach showed that an isolated decrease in extreme spring rainfall intensities or cumulated total precipitation fallen between November 2010 and March 2011 in the Lake Champlain valley would reduce the flood severity of the Richelieu River at Fryer Rapids from a major to a medium flood (scenarios 1 and 2, respectively in Figure ). However, the increase in the number of frost/thaw episodes in winter, which were expected to produce a decrease in the quantity of snowmelt available for spring runoff, appears to have no significant effect on the simulated flood (scenario 3 in Figure ). Futhermore, the joint decrease of P90pLiqMAM and PrecTOTN-M resulted in a flood status change from major to no flood (scenario 4 in Figure ), whereas the joint increase of FrThSeqDJF and decrease of PrecTOTN-M generated no apparent change in the flood conditions (scenario 5 in Figure ). A lack of information on winter snowpack and differing representations of the snowmelt contributions to flow between the hydrological model and the FrThSeq index may partially explain this inconsistency.
Table 3. Description of the probable flood attenuating scenarios.
Figure 4. Hydrograph of the 2010–2011 observed and simulated daily flows (in m3/s on the vertical axis) from the 2010–2011 observed meteorological conditions and from flood-attenuating scenarios 1 through 5, with respect to the various flood thresholds determined by the Ministère de la Sécurité Publique du Québec (MSP; dashed horizontal lines).
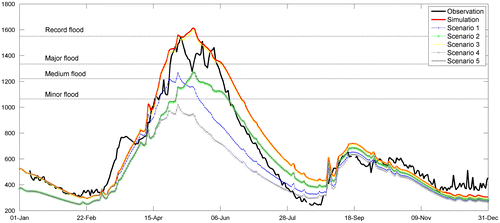
Table 4. The 95% confidence intervals of the estimated return periods of the joint occurrences of the 2011 extreme hydrometeorological events.
Univariate frequency analyses conducted by Saad (Citation2014) with the aforementioned hydrological indices (Table ) computed at the Fryer Rapids (QC) hydrometric station, and for the 1981–2011 period, revealed that the 2011 peak flow and flood duration have estimated return periods (T) of 90 and 22 years, respectively. Moreover, when longer historical records of the water levels at Rouses Point’s (NY) are considered, the recurrence of the 2011 Lake Champlain and Richelieu River flood is estimated to be less than or equal to one in 500 years (United States Geological Survey Citation2013). These return periods are inversely proportional to the probability (P) of flood occurrences [i.e. P(X ≥ x) = (1 / T), where x is the flood quantile and X is the daily flow corresponding to the random variable for which the exceedance probability is estimated].
Multivariate frequency analyses conducted by Saad et al. (Citation2014) of the peak flow index relative to certain meteorological indices presented in Table reveal additional information on the probability of the joint occurrence of the 2010–2011 hydro-meteorological events as well as on the partial causes of this extreme flood event. Joint return periods (T) of the 2011 flood peak, total precipitation fallen between November and March 2010–2011 (PrecTOTN-M), and extreme spring rainfall intensity (P90pLiq_MAM), or number of frost/thaw episodes, were estimated using fully nested trivariate Archimedean copula models (described in Saad et al. Citation2014). The joint return periods exceeding 30 years are not to be interpreted as precise recurrence intervals because they are computed using a limited sample size of 31 annual maxima. Nonetheless, it was found that the joint occurrences of the 2011 Qmaxspr, PrecTOTN-M and P90pLiq_MAM, or FrThSeq_DJF events are scarce with average return periods exceeding 10,000 years for the combination of the former indices (Table ). The latter is partially due to the very high marginal return periods of Qmax and P90pLiq in 2011. Furthermore, the trivariate conditional return periods of the 2011 spring flood indicate that the recurrence of this record peak flow is on average of 1 in 30, or of 1 in 25 years, when both the 2011 PrecTOTN-M and P90pLiqMAM conditions, or the 2011 PrecTOTN-M and FrThSeqDJF conditions are respectively met during the same hydrological year. The latter indicates that these meteorological events explain a major part of the record flow observed in 2011 since a conditional return period of 1 year would signify that, on average, a Qmax similar to that observed in spring 2011 occurs every time the conditional meteorological events take place.
Flood damages
The communities north of Lake Champlain and along the Richelieu River suffered considerable losses during the 2011 spring flood, which amounted to an estimated cost of CAD $90 million. About 79% of the economic cost is attributed to damages in the province of Quebec, 10% in the state of Vermont and 11% in the state of New York. Approximately 4000 homes were damaged in the USA and Canada combined (IJC Citation2013). In Quebec alone, 2530 properties were affected, 1650 Quebec residents were evacuated and 3145 residents required emergency assistance in the form of housing and/or food supply, while about 7000 psycho-social interventions were offered to a total of 40 affected municipalities in the Monteregian region of Quebec (MSP Citation2013). The flooded areas stretched out 65 km along the Richelieu River from Lake Champlain to Beloeil and Mont St. Hilaire, inundating thousands of hectares of farm land, while flood waters reached up to 1 km from the river’s shore in at least 20 municipalities (Environment Canada Citation2014). During the 67-day flood, there were many reports of eroded shorelines, damaged roads and bridges, sewer backups, electrical power failures (MSP Citation2013) and trapped fish in the flooded lands [about 1000 fish were returned to a water body in Quebec alone, according to the Lake Champlain Basin Program (LCBP Citation2013)]. In addition, the report on the flood resilience in the Lake Champlain Basin and Upper Richelieu River prepared by the LCBP indicates that the negative short-term impacts of the 2011 spring flood on water quality for aquatic life and human consumption include increased river and lake turbidity, increased nutrient load, locally elevated bacteria levels and elevated soluble chemical load.
These conditions rendered the local water supply unfit for drinking, which affected an estimated 20,000 people (LCBP Citation2013). In addition, the flow of debris damaged and killed many near-shore trees along the water bodies, and drowned wetlands under potentially large amounts of toxins and contaminants left by the flood waters. In the long term, such conditions, combined with the influx of eroded organic soils from agricultural fields, may promote the proliferation of algae bloom due to elevated nitrogen and phosphorus levels (IJC Citation2012), and alter the perseverance of benthic organisms in certain flooded wetlands (LCBP Citation2013). Such large and complex systems as the Lake Champlain basin may take several years to recover from the 2011 spring flood, which has repercussions downstream on the Richelieu River (LCBP Citation2013).
Flood benefits
Some fish species, such as the tench (Tinca tinca), benefited from the increased spawning area created by the flood plains. The population of these highly fecund fishes appeared to have increased in the St. Lawrence River (i.e. downstream of the Richelieu River) following the 2011 spring flood (LCBP Citation2013). Furthermore, these extreme hydro-meteorological events served as a test to the communication channels between several departments, institutions and governments, which successfully collaborated to deal efficiently with the disaster at hand, and to establish adequate programs to aid the victims and the communities in their recovery. In addition, the IJC has proposed a 5-year research plan in order to develop flood-attenuating measures that will decrease the vulnerability of the Lake Champlain and Richelieu River communities to future floods (IJC Citation2013). Following the 2011 event, a new integrated bulletin for seasonal hydro-meteorological vigilance has been developed and implemented (Environment Canada Citation2014).
Summary
In Quebec, the spring 2011 Richelieu River flood is considered the second most important natural disaster, following the 1996 floods of Saguenay-Lac-Saint-Jean. The water levels and flow reached record values due to abnormally high quantities of accumulated snowfall in winter and early spring, large quantities and intense rainfall events in spring and sustained cold temperatures, lasting through a good part of the spring season and followed by a rapid snowmelt under fast thawing conditions. The river was in a major flood state for 67 days. The strong and sustained southerly winds recorded in spring intensified the flood event over a few days during the peak water levels. The statistical assessment of the meteorological events showed that the isolated occurrence of some of these winter and spring conditions is scarce, while the joint occurrence of the 2011 hydro-meteorological events is very rare. However, the conditional return period of the 2011 peak flow is relatively low, when the 2011 P90pLiqMAM, PrecTOTN-M and FrThSeqDJF conditions occur in the same hydrological year, indicating that these events partially caused the record flood. Furthermore, the CEQUEAU hydrologic model proved capable of simulating the 2011 spring daily flows of the Richelieu River, and was useful in assessing the effects of the separate and joint conditions of extreme rainfall intensity in spring 2011, and cumulated total precipitation between November 2010 and March 2011 on flood outcomes.
The flood resulted in an economic loss of approximately CAD $90 million and disturbed many ecological and human systems, which may require several years to recover. However, several tools and beneficial research plans have arisen from the successful collaborations between the many key players involved in the emergency and recovery operations of the spring 2011 Richelieu River and Lake Champlain flood. However, further research and collaboration are needed among Canadian and American research laboratories, including to improve measurements, surveys (i.e. vigilance and alert systems) and modelling aspects, in order to have a more comprehensive understanding of the effects of snow pack conditions and other combined meteorological variables, particularly over high-elevation regions of the basin, on the entire water cycle. Also, the importance of reaching the vulnerable and general public through proper communication channels, in order to prevent and/or reduce damages on human and environmental systems, constitutes in itself a challenge that must be addressed.
Acknowledgements
We thank the financial support from the Natural Sciences and Engineering Research Council (NSERC) of Canada, and Environment Canada. Other financial support from the The International Research Initiative on Adaptation to Climate Change (IRIACC)-FACE project (see http://face.ete.inrs.ca/) is also acknowledged. IRIACC is managed by the International Development Research Center (IDRC), co-financed by the IDRC, the Canadian Health Research Institutes, the Social Sciences and Humanities Research Council of Canada (SSHRC) and NSERC. A special acknowledgement is also expressed to our colleagues at Environment Canada, Meteorological Service of Canada (Quebec region), for fruitful exchanges and support over the course of the study.
References
- Akaike, H. 1974. A new look at the statistical model identification. IEEE Transactions Automatic Control 19(6): 716–722.
- Comité de concertation et de valorisation de la rivière Richelieu (COVABAR). 2011. Plan directeur de l’eau – Portrait et diagnostic du bassin versant de la Rivière Richelieu. Beloeil: Comité de concertation et de valorisation de la rivière Richelieu, 290 pp.
- Cunnane, C. 1978. Unbiased plotting positions – Review. Journal of Hydrology 37: 205–222.
- El Adlouni, S., B. Bobée, and T. B. M. J. Ouarda. 2008. On the tails of extreme event distributions in hydrology. Journal of Hydrology 355(1–4): 16–33.
- Environment Canada. 2014. Richelieu: inondations – printemps 2011. Service Météorologique du Canada, Région du Québec, 24 pp.
- International Joint Commission (IJC). 2012. Étude sur les sources critiques de la baie Missisquoi. Groupe d’étude international sur la baie Missisquoi, 56 pp.
- International Joint Commission (IJC). 2013. Plan d’étude pour la determination des mesures visant à atténuer les inondations et leurs repercussions dans le bassin versant du lac Champlain et de la rivière Richelieu. Ottawa and Washington: Groupe de travail international du plan d’étude du lac Champlain et de la rivière Richelieu, 151 pp.
- Lake Champlain Basin Program (LCBP). 2013. Flood resilience in the Lake Champlain basin and the upper Richelieu River. Grand Isle: Lake Champlain Basin Program, 93 pp.
- Ministère de la Sécurité Publique du Québec (MSP). 2013. Rapport d’évènement Inondations printanière Montérégie 2011. Québec: Organisation de la Sécurité Civil du Québec, 19 pp. http://tinyurl.com/kx9qkqd
- Morin, G., and P. Paquet. 2007. Modèle hydrologique CEQUEAU. Research Report No. R000926, Institut National de la Recherche Scientifique, Centre Eau, Terre et Environnement, Quebec, 458 pp.
- Saad, C. 2014. Analyse hydrométéorologique multivariées et modélisation déterministe des crues de la rivière Richelieu, Québec. Master’s thesis, Institut National de la Recherche Scientifique, Quebec.
- Saad, C., S. El Adlouni, A. St-Hilaire, and P. Gachon. 2014. A nested multivariate copula approach to hydrometeorological simulations of spring floods: The case of the Richelieu River (Québec, Canada) record flood. Stochastic Environmental Research and Risk Assessment 29: 1–20. doi:10.1007/s00477-014-0971-7
- Schwarz, G. 1978. Estimating the dimension of a model. Annals of Statistics 6: 461–464.
- United States Geological Survey. 2013. Annual exceedance probabilities of the peak discharges of 2011 at streamgauges in Vermont and selected streamgauges in New Hampshire, western Massachusetts, and northeastern New York. Scientific Investigations Report 2013–5187, 17 pp.