Abstract
Understanding the water budget of the valley lakes in the water-stressed Okanagan region of British Columbia is important for allocating resources to maximize social well-being, environmental quality and the economy. However, high uncertainty in existing estimates of lake evaporation prevents sound water resource decision making. To address this uncertainty, buoy- and shore-based eddy covariance and meteorological instrumentation were deployed on the largest of the valley lakes, Lake Okanagan, for approximately 3 years. The objectives were to address the uncertainty in existing Lake Okanagan evaporation estimates by describing seasonal cycles and annual rates and the meteorological attributes controlling evaporation, and developing an accurate and useful model suitable for water managers and policy makers. Results indicate that two sites on Lake Okanagan experienced average annual evaporation of 725 and 835 mm over the study period. The difference can be attributed to spatial differences in surface water temperatures, vapour pressure gradients and atmospheric stability across the lake. Good relationships were found between evaporation rates measured with the eddy covariance systems and meteorological conditions at the offshore buoys, specifically between wind speed and the surface–atmospheric vapour pressure differences. From these relationships, a mass transfer model was developed. Accounting for the seasonal cycle in atmospheric stability increased the accuracy of monthly and annual evaporation estimates from this mass transfer model, but it remains inappropriate to predict daily or hourly evaporation. The study period included years that were climatically typical, so the evaporation observations could represent values close to the long-term mean, but this is unknown. The findings of this study highlight that long-term observations of the atmosphere consistently conditioned to the lake surface are needed for water managers and decision makers to have sound data and information on lake evaporation.
La compréhension du bilan hydrique dans les lacs de la vallée dans la région de l’Okanagan (Colombie-Britannique) qui est soumise à un stress hydrique est importante afin d’allouer les ressources de façon à maximiser le bien-être social, la qualité environnementale ainsi que l’économie. Toutefois, la grande incertitude concernant les estimations existantes de l’évaporation des lacs empêche la prise de décisions sensées pour ce qui est des ressources hydriques. Afin de résoudre cette incertitude, des bouées et des instruments météorologiques et de covariance des turbulences à terre ont été déployés dans le plus grand des lacs, soit le lac Okanagan, pendant une période d’environ trois ans. Ces mesures visaient à lever les incertitudes liées aux estimations existantes de l’évaporation des lacs en décrivant les cycles saisonniers et les taux annuels ainsi que les attributs météorologiques contrôlant l’évaporation et en élaborant un modèle précis et utile adapté aux gestionnaires des ressources hydriques et aux responsables des politiques connexes. Selon les résultats obtenus au cours de la période d’étude, deux sites du lac Okanagan font l’objet d’une évaporation moyenne annuelle de 725 mm et de 835 mm. La différence peut être attribuée aux différences spatiales dans les températures des eaux en surface, les gradients de la pression de vapeur et la stabilité atmosphérique du lac. Des liens solides ont été établis entre les taux d’évaporation mesurés avec les systèmes de covariance des turbulences et les conditions météorologiques des bouées en mer, surtout en ce qui concerne la vitesse des vents et les différences de la pression de vapeur entre la surface et l’atmosphère. Un modèle de transfert de la masse a été élaboré à partir de ces liens. La prise en compte du cycle saisonnier de la stabilité atmosphérique a permis d’augmenter la précision des estimations mensuelles et annuelles de l’évaporation fournies par ce modèle de transfert de masse, mais les estimations demeurent toujours inappropriées lorsqu’il s’agit de prédire l’évaporation quotidienne ou horaire. La période d’étude inclut des années pendant lesquelles le climat était typique; les observations liées à l’évaporation devraient donc comprendre des valeurs s’approchant de la moyenne à long terme, mais ces données sont toujours inconnues. Les résultats de cette étude indiquent que des observations à long terme de l’atmosphère, constamment en lien avec la surface du lac, sont requises afin que les gestionnaires des ressources hydriques et les responsables des politiques aient des données et des renseignements solides sur l’évaporation des lacs.
Introduction
Lakes occupy a notable portion of the Canadian landscape, upwards of 30% in some parts of the Canadian Shield. It is in this region of Canada where most of the lake energy budget and evaporation process research has taken place. Specific examples of research examining evaporative processes in Canada include Stewart and Rouse (Citation1976), Rouse et al. (Citation1977), Roulet and Woo (Citation1986) and Bello and Smith (Citation1990), who all evaluated the physical meaning of the Priestley–Taylor evaporation efficiency term, and demonstrated its applicability for estimating evaporation over small Canadian lakes. Spence at al. (Citation2003) identified an empirically derived logarithmic relationship between the Bowen ratio and the vapour pressure gradient for small Canadian Shield lakes. Granger and Hedstrom (Citation2010) developed an hourly evaporation model for lakes in western and northern Canada within which wind speed, temperature and vapour pressure gradients and atmospheric stability are key drivers.
Similar process research over the very large Laurentian and Boreal Great Lakes by Blanken et al. (Citation2000, 2011), Rouse et al. (Citation2008) and Spence et al. (Citation2013) highlights the strong seasonality of the hydrometeorology of Canadian lakes. The dimictic nature and large heat capacity of the cold temperate lakes that exist in Canada often result in a lag between peak energy input and output, lasting upwards of several months for the largest of the Great Lakes. Peak energy input near the summer solstice occurs when temperature gradients are downward towards the lake, and this creates a highly stable boundary layer and suppresses evaporation rates. The subsequent period of cooling in the fall and early winter, when temperature and vapour pressure gradients are upwards away from the lake, is associated with higher evaporation rates. As with small lakes, evaporation from large lakes is strongly controlled by wind speed and vapour pressure gradients. It is because of the influence of the vapour pressure gradients that inter-annual differences in evaporation from large lakes can be attributed to contrasting lake surface temperature and ice conditions.
The mountain lakes and reservoirs of British Columbia have not received as much attention even though they are among the most heavily managed in Canada, and the fact that information on evaporation rates can be very valuable for making water-management decisions (Tanny et al. Citation2008; Gronewold and Fortin Citation2012). Spring and Schaefer (Citation1974) applied a modified form of the Lake Hefner mass-transfer equation to obtain daily estimates of evaporation from Babine Lake in northern British Columbia. Mean daily evaporation was estimated to be 1.8 mm, with 21% of the annual amount of 380 mm occurring in August. Dillard and Evans (Citation1982) pro-rated annual pan evaporation by the monthly distribution of Babine Lake evaporation to derive estimates from several Columbia River reservoirs. Wiegand et al. (Citation1982) evaluated the energy budget of Kootenay Lake in 1976 and 1977, determining the average annual latent heat flux to be approximately 55 W/m2, which computes to about 2 mm/d.
Increased water demand in the late 1960s was part of the impetus for the 1974 Canada–British Columbia Okanagan Agreement that governed a comprehensive program to generate basic data on the physical and chemical properties of the lakes of the Okanagan Valley. One of the goals of the Agreement was to develop and test water budget measurement techniques for comprehensive inter-jurisdictional water resource planning (Stockner and Northcote Citation1974). This included work that produced a preliminary estimate of 880 mm/a for Lake Okanagan evaporation based on 1958–1974 corrected pan evaporation data from Environment Canada’s Summerland CDA climate station (Ferguson et al. Citation1974). This approach tends to overestimate lake evaporation and poorly represent seasonal rates because of heat capacity differences between lakes and pans, so there was some doubt as to the accuracy of this value. To address this uncertainty, and to develop a precise and practical method of estimating evaporation from Lake Okanagan, Trivett (Citation1984) deployed an eddy covariance system and associated offshore meteorological instruments for a 14-day intensive field study in September 1980. Trivett calibrated a mass transfer equation of the form:(1)
where E is evaporation (mm/d), es is vapour pressure at the surface of the lake (mb), ea is vapour pressure at 4 m above the lake (mb), u is wind speed 4 m above the surface (km/hr) and M is the mass transfer coefficient (2.4 × 10⁻⁵/mb), in this instance found to equal 0.024. Trivett (Citation1984) derived annual evaporation rates for the period 5 May 1980 to 4 May 1981 with Equation 1 using meteorological data from both the Kelowna A and Penticton A airport climate stations converted to represent over-lake conditions, as well as from the Summerland CDA evaporation pan, and found values to range from 245 to 798 mm/a.
Schertzer and Taylor (Citation2009) evaluated 19 methods of estimating Okanagan Valley lake evaporation with readily available meteorological data, again with the objective of recommending an optimum method. They also found there to be a wide range of estimated annual evaporation rates, from 250 to 1200 mm/a. Much of this range was associated with uncertainty in how to apply corrections to land-based data from airport climate stations to represent over-lake conditions. Schertzer and Taylor (Citation2009) found the best estimates to come from an air temperature index model:(2)
where TYLW is mean daily air temperature (°C) as measured at the Environment Canada station Kelowna A. Equation (2) has an expected error in the annual evaporation estimate of between 25 and 50%. Recognizing the futility of continuing to try to estimate Lake Okanagan evaporation with airport- or shore-based meteorological data, Schertzer and Taylor (Citation2009) recommended an intense and thorough lake observation study that would span multiple years and include buoy-based observations, shoreline meteorological stations, temperature moorings and hydrodynamic measurements.
Forty years after the original Canada–British Columbia Okanagan Agreement, the Okanagan region remains water stressed. There has been much research into how climate change may impact regional fluxes of precipitation, temperature and streamflow (e.g. Merritt et al. Citation2006), even though baseline lake evaporation rates remain highly uncertain. High demand for water is consistently growing from a variety of users relative to supply (Rayne and Forest Citation2010). Understanding the Lake Okanagan water budget is necessary to properly evaluate the resilience of the regional water management system and the lake itself, and to make informed water allocation decisions. This includes impacts of withdrawals on water levels and downstream flows from the lake to the lower Okanagan lakes (i.e. Skaha and Osoyoos) and across the international boundary to the USA. This paper reports results of a 3-year study with an objective building on Trivett (Citation1984) and Schertzer and Taylor (Citation2009) to address the uncertainty in Lake Okanagan evaporation rates by describing the meteorological attributes controlling evaporation, describing seasonal cycles, if any, estimating annual rates and developing an accurate and useful model to allow for ongoing estimation by water managers and policy makers.
Lake Okanagan
The regional physiography of the Okanagan is one of a high plateau with elevations between 1200 and 1500 metres above sea level (masl) containing a north–south trending valley of elevation 250–500 masl. The Okanagan Valley lies in the rain shadow of the Coast and Cascade Mountains to the west (Figure ). The mountains to the east prevent the encroachment of cold Arctic air masses. The result is a warm semi-arid to arid climate. At Environment Canada’s Kelowna A climate station, 1981–2010 mean daily temperatures in January and July were –2.5°C and 19.5°C, respectively. Mean annual unadjusted precipitation for the same period is estimated to be 390 mm (Environment Canada Citation2014).
Figure 1. Lake Okanagan, study instrumentation and notable locations of long-term monitoring nearby. Satellite imagery is copyright the Microsoft Corporation. Inset regional location map adapted from Ferguson et al. (Citation1974).
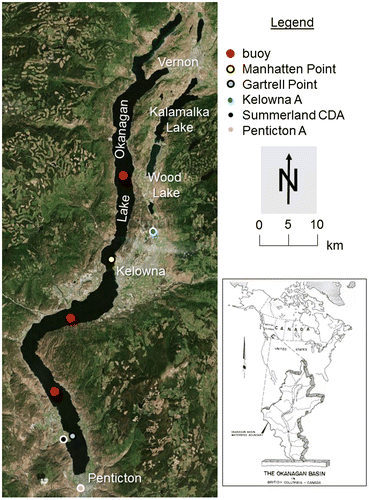
The Okanagan Valley contains six major lakes, the largest of which is Lake Okanagan (Figure ). Lake Okanagan is 348 km2 in area, with mean and maximum depths of 76 m and 242 m, respectively. The lake volume is estimated to be 26.5 × 10⁹ m3. The maximum length is 113 km, and the maximum width is 5 km. The lake outflow is controlled by operation of the Okanagan Lake Control Dam at Penticton at the south end of the lake. Mean annual outflow is 439 × 106 m3, which results in a theoretical mean residence time of ~60 years (Stockner and Northcote Citation1974).
Surface temperatures are generally warmer in the north parts of the lake (Trivett Citation1984). The spatial differences in surface water temperatures are influenced by winds, stream inflows and lake depth, particularly in spring. This phenomenon is diminished in summer as the surface layers of the lake become isothermal (Stockner and Northcote Citation1974; Trivett Citation1984). The lake seldom has ice cover, but this can occur in small, protected bays. Stockner and Northcote (Citation1974) determined the lake is dimictic, turning over in spring and fall, but Wassenaar et al. (Citation2011) suggest Lake Okanagan is monomictic, and that it stratifies in spring and mixes through the winter. The reason for this difference in classification, whether it is actual changes in the thermal regime of the lake in the last 30 years or measurement differences, could not be determined from the detail provided by the literature.
As introduced earlier, there is a wide range in previous estimates of Lake Okanagan annual evaporation, from 245 to 1200 mm/a. Ferguson et al. (Citation1974) suggest there is a seasonal cycle of evaporation, increasing from ~14% of the annual amount in May to a peak percentage of 20% in July, and then declining to ~6% in October. They do not provide winter evaporation rates, presumably because these values were estimated from an evaporation pan. The results of Ferguson et al. (Citation1974) suggest the May-to-October period contains 85% of the annual evaporation, while Trivett (Citation1984) implies there is a larger winter evaporation fraction, so that 75% of annual evaporation is produced from May to October.
Field measurements
The period of study extended from 26 July 2011 to 13 May 2014. Field deployment of instrumentation began with three foam-cored meteorological buoys approximately 2.5 m in diameter and 4.6 m tall, each located in one of the three arms of Lake Okanagan (Figure ). Each buoy was equipped with instrumentation at 3 m above the water surface to collect air temperature (T3; °C), vapour pressure (e3; kPa), and water temperature at 0.5 m (Tws; °C) and 2 m (Tw2; °C) depth, buoy direction, wind speed (u3; m/s), wind direction (u dir; °) and barometric pressure (P; kPa). Ten-minute averages of each of these terms were logged, from which half-hourly averages were computed. The measurement of Tws was assumed to represent water temperature at the surface. The difference between the atmospheric vapour pressure, e3, and the vapour pressure at the water surface (calculated from Tws assuming it represents the surface and the air is saturated), de (kPa), and the product of wind speed and this vapour pressure difference, u·de (m kPa/s), were both calculated from these half-hourly averages.
Eddy covariance systems were installed on Coast Guard beacons at Gartrell and Manhattan Points (Figure ). The beacons are approximately 20 and 100 m offshore, respectively, and allowed for installations approximately 10 m above the water surface. The distance upwind that contributed to the turbulent fluxes (otherwise known as the footprint) was estimated using the solutions of Schuepp et al. (Citation1990) with corrections added for atmospheric stability based on the median value of the Obukhov stability length. Based on these calculations, during unstable atmospheric conditions, 60–85% of the total flux was obtained over an upwind distance of 2 km and 80–95% originated over a distance of 5 km. Half-hourly turbulent fluxes of sensible and latent heat (H and E, respectively; W/m2 positive upward from the surface) were calculated from 10-Hz measurements of the vertical wind speed (w; m/s), air temperature (Ta; °C), and water vapour density (q; g/m). Wind speed was measured using a Campbell Scientific CSAT-3 3-D ultrasonic anemometer, while water vapour density was measured using a Campbell Scientific KH20 krypton hygrometer located 20 cm away and at the same height as the sonic anemometer. Corrections to the eddy covariance measurements include two-dimensional coordinate rotation (Baldocchi et al. Citation1988), air density fluctuations (Webb et al. Citation1980), sonic path length, high-frequency attenuation and sensor separation (Horst Citation1997; Massman Citation2000). Associated slow-response meteorological terms that were also measured at the beacons included air temperature (Ta; °C) and vapour pressure (ea; kPa).
The beacons at Gartrell and Manhattan Points were exposed to onshore winds from 340 to 200° and 135 to 75°, respectively. There was no relationship found between wind direction and humidity at the buoys, suggesting that at these offshore locations the air becomes conditioned to the water surface. This confirms that wind direction should not bias the estimates of the turbulent fluxes as long as the flux footprints are over the lake. Therefore, half-hourly turbulent flux values were removed from the data set during wind conditions that originated onshore. Half-hourly fluxes were also filtered for clearly erroneous spikes. The subsequent data gaps were filled using the relationship between wind speed and the difference in surface and atmospheric vapour pressure as measured at one of the buoys, and evaporation. The relationship was defined using data in a 2.5-hour window around the gap. Gap filling of the Manhattan Point and Gartrell Point time series was completed using meteorological data from the north arm buoy and south arm buoy, respectively. For gaps longer than 2.5 hours, an iterative procedure was used where the beginning and end of the gap were filled as described above, and then new relationships were derived with the constructed data. This iterative procedure was not run more than 10 times. If a gap remained that was less than 3 hours long, it was filled assuming a linear relationship between values before and after the gap. If a gap remained that was more than 3 hours long, it was not filled, and none of the half-hourly values from that day were used in the derivation of the daily average latent heat flux. The daily value was assumed to follow a linear relationship between previous and subsequent daily values. Gap-filled data were not used to derive longer time scale mass transfer relationships during the development of the predictive model.
Results and discussion
The period of study was one of normal air temperatures (Figure ). The only months that had air temperatures outside the 1981–2010 climate normal were October 2013 and February 2014, both of which were colder than normal. Air temperatures at Manhattan and Gartrell were very similar, both averaging 9.5°C throughout the period of study (Figure ; Table ). Annual maximum mean daily temperatures typically occurred in the second half of July and the first half of August. The coldest month of the year was typically January. The winter of 2013/2014 saw extended periods of below-freezing air temperatures from December through February. Wind speeds were typically higher at Gartrell than Manhattan Point, with averages of 3.5 m/s vs. 3.1 m/s. There was a stronger seasonality to the wind speeds at Gartrell vs. Manhattan with stronger winter maxima of 12.8 m/s vs. 9.5 m/s, respectively. Vapour pressure, like air temperature, was very similar between the two beacons, averaging 0.75 and 0.78 kPa at Manhattan Point and Gartrell Point, respectively. Vapour pressure followed the same seasonal pattern as air temperature, with maxima in July and minima in January (Figure ; Table ).
Figure 2. Mean monthly Kelowna A temperatures, 1981–2010 and those observed during the study period. The bars represent one standard deviation from the mean.
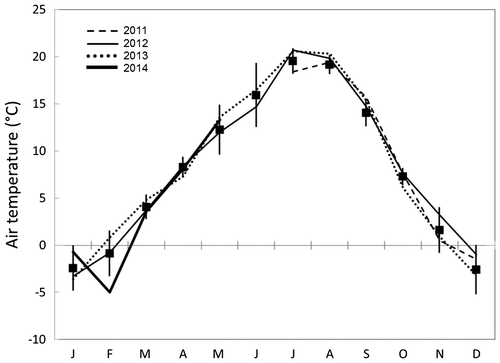
Figure 3. Seven-day running means of air temperature, wind speed, vapour pressure and latent heat flux measured at Manhattan Point (dashed line) and Gartrell Point (solid line) during the study period.
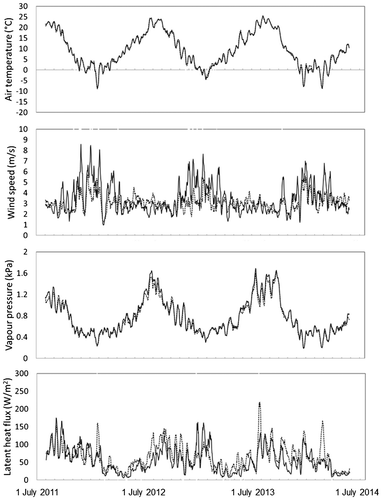
Table 1. Monthly, seasonal, annual observations from Manhattan and Gartrell Points and the north and south arm buoys.
Monthly minimum latent heat was in spring (averaging 26 W/m2 in March, April and May), increasing through the summer to an annual maximum in August (averaging 100 W/m2), declining through winter. Superimposed on this annual cycle are short-term periods of enhanced evaporation (Figure ) that can last as long as 2 weeks. Similar observations over other large Canadian lakes suggest these are likely associated with the movement of large-scale synoptic systems (Blanken et al. Citation2000; Blanken et al. Citation2011). There were differences in the time series between the two locations, with 16% higher latent heat fluxes measured at Manhattan Point than at Gartrell, averaging 65 vs. 56 W/m2 for the entire study period, respectively (Table ). These differences are primarily due to higher fluxes at Manhattan Point in the spring and summer, as there were more homogenous fluxes between the two sites during fall and winter.
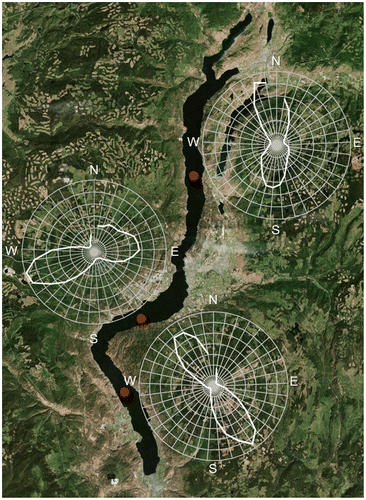
There were characteristics of both the evaporation and meteorological measurements that suggest spatial variations in evaporation across the lake do occur. These differences can be explained by over-lake conditions as measured at the three buoys. Figure illustrates the very different wind directions experienced at the three buoy locations. The north arm experienced a predominance of north winds, though the strongest winds in this location were from the south; the strongest and most predominant winds in the center arm were from the west; and the south arm experienced an equal distribution of northwest and southeast winds, with the strongest winds coming from the northwest. It is clear from Figure that the wind regime over the lake is governed by the shape and orientation of the Okanagan Valley.
Figure 4. Wind roses for each of the three buoys deployed for period of study. The thick white line illustrates the relative frequency with which wind blows from each 10° of compass direction. Satellite imagery copyright the Microsoft Corporation.
As documented by Trivett (Citation1984), lake surface temperatures were higher in the north arm (12.6°C) than in the south (11.4°C). Air temperature differences were not as pronounced between the buoys, but the result was a typically higher vapour pressure gradient in the north portion of the lake, except during the winter months (Figures ; Table ). Values of atmospheric stability could not be calculated using Monin–Obukhov theory because sensible heat fluxes were not estimated at the buoy locations, but the Richardson number (Ri) can be used as an indicator (Oke Citation1987). The 1-week running means illustrated in Figure mask what was wide variation in the daily Richardson numbers, but there was a seasonal cycle to the atmospheric stability, with stable air predominant from February to July and unstable air common the rest of the year. Stability conditions during June, July and August were more spatially diverse, with the south typically under stable conditions and the north experiencing very weak instability. On average, conditions at the north buoy were less stable than at the south buoy. This and the larger surface–atmospheric vapour pressure differences can explain the tendency for the higher latent heat fluxes at Manhattan Point.
Figure 5. Seven-day running means of Tws, surface–atmosphere vapour pressure differences, and the Richardson number measured at the north (dotted line), center (thick line), south (thin line) buoys during the study period.
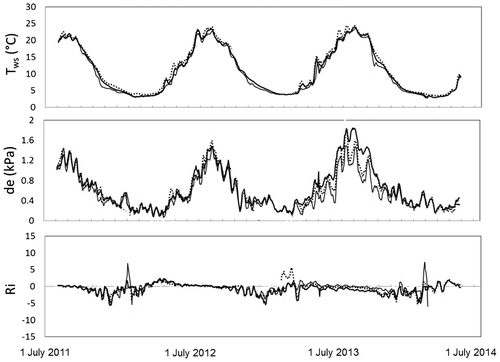
The annual minima in latent heat fluxes were associated with cool Tws, low values of de and growing conditions of atmospheric stability in March through May. The annual maxima in latent heat fluxes occurred in August when atmospheric conditions were becoming less stable, water temperatures were warm and surface–atmospheric vapour pressure differences were higher. As theory and observations from a diversity of lakes in North America and across the world show (Quinn Citation1979; Oke Citation1987; Blanken et al. Citation2011; Liu et al. Citation2012), evaporation from Lake Okanagan is a complex function of wind speed, atmospheric stability and vapour pressure gradients.
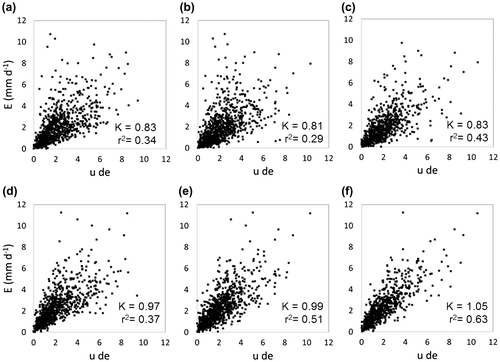
The relationships between daily evaporation rates and u·de as measured at the beacons, and each buoy for the period of the study, were generally strong (Figure ). The slope of the best-fit regression line is the same conceptually as M from Equation (1), but because the units of u and de differ from those in Trivett (Citation1984), it will be denoted K. Assuming a zero value of u·de results in no evaporation or condensation, the value of K varies from 0.81 to 1.05 (Figure ) which, interestingly, is within the range documented for Canadian Shield lakes in the Northwest Territories (Oswald and Rouse Citation2004). The best relationship was found between evaporation measured at Manhattan Point and the north buoy (r2 = 0.63). This is logical based upon the wind fields shown in Figure and the exposure of the beacon to onshore winds from the directions of the buoy.
Figure 6. Daily evaporation rates from each beacon vs. the product of wind speed and the vapour pressure gradient from each buoy. Left to right are the relationships between evaporation measurements from Gartrell Point and the product of wind speed and the surface–atmospheric vapour pressure differences at (a) the south, (b) the center and (c) the north buoys. Similarly, the relationships between evaporation at Manhattan Point and the product of wind speed and the surface–atmospheric vapour pressure differences at (d) the south, (e) the center and (f) the north buoys.
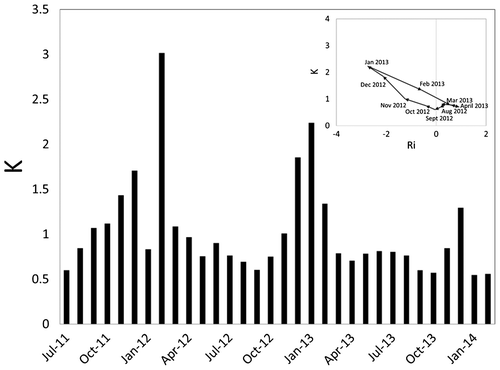
These mass transfer relationships are not without scatter, partly because they do not account for the effects of atmospheric stability. Figure shows the seasonal cycle of atmospheric stability over Lake Okanagan. The influence of seasonality on K is apparent in the monthly values (Figure ). The relationship between K and stability throughout the year is not linear, but hysteretic. Atmospheric conditions were stable in summer 2012, when K averaged 0.73. As stability steadily decreased into the fall, K initially decreased through September and then rose to a peak in January, coinciding with peak instability (Ri = –2.74; Figure ). As the degree of instability decreased into the spring of 2013, K decreased, but remained higher than during the early winter when instability was increasing. If:(3)
Figure 7. Seasonal cycles are apparent in monthly values of K derived from Gartrell Point evaporation rates and wind and surface–atmosphere vapour pressure differences from the south buoy. The inset shows the dynamic between monthly K and the Richardson number measured at the south buoy from July 2012 to July 2013.
and the hysteresis illustrated in Figure can be expressed primarily as a function of the wind speed and atmospheric stability:(4)
Equation 4 can be substituted into Equation 3, assuming K is a linear function of the Richardson number and wind speed:(5)
Adopting Equation (5) did not substantially improve upon the strength of the relationship between evaporation, wind speed and surface–atmospheric vapour pressure differences measured at the beacons and buoys shown in Figure , with regression coefficients only increasing by 0.01. This could be due to the dynamic hysteresis between K and atmospheric stability.
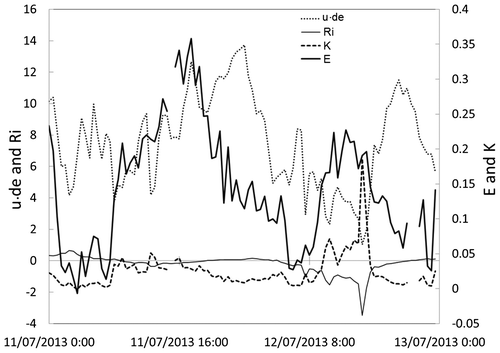
The inability to substantially improve upon a mass transfer equation of the form in Equation (3) may be due to the idiosyncrasies of the influence of stability, surface–atmospheric vapour pressure differences and wind that also occur at sub-daily scales. For example, the atmosphere in the south arm of Lake Okanagan from midnight to 07:00 on 11 July 2013 was stable, and evaporation was a clear function of u·de with a stable value of K near 0.008 (Figure ). As the atmosphere becomes unstable, evaporation increases with no appreciable change in u·de. The instability is increasing the evaporation rate, which needs to be reflected in values of K an order of magnitude higher (0.03). A shift towards stable conditions at 20:00 on 11 July 2013 results in decreasing evaporation rates even as u·de rises into the evening. The same pattern is repeated on 12 July 2013. These results imply that applying average values of mass transfer coefficients derived over the same lake can result in substantial bias in predicting evaporation. The gap-filling procedure described in the Methods section above was meant to account for these shifts in K with atmospheric stability. The choice of a window of less than 3 hours was meant to minimize the effects of changing atmospheric stability over the lake, which, as illustrated in Figure , follows daily heating and cooling.
Figure 8. Half-hourly observations of the product of wind speed and surface–atmospheric vapour pressure differences and the Richardson number measured at the south buoy, and evaporation measured at Gartrell Point and the derived K for 11 and 12 July 2013.
Estimated annual evaporation rates at Manhattan and Gartrell Points averaged 835 and 725 mm, respectively. The rate is high compared to that documented by Trivett (Citation1984), but this was expected. Trivett derived a mass transfer coefficient from data collected during a September field campaign. Figure shows that M or K is at an annual low in September, which would introduce a substantial bias if applied throughout the year. The seasonal cycle of evaporation was not as pronounced as that previously estimated for British Columbian lakes (Spring and Schaefer Citation1974; Dillard and Evans Citation1982; Trivett Citation1984) with only 15% occurring in the peak month of August. The observed May to October evaporation was only 60%, unlike the 75 or 85% described in Trivett (Citation1984) and Ferguson et al. (Citation1974), respectively. This difference is attributed to assumptions made in earlier studies about the heat capacity of Lake Okanagan relative to evaporation pans. The average daily evaporation rate and seasonal distribution compare well with those measured at Kootenay Lake by Wiegand et al. (Citation1982) using data from meteorological buoys. A substantial ice cover does not form on Lake Okanagan, unlike some of its counterparts in the Okanagan Valley (e.g. Wood and Kalamalka Lakes) and across British Columbia, so extrapolating the seasonal distribution or the annual totals to any lake beyond Lake Okanagan must be done with caution.
Mass transfer model
A straightforward and accurate approach to estimating evaporation from Lake Okanagan is still required to inform sound water management. Methods that apply mass transfer equations remain popular because of their ease of use. There are two key lessons to be learned from previous derivations and applications of mass transfer equations to estimate lake evaporation in British Columbia and Canada. First, a proper period of calibration is needed for deriving the mass transfer coefficient. Mass transfer coefficients theoretically are not static, and this has been verified by the current observations. Foremost, Quinn (Citation1979) suggested that application of mass transfer equations require enough data and information to derive an adequate way to account for variation in the mass transfer coefficient with atmospheric stability.
The second lesson is that the meteorological data used to calibrate and eventually force the model must come from observations made above the water surface. A large portion of the uncertainty in previous estimates of Okanagan Valley lake evaporation can be attributed to requirements to convert land-based meteorological observations to represent lake conditions. This is notoriously difficult when lakes are large enough to influence boundary layer development (Granger and Hedstrom Citation2010), as is the case with Lake Okanagan. Also, Austin and Colman (Citation2007) demonstrated that lake thermal regimes may respond differently to climatic shifts than adjacent terrestrial areas, such that even if robust relationships between land and lake conditions could be found, they may not be stationary. This introduced considerable uncertainty into Laurentian Great Lakes evaporation estimates during a period of low water levels when confidence was sorely needed (Yuzyk et al. Citation2012). As noted by Schertzer and Taylor (Citation2009), the best approach is to take measurements that are consistently exposed to air conditioned to the lake surface.
Monthly values of K were determined using evaporation measured at Manhattan Point, and lake temperature and atmospheric conditions at the north buoy. This pairing was selected because it had the best relationship between daily evaporation, wind speed and the surface–atmospheric vapour pressure differences (Figure ). For each month, regardless of which year they were collected, observations were split into two groups of even- and odd-numbered days. From each group, a mass transfer coefficient was derived from the slope of line of best fit between daily evaporation u·de assuming a zero intersect. The monthly value of K was selected from the better of the two regressions (Table ). To assess the accuracy of predicting daily evaporation using observations at the north buoy and these mass transfer coefficients, each monthly coefficient was used to predict evaporation in the opposite group similar to the split sample approach advocated by (Klemeš Citation1986). Error was assessed by comparing the predicted and observed evaporation rates first using an average percentage daily error and the percentage error in the predicted monthly evaporation rate.
Table 2. Monthly mass transfer coefficients derived from data at Manhattan Point and the north buoy. Results of the error analysis are also included. K is the mass transfer coefficient from Equation (3) and r2 is the regression coefficient of the line of best fit from the monthly split sample. Ed is the average daily error and Ev is the monthly error.
Values of K from Manhattan Point and the north buoy vary from a maximum of 1.77 in January to a minimum of 0.86 in June (Table ). This seasonal pattern is comparable to that seen in Figure , but does not exhibit the same extremes as values derived from Gartrell Point evaporation rates and meteorological measurements at the south buoy. There was no seasonality exhibited in the regression coefficients, but poor relationships were found in January (r2 = 0.45) and August (r2 = 0.31; Table ). This, however, was not necessarily reflected in the error. Average daily percentage error in March was 13.3%, despite a robust fit with an r2 of 0.66. Such an effect was often due to a few days in the record with very low evaporation rates. This is apparent as the March monthly error was 5%. Average monthly error was –5.7%. These results imply that a mass transfer model of the form of Equation (3) with coefficients from Table , and meteorological observations at the same height above the water surface and location as the north buoy, can reliably predict monthly and annual evaporation rates from the north portions of Lake Okanagan. There would remain large uncertainty in daily estimates.
Conclusions
Average annual Lake Okanagan evaporation measured at two sites from July 2011 to May 2014 ranged from 725 mm to 835 mm. Higher evaporation occurs in the northern portion of the lake because it experiences higher surface water temperatures, stronger surface–atmospheric vapour pressure differences and less atmospheric stability. There is less seasonality to Lake Okanagan evaporation than previously estimated, but the annual maxima in August of ~110 mm/month are substantially higher than annual minima of ~23 mm/month in April. The annual evaporation cycle follows seasonal variations in water temperatures, surface–atmospheric vapour pressure differences and atmospheric stability. Atmospheric stability is clearly important to controlling variation in the mass transfer coefficient at a variety of temporal scales. The annual cycle this creates in the mass transfer coefficient was accounted for in the development of a mass transfer model for Lake Okanagan. This model was able to predict monthly and annual evaporation to within 20 and 5% of those observed, respectively. This model was derived using data from the northern portion of the lake, which experienced 15% higher annual evaporation than southern portions, so this is something to consider when using the model for assessing the lake water budget or for management purposes. Error in the model increased substantially for daily estimates, and it is completely inappropriate to use at the hourly scale. Further model development is needed to predict evaporation at that fine frequency. The data set from this study is robust enough to do so and provides a benchmark for future evaporation process studies in British Columbia. The study period included years that were climatically typical, so the evaporation observations could represent values close to the actual mean, but this is unknown. The natural variation of, or existence of trends in, annual evaporation remains to be quantified for Lake Okanagan or other lakes in the region. The findings of this study highlight that long-term observations of the atmosphere consistently conditioned to the lake surface are required if water managers and decision makers value sound data and information on lake evaporation.
Acknowledgements
The authors wish to thank Raoul Granger for his guidance and leadership during the early stages of this project. Funds for this study were provided by Environment Canada with assistance from the Okanagan Basin Water Board. The authors wish to thank Deborah Glanville, Ian Rogalski, Jane Owen and Kendall Woo of Environment Canada for administrative support; Joe Gabrielle, Dan Abbey and Bob Rowsell for their logistical and field assistance; Shoreline Drilling for their work maintaining the buoy network; Anna Warwick-Sears, Nelson Jatel, Dave Caswell, Pat Field, James Littley and Ian Horner of the Okanagan Basin Water Board for their local leadership; and staff at Dawett Fine Indian Cuisine, the British Columbia Wine Information Centre and Burger 55. The data set used in this research is publicly available and can be accessed from the Okanagan Basin Water Board (www.obwb.ca).
References
- Austin, J. A., and S. M. Colman. 2007. Lake Superior summer water temperatures are increasing more rapidly than regional air temperatures: A positive ice–albedo feedback. Geophysical Research Letters 34: L06604. doi:10.1029/2006GL029021.
- Baldocchi, D. D., B. B. Hicks, and T. P. Meyers. 1988. Measuring biosphere–atmosphere exchanges of biologically related gases with micrometeorological methods. Ecology 69: 1331–1340.
- Bello, R. L., and J. D. Smith. 1990. The effect of weather variability on the energy balance of a lake in the Hudson Bay Lowlands, Canada. Arctic and Alpine Research 22: 97–106.
- Blanken, P. D., W. R. Rouse, A. D. Culf, C. Spence, L. D. Boudreau, J. N. Jasper, W. M. Schertzer, P. Marsh, and D. Verseghy. 2000. Eddy covariance measurements of evaporation from Great Slave Lake, Northwest Territories, Canada. Water Resources Research 36: 1069–1077.
- Blanken, P. D., C. Spence, N. Hedstrom, and J. D. Lenters. 2011. Evaporation from Lake Superior 1: Physical controls and processes. Journal of Great Lakes Research 37: 707–716.
- Dillard, J. P., and A. N. Evans. 1982. Evaporation at selected dam sites in the Pacific Northwest. Division of Power Resources: Bonneville Power Administration. 50 pp.
- Environment Canada. 2014. Climate. www.climate.weather.gc.ca (accessed October, 2014).
- Ferguson, H. L., J. C. Foweraker, P. L. Hall, E. C. Halstead, H. I. Hunter, T. A. J. Leach, E. G. Le Breton, et al. 1974. Technical supplement I to the final report on water quantity in the Okanagan Basin. Office of the Study Director, Penticton: Canada British Columbia Okanagan Basin Agreement. 553 pp.
- Granger, R. J., and N. Hedstrom. 2010. Modelling hourly rates of evaporation from small lakes. Hydrology and Earth System Science 15: 267–277.
- Gronewold, A. D., and V. Fortin. 2012. Advancing Great Lakes hydrological science through targeted binational collaborative research. Bulletin of the American Meteorological Society 93: 1921–1925.
- Horst, T. W. 1997. A simple formula for attenuation of eddy fluxes measured with first order response scalar sensors. Boundary Layer Meteorology 94: 517–520.
- Klemeš, V. 1986. Operational testing of hydrological simulation models. Hydrological Sciences Journal 31: 13–24.
- Liu, H., Q. Zhang, and G. Dowler. 2012. Environmental Controls on the surface energy budget over a large southern inland water in the United States: An analysis of one-year eddy covariance flux data. Journal of Hydrometeorology 13: 1893–1910.
- Massman, W. J. 2000. A simple method for estimating frequency response corrections for eddy covariance systems. Agricultural and Forest Meteorology 104: 185–198.
- Merritt, W. S., Y. Alila, M. Barton, B. Taylor, S. Cohen, and D. Neilsen. 2006. Hydrologic response to scenarios of climate change in sub watersheds of the Okanagan basin, British Columbia. Journal of Hydrology 326: 79–108.
- Oke, T. R. 1987. Boundary layer climates. New York: Routledge, 435 pp.
- Oswald, C. M., and W. R. Rouse. 2004. Thermal characteristics and energy balance of various-size Canadian Shield lakes in the Mackenzie River basin. Journal of Hydrometeorology 5: 129–144.
- Quinn, F. H. 1979. An improved aerodynamic evaporation technique for large lakes with application to the International Field Year for the Great Lakes. Water Resources Research 15: 935–940.
- Rayne, S., and K. Forest. 2010. Historical trends in annual water yields for the Okanagan Basin. British Columbia, Canada. Nature Proceedings. doi:10.1038/npre.2010.4946.1.
- Roulet, N. T., and M. K. Woo. 1986. Wetland and lake evaporation in the low arctic. Arctic and Alpine Research 18: 195–200.
- Rouse, W. R., P. D. Blanken, N. Bussières, A. E. Walker, C. J. Oswald, W. M. Schertzer, and C. Spence. 2008. An investigation of the thermal and energy balance regimes of Great Slave and Great Bear Lakes. Journal of Hydrometeorology 9: 1318–1333.
- Rouse, W. R., P. F. Mills, and R. B. Stewart. 1977. Evaporation in high latitudes. Water Resources Research 13: 909–914.
- Schertzer, W. M., and B. Taylor. 2009. Assessment of the capability to compute evaporation from Lake Okanagan, other mainstem lakes and basin lakes and reservoirs using the existing database. Burlington: Environment Canada. 101 pp.
- Schuepp, P. H., M. Y. Leclerc, J. I. Macpherson, and R. L. Desjardins. 1990. Footprint prediction of scalar fluxes from analytical solutions of the diffusion equation. Boundary Layer Meteorology 36: 355–373.
- Spence, C., P. D. Blanken, J. D. Lenters, and N. Hedstrom. 2013. The importance of spring and autumn atmospheric conditions for the evaporation regime of Lake Superior. Journal of Hydrometeorology 14: 1647–1658.
- Spence, C., W. R. Rouse, D. Worth, and C. Oswald. 2003. Energy budget processes of a small northern lake. Journal of Hydrometeorology 4: 694–701.
- Spring, K., and D. G. Schaefer. 1974. Mass transfer evaporation estimates for Babine Lake, British Columbia. Downsview: Environment Canada. 32 pp.
- Stewart, R., and W. Rouse. 1976. A simple method for determining the evaporation from shallow lakes and ponds. Water Resources Research 12: 623–628.
- Stockner, J. G., and T. G. Northcote. 1974. Recent limnological studies of Okalanagan Basin lakes and their contribution to comprehensive water resource planning. Journal of the Fisheries Research Board of Canada 31: 955–976.
- Tanny, J., S. Cohen, S. Assouline, F. Lange, A. Grava, D. Berger, B. Teltch, and M. B. Parlange. 2008. Evaporation from a small water reservoir: Direct measurements and estimates. Journal of Hydrology 351: 218–229.
- Trivett, N. B. A. 1984. Lake Okanagan evaporation study. Environment Canada, Canadian Climate Centre Report #84-2, Downsview, 194 pp.
- Wassenaar, L. I., P. Athanasopoulos, and M. J. Hendry. 2011. Isotope hydrology of precipitation, surface and ground waters in the Okanagan Valley, British Columbia, Canada. Journal of Hydrology 411: 37–48.
- Webb, E. K., G. I. Perman, and R. Leuning. 1980. Correction of flux measurements for density effects due to heat and water vapour transfer. Quarterly Journal of the Royal Meteorological Society 106: 85–100.
- Wiegand, R. C., E. C. Carmack, R. J. Daley, C. B. J. Gray, S. Jasper, and C. H. Pharo. 1982. Seasonal aspects of the surface and advective heat fluxes of Kootenay Lake, British Columbia. Water Resources Research 18: 1493–1502.
- Yuzyk, T., E. Stakhiv, J. P. Bruce, D. Powers, D. H. Burn, J. Boland, A. Chow, et al. 2012. Lake Superior regulation: Addressing uncertainty in Upper Great Lakes water levels. Ottawa: International Joint Commission, 214 pp.
