
Abstract
Floods events are a key component in river engineering including the design and risk assessment of various projects. In this study, a flood frequency analysis was carried out to determine flood characteristics in New Brunswick under present and future climate. For current flood characteristics, an analysis was carried out using 56 hydrometric stations across the province using the Generalized Extreme Value (GEV) distribution and the three-parameter lognormal distribution function. A regional flood frequency analysis was also carried out using regression equations. Results showed that current regional flood equations were very consistent among distribution functions. Results were also consistent with previous studies. To study floods under climate change, seven catchments were selected within the province and these catchments were further analyzed using artificial neural network (ANN) models for two climate scenarios. As such, future climate data were extracted from the third-generation Coupled Climate Model (CGCM3.1) under the greenhouse gas emission scenarios B1 and A2. The climate variables (temperature and precipitation) were downscaled using the delta change approach, and future river discharges were predicted. A frequency analysis was then carried out on these seven stations using the GEV distribution function. Results showed that for the period 2010–2100, average temperatures are projected to increase between 2.9°C (B1) and 5.2°C (A2) in New Brunswick. As for precipitation, the mean annual precipitation showed an increase of 9 to 12% compared to current conditions. Results also showed an increase in flood flows. The increase in low-return floods (e.g. 2-year) was generally higher than the increase of higher return floods (e.g. 100-year). Depending on the scenario and the future time period, the increase in low-return floods was about 30%, and about 15% for higher return floods. A Regional Climate Index (RCI) was used to links floods to their frequency under future climate scenarios.
Dans la présente étude, une analyse fréquentielle des crues a été réalisée en vue de déterminer les caractéristiques d'événements de crues au Nouveau-Brunswick. Dans le cadre de projets en ingénierie fluviale, l’étude des débits de crues constitue un élément clé, autant du point de vue de la conception que de celui de l'évaluation du risque. Dans cette étude, des analyses ont été réalisées pour 56 stations hydrométriques situées dans la province. En plus des 56 stations analysées, une analyse régionale a été entreprise. De plus, cette étude a analysé l’influence du changement climatique sur les débits de crue au Nouveau-Brunswick, en se basant sur un modèle canadien du climat et les réseaux de neurones artificiels (RNA). Les données, provenant d’une simulation de la troisième génération du modèle couplé climatique global (MCCG3.1), ont été utilisées avec les RNA multicouches pour estimer les crues dans le contexte actuel et dans le contexte climatique sous les effets des scénarios B1 et A2. La régionalisation des données (températures et précipitations) a été accomplie en utilisant la méthode des deltas. La loi GEV (Generalized Extreme Value) a été utilisée pour estimer la fréquence de ces crues. Pour la période 2010–2100, des augmentations de température de 2.9 °C (B1) à 5.2 °C (A2) sont prévues pour les sites étudiés au Nouveau-Brunswick. Quant aux précipitations, les moyennes annuelles ont montré une augmentation de 9 % à 12 % par rapport aux conditions actuelles. L'augmentation des débits de crues pour des périodes de récurrence faible (p. ex. 2 ans) était généralement plus élevée que l’augmentation des débits de crue pour des périodes de récurrence élevée (p. ex. 100 ans). En fonction du scénario et de la période, l’analyse fréquentielle des débits de crue montre une augmentation de 30 % pour les périodes de récurrence faible et 15 % pour les périodes de récurrence élevée. De plus, un indice régional de climat (RCI) a été développé pour faciliter le processus de conception. Cet indice permet de relier les crues à leurs fréquences selon les scénarios B1 et A2.
Introduction
The understanding of floods, as hydro-meteorological extreme events, plays a key role in many hydrological studies, especially in the design of hydraulics structures such as dams, culverts, bridges and others. Floods are also important in the evaluation of flood risk, particularly in areas in close proximity to flood plains. Extreme hydrological events are important not only in the design of water resource structures but also for fish habitat and in the management of fisheries resources. Many studies have addressed floods and the potential impact of climate change on floods worldwide (e.g. Kay et al. Citation2009; Whitfield Citation2012; Kundzewicz et al. Citation2013a; Kundzewicz et al. Citation2013b) as well as in a Canadian context (e.g. Cunderlik and Ouarda Citation2009; Burn et al. Citation2010; Collins et al. Citation2014). In New Brunswick, a number of studies have dealt with floods and regional flood frequency analyses as well as potential climate change impacts. For instance, Montreal Engineering Co. Ltd. (Citation1969) estimated high flows for many stations across the Maritime Provinces including New Brunswick. Acres Consulting Services Ltd. (Citation1977) undertook one of the most extensive analyses of floods within the province. It included a flood frequency analysis for each station, regional flood equations and flood risk maps for a number of communities within the province. A study by Environment Canada and New Brunswick Department of Municipal Affairs and Environment (Citation1987) served as an update for the 1977 flood study. That study depicted regional equations as well as envelope curves for the estimation of floods. More recently, Caissie and Robichaud (Citation2009) looked at many aspects of the flow regime within the Maritime Provinces including mean flow and flow duration, as well as high and low flows. Aucoin et al. (Citation2011) is a recent study in which single-station analyses as well as regional flood equations were carried out for the province of New Brunswick. In that study, both the Generalized Extreme Value (GEV) distribution function and the three-parameter lognormal distribution function (LN3) were used for the analysis. The authors also developed regional equations to estimate floods at ungauged basins and provided information for instantaneous flood design.
Most flood analyses in New Brunswick have been carried out mainly to address floods under current climatic conditions; however, flood characteristics also need to be assessed under future projected climate change. In fact, there is currently a broad scientific consensus that the global climate is changing in ways that are likely to have a significant impact on floods and flood processes over the coming decades. As such, it is important to (1) improve our ability to quantify extreme events under current and future climate, (2) assess the consequences of flood events and (3) develop adaption tools and design criteria to more accurately assess the impact of floods on fisheries and water resources. Improved knowledge and assessment tools will assist managers in formulating policies to mitigate the projected impacts of climate change and to develop adaptation strategies to deal with floods in Canada. In addition to the above studies aimed at estimating floods under historical conditions in New Brunswick, a few studies have addressed current climatic trends as well as potential climate change impacts on extreme streamflow (e.g. Turkkan et al. Citation2011; El-Jabi et al. Citation2013; Thistle and Caissie Citation2013). For instance, Thistle and Caissie (Citation2013) showed that air temperature has increased significantly over the past 50–100 years, and that this change has resulted in a shift in the timing of floods in New Brunswick (i.e. earlier flood events). El-Jabi et al. (Citation2013) addressed floods in New Brunswick under climate change using two different scenarios, namely the B1 and A2 greenhouse gas scenarios. Results from that study showed that low-return floods (e.g. 2-year) will likely experience a greater increase than will higher return floods (e.g. 100-year). Some of these results will be presented in this paper.
Notably, flood-generation processes in New Brunswick can be complex, as floods can occur as a result of rainfall, snowmelt and a combination of both (Collins et al. Citation2014). Another aspect which greatly complicates floods in Canada, as well as in New Brunswick in particular, is the presence of ice or ice jam during high-flow events (Kindervater Citation1985). Although floods under ice or ice jam conditions are important to the region, they are extremely complex in terms of their influence on water levels, and are beyond the scope of this study. The flood analyses within the present study are based on historical streamflow data (data available within the Environment Canada database, i.e. discharge under open water conditions and discharge corrected for ice conditions).
As pointed out above, many flood studies have been carried out in the past; however, no studies have compared floods in both a historical and a climate change context in New Brunswick. As such, the present study provides an overview of results from previous studies in New Brunswick, namely the study by Aucoin et al. (Citation2011) which quantified floods under current climate, and the study by El-Jabi et al. (Citation2013) which provided future climate flood estimates at selected stations across the province. The specific objectives are: (1) to report on flood frequency analysis in New Brunswick using two distribution functions, i.e. the GEV and the LN3 distributions; (2) to provide regional flood equations to estimate floods for ungauged basin; (3) to predict river discharge under current and future climate using artificial neural network (ANN) models at selected sites; and (4) to provide results on a Regional Climate Index (RCI) which quantifies change in river discharge under climate change.
Flood frequency analysis
Climate and hydrometeorology
New Brunswick lies on Canada’s Atlantic coast, and is bordered by the ocean on its southern (Bay of Fundy), northern and eastern (Gulf of St. Lawrence) shores. Average monthly temperatures in New Brunswick range from –10°C in January to 19°C in July. New Brunswick receives approximately 1100 mm of precipitation annually, with 20 to 33% falling in the form of snow. Precipitation tends to be highest in southern parts of the province, whereas the northern part of New Brunswick receives relatively higher amounts of precipitation in the form of snow due to colder winters (Caissie and Robichaud Citation2009).
Major rivers and many smaller streams flow from the interior highlands of New Brunswick. Rainfall, snowmelt and groundwater all contribute to river discharge, producing variations from season to season and year to year. Most high-flow events are caused by the spring snowmelt, at times with a combination of snowmelt and rainfall. Heavy rainfall can also cause high flows, especially for small streams during the summer and autumn periods. Low flows generally occur in late summer, when precipitation is low and evapotranspiration is still relatively high, and in late winter in the northern part of the province when precipitation is stored until spring in the form of ice and snow.
Single-station flood-frequency analysis
A flood analysis was carried out using historical data from 56 hydrometric stations, of which 53 are located in New Brunswick and three are located outside the province: two in Quebec and one in Nova Scotia (Figure a and Table ) (Aucoin et al. Citation2011). Seven of these hydrometric stations as well as seven meteorological stations were used to carry out the climate change study (Figure b). Data used were collected from the HYDAT database (Environment Canada Citation2007) and the Environment Canada website (www.ec.gc.ca/rhc-wsc/). Seven stations were also identified as regulated rivers within the Environment Canada database (see Aucoin et al. Citation2011 for details); however, the flow regulation was considered minor and most likely not affecting floods as they are mainly run-of-river hydroelectric operations. The number of years of record varies between 11 and 92 with a mean value of 39 years. The smallest drainage basin corresponds to Narrows Mountain Brook at 3.89 km2 (Station 01AL004), whereas the largest river corresponds to the Saint John River below Mactaquac 39,900 km2 (Station 01AK004) (Figure a).
Figure 1. Hydrometric and meteorological stations in New Brunswick. The (a) 56 hydrometric stations and (b) four grid boxes corresponding to New Brunswick used in climate change scenarios. Box size ~200 × 300 km; • hydrometric station;
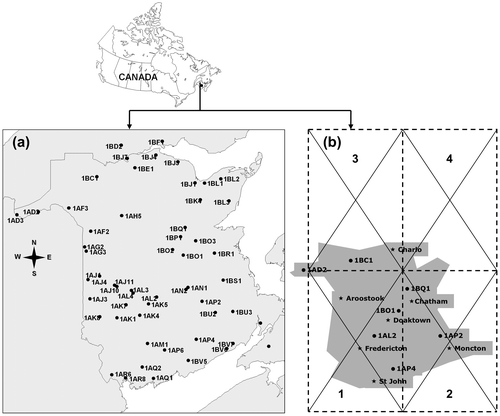
Table 1. Analysed hydrometric stations for the flood frequency analysis (from Aucoin et al. Citation2011).
A frequency analysis was carried out for each station to estimate floods of different recurrence intervals. The maximum daily discharge by year was fitted to two distributions, namely the LN3 and GEV distributions. The main motivation for considering LN3 stemmed from the fact that it was previously used to describe floods in New Brunswick (Environment Canada and New Brunswick Department of Municipal Affairs and Environment Citation1987; Caissie and Robichaud Citation2009). However, although the LN3 has been extensively used for describing floods in the past, more recently the GEV distribution has been used, due to its theoretical properties (Coles Citation2001). In fact, the extreme value theory suggests that distribution of extreme events, such as annual daily discharge maxima (under asymptotic conditions), will most likely converge in probability toward a distribution belonging to the family of GEV distributions (Coles Citation2001).
The probability density function (PDF) of the LN3 is given by:(1)
defined for λ < x < ∞; and where µ ∈ R is the shape parameter, σ > 0 is the scale parameter, and λ ∈ R is the threshold parameter. In hydrology, the cumulative distribution function (CDF) is most often used to represent flows of different recurrence intervals. For LN3, the CDF is given by:(2)
with parameters defined as in Equation (1).
For GEV, the PDF is given by:(3)
defined for 1 + ξ(x – μ′)/σ′>0; and where σ′ > 0 is the scale parameter, µ′ ∈ R is the location parameter, and ξ ∈ R is the shape parameter. The CDF for the GEV is given by the following equation:(4)
with parameters as defined in Equation (3). Note that, for simplicity, x, f(x) and F(x) are used here for both LN3 and GEV; however, they are different for each distribution.
The method of maximum likelihood was used to estimate the unknown parameters for both LN3 and GEV. More formally, let denote a vector of n observations, whose PDF is believed to be f(xi|θ), for i = 1,2,…,n, and where θ corresponds to a vector of unknown parameters. For example, θ would correspond to θ = (ξ,σ’,μ’)’ for the GEV distribution. Under the assumption that
corresponds to a realization of the random vector
, where the Xi’s are independent and identically distributed, the likelihood function can be defined as the joint probability function of the n observations conditionally on the unknown vector of parameters – that is:
(5)
The method of maximum likelihood consists in finding the value of θ for which Equation (5) is at a maximum, or, equivalently, in finding θ for which the log-likelihood function (LL) is at a maximum:(6)
This approach consists of finding the parameter values that are the most likely for the observed sample
under the chosen distribution function. Note that some optimization algorithms will only allow the search of minima. When this is the case, minimizing the negative-log-likelihood function (NLL) will be equivalent to maximizing the LL. The estimation of unknown parameters using this method requires the use of iterative procedures. In the present study, the statistical freeware R (R Development Core Team Citation2009) was used for all computations pertaining to parameter estimation.
Regional regression analysis
Characteristics of floods differ from one drainage basin to another, and the results of single-station analysis are only applicable to the specific gauged streams or those streams near hydrometric stations. As many water resource projects are undertaken for ungauged basins, there is a requirement for the development of regional equations.
The main idea behind regional regression analysis is to establish a relationship between floods and physiographic parameters describing the basin. With discharge as the dependent variable and the physiographic factors as independent variable(s) (in this case the area of the drainage basin and precipitation to keep the equations simple), linear regressions (using log-transformed data) of the following types were used in the present study to estimate the parameters:(7a)
which can then be expressed as:(7b)
with a = exp(a’):(8a)
which can then be expressed as:(8b)
where a = exp(a’), b1, and b2 are regression parameters; DA and MAP are used in reference to the “drainage area” (in km2) and the “mean annual precipitation” (in mm), respectively; and QT denotes the T-year flood (in m3/s). It should be noted that no difference will be made between regression parameters, their estimators and their estimated values, such that the lower-case a, b1 and b2 shall be used interchangeably to refer to any of those quantities.
Flood projections under climate change
The present study also analyzed the projected climate change impacts on the discharge regimes of seven catchments in New Brunswick. The hydrological response for given climate scenarios was simulated using ANN models (El-Jabi et al. Citation2013). Future climate data were extracted from the Canadian Coupled General Climate Model (CGCM) under different greenhouse gas emission scenarios defined by the Intergovernmental Panel on Climate Change (IPCC) (e.g. Alcamo et al., Citation1995; Nakicenovic et al. Citation2000; IPCC Citation2007, Citation2013). Using an ANN model, future river discharge was predicted for selected hydrometric stations.
Climate change study
General Circulation Models (GCMs) are based on mathematical representations of atmosphere, ocean, ice caps and land surface processes. These models are used for simulating the response of the global climate system to increasing “greenhouse gas” concentrations. Historically, gross carbon dioxide (CO2) emissions have increased at an average rate of 1.7% per year since 1900 (Nakicenovic et al. Citation1996), and if this trend continues, global emissions would increase more than six-fold by 2100. Different scenarios have been presented by the IPCC (Nakicenovic et al. Citation2000; Houghton et al. Citation2001; IPCC Citation2007, Citation2013) which reflect a variety of CO2 concentrations over the next 100 years. While the complexity of the global climate system is well captured by these models, they are unable to represent local-scale features and processes due to their limited spatial resolution. Large geographic areas (e.g. 50,000 to 300,000 km2) represent the basic unit of GCMs. In the present study, the Canadian Global Coupled Model CGCM 3.1/T63, from the Canadian Centre for Climate Modeling and Analysis (CCCma), was used. This model has a geographic areas represented by a grid of approximately 2.81° latitude by 2.81° longitude (~60,000 km2) (Figure b). In New Brunswick, a few grid points cover the entire province. As such, to predict climate at local and regional scales rather than focusing on large or global-scale changes, the delta change downscaling approach was use in the present study (Prudhomme et al. Citation2002). The time-slice simulations follow the IPCC “observed 20th century” 20C3M scenario for the years 1970–1999, and the Special Report on Emission Scenarios (SRES) B1 and A2 for the years 2010–2100 (Nakicenovic et al. Citation2000). It is acknowledged that some studies have used multitude GCM results (an ensemble approach) to have a better range of potential conditions/variability; however, to keep the analysis simple, only one Canadian model (CGCM3) was chosen for this particular analysis.
In order to predict future flood discharge in New Brunswick, daily maximum and minimum air temperature and total precipitation data from seven meteorological stations and daily discharges from seven hydrometric stations in New Brunswick were used (Figure b and Tables and ). Table shows the meteorological station which was used to represent conditions at each hydrometric station, which was based on the proximity of both stations.
Table 2. Meteorological stations (from El-Jabi et al. Citation2013).
Table 3. Hydrometric stations (from El-Jabi et al. Citation2013).
Simulated data
Simulated monthly maximum and minimum air temperatures and total precipitation for the period 1970–2100 were obtained from the CCCma. The atmosphere model output was provided on a 128 × 64 Gaussian grid. Figure b shows the sub-region of four tiles corresponding to New Brunswick. An inverse distance weighting (IDW) method was used to compute local climate data corresponding to each meteorological site based on data from the CCCma model. The interpolated data were then downscaled using the delta change approach (Prudhomme et al. Citation2002; Turkkan et al. Citation2011). This approach to downscaling data from GCMs for hydrological modeling is one of the simpler statistical downscaling techniques and is widely used; however, it may result in greater uncertainties as pointed out in some studies (Kay et al. Citation2009; Prudhomme and Davies Citation2009). Nevertheless, Fowler and Kilsby (Citation2007) noted that, if reproducing the mean characteristics are the main objectives (in our case the mean monthly flow), then simple statistical downscaling methods can perform as well as more sophisticated approaches. Changes in mean climate are applied as follows:
Temperatures:(9)
Precipitation:(10)
where T and P are mean monthly temperatures and precipitations, respectively. Tdelta is the difference between the GCM simulated mean temperature (from the future time period) and the historical mean temperature. Pfact is the ratio of the GCM-simulated mean precipitation from the future time period relative to the historical period.
Flood modelling using artificial neural networks
The average monthly discharges under climate change were simulated first using the ANN, and then maximum daily discharges (e.g. floods) were predicted using a regression model based on historical events (relating daily maximum to monthly mean). This was done for the period 1970 to 1999. ANN approaches have been successfully used in water resources in a wide variety of applications (Govindaraju Citation2000a, Citation2000b). Applications in river flow and groundwater level forecasting as well as sediment estimation are a few examples. Also, predicting the conductivity and acidity of streams are some of the time series successfully modeled using this technique (Bastarache et al. Citation1997).
The following ANN model was used to predict mean monthly discharge, Qave:(11)
where month is the month of year (1,2,..12), T is the air temperature (min or max) and P is the precipitation. The model is characterized by:
| • | Learning algorithm: back-propagation with the Levenberg–Marquard method and early stopping; | ||||
| • | Training and three-fold cross validation data: 85% of data; | ||||
| • | Testing data: 15% of data; | ||||
| • | Hidden layer: 8 to 12 neurons. | ||||
It was observed that the daily maximum discharges were better predicted using a logarithmic function, i.e. vs.
regression model from the historic data. Therefore, monthly discharges,
, were simulated first using the ANN model. Then regression equations were used to predict maximum daily flows
for each month (12 values, one for each month) using the above predicted
. From this time series, the annual maximum discharge was determined. A flood-frequency analysis was thereafter performed on the annual maximum discharge of the seven selected stations.
Results
Flood-frequency analysis
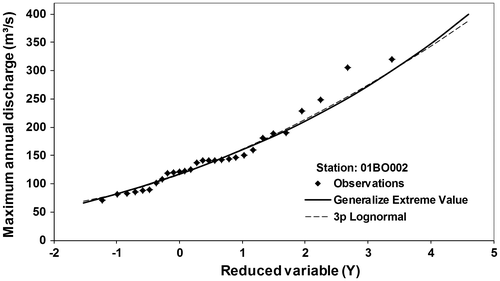
Detailed results of all single-station analyses were presented in Aucoin et al. (Citation2011); therefore, only highlights of this analysis are presented here. The single-station analysis revealed that in most cases, both the LN3 and GEV distributions fitted well the floods in New Brunswick (Figure ). Both distributions fitted equally well the flood observations for the Renous River (01BO002), and flood estimates were very similar.
Figure 2. Flood frequency analysis for Renous River (NB), station 01BO002.
When comparing the performance of both distributions for all stations using the Anderson–Darling (AD) statistic (Anderson and Darling Citation1952), results show that the GEV slightly outperformed the LN3 (Aucoin et al. Citation2011). Following the single-station analysis, a regional flood study was carried out to estimate flooding based on drainage area and both drainage area and precipitation. Parameters for both regression models shown in Equations (7) and (8) were calculated using the statistical freeware R (R Development Core Team Citation2009). However, in order to fit the regression, QT, DA and MAP must first be transformed to the natural logarithmic scale. Once the variables were log transformed, the model was fitted to a linear regression and parameters were obtained. Table presents the parameters of the regression equations for different recurrence intervals. Thistle and Caissie (Citation2013) showed that although air temperature has increased significantly over the past 50–100 years, very few trends were detected in flood magnitudes, which implies that flood data can still be analyzed as stationary time series.
Table 4. Regional regression equations and R2 Generalized Extreme Value (GEV) (from Aucoin et al. Citation2011).
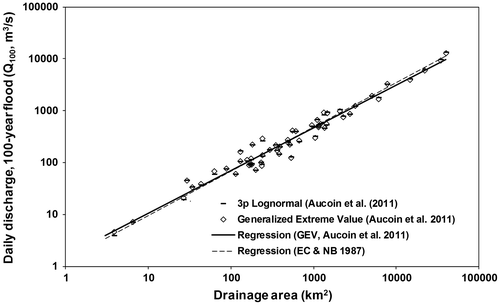
Table shows that between 96.4% (100-year; DA) and 99.0% (2-year; DA and MAP) of the variability is explained by the regional flood model when drainage area and the mean annual precipitation were used. When considering drainage area alone, over 96% of the variability was explained. Precipitation only provided a slight improvement to the fit. Figure shows a comparison of the single-station flood estimates for both LN3 and the GEV model for the 100-year recurrence interval, where both models showed very similar results. The regression equation for the LN3 was not presented in this figure because it was almost identical to the GEV regional equation. However, the regional flood equations from both Aucoin et al. (Citation2011) and the 1987 flood study in New Brunswick (Environment Canada and New Brunswick Department of Municipal Affairs and Environment Citation1987) are presented for comparative purposes. The results show that adding over more than 20 years of data does not significantly change the regional flood equations in New Brunswick. Nevertheless, having more data would most likely have contributed to more accurate flood estimates.
Figure 3. Estimated 100-year flood (daily discharge) as a function of drainage area (km2) for all 56 hydrometric stations (Generalized Extreme Value (GEV) and Lognormal type 3 (LN3)). Regional regression line for both the present study and the EC & NB study (Citation1987) are presented.
Flood projection under climate change in New Brunswick
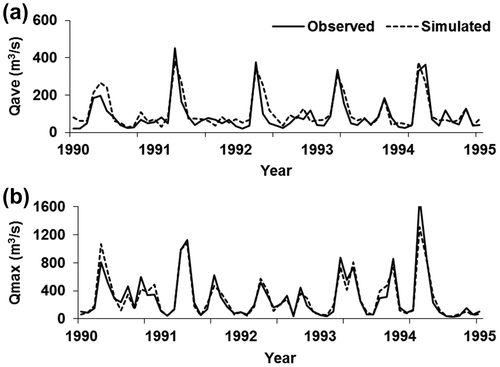
As mentioned previously, the monthly discharge under climate change was simulated first using the ANN, and then daily maximum discharge for each month (i.e. flood characteristics) was predicted using a regression model based on historical data. For instance, the associated frequency of extreme events is very important in design and these frequencies are expected to change under a future climate. During the historical calibration period, the performance of ANN had a coefficient of determination, R2, ranging between 0.69 and 0.79 in the prediction of mean monthly flows. High flow predictions showed R2 in the range of 0.85 and 0.92 (Turkkan et al. Citation2011). Figure shows the typical fit of the ANN model (simulated) to observed data for the Southwest Miramichi River between 1990 and 1995 (i.e. under historical conditions). The calibrated ANN model was then used with future climate forcing (air temperature and precipitation) to estimate discharge in the future.
Figure 4. Observed and simulated monthly discharges for SW Miramichi River: (a) mean discharge; (b) maximum discharge.
Climate change impact
In terms of mean air temperature, the current air temperature in New Brunswick is projected to increase by 1.2°C (2010–2039), 2.2°C (2040–2069) and 2.9°C (2070–2099) under scenario B1, and 1.4°C (2010–2039), 3.2°C (2040–2069) and 5.2°C (2070–2099) under scenario A2 (data from the climate model). As for precipitation, the mean annual precipitation is projected to increase significantly compared to current climate conditions. In general, the mean annual precipitation is expected to increase by 2–7% under the B1 scenarios and by 5–15% under the A2 scenario for the province of New Brunswick (El-Jabi et al. Citation2013).
Based on climate forcing, future monthly discharge events were computed using the ANN model. Then the maximum monthly flow for each year was identified and the maximum daily flow for the month was calculated based on the historical relationship (Qmax vs. Qave; station specific). These future annual maximum flows were then fitted to a GEV distribution for each of the seven hydrometric stations. Once the flood estimates were calculated for each of the seven stations, then a regional approach was used to estimate floods in New Brunswick. To accomplish this, an RCI was used by averaging the ratio of future flows over historical flow values for the seven stations (El-Jabi et al. Citation2013). This approach was used to provide a broader perspective for potential change, rather than being site specific. The RCI can be expressed as follows:(12)
where is the flood at a site x (x = 1 to 7), for each time slice ts (2010–2039, 2040–2069 and 2070–2099), under scenario sc (B1 or A2), and for different return periods (T).
is the present time (historical) flood at the same site x. In other words, an RCI was calculated by averaging floods ratios (future/historic) for the seven stations for each time slice, each scenario and for different return periods (between T = 2 and T = 100 years).
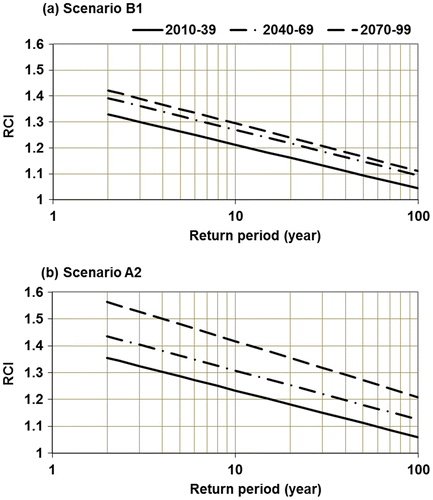
Regression equations were then calculated between RCI values and the different return periods. Figure shows the RCI as a function of the return period, for both scenarios B1 and A2 and for the different time periods. In all cases, the coefficient of determination, R2, was about 0.99. From Figure , it can be observed than future floods will most likely be higher than current floods by 30–40% (B1) or 35–55% (A2) for 2-year floods. Higher return floods (e.g. 100-year) are also expected to increase, but at a slower rate. For example, 100-year floods are projected to increase by 5–12% (B1) or 8–21% (A2). The higher increase in low-return floods could be related to the fact that the winter flow regime will increase in the future, as the air temperature will be higher during the winter months (potentially less snow and more rain-on-snow events).
Figure 5. New Brunswick regional climate index (RCI) curves for floods at time slices 2010–2039, 2040–2069, 2070–2099 under (a) scenario B1; (b) scenario A2 (adapted from El-Jabi et al. Citation2013).
Discussion and conclusions
The present study showed that the results of current flood frequency analyses are very consistent with regional flood analysis carried out during the 1980s. The GEV model seems to have provided an overall good fit of flood estimates and is very comparable to the previously used three-parameter lognormal distribution. Regional flood estimates using the above two distributions provided almost identical results, which were also very comparable to those from the 1987 flood study in New Brunswick (Environment Canada and New Brunswick Department of Municipal Affairs and Environment Citation1987) (see Figure ). Climate change is expected to alter global temperature and precipitation patterns, exerting significant pressures on water resources. In New Brunswick, climate change will undoubtedly modify flood magnitude and timing. There is already good evidence that the timing of floods is occurring earlier in New Brunswick than in the past (Thistle and Caissie Citation2013). For instance, Thistle and Caissie (Citation2013) showed that the spring flood is generally occurring earlier, at the rate of ~3 days per decade for the period 1950–2009. The frequency and timing of future events will ultimately impact on infrastructure design and development, flood management and hydraulic structures as well as current statistics used by the insurance industry. Studies have shown that changes in temperature and precipitation have resulted in changing hydrologic regimes in many parts of the world (Miller et al. Citation2003, Assani et al. Citation2012). Future climate is also expected to result in further changes, as reported in Whitfield et al. (Citation2003) and Ryu et al. (Citation2011). Trends in hydrologic time series have not always been clear within the literature when it comes to changes in magnitude (mean flow, floods and low flows); however, there has been more evidence of a timing shift (e.g. Thistle and Caissie Citation2013), especially for snowmelt-dominated rivers (Nohara et al. Citation2006). Increases in annual and seasonal precipitation may increase the magnitude and frequency of flooding, particularly if the frequency of extreme precipitation events also increases, as predicted by the IPCC (IPCC Citation2007, Citation2013). The present study used an ANN model to simulate future monthly discharge where regression equations were used to link daily maximum discharge to monthly discharge. Results showed flooding would mostly likely increase in the future, with the greatest increase in low-return floods (e.g. 2-year floods). In fact, low-return floods could increase by as much as 40–50%, whereas high-return floods (e.g. 100-year floods) are expected to increase at a slow rate. For instance, the 100-year floods are expected to increase between 5 and 10% under a B1 climate-change scenario, whereas the increase would be between 5 and 20% under the A2 scenario. More frequent and intense floods can increase infrastructure damage, and cause soil erosion, crop damage and other things. As pointed out previously, floods in New Brunswick are also impacted by ice and ice jam conditions (not considered within the present study). As such, the potential impact of climate change on ice conditions will also need to be considered in order to effectively predict future flooding impacts within the province.
Acknowledgements
This study was funded by the New Brunswick Environmental Trust Fund. The authors remain thankful to M. Darryl Pupek and his team at the Department of Environment New Brunswick, for their helpful comments.
References
- Acres Consulting Services Ltd. 1977. Regional flood frequency analysis, Canada. New Brunswick Flood Damage Reduction Program. Technical Report. Fredericton, NB.
- Alcamo, J., A. Bouwman, J. Edmonds, A. Grübler, T. Morita, and A. Sugandhy. 1995. An evaluation of the IPCC IS92 emission scenarios. In Climate change 1994, radiative forcing of climate change and an evaluation of the IPCC IS92 emission scenarios, ed. J. T. Houghton, L. G. Meira Filho, J. Bruce, Hoesung Lee, B. A. Callander, E. Haites, N. Harris and K. Maskell, 233–304. Cambridge: Cambridge University Press.
- Anderson, T. W., and D. A. Darling. 1952. Asymptotic theory of certain “goodness of fit” criteria based on stochastic process. Annals of Mathematical Statistics 23(2): 193–212.
- Assani, A. A., R. Landry, and M. Laurencelle. 2012. Comparison of interannual variability modes and trends of seasonal precipitation and streamflow in southern Quebec (Canada). River Research and Applications 28(10): 1740–1752.
- Aucoin, F., D. Caissie, N. El-Jabi, and N. Turkkan. 2011. Flood frequency analyses for New Brunswick rivers. Canadian Technical Report of Fisheries and Aquatic Sciences 2920. Moncton, NB: Fisheries and Oceans Canada, x + 77 pp.
- Bastarache, D., N. El-jabi, N. Turkkan, and T. A. Clair. 1997. Predicting conductivity and acidity for two small streams using learning networks. Canadian Journal of Civil Engineering 24: 1030–1039.
- Burn, D. H., M. Sharif, and K. Zhang. 2010. Detection of trends in hydrological extremes for Canadian watersheds. Hydrological Processes 24: 1781–1790.
- Caissie, D., and S. Robichaud. 2009. Towards a better understanding of the natural flow regimes and streamflow characteristics of rivers of the Maritime Provinces. Canadian Technical Report of Fisheries and Aquatic Sciences 2843. Moncton, NB: Fisheries and Oceans Canada, viii + 53 pp.
- Coles, S. 2001. An introduction to statistical modeling of extreme value. London: Springer, 224 pp.
- Collins, M. J., J. P. Kirk, J. Pettit, A. T. DeGaetano, M. S. McCown, T. C. Peterson, T. N. Means, and X. Zhang. 2014. Annual floods in New England (SA) and Atlantic Canada: Synoptic climatology and generating mechanisms. Physical Geography 35(3): 195–219.
- Cunderlik, J. M., and T. B. M. J. Ouarda. 2009. Trends in the timing and magnitude of floods in Canada. Journal of Hydrology 375: 471–480.
- El-Jabi, N., N. Turkkan, and D. Caissie. 2013. Regional climate index for floods and droughts using Canadian climate model (CGCM3.1). American Journal of Climate Change 2: 106–115.
- Environment Canada. 2007. HYDAT 2005 CD-ROM. Windows Version 2.04 released June 2007. Ottawa, ON: Water Survey of Canada, Meteorological Service of Canada.
- Environment Canada, and New Brunswick Department of Municipal Affairs and Environment. 1987. Flood frequency analyses, New Brunswick, A guide to the estimation of flood flows for New Brunswick rivers and streams. April 1987, Government of New Brunswick, Fredericton, NB, Canada, 49 pp.
- Fowler, H., and C. Kilsby. 2007. Using regional climate model data to simulate historical and future river flows in northwest England. Climatic Change 80(3): 337–367.
- Govindaraju, R. S. 2000a. Artificial neural networks in hydrology. I: Preliminary concepts. Journal of Hydrologic Engineering 5(2): 115–123.
- Govindaraju, R. S. 2000b. Artificial neural networks in hydrology. II: Hydrologic application. Journal of Hydrologic Engineering 5(2): 124–137.
- Houghton, T. J., D. Ding, J. Griggs, M. Noguer, P. J. van der Linden, and D. Xiaosu. 2001. Climate change 2001: The scientific basis, Contribution of Working Group I to the Third Assessment Report of the Intergovernmental Panel on Climate Change (IPCC). Cambridge: Cambridge University Press.
- Intergovernmental Panel on Climate Change (IPCC). 2007. Climate change 2007: The physical basis. Contribution of Working Group I to the Fourth Assessment Report of the Intergovernmental Panel on Climate Change. ed. S. Solomon, D. Qin, M. Manning, Z. Chen, M. Marquis, K. B. Averyt, M. Tignor, M., and H. L. Miller, Cambridge, UK and New York, USA: Cambridge University Press, 996 pp.
- Intergovernmental Panel on Climate Change (IPCC). 2013. Climate change 2013: The physical science basis. Contribution of Working Group I to the Fifth Assessment Report of the Intergovernmental Panel on Climate Change. ed. T. F. Stocker, D. Qin, G.-K. Plattner, M. Tignor, S. K. Allen, J. Boschung, A. Nauels, Y. Xia, V. Bex, and P. M. Midgley. Cambridge, UK and New York, USA: Cambridge University Press, 1535 pp. doi:10.1017/CBO9781107415324.
- Kay, A. L., H. N. Davies, V. A. Bell, and R. G. Jones. 2009. Comparison of uncertainty sources for climate change impacts: Flood frequency in England. Climatic Change 92: 41–63.
- Kindervater, A. D. 1985. Flooding events in New Brunswick: A historical perspective. Dartmouth, NS: Water Planning and Management Branch, Inland Waters Directorate (Atlantic Region), Environment Canada.
- Kundzewicz, Z. W., S. Kanae, S. I. Seneviratne, J. Handmer, N. Nicholls, P. Peduzzi, et al. 2013a. Flood risk and climate change: Global and regional perspectives. Hydrological Sciences Journal 59: 1–28.
- Kundzewicz, Z. W., I. Pińskwar, and G. R. Brakenridge. 2013b. Large floods in Europe, 1985–2009. Hydrological Sciences Journal 58: 1–7.
- Miller, N. L., K. E. Bashford, and E. Strem. 2003. Potential impacts of climate change on California hydrology. Journal of the American Water Resources Association 39(4): 771–784.
- Montreal Engineering Company Ltd. 1969. Maritime Provinces water resources study – Stage 1, Appendix XI, Surface water resources. Prepared for the Atlantic Development Board. Montréal, QC.
- Nakicenovic, N., J. Alcamo, G. Davis, B. de Vries, J. Fenhann, S. Gaffin et al. 2000. Emissions scenarios. Cambridge, UK: Cambridge University Press, 570 pp.
- Nakicenovic, N., A. Grubler, H. Ishitani, T. Johansson, G. Marland, J. R. Moreira and H.-H. Rogner. 1996. Energy primer in climate change 1995. Impacts, adaptations and mitigation of climate change: Scientific analysis. Cambridge, UK: Cambridge University Press.
- Nohara, D., A. Kitoh, M. Hosaka, and T. Oki. 2006. Impact of climate change on river discharge projected by multimodel ensemble. Journal of Hydrometeorology 7: 1076–1089.
- Prudhomme, C., and H. Davies. 2009. Assessing uncertainties in climate change impact analyses on the river flow regimes in the UK. Part 2: future climate. Climate Change 93: 197–222.
- Prudhomme, C., N. Reynard, and S. Crooks. 2002. Downscaling from global climate models for flood frequency analysis: Where are we now? Hydrological Processes 16: 1137–1150.
- R Development Core Team. 2009. R: A language and environment for statistical computing. R Foundation for Statistical Computing. Vienna, Austria: R Development Core Team.
- Ryu, J. H., J. H. Lee, S. Jeong, S. K. Park, and K. Han. 2011. The impacts of climate change on local hydrology and low flow frequency in the Geum River Basin, Korea. Hydrological Processes 25: 3437–3447.
- Thistle, M. E., and D. Caissie. 2013. Trends in air temperature, total precipitation, and streamflow characteristics in eastern Canada. Canadian Technical Report of Fisheries and Aquatic Sciences 3018. Moncton, NB: Fisheries and Oceans Canada, xi + 97 pp.
- Turkkan, N., N. El-Jabi, and D. Caissie. 2011. Floods and droughts under different climate change scenarios in New Brunswick. Canadian Technical Report of Fisheries and Aquatic Sciences 2928. Moncton, NB: Fisheries and Oceans Canada, xii + 55 pp.
- Whitfield, P. H. 2012. Floods in future climates: A review. Journal of Flood Risk Management 5: 336–365.
- Whitfield, P. H., J. Y. Wang, and A. J. Cannon. 2003. Modelling future streamflow extremes – floods and low flows in Georgia basin, British Columbia. Canadian Water Resources Journal 28(4): 633–656.