
Abstract
This paper provides an overview of the key processes that generate floods in Canada, and a context for the other papers in this special issue – papers that provide detailed examinations of specific floods and flood-generating processes. The historical context of flooding in Canada is outlined, followed by a summary of regional aspects of floods in Canada and descriptions of the processes that generate floods in these regions, including floods generated by snowmelt, rain-on-snow and rainfall. Some flood processes that are particularly relevant, or which have been less well studied in Canada, are described: groundwater, storm surges, ice-jams and urban flooding. The issue of climate change-related trends in floods in Canada is examined, and suggested research needs regarding flood-generating processes are identified.
Cet article dresse un portrait des principaux processus essentiels à la génération des crues au Canada et conséquemment, donne le ton pour les autres articles inclus dans ce numéro spécial, dans lesquels on traite d’événements spécifiques et des processus qui en font la genèse. Le contexte historique des crues au Canada est résumé sous forme régionale, avec une description des processus spécifiques à chaque région, qui incluent entre autre les crues nivales, celles causées par des précipitations liquides sur couvert de neige et les crues pluviales. Certains processus jugés particulièrement pertinents ou qui ont été moins étudiés au Canada sont décrits : eau souterraine, surcotes associées aux tempêtes, embâcles de glace et les crues en milieu urbain. La problématique des changements climatiques au Canada est aussi examinée et des pistes de recherche liée aux processus causant les crues sont identifiées.
Introduction
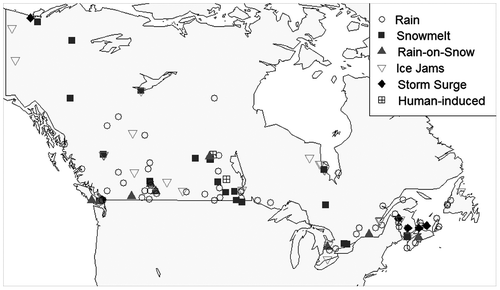
Flooding, the inundation of normally dry areas with water, is the most common and costliest natural disaster for Canadians (Sandink et al. Citation2010), and can be generated by a range of processes. These include snowmelt runoff, “flash flooding” due to intense rainfall, ice jams that develop during ice formation or breakup, failure of natural dams, and coastal flooding from storm surges, hurricanes and tsunamis (Figure ). Flooding may also be induced by human activity, including flooding caused by urban development and by failure or abnormal operation of engineered flood-management structures such as dams and levees.
Figure 1. Flood disasters in Canada by type between 1990 and 2013.
Flooding can occur at almost any time of the year somewhere in Canada; however, the relative significance of a specific flood-generating process may vary markedly throughout the year. Thus, snowmelt-driven floods are more frequent in spring and early summer and ice jams are associated with spring breakup of river ice cover, while flash floods generated by intense rainfalls happen in summer when atmospheric convection is more common.
The spatial ubiquity of flood-generating processes also varies for the particular process and size of drainage basin being considered. Much of Canada is seasonally snow covered, and these regions experience snowmelt-generated floods often supplemented by rain-on-snow events. Such floods are often the maxima in large drainage basins, when the entire basin may contribute water to the outlet. Similarly, floods can be generated across most of the country by rainstorms with large depths and/or intensities (Figure ). Thus, convective and frontal systems can generate large short-duration rainfall intensities (Alila Citation2000) which can occur in all regions (Table ). Nevertheless, the significance of such storms to flood generation varies across the country, with the greatest depths and intensities for short-duration events in southern parts of Canada and the smallest in the Arctic. These short-duration events are often responsible for flood generation in relatively small drainage basins, given the greater chance of high-intensity rainfall occurring over the entire basin (Watt et al. Citation1989). Rainfall-driven floods in larger basins are usually associated with long-duration storms which tend to have greater areal coverage (Dingman Citation2002). Such events occur across southern Canada (Table ), although the generating mechanisms may differ. In eastern Canada (east of 83° longitude; Watt et al. Citation1989) these floods may be linked to hurricane remnants (Milrad et al. Citation2009; Watt and Marsalek Citation2013). Long-duration rainfalls in western Canada may be associated with bands of concentrated near-surface water vapour over the Pacific Ocean (atmospheric rivers referred to popularly as the “Pineapple Express”, PE) which can generate intense storms of orographically enhanced precipitation (P) in coastal mountain regions (Roberge et al. Citation2009; Dettinger Citation2011; Spry et al. Citation2014), or mesoscale systems in inland regions such as the Mackenzie River basin (Smirnov and Moore Citation2001) or over Alberta (Milrad et al. Citation2015).
Table 1. Mean annual extreme rainfall depth and hourly intensity for various durations for locations in regions of Canada, as denoted by the maximum isohyet shown in Hogg and Carr (Citation1985). Depths and intensities are given for locations with secondary maxima within a given region if present.
While snowmelt- and rainfall-driven floods can occur across Canada (Figure ), other particular forms of flooding are more geographically restricted. These include geomorphically generated floods in high-relief areas of western Canada, and storm surges on the Atlantic, Pacific and Arctic coasts as well as on major inland water bodies such as the Great Lakes. Similarly, flooding associated with the overwhelming of storm sewer networks is confined to urban areas, while flooding induced by rising groundwater tables may manifest itself in permeable alluvial floodplains along large streams and rivers.
This paper provides an overview of the key processes that generate floods in Canada. An exhaustive review of flood-generation processes and their relative significance across the country is beyond the scope of this paper; instead, the intent is to provide a broader context for the detailed examinations of specific floods and flood-generating processes that are given in the individual papers in this special issue. The paper begins with an outline of the historical context of flooding in Canada, followed by a summary of regional aspects of floods in Canada and a description of the processes that drive floods in these regions. Flood processes that are particularly relevant or which have received relatively little attention to date in Canada are discussed. Climate-related trends in floods are summarized, and the paper concludes with suggested research needs regarding flood-generating processes in Canada.
Historical context of flooding in Canada
Flooding is a costly natural disaster for Canadians (Sandink et al. Citation2010), claiming the lives of more than 200 people and causing over CAD $2 billion in damage during the twentieth century (Jakob and Church Citation2011). This value is conservative, given the ~CAD $1 billion in damage from the 1996 Saguenay flood alone (Leclerc and Secretan Citation2016). Figure combines flooding information from the Canadian Disaster Database (CDD; Public Safety Canada Citation2014) and Brooks et al. (Citation2001) to summarize the number of events, deaths and evacuations, and damages resulting from floods that caused reportable damage and/or loss of life from 1900 to 2010 with estimates for the years following. Damage estimates from the CDD (based on federal, provincial, insurance and non-governmental organization payments, and municipal and other government department costs) were used; damages are expressed in 2010 Canadian dollars and were adjusted by the Consumer Price Index (CPI; as reported in Public Safety Canada Citation2014).
Figure 2. Floods in Canada identified by Brooks et al. (Citation2001) and the Canadian Disaster Database, CDD (Public Safety Canada Citation2014). The CDD does not contain all floods but only those considered significant because of financial transfers. Adjusted costs are based on 2010 Canadian dollars and were adjusted for the Canadian Consumer Price Index.
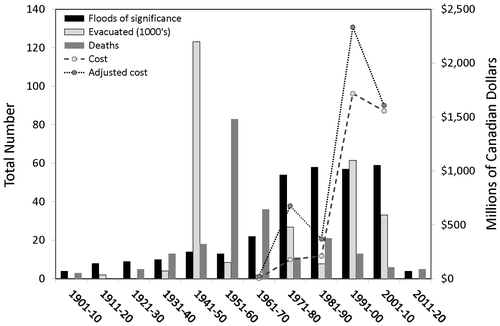
There are several deficiencies in using these sources to construct a flood record for Canada. Not all events in Brooks et al. (Citation2001) appear in the CDD and vice versa, suggesting that neither provides a comprehensive listing of major floods in Canada. Both sources sometimes list multiple floods as single events, and some major floods have been categorized as another hydroclimatic event type (e.g. the CDD categorized the Hurricane Hazel flood as a hurricane). The CDD provides little or no description of some floods, and no indication of information sources used to populate the database. This complicates attribution of the flood mechanism to particular flood events, such as is attempted in Figure . Events in the CDD were only considered to 2010 due to the absence of a formal updating process (Lara Deacon, Public Safety Canada, pers. comm. 2014) that would have included floods such as the 2011 Assiniboine River flood (Blais, Clark et al. Citation2016, this issue; Blais, Greshuk et al. Citation2016, this issue) and the 2013 Bow River Flood (Pomeroy et al. Citation2016, this issue) in the CDD.
Despite these caveats, several observations can be made. The first is that the number of significant floods, where damages were high enough to be reported in the CDD, was low before 1950 and has been relatively stable in recent decades, averaging five or six events per year since the 1970s. Deaths associated with floods were greatest in 1951–1960, reflecting the impact of Hurricane Hazel on southern Ontario (ON); fatalities have been generally fewer since the 1950s. The number of people requiring evacuation is quite varied, the maximum being in the 1941–1950 period associated with floods in Manitoba (MB) and British Columbia (BC). Costs and adjusted costs of flood events exceeded CAD $1 billion in the 1990s (all dollar values correspond to the year in which they were reported) and continue to rise, consistent with an upward trend since the 1960s. Floods in 2011–2013 continue the pattern of increasing costs. One interpretation would be that Canadian society has taken steps to reduce the number of lives lost during flood events but is accepting growing financial cost in response to the rising frequency of events.
Many authors have provided classifications of flood processes (Watt et al. Citation1989; Caissie and El-Jabi Citation1993; Pietroniro et al. Citation2004; Peters et al. Citation2006; Whitfield Citation2012). Table provides a typology of flood-generating processes, including meteorological, hydrological, geomorphic and human induced. Specific generating mechanisms are summarized, and reference made to case studies in this special issue. The different flood-inundation mechanisms are summarized in Table , which lists conditions that modify the magnitude of floods as well as risk modifiers. Risk modifiers are aspects of the physical or social setting that either increase or decrease exposure to flood damage; flood preparations such as dykes or levees reduce exposure while development within the floodplain increases risk.
Table 2. A typology of floods, based upon two levels of flood generating processes, after Whitfield (Citation2012). The final column indicates event case studies detailing events that have occurred since 1995.
Table 3. Flood-generating processes, inundation types and modifying conditions and risks. The flood-generating processes are described in more detail in Table 1. Many of these factors exhibit seasonal variation.
Table 4. Major drainage basins in Canada.
Floods within the Maritime Provinces, Newfoundland and Labrador
The Maritime Provinces comprise New Brunswick (NB), Nova Scotia (NS) and Prince Edward Island (PEI). Highland areas (e.g. Central Highlands of NB and Cape Breton NS) are largely granite and metamorphic rock, while sedimentary rocks underlie lowland areas (e.g. NB’s eastern lowlands, all of PEI and the NS lowland from Annapolis to Sydney). Most drainage basins have extensive forest cover: boreal forest occurs mainly in Cape Breton and northern NB whereas the Acadian Forest occupies much of the southern part of the Maritime Provinces.
Newfoundland and Labrador (NL) can be subdivided into the Island and Labrador. Labrador’s bedrock geology is dominated by metamorphic rocks of the Precambrian Shield, while Newfoundland consists of sedimentary, metamorphic and volcanic rocks associated with the Appalachian orogen plus intrusive rocks (largely granite). Vegetation ranges from tundra in northern Labrador to mixed deciduous/coniferous forests in southwestern Newfoundland, with extensive peatlands mantling interior plateaus and coastal lowlands of the Island.
The region’s climate is relatively wet and cool, especially along the coast. Nevertheless, summer temperature can exceed 30°C, particularly in central NB, while mean annual air temperature varies between 3°C in northern NB to 7°C in southwestern NS. Annual P is relatively homogenous throughout NB and PEI at ~1200 mm, with slightly higher amounts (~1400 mm) in southern NB on the Bay of Fundy. NS typically receives slightly higher annual P than NB and PEI (~1400–1500 mm), with the greatest amount in Cape Breton. The regional air temperature gradient means southern areas (e.g. southwest NS, 16% of annual P as snow) typically have less snow than northern NB does (35% of annual P as snow). Snowfall amount and accumulation have significant impacts on flood magnitude and timing, and on flood-generation processes in the Maritime Provinces. Northern Labrador has an arctic climate with a mean annual temperature of −1°C and mean annual P of ~750 mm (about 50% as snow). Mean annual temperature decreases to −3°C in western Labrador, accompanied by an increase in mean annual P to ~950 mm. Mean annual temperature in Newfoundland increases from 1°C on the Northern Peninsula to 5°C on the Avalon and Burin Peninsulas, while mean annual P on the Island ranges from 1000 to almost 2000 mm, with the greatest amounts along the south coast and the Avalon Peninsula, and over the Long Range Mountains on the west coast. The greatest snowfall in Newfoundland occurs on the western mountains and the east coast.
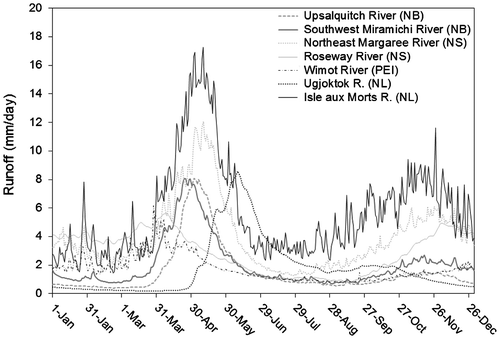
Flood magnitude and timing can differ considerably across the region (Figure ). Most NS rivers experience peak flows throughout autumn and winter; however, flood timing is earlier in mainland NS (Roseway River; end of March) than for Cape Breton rivers (Northeast Margaree River; mid-May). NB rivers generally experience peak flows between March and May (typically early May); however, floods occur later for northern NB rivers (e.g. Upsalquitch River). PEI rivers experience flood timing similar to mainland NS rivers (e.g. Roseway and Wilmot Rivers), while flood timing in Cape Breton is similar to northern NB rivers (e.g. Upsalquitch and Northeast Margaree Rivers). The lowest flood flows in NL per unit area are in Labrador (e.g. Ugjoktok River), usually between April and July in response to snowmelt. Floods on the Island of Newfoundland are the greatest in eastern and southwestern regions (e.g. Isle aux Morts River) relative to the central and Northern Peninsula regions, largely reflecting greater P in the former areas. Floods in these regions are possible throughout the year.
Figure 3. Daily runoff for selected rivers within the Maritime Provinces and Newfoundland and Labrador.
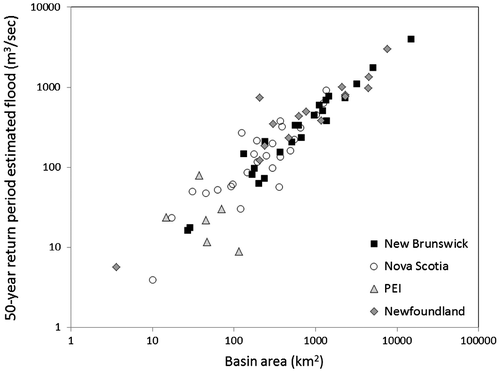
Despite these differences in runoff and flood timing in the Maritime Provinces and NL (Figure ), flood magnitude is consistent across the region (Figure ), with similar relationships between the 50-year flood and basin area. PEI rivers showed slightly lower flood magnitudes for given basin areas, which partly reflects their limited basin size (less than 150 km2) and low relief. NS basins showed more variability (Caissie and Robichaud Citation2009), especially for mid-range basins (100–400 km2). Above-average floods for a given basin area in NB tended to be in the Bay of Fundy area, with correspondingly higher annual P. Major floods in the St. John River basin in southwestern NB, such as that in 2008, can be generated by snowmelt and rain-on-snow, augmented by ice jamming (Beltaos and Burrell Citation2015, Newton and Burrell Citation2016). Similarly, Cape Breton rivers had above-average floods for a given basin area in NS, and experience the highest P in NS. The largest floods in NL occur along Newfoundland’s south coast in response to the large P the region receives.
Figure 4. Flood flows (50-year flood) for rivers within the Maritime Provinces and Newfoundland and Labrador (data from Department of Environment and Lands Citation1992; Caissie and Robichaud 2006).
Floods in Québec
Canada’s largest province is dominated by the rock outcrops, thin soils and abundant lake coverage of the Precambrian Shield. This region is bounded by the extensive wetlands of the James Bay lowlands in the northwest, and the St. Lawrence lowlands to the south. The latter comprise a narrow plain with relatively thick soil cover lining the St. Lawrence River. The Eastern Townships and Gaspé Peninsula consist of the low Appalachian Mountains (mean elevation of 300 m) with thin soils separated by thicker soiled valleys. Vegetation on the Precambrian Shield (Gouvernement du Québec Citation2003) grades from herbaceous and shrub arctic tundra in the extreme north to forest-tundra (spruce) to the boreal forest zone with spruce in the northern portion and balsam fir–white birch to the south. The balsam fir–white birch domain also covers the highest portions of the Gaspé. Balsam fir–yellow birch dominate the lower elevations of the Gaspé, the Saguenay–Lac St. Jean region and the southern edge of the boreal forest. The southernmost portion of the Precambrian Shield and the St. Lawrence lowlands are covered by hardwoods such as sugar maple, yellow birch, basswood and butternut hickory.
Southeastern QC’s maritime climate is influenced by the Gulf of St. Lawrence, while most of the St. Lawrence valley has a humid continental climate which changes to a cold polar climate in the extreme north. The result is strong north–south gradients in both air temperature and P. Average air temperature ranges from 20°C in the south to 3°C in the north (summer), and −8°C in the south to −25°C in the north (winter) (Ouranos Citation2010). Summer mean P increases to the northwest from nearly 450 mm in the south to 120 mm in the north. Some southern mountainous regions receive 350 mm of winter P with only 50 mm of snow water equivalent (SWE) in the far north (Ouranos Citation2010). Snow accumulation typically begins in October in northern QC and November in southern QC. Precipitation generally remains in the form of snow until March–April in the south, while northern QC typically does not receive significant rainfall (> 0.2 mm) before May.
Most important floods result from spring snowmelt (Javelle et al. Citation2003), and St-Laurent et al. (Citation2009) noted that 59% of major floods from 1865–2005 in the St-François River basin occurred between March and May. Such floods may be augmented by rain-on-snow events (e.g. 1913 St-François River flood [Castonguay Citation2007]; 2011 Richelieu River flood [Saad Citation2014]). In the case of the latter, heavy snowfalls (> 30% above normal) preceded spring snowmelt, coinciding with above-average rainfall amount and intensity, producing peak flows with an estimated return period of 90 years (Saad et al. Citation2016). Other major causes of floods include ice jams following rapid mechanical breakup of the ice cover. Rivers often impacted by ice jam flooding include the Chaudière River near Québec City (Roy et al. Citation2003), the steep Matapedia River in the Gaspé region (Beltaos and Burrell Citation2010), and the Ouelle River in the southwest St. Lawrence region (MacNider-Taylor et al. Citation2009). Heavy summer rainfall can also generate floods, and short-duration (5-minute to 1-hour) maximum rainfall intensities equal or exceed those in other parts of Canada (Table ). Intense rainfall (> 250 mm in 72 hours on the Chicoutimi and Ha! Ha! River basins) was the main cause of the infamous 1996 Saguenay flood. Flood control structures were insufficient and inefficient in controlling flows, as some dikes toppled and some sluice gates underperformed (Leclerc and Secretan Citation2016, this issue).
Dams on many rivers in QC shift flood seasonality from peak events in the spring to a phase difference (spring floods upstream of dams and winter floods downstream), and may increase flood duration below the dam (Fortier et al. Citation2011). In spite of regulation of the St. Lawrence River for hydroelectric production, flood control and navigation safety, some relatively large and shallow reaches (e.g. Lake St-Pierre between Sorel and Trois-Rivière) are subject to major water-level fluctuations because of the flow variability of tributaries (e.g. Ottawa, Richelieu, Yamaska and St.François Rivers) entering downstream of the Beauharnois dam. High water levels in 1976 (1 m above the summer average) were observed in Lake St-Pierre, and define the upper limit of sensitive wetland ecosystems (Hudon Citation1997).
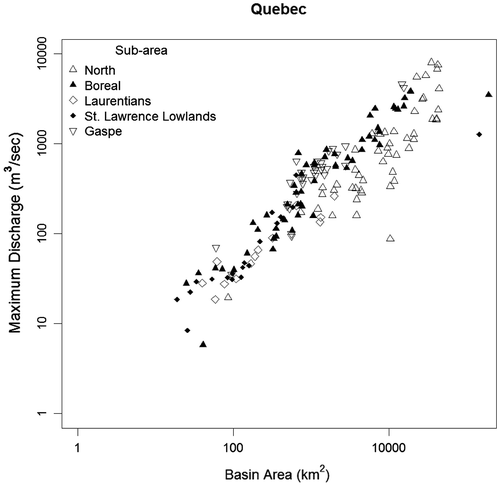
There is a relatively consistent relationship between maximum discharge (Qmax) and basin area for various sub-regions (Figure ) compared to other regions in Canada (e.g. the Prairies and the Cordillera discussed below) despite QC’s great areal extent. The exception appears to be basins in the far north, where Qmax is much more variable for a given basin area. This may reflect the role of lakes as key storage elements in the landscape, reducing flood peaks and detaining flood waves in basins where their size and number exert a key control on the flow regime. The Qmax from many rivers in the Gaspé often plots above those for other sub-regions at a given basin size, consistent with the relatively steep gradients of streams in the Appalachian Mountains of this sub-region.
Figure 5. Maximum daily mean discharge vs. basin area for unregulated Water Survey of Canada (WSC) gauging stations in sub-regions in Québec. Maximum daily mean discharge was obtained for all naturally flowing stations in the region with 10 years or more of discharge record with a known drainage area, and includes all active and discontinued sites (data from WSC Citation2014).
Floods in southern Ontario
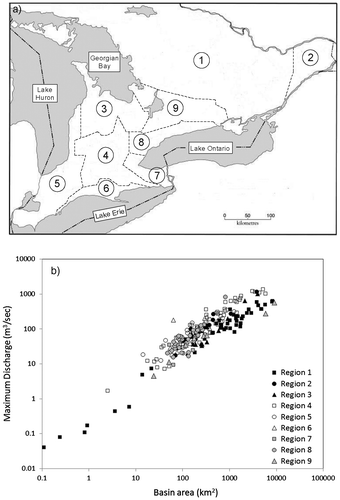
Southern ON (Figure a) is bounded by the Great Lakes to the south, west and northwest and the Ottawa and St. Lawrence Rivers, and has modest relief (Sangal and Kallio Citation1977). All river basins drain to the Great Lakes or the Ottawa River.
Figure 6. (a) Physiographic regions of southern Ontario identified by Moin and Shaw (Citation1985). (b) Maximum recorded flood (daily mean discharge) vs. basin area recorded at unregulated or minimally regulated Water Survey of Canada (WSC) gauging stations in each region with at least 10 years of record to 2012.
The region’s climate is strongly modified by the Great Lakes. Mean annual P ranges from 660 to 1010 mm (Brown et al. Citation1968), with the highest values on slopes east of Lake Huron and Georgian Bay (Moin and Shaw Citation1985). Mean annual snowfall ranges from < 100 cm along the northwest shore of Lake Erie to > 300 cm around Georgian Bay (Ontario Ministry of Natural Resources Citation1984). The portion of annual P falling as snow increases from south to north (Moin and Shaw Citation1985), ranging from less than 20% to more than 30% (Ontario Ministry of Natural Resources Citation1984). Distribution of P throughout the year is relatively uniform.
Historically, snowmelt and rain-on-snow have been the most frequent flood-generating processes in southern ON (Irvine and Drake Citation1987; Watt et al. Citation1989; Gingras et al. Citation1994), and heavy spring rainfalls following snowmelt are also common flood generators, such as in the Cambridge area of the Grand River basin in May 1974 (Moin and Shaw Citation1985). The significance of summer storms and high-intensity rainfalls in flood generation (e.g. Buttle and Lafleur Citation2007) has increased in recent years. Snowmelt generally starts in March, although mid-winter melt events are common. The proportion of snowmelt-generated peaks increases northward and eastward across the region, with the mean duration of snowmelt peaks also increasing from south (< 2 days) to north (> 8 days) (Irvine and Drake Citation1987). Another cause of winter floods is rain on frozen ground (Watt et al. Citation1989; Buttle Citation2011), particularly in agricultural areas.
The presence of a temporary river ice cover means that some flooding in southern ON results from ice-jams that augment snowmelt-generated flooding, usually following an early spring thaw when the ice cover is still strong. The Moira River in Belleville is subject to this type of flooding, as are lower sections of the Thames and Sydenham Rivers in southwestern ON (Gerard and Davar Citation1995). Finally, coastal flooding occurs in some areas along shorelines of the Great Lakes (Watt et al. Citation1989). High lake levels can lead to flooding of property, and wave erosion. In some areas (e.g. the downwind end of Lake Erie) this is exacerbated by wind set-up raising water levels as much as 2 m above the static level. Changes in wind velocity and air pressure can also set up oscillations in lake levels (seiches), which have led to flooding at the eastern end of Lake Erie (Trebitz Citation2006). Coastal flooding may occur along all the Great Lakes’ shorelines bounding southern ON, but is mitigated slightly along the Lake Ontario shoreline due to partial control of that lake’s water levels (McRae and Watt Citation2006).
The general increase in Qmax with basin area in southern ON (Figure b) displays considerable scatter and overlap between some regions (e.g. Regions 4 and 5). Nevertheless, Qmax values from Regions 1 and 4 diverge, with greater floods for Region 4 beyond a basin size of ~100 km2. This may reflect water storage in the numerous lakes and wetlands in Region 1.
Southern ON is one of the most urbanized regions in Canada, containing such major urban centres as Toronto, Ottawa, Hamilton, London and Kitchener/Waterloo, and a later section on floods in urban areas addresses flood generation in these and other Canadian cities and towns. Agricultural land in much of ON needs drainage improvement via subsurface tile drainage systems to allow farmers earlier access to the land following spring snowmelt (Irwin and Whiteley Citation1983). While there is no consensus as to the impact of land drainage on floods, enhanced soil storage capacity towards the point of soil saturation should decrease peak flows at the field scale, after which tile drainage likely increases peak flow slightly by adding subsurface outflows to overland runoff (Irwin and Whiteley Citation1983). The influence of tile drainage on flooding at the basin scale is similarly equivocal. Drainage of surface depressions previously unconnected to the flow network will likely increase flood peaks; however, the effect on flooding at a specific location on the stream network depends in part on the degree of synchronization of flow contributions to the channel (Irwin and Whiteley Citation1983).
Floods in the boreal forest
The boreal forest region extends from the Yukon (YT) to NL and combines Canada’s Boreal Plains and Boreal Shield ecozones; floods in the Boreal Cordillera zone are addressed later in the section on western Cordilleran floods. The Boreal Shield comprises almost 20% of Canada’s landmass and contains 22% of Canada’s freshwater area (Urquizo et al. Citation2000). It is a rolling landscape of igneous and metamorphic bedrock outcrops, generally thin soils, numerous lakes and wetlands. It contains the headwaters of several major river systems (e.g. Nelson and Churchill Rivers in MB, St. Lawrence in ON, Eastmain and Rupert in QC), and is largely forested. Northern areas are dominated by white and black spruce, balsam fir and tamarack, while white birch, trembling aspen, balsam poplar, and white, red and jack pine are common in southern regions. The Boreal Plains extend from the Peace River district in BC to southeastern MB. They have fewer lakes and bedrock outcrops relative to the Boreal Shield, and forest cover consists of jack and lodgepole pines, white and black spruces, tamarack and aspen.
Mean annual P in the boreal forest ranges from < 400 mm in extreme northeastern BC to > 1200 mm in eastern QC (Fisheries and Environment Canada Citation1978). This general west-to-east increase is interrupted by increased P in the lee of Lake Superior in ON. There is also a slight increase along a north–south gradient in ON and QC. Annual evapotranspiration (ET) usually exceeds annual P in the northwestern boreal, while P – ET increases moving eastward. Rainfall intensities are generally lower in the boreal forest than in the Prairies and southern ON and QC for a given duration and return period (Table ). Mean annual snowfall increases from ~160 cm in northeastern BC to > 400 cm in eastern QC, interrupted by an intermediate peak snowfall in the lee of Lake Superior. Mean January daily air temperatures are < −22.5°C in northeastern BC and −12°C in eastern QC, declining to < −27.5°C in northern Saskatchewan (SK) and MB. Mean July daily air temperatures are 17.5°C along the southern edge of the boreal forest in MB, ON and QC, dropping to < 12.5°C in northern QC. On average, rivers freeze over on 1 December in the southern boreal in ON and QC, and as early as 1 November in northern SK. The mean date when rivers become ice-free is 15 April along the boreal forest’s southern edge, and 1 June along its northern edge (Fisheries and Environment Canada Citation1978). Permafrost > 10 m in depth may be present in upland areas of northern portions of the boreal forest, but is generally absent under major lakes and rivers due to their thermal influence (Newbury et al. Citation1984).
The west-to-east shift in annual P – ET from negative to positive values across the boreal forest has significant implications for flood potential in the region. Negative P – ET in the western Boreal Plains often leads to disconnection between uplands and stream networks. This reduces the frequency of significant runoff at the basin scale, and means that flood potential in response to spring and summer rainfalls in a given year is maximized when large P inputs in the preceding summer and fall are combined with large winter snow accumulation (Devito et al. Citation2005). Interannual variability in flood potential in the boreal forest decreases moving eastward in response to increases in annual P – ET. Granger and Pomeroy (Citation1997) showed that mature boreal forest stands had greater ET losses relative to regenerating stands or recent clearcuts, leading to greater summer and fall soil moisture in forest clearings and young regenerating stands (Elliott et al. Citation1998). Higher soil moisture in clearcuts combined with compaction of clearcut soils promoted reduced infiltration capacity. As a result, all sub-canopy rainfall infiltrated mature forest soils during a severe summer storm in the central SK boreal forest (> 150 mm), whilst over half of the rainfall formed runoff in recent clearcuts (Elliott et al. Citation1998).
Most annual maximum floods in the boreal forest are driven by snowmelt (Woo and Waylen Citation1984; Alberta Transportation Citation2004), and boreal forest cover affects snowmelt energetics and rates, meltwater infiltration into frozen soils, and runoff generation (Prevost et al. Citation1991). Wet soils in clearcuts in the fall from reduced summer ET result in saturated frozen soils in the spring with restricted infiltration capacity (Pomeroy, Granger et al. Citation1997). Sublimation losses from intercepted snow (Pomeroy et al. Citation1998) lead to maximum spring snowpacks under evergreen forest canopies that are one third to one half of those in clearings, burned or deciduous stands (Pomeroy et al. Citation2002). Melt rates are three times higher in clearings than under forest stands (Pomeroy and Granger Citation1997), generating vastly greater snowmelt runoff formation in recent clearcuts than in mature stands (Pomeroy, Granger et al. 1997). Spring and snowmelt floods are often linked to river ice breakup, which creates water levels far higher than those for equivalent open-water discharges (Pietroniro et al. Citation1996). Nevertheless, short-duration intense thunderstorms can produce severe flooding in small- to medium-sized basins (Alberta Transportation Citation2004). Flood hydrology in parts of the boreal forest is complicated by river impoundment for hydroelectric generation and the associated flow diversion, such as the diversion from the Churchill River into the Burntwood–Nelson system at Southern Indian Lake in northern MB (Newbury et al. Citation1984).
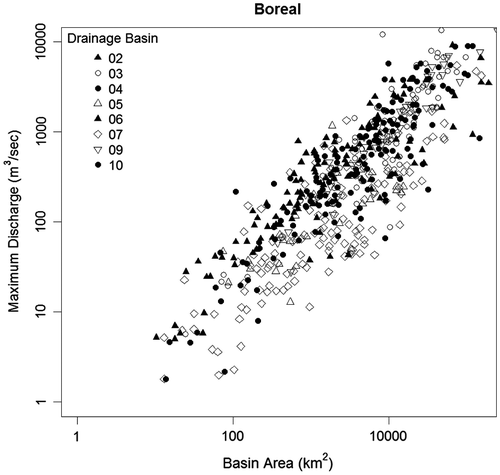
Our knowledge of flood characteristics of boreal forest rivers is less than for other regions (e.g. southern ON and QC), partly due to its sparse population. Nevertheless, variability in the Qmax vs. basin area relationship for the boreal forest (Figure ) is greatest for rivers draining to Great Slave Lake, which also have many of the smallest Qmax values for a given basin size. The latter likely reflect the frequent disconnection between uplands and stream networks noted earlier for this sub-region, often resulting in minor flood peaks relative to wetter parts of the boreal forest.
Figure 7. Maximum daily mean discharge vs. basin area for unregulated Water Survey of Canada (WSC) gauging stations in major drainages across the boreal forest in the Yukon Territory, British Columbia, Northwest Territory, Alberta, Saskatchewan, Manitoba, Ontario, Québec and Labrador. Drainage basin numbers correspond to the major drainage basins of Canada used by WSC (see Table ).Maximum daily mean discharge was obtained for all naturally flowing stations in the region with 10 years or more of discharge record with a known drainage area, and includes all active and discontinued sites (data from WSC Citation2014).
Prairie flooding
The plains of the southern portions of Alberta (AB), SK and MB consist of gently rolling hills separated by deep river valleys, with a general west–east slope. The sedimentary bedrock is covered by glacial deposits of variable thickness. The region’s natural vegetation is grasslands, and trees are largely confined to river valleys; however, it has been heavily altered by agricultural activity. Southwestern AB and southeastern SK have a semi-arid cold climate, becoming more humid and colder to the north and east. Maximum January and July mean daily air temperatures are generally warmer in this semi-arid sub-region (> −10°C and > 20°C, respectively). Annual P ranges from < 300 mm per year in semi-arid grassland to > 700 mm in central MB. Mid-winter melts (frequent in the southwest and infrequent in the northeast) punctuate the region’s protracted winter (usually 4–5 months). High surface runoff occurs during spring snowmelt due to relatively rapid water release from snowpacks to frozen soils (Gray et al. Citation1985). Most rainfall in spring and early summer is from large frontal systems, and intense rainfall in summer is from convective storms over small areas (Gray Citation1970; Shook and Pomeroy Citation2012; Table ). High ET with low rainfall and soil moisture from mid-summer to fall result in little runoff (Granger and Gray Citation1989). This is exacerbated by poorly drained stream networks such that large areas are internally drained and do not contribute to major river systems except during flooding (Martin Citation2001; Shook et al. Citation2013).
Generally low P makes the accumulation, redistribution and ablation of snowcover of critical importance to the hydrology of the Prairie region. Snowpacks typically form in November and begin ablation in March and April. Over-winter wind redistribution and sublimation reduces peak SWE and increases variability in spatial distribution with large snowdrifts near water courses, densely vegetated sites and topographic depressions, and wind-scoured zones in summer fallow fields and on hilltops (Fang and Pomeroy Citation2009). Mid-winter melt and sublimation in the southwestern Prairies from adiabatically warmed winds in the lee of the Rocky Mountains (chinooks) reduce SWE substantially. Rain-on-snow contributions are infrequent, although flooding in 2011 showed a rain-on-snow contribution in SK and MB (Stadnyk et al. Citation2016). Snowmelt runoff is also strongly controlled by infiltration to frozen mineral soils, which itself is sensitive to the influence of cultivation on macropores and fall soil moisture status. Restricted infiltration through frozen soils may develop with any of mid-winter melting, early spring rainfall and high fall moisture content, and can generate flooding (Granger et al. Citation1984). The more common limited infiltration condition can reduce flood potential even when SWE is above normal, but the combination of high snowpacks and restricted infiltration is most strongly associated with flood development (Gray et al. Citation1985, Citation1986).
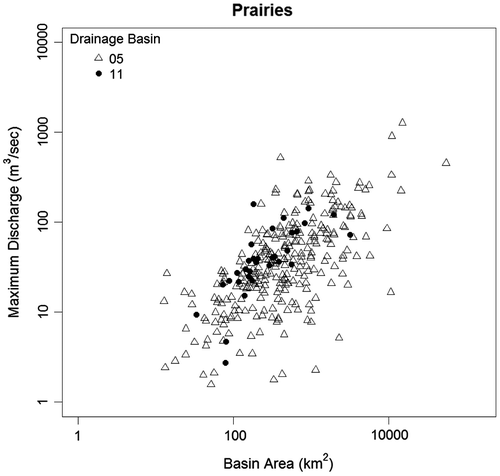
In the poorly drained central, northern and eastern Prairies, snowmelt runoff flooding alone does not generate stream flooding as the landscape is characterized by numerous small post-glacial depressions known locally as “sloughs,” “wetlands” or “potholes” and here termed “ponds.” Most ponds are internally drained, forming closed basins (LaBaugh et al. Citation1998; Hayashi et al. Citation2003), which are non-contributing areas in dry to normal conditions (Godwin and Martin Citation1975). However, ponds connect to one another during floods through the “fill and spill” mechanism (van der Kamp and Hayashi Citation2009; Spence Citation2010). Peak streamflows are influenced by snowmelt rates and volumes near the ponds, incident P, and antecedent soil and surface storage status (Fang and Pomeroy Citation2008; van der Kamp and Hayashi Citation2009; Fang et al. Citation2010). The storage potential of ponds makes them important hydrological elements (Hayashi et al. Citation2003) which can regulate flood peaks by retaining slope runoff that might otherwise reach the stream. Land-use alteration in surrounding upland areas can produce noticeable impacts on snowpack trapped by pond vegetation, surface runoff to ponds, pond levels and subsequent flood generation potential (van der Kamp et al. Citation2003; Fang and Pomeroy Citation2008). Modelling the impact of wetland drainage on peak flow generation suggests that peak flows can be increased by approximately one third when pond drainage approaches 50% in a prairie pothole-dominated drainage (Pomeroy et al. Citation2014), as a result of the enhanced efficiency of the drainage network in conveying slope runoff to the basin outlet. The relationship between Qmax and basin area for Prairie rivers (Figure ) shows greater scatter than that in other regions that have been described. This may partly reflect the internal drainage of many prairie basins, combined with spatial variations in the intensity of the aforementioned drainage of prairie wetlands.
Figure 8. Maximum daily mean discharge vs. basin area for unregulated Water Survey of Canada (WSC) gauging stations in sub-regions of the Prairies. Drainage basin numbers correspond to the major drainage basins of Canada used by WSC (see Table ). Maximum daily mean discharge was obtained for all naturally flowing stations in the region with 10 years or more of discharge record with a known drainage area, and includes all active and discontinued sites (data from WSC Citation2014).
Floods in the western Cordillera and Intermontane region
The western Cordillera extends from southern BC northwards to the Beaufort Sea, and includes areas of YT and the western portion of the Northwest Territories (NT). The region is dominated by three mountain systems: eastern fold mountains (e.g. Rocky Mountains); the sedimentary, metamorphic and igneous rocks of the interior plateaus and mountains; and the western system of the metamorphic and intrusive igneous rocks of the Coast Range and western-most mountains of Haida Gwaii and Vancouver Island. Much of the region has considerable forest cover, and slope aspect plays a key role in local variations in vegetation cover. Windward slopes on southern mountain ranges have evergreens such as Douglas fir, western hemlock and red cedar. Trees decrease in size with increasing elevation, and transition to a tundra landscape above the tree line. Leeward slopes may be covered by vegetation typical of semi-arid landscapes, particularly in southern BC.
The Cordillera’s location between the Pacific Ocean and Canada’s interior, its great latitudinal extent and its rugged terrain result in a great variety of climates. Annual P ranges from > 4000 mm on the west coast of Vancouver Island and Haida Gwaii to < 300 mm in the southern BC interior and parts of the YT. January mean daily temperature ranges from ~2.5°C in the BC lower mainland to < −30°C in the YT, while July mean daily temperature ranges from > 20°C in the southern BC interior to 5°C along the arctic coast. Relief and slope aspect play important roles in sub-regional climates. Valleys are warmer than mountain slopes, and the rain-shadow effect makes windward mountain slopes generally wetter than leeward slopes.
Mountainous regions of Canada are characterized by multiple flood-generating mechanisms (Watt et al. Citation1989; Woo and Liu Citation1994). Floods can be generated by rainfall, snowmelt and rain-on-snow, whether in coastal basins (Melone Citation1985; Loukas et al. Citation2000) or in the BC Interior (Eaton et al. Citation2002). The larger the basin, the more likely that floods are generated by different processes (Woo and Liu Citation1994). Except for the largest rivers, rainfall floods may be of the highest magnitude but are small in number. Summer floods produced by heavy rainfalls, although rare, are more significant in smaller basins. Dettinger (Citation2011) described PE which deliver large amounts of warm moist air onto the west coast of North America, often resulting in high snowlines, large rainfalls and extreme floods (Neiman et al. Citation2013). Spry et al. (Citation2014) showed that both P and streamflow rates in the BC Lower Mainland were greater for PE storms than for non-PE storms. Frontal boundary floods along the east slope of the Rockies in AB have occurred on many occasions (e.g. Ford Citation1924; Hoover Citation1929; Pomeroy et al. Citation2016). The largest are generated when mesoscale convective systems stall over the foothills when moving upslope towards the mountains. Streams receiving substantial snowmelt inputs generally have annual peak flows in May and June, and event magnitude is determined by SWE and weather conditions during the melt. Rain-on-snow floods are common in autumn and winter in coastal areas, and also occur into late spring in interior areas (McCabe et al. Citation2007). They are often the largest floods in larger basins (e.g. Pomeroy et al. Citation2016), and the severity of rain-on-snow events depends on P amount, elevation of the freezing level and the amount and spatial distribution of snow (McCabe et al. Citation2007). Warm wet Pacific storms (often PE events) cause rapid melting of the existing snowpack (where sensible- and latent-heat exchanges supply 60–90% of the energy for snowmelt), augmenting the event’s discharge.
Floods in the Cordillera can also be generated by ice jams as in other regions of Canada, particularly on more northerly or high-elevation streams. In addition, the region experiences flood mechanisms that are relatively unique to the Western Cordillera. These include debris flows (rapid flow of saturated debris in a steep channel), debris floods (rapid flow of debris-laden water in a steep channel) and snow avalanches (Desloges and Gardner Citation1984; Jakob and Jordan Citation2001; Jakob et al. Citation2016), and glacial outburst floods caused by the rapid drainage of ice-dammed lakes (Desloges and Church Citation1992; Geertsema and Clague Citation2005). Wildfire-induced changes to soil infiltrability may contribute to debris flow and debris flood initiation (Jordan and Covert Citation2009).
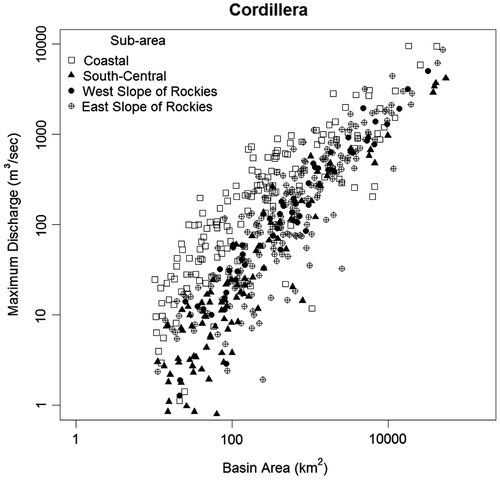
Discharge maxima for a given basin area (Figure ) are generally greater for the wetter coastal area, while the lowest maxima are found in the drier south–central interior of BC. There is considerably greater scatter in the Qmax vs. area relationship for relatively small (< 100 km2) basins in the Cordillera compared to eastern Canada (Figures ), which likely reflects the combined influence of the highly variable climate across the Cordillera and variations in basin characteristics. Maxima from basins draining the east and west slopes of the Rocky Mountains do not show consistent differences; however, there is much less variability in the Qmax vs. area relationship for west slope relative to east slope basins. The relatively low maxima for some of the latter may partly reflect basins with hydrometric stations located far enough downstream that a greater portion of the basin is in the rain shadow of the Rocky Mountains.
Figure 9. Maximum daily mean discharge vs. basin area for unregulated Water Survey of Canada (WSC) gauging stations in sub-regions of the Cordillera in British Columbia. Maximum daily mean discharge was obtained for all naturally flowing stations in the region with 10 years or more of discharge record with a known drainage area, and includes all active and discontinued sites (data from WSC Citation2014).
Regional aspects of floods in the Arctic
Canada's Arctic comprises over 40% of Canada’s landmass, covering all of Nunavut (NU) and the majority of the NT (Arctic Islands), as well as the northern edges of YT, MB, ON, QC and NL. It is north of the boreal forest of the subarctic region and is predominantly comprised of tundra and barren landscape underlain by permafrost (see Prowse et al. Citation2009 for a more detailed discussion of the region’s physical geography and climate).
The region has long, cold winters and short, cool summers, leading to snow and ice cover for most of the year with short periods of runoff. Spring runoff supplies the bulk of the annual flow, especially for small- to medium-size basins wholly within the Arctic. Many headwater systems are ephemeral as a result of freezing to the bed and/or flows confined to early spring. Open-water flow lasts several weeks in the northern Arctic to several months in more southerly regions. Several large, northward-flowing perennial river systems originate in the boreal, plains and mountain ecozones, such as the 1.8-million-km2 Mackenzie River basin that is Canada’s largest contributor of water to the Arctic Ocean.
Whilst snowmelt drives Arctic flood discharge, river ice breakup and subsequent jamming have the potential to generate extreme flood levels (Watt et al. Citation1989). Other important flood mechanisms are snow/ice blockage of channels, icings and glacier bursting. Snowmelt produces runoff over large areas but often at a slow rate due to the variable contributing area of meltwater runoff. This area is usually less than the basin area due to redistribution of snow that results in a highly variable spring snowpack (Essery et al. Citation1999), cold content in deep snow drifts that must be overcome before meltwater can be generated (Marsh and Pomeroy Citation1996), and spatially variable melt energy to the patchy snowcover that persists for many weeks during the snowmelt period (Pohl and Marsh Citation2006). These spatially variable effects desynchronize meltwater production and are exacerbated in mountain tundra environments such as in the YT (Carey and Woo Citation1999; Pomeroy et al. Citation2003). In tundra plains and uplands, absence of trees promotes substantial snow redistribution to valleys (Pomeroy, Marsh et al. Citation1997), where spring meltwater can accumulate behind snow- and ice-choked channels and cause downstream flooding when temporary dams rupture and release potentially large volumes of impounded water (Woo and Sauriol Citation1980; Woo Citation1983; Church Citation1988). Drainage of ice-dammed lakes has the potential to produce extreme floods (Cogley and McCann Citation1976; Church Citation1988).
Rainfall-generated floods in the Arctic are rare and seldom documented (Kane et al. Citation2003; Dugan et al. Citation2009); nevertheless, extreme summer flows may occur (e.g. Cogley and McCann Citation1976). Continuous permafrost underlying Arctic basins precludes typical groundwater systems and severely limits subsurface storage during the summer, leading to inflated storm runoff response relative to more southern basins (Kane et al. Citation2003). Church (Citation1988) suggested that the most extreme discharge could ultimately arise from rainfall even in the High Arctic. Although summer rainfalls are generally of low intensity and minimal hydrological significance in the polar desert environment compared to nival floods (Table ; Dugan et al. Citation2009), low-pressure systems over intermediate-sized basins allow the entire basin to contribute to storm flow and produce summer floods three to four times greater than the maximum snowmelt flood (Woo et al. Citation2008).
The High Arctic is characterized by a short-lived nival hydrological regime with the maximum discharge usually generated by spring snowmelt (Woo Citation1983; Church Citation1988). High-gradient headwater basins are dominated by summer floods, while snowmelt drives flooding in basins on low-gradient coastal plains (Kane et al. Citation2008). Snowmelt floods also occur in large basins (e.g. Mackenzie River) that drain extensive southern areas. Nevertheless, river ice breakup and associated ice jams dominate the generation of annual high-water levels throughout the Arctic (von de Wall et al. Citation2009). This flood-generating process is most pronounced in sub-regions possessing the combined effects of low relief and a cold, dry arctic climate.
Restricted infiltration due to the presence of permafrost in the Arctic promotes flooding of wetland areas (Woo et al. Citation2008). Unless winter snowfall is limited, the wetland streamflow regime is typified by the spring freshet (Woo Citation1983). Rapid snowmelt releases large water quantities while the active layer is frozen, producing surface runoff that floods wet meadows and infills ponds and lakes. For instance, the maximum extent of wetland flooding usually occurs immediately following spring snowmelt in the High Arctic polar desert (Woo and Young Citation2006).
Wetland ecosystems are also found in deltaic environments. The aquatic, semi-aquatic and terrestrial zones in deltas form highly diverse and variable ecosystems, and the Mackenzie River system contains three major deltas: the Peace–Athabasca Delta (PAD), Slave River Delta and Mackenzie River Delta (MRD). The ecological integrity of deltaic floodplains depends on their natural dynamic character, which is controlled by periodic floodwater inputs, deposition of material, and flushing during high river-stage events (Peters et al. Citation2016).
A prominent feature of these deltas is an abundance of shallow, productive wetland and lake basins (> 25,000 in the MRD) with varying degrees of surface water connectivity to the main flow system (Lesack and Marsh Citation2010). Low-elevation wetland and lake basins are potentially flooded annually and for relatively long durations, while the frequency and duration of flooding of basins at higher elevations are much less (Marsh and Lesack Citation1996). Wetland and lake basins in the MRD and PAD perched above the main flow system depend on high spring snowmelt runoff and ice jamming to raise backwaters enough to recharge water levels back to the spill elevation (Peters et al. Citation2006; Lesack and Marsh Citation2010). Although open-water floods can inundate low-lying areas of these deltas, ice-jam flooding is often the only process capable of recharging wetland and lake ecosystems. These would otherwise desiccate over decadal timescales in semi-arid environments where ET generally exceeds P (Marsh and Lesack Citation1996; Peters et al. Citation2006).
Some special aspects of floods in Canada
Many rivers in Canada flow northward, and flooding in these rivers (e.g. Richelieu, Red, Peace–Athabasca, Hudson Bay rivers) is often connected to delayed melting in northern portions of the basin relative to earlier snowmelt in southern portions (Bruce Citation1939). Spring breakup can be the largest physical disruption in rivers that flow northward to cooler regions where spring thaw is later (Smith Citation1980; Rood et al. Citation2007). Such floods put cities such as Winnipeg at risk (Blais, Clark et al. Citation2016) while providing an essential ecological service to deltas such as the PAD (Peters et al. Citation2006). Several flood case studies in this special issue report on such flooding events (Rannie Citation2016; Riboust and Brissette Citation2016; Saad et al. Citation2016; Wazney and Clark Citation2016).
This section describes in more detail several distinct aspects of flooding in Canada. The first is the little-studied issue of groundwater flooding. The second is ice-jam flooding, which although not unique to Canada is a common process in cold regions. The third type is storm-surge flooding, which is generally restricted to coastal areas. Fourth, the concentration of Canada’s population in cities makes the issue of urban flooding of particular interest.
Groundwater flooding
Groundwater flood events are generated by four mechanisms (Hughes et al. Citation2011): (1) natural water table rises and surface saturation caused by extreme high-intensity and/or long-duration rainfall (e.g. Robins and Finch Citation2012); (2) groundwater flow through alluvial deposits bypassing river channel flood defences; (3) groundwater level rise due to cessation of groundwater abstraction; and (4) underground structures creating barriers to groundwater flow that result in water tables rising to cause flooding (e.g. Edwards Citation1997). An additional mechanism is over-irrigation in semi-arid and arid areas, which causes groundwater levels to rise along with related salinization (Xiong et al. Citation1996).
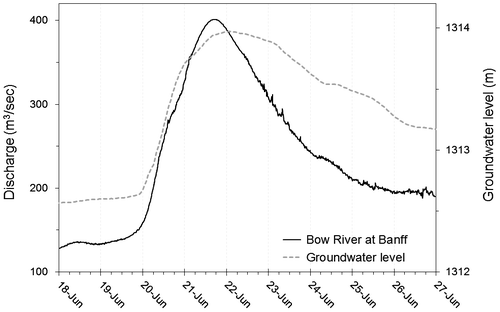
Reports of groundwater flood events in Canada are uncommon, although numerous studies describe groundwater–surface water (GW–SW) interactions under variable stream flow conditions (e.g. Cloutier et al. Citation2014), and unpublished accounts indicate basement flooding related to GW–SW interactions in communities built on alluvial aquifers. One such example comes from the relationship during the major flood of 20–21 June 2013 between the groundwater level in Canmore, AB and the hydrograph of the Bow River (from the Banff Water Survey of Canada [WSC] gauging station) which flows through the town (Figure ). The Canmore groundwater observation well is 24 km downstream of the Banff WSC station in a thick (up to 100 m) sand and gravel aquifer (Toop and de la Cruz Citation2002). Aquifer thickness at the well is 73 m, which is 730 m from the current river channel. Bow River discharge in Banff rose sharply near midnight of 20 June and peaked at 401 m3/s in the late afternoon of 21 June (Figure ), exceeding the highest instantaneous flow recorded at this station (399 m3/s on 14 June 1923). Flood peak travel time between Banff and Canmore is likely on the order of a few hours. A kinematic wave induced by a rapid increase in river stage (Jung et al. Citation2004) likely led to the quick response of the groundwater level, which reached the maximum rise of ~1.6 m by midnight on 22 June (Figure ). Much of Canmore is built on the alluvial aquifer (Toop and de la Cruz Citation2002) and is vulnerable to flooding associated with the rising water table, which can back up sewer systems and cause basement as well as surface flooding due to the reduced sewer drainage capacity. The 20–21 June 2013 flood event was particularly severe due to the combination of extremely high river stage and intense local infiltration caused by heavy rain (Blair Birch, Town of Canmore, pers. comm. 2014). Approximately 130 km downstream of Canmore, the Bow River flows through Calgary, where densely populated urban areas are also located on the alluvial aquifer (Cantafio and Ryan Citation2014). Similar cases of groundwater-induced flooding were reported in Calgary during the same flood (Osborn and Ryan Citation2014).
Figure 10. Discharge for the Bow River at Banff, Alberta for the 20–21 June 2013 flood, and groundwater level in the alluvial aquifer in Canmore, Alberta.
Storm surges
Storm surges are water-level oscillations in a coastal or inland water body with a period of a few minutes to a few days, resulting from atmospheric weather systems. These include extra-tropical cyclones, hurricane remnants and squall lines embedded in larger scale synoptic systems. Resulting water-level changes along the shoreline can be on the order of several metres. Storm surges are frequent in coastal areas of Canada, the deadliest of which was the 1869 Saxby Gale in the Bay of Fundy which killed more than 100 people in the Maritimes. They have resulted in near-shore inundation on the Atlantic (Danard et al. Citation2003) and Pacific (Murty et al. Citation1995; Crawford et al. Citation2000) coasts, in the Gulf of St. Lawrence, St. Lawrence Estuary, Bay of Fundy, Hudson Bay, James Bay, Northwest Passage, Beaufort Sea (Harper et al. Citation1988; Marsh and Schmidt Citation1993), the Great Lakes (Watt et al. Citation1989; Trebitz Citation2006), and other large lakes such as Lake Winnipeg. With rising sea levels, storm-surge damage may increase in future (e.g. Lyle and Mills Citation2016).
Ice jam-related floods
The formation, growth and ablation of ice cover and the associated development of ice jams exert a particularly strong control on flood generation in many areas of Canada (Ashton Citation1986; Gray and Prowse Citation1993). The establishment of river ice cover decreases flow conveyance by reducing channel cross-sectional area and flow velocity, and increasing flow resistance through an enlarged wetted perimeter. The addition of an ice cover with a similar roughness to the river bed results in ~30% increase in water depth over open-water channel flow conditions (Gray and Prowse Citation1993). On a large river system, water abstraction to feed ice growth and hydraulic storage behind the accumulating ice can substantially decrease downstream flow (Moore et al. Citation2002; Prowse and Carter Citation2002Citation). Backwater storage is released during spring melt, contributing to the largest hydrologic event of the year for most ice-covered rivers at northern latitudes; e.g. > 20% of the spring freshet volume in the Mackenzie River was estimated to be over-winter water released from ice-induced hydraulic storage at the time of river ice breakup (Prowse and Carter Citation2002).
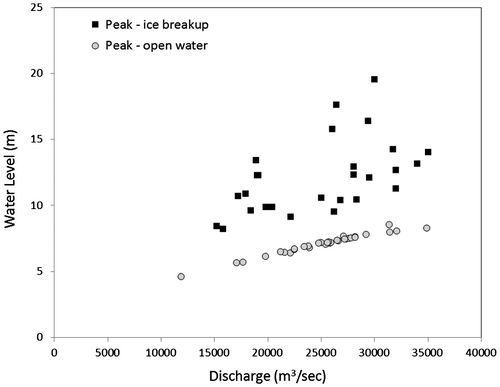
Interaction of a large flood wave with an intact and mechanically strong ice cover can result in dynamic (mechanical) river ice breakup and ice jamming, with potential generation of extreme flood levels (Watt et al. Citation1989). Ice jams may present significant resistance and/or obstruction to streamflow, leading to river stage several metres greater than for the same discharge under open-water conditions (von de Wall et al. Citation2010; Figure ) and occasional over-banking of channel water (Gray and Prowse Citation1993).
Figure 11. Open-water and ice-influenced peak water levels vs. discharge at the Mackenzie River at Arctic Red River Water Survey of Canada (WSC) station for the years 1972 to 2006 (modified from von de Wall et al. Citation2010).
Floods in urban areas
A number of processes can produce flooding in cities; the focus here is on the role of urbanization itself. Flooding in urban areas is a special concern since Canada’s urban population (people living in urban areas as defined by national statistical offices) was just above 27 million (81% of Canada’s total population) in the 2011 census (Statistics Canada Citation2014). Urbanization involves the construction of buildings, roads and related infrastructure, with consequent reduction of the infiltration capacity of previously permeable surfaces and a general improvement in the urban landscape’s hydraulic efficiency through the creation of roadside gutters, sewer networks and lined stream channels. The result is increased surface runoff, more rapid water transmission through the drainage network, and increased flood risk in terms of both peak flow magnitude and frequency of occurrence of that flood magnitude (Leopold Citation1968; Hall Citation1984; Leith and Whitfield Citation2000).
The most common way of dealing with enhanced runoff in urban areas has been to carry it away as quickly as possible via underground pipes and sewers (Hall Citation1984). Older (pre-1950s) communities frequently have combined sewer systems, where rainfall drains into sewers carrying waste water and both are transferred to sewage treatment works. Since 1960, many new developments have separate sewer systems where water from gutters and roads may be carried through pipes to the nearest watercourse, but often simply joins a combined sewer (Waller Citation1976). Most modern urban flood drainage systems were designed to cope with rainfall events that occur with a one-in-30-year probability (the design storm); however, older parts of the system may be operating to a lower standard. It is inevitable that the capacities of sewers, covered urban water courses and other piped systems will sometimes be exceeded. When the piped system is overwhelmed or cannot drain effectively into an outfall, the excess travels down roads and other paths of least resistance, and floods low-lying areas. These areas can contain property and infrastructure where flooding can cause costly damage, distress and sometimes loss of life.
As an example, Toronto, Canada’s largest city, experienced major flooding due to extreme rainfalls in 2000, 2005 and 2013 (Kovacs et al. Citation2014). The 8 July 2013 flood in Toronto resulted from 126 mm of rain generated by two sequential thunderstorm cells. Rainfall intensity far exceeded storm sewer capacity, and caused runoff to travel along city streets to creeks and rivers. The storm caused major transit disruptions and delays, road closures, power blackouts, flight cancellations and flooding across Toronto and Mississauga, including flooding of 3000 basements. The Insurance Bureau of Canada estimated the 8 July storm costs at close to CAD $1 billion in damages – the most expensive natural disaster ever in Toronto and ON.
The wide range of urban stormwater best management practices (BMPs) include such end-of-pipe options as infiltration basins and stormwater management ponds (Zimmer et al. Citation2007); the latter store runoff temporarily and release it over a protracted period to downstream drainage systems (Marsalek and Schreier Citation2009). Increasing emphasis has been placed on low-impact development (LID) based on design features to reduce overland flow and enhance groundwater recharge, such as the disconnection of downspouts from storm sewers, use of pervious pavement, and inclusion of lot-level storage and infiltration features such as rain gardens and street swales (Zimmer et al. Citation2007). Such BMPs include green roofs, which may be particularly appropriate for reducing runoff in downtown areas where extensive impervious surface coverage and high land prices in downtown areas make creation of vegetated space for water infiltration very expensive (Roehr and Kong Citation2010).
Observed and anticipated climate-related trends in flood drivers and flooding in Canada
Research into historical trends of flooding in Canada and its drivers at the national and regional scales, as well as anticipated changes in flooding associated with climate change, has been spurred in part by the expectation that climate change may intensify the water cycle via increases in ET and P (Huntington Citation2006). A major theme of this work is the attempt to link any changes in flooding to historical and forecast trends in climate variables such as air temperature and P (Mortsch et al. Citation2015). There was no significant trend in mean annual temperatures over the latter half of the twentieth century for the entire country; however, Zhang et al. (Citation2000) reported that annual maximum temperatures increased by 1.5–2.0°C during this period in northern BC and western NT, and cooled by ~1.5°C in northeastern Canada, with a similar pattern for annual minimum temperatures. Annual P increased by 5–30% during this period across Canada, with statistically significant increases mostly in the Arctic. Such climatic changes (particularly the increase in annual and in some cases seasonal P) may result in increased flood risk in various parts of Canada, especially if there is a corresponding increase in P intensity (Morgan et al. Citation2004). Zweirs and Kharin (Citation1998) predicted that doubling of atmospheric carbon dioxide (CO2) would increase rainfalls with a 20-year return period in Canada by ~14% using a global climate model (GCM). Mailhot et al. (Citation2012) used regional climate simulations to forecast large relative increases in annual maximum P for a range of durations and return periods for 2014–2070 for southern ON, southern QC and the Prairies, with the smallest increases in coastal areas.
Nevertheless, evidence of increases in extreme rainfalls in Canada from the historical record that might support such projections is equivocal. Thus, Kunkel et al. (Citation1999) found no long-term trend in an extreme P index for Canada for 1951–1993. Mekis and Hogg (Citation1999) observed an increased fraction of annual P falling in the largest 10% of daily events with measurable P for 1940–1995 over a large portion of Canada; however, this trend may have been unduly influenced by stations in northern Canada with relatively short records (Zhang et al. Citation2001). Zhang et al. (Citation2001) noted no identifiable trends in either the frequency or the intensity of extreme rainfalls at the national scale. They found a significant linear trend in spring heavy rainfall events for 1900–1998 in eastern Canada, but no trends in heavy rainfall events in other seasons or regions. They suggested that the failure of their analyses to support GCM projections of increased heavy rainfalls made by Zwiers and Kharin (Citation1998) and others may possibly reflect the relatively early stages of global warming induced by greenhouse gases. Shook and Pomeroy (Citation2012) found no increase in rainfall frequency or depth in single-day events in the Prairies over records extending to 100 years, but an increase in the number and intensity of multiple-day rainfall events was evident over much of the region, and in some cases the number of multiple-day events has doubled. A substantial increase in early spring and late fall rainfall can be hydrologically significant since these rains may cap frozen soils with ice layers that restrict infiltration or induce rain-on-snow flooding.
Research into trends in flooding drivers has examined the role of teleconnections between two dominant modes of atmospheric variability – the North Atlantic Oscillation (NAO) and the Pacific/North America teleconnection pattern (PNA) – and P amount and intensity. Stone et al. (Citation2000) found seasonally increasing trends in total P resulting from increases in all levels of event intensity in southern areas of Canada during the twentieth century. They observed a rainfall response to the NAO in northeastern Canada in summer, while the PNA strongly influenced P variations in southern BC and the Prairies. The PNA only influenced the frequency of heavier rainfalls in the autumn in ON and southern QC, with a negative PNA generally leading to more extreme P events. The potential link between the NAO and extreme P in QC may extend to flood characteristics (magnitude, frequency and duration), and Fortier et al. (Citation2011) concluded that low-frequency oscillations in this teleconnection pattern may exacerbate flood conditions. Gingras and Adamowksi (1995) compared flood magnitudes during and outside of El Niño–Southern Oscillation (ENSO) periods, and found a significantly lower probability of floods during warm El Niño periods for five basins in southern ON. They concluded that the frequency of rainfall-generated floods is different during ENSO periods, with important consequences for water resources managers particularly in regard to flood forecasting and reservoir management.
Analyses of temporal trends for floods in the northwestern boreal forest indicate that spring runoff is starting earlier in the year apparently due to increasing spring air temperatures (Burn et al. Citation2004). Warm Pacific Decadal Oscillation (PDO) phases (positive values) are associated with warmer and drier winters, while cold PDO phases (negative values) are linked to cooler and wetter winters. During warm PDO phases, the timing of annual maximum and snowmelt-induced floods in the northwestern part of the boreal forest shifts towards the spring, and moves towards the summer for the cold PDO. Such decadal-scale climate fluctuations also affect flood magnitudes in the Boreal Plains, where periods of above-average P can increase the effective contributing area for flood generation by increasing hydrologic connectivity in a basin through rising water levels in ephemeral lakes in closed depressions and areas of internal drainage (Alberta Transportation Citation2004).
Changes in P associated with such variations in teleconnections may be superimposed on long-term trends. Thus, St-Laurent et al. (Citation2009) ascribed an increase in the frequency of occurrence of major floods since the beginning of the twentieth century in the St-François basin to increased P, although periods of below-average P (1950–1960 and 1980–1990) were also observed. Cunderlik and Ouarda (Citation2009) observed no significant trends in the timing of rainfall-driven floods, but significant negative trends in snowmelt flood magnitude over the last three decades in southern ON. This was attributed to earlier snowmelt as result of a warming climate. Cunderlik and Ouarda (Citation2009) also noted that basins with mainly snowmelt-driven floods have a unimodal flood seasonality, while those experiencing snowmelt-driven plus rainfall-driven floods in late summer and fall have a bi-modal seasonality. They suggest the potential for flood seasonality at a station to change from unimodal to bi-modal with time, which may imply an increasing intensity of rainfall events in recent years.
In the Prairies, Shook and Pomeroy (Citation2012) noted an increased rainfall fraction of P in March and clustering of summer rainfall events with greater numbers of multiple-day rainfall events. Dumanski et al. (Citation2015) found that these trends are causing an increase in flooding in a small basin in SK and greater contributions from rain-on-snow. The appearance of rainfall-runoff high flows in 2012 and the flood of record in 2014 suggest a rapidly changing prairie hydrology where snowmelt runoff over frozen soils is no longer the exclusive mechanism of flood generation, and flow volume from snowmelt is exceeded by that due to rainfall-runoff.
Future and present trends in floods in mountainous regions must consider multiple flood-generating mechanisms and resist the temptation to generalize, since reliable detection of trends in floods in mountainous regions is complex. This is exacerbated by issues associated with pooling data with different start times, durations and basin characteristics (Viviroli et al. Citation2012). Using a common period of observations, Cunderlik and Ouarda (Citation2009) showed that flood magnitudes are decreasing in AB and BC, although there appear to be no significant trends in the magnitude of rainfall floods in streamflow records across Canada (Burn and Whitfield Citation2016). This is echoed by Harder et al. (Citation2015), who found no trend in peak flows over 50 years in Marmot Creek, AB which drains part of the front ranges of the Rocky Mountains. Byrne et al. (Citation1999) argued that shifts in synoptic types in future climates could either increase or decrease floods based on basin location, while Whitfield et al. (Citation2003) showed that the type of future changes in BC’s mountainous Georgia Basin depends upon the hydrological regime. In rainfall-driven streams, modelled flood events increase in number but not magnitude, whereas in hybrid streams the frequency of winter events increases while that of summer snowmelt floods decreases. In snowmelt-driven streams, the magnitude and duration of summer floods decrease. All of these changes reflect the increasing domination of rainfall-driven events in this region (Whitfield et al. Citation2003).
The few data available for time series analysis of river ice breakup events in the Arctic suggest that a general (although not statistically significant) increase in magnitude and decrease in timing of maximum breakup water level has occurred since the 1970s (von de Wall Citation2011). Restricted by similar station limitations and time period, a time series analysis by Monk et al. (Citation2011) revealed mostly non-significant trends in peak annual runoff magnitude.
Conclusions and areas of future research
Flooding in Canada can occur from a broad range of processes, described here and in accompanying papers in this special issue. While many processes responsible for flood generation occur in most if not all regions of Canada, there are large regional contrasts in the predominance of specific generating mechanisms. These are expected to differ with both climate variations and change in the future, and these similarities and differences have been summarized above.
A major research need highlighted in this paper is the importance of constructing a reliable historical flood record for Canada. This would assist such efforts as improving our understanding of the processes driving flooding at particular locations, and the assessment of temporal changes in the magnitude and frequency of floods generated by specific processes at the regional and national scale. The deficiencies in the Canadian Disaster Database (CDD) that were highlighted earlier need to be addressed. Since the public costs of floods are increasing, more should be done to ensure that the CDD is complete and consistent.
Changes to the family of snowmelt-, rain-on-snow-, ice jam- and rainfall-generated floods related to climate variation and change continue to warrant attention, as these processes affect most areas of Canada. Progressive warming has meant a shift from snowmelt-dominated flooding to rain-on-snow or rainfall-runoff flooding in some areas, and these changes have challenged local authorities who manage infrastructure or predict flooding. Rising sea levels and changes in storm frequency suggest that storm-surge flooding may increase in coastal areas. This prospect needs to be addressed.
Approaches to improve our understanding of flood-generation processes will by necessity vary between regions across the country, given differences in such factors as hydroclimate, geology, physiography and land cover. For example, in the Prairie landscape there is a need to consider the role of various hydrological processes in altering the states and locations of water and the consequent effects on streamflow generation (Shook et al. Citation2015). These transformations include wind redistribution and ablation of winter snowfall, snowmelt and runoff over frozen soils, and filling and spilling of depressional storage as runoff contributes to streamflow. Improvements in understanding the flood hydrology of the Arctic have to be made in the face of a scarcity of gauged streams (Woo et al. Citation2008; Dugan et al. Citation2009) which limits knowledge of spatial variations in flood generation across the Arctic, and the lack of complementary data (e.g. P, air temperature and soil moisture) which complicates building a consensus on runoff response for the region (Kane et al. Citation2008). Expansion of the Arctic hydrometric monitoring network occurred during the International Polar Year Program (2007–2008); however, wide-scale coverage is constrained by the expense of installing and maintaining such remote systems. Efforts must continue to integrate data from the existing network, climate reanalysis products, remote sensing approaches for estimating discharge and areal extent of inundation on large rivers, and hydraulic and hydrologic models to improve our understanding of flood characteristics across the Arctic.
Similarly, the research needs associated with flood processes that have received little attention to date or are particularly relevant to Canada are varied. Thus, the process of groundwater flooding needs to be considered more explicitly by flood monitoring and risk-assessment processes. Although groundwater flooding can cause significant social and financial impact, particularly to basements of structures located close to rivers (Jacobs GIBB Ltd. 2006), impacts from this form of flooding could be overlooked in the planning process. Engineering solutions to overcome the risk of fluvial flooding, such as levees, would not protect such developments from flooding caused by groundwater underflow through permeable materials driven by high river stages.
Flood risks associated with storm surges in Canada are strongly linked to the potential for climate change to intensify weather systems and associated wind fields, thus resulting in bigger surges and an east–west and north–south shift in the tracks of the weather systems (Danard et al. Citation2003). Such changes in storm tracks could subject new areas to storm surge activity. Future work needs to build on previous attempts to model storm-surge events (e.g. Bobanović et al. Citation2006), given the influence of rising sea levels and increasing development in low-lying coastal areas on storm surges in future climates. Concurrent needs include an improved capacity to map potential inundation zones for storm surges that might occur in populated coastal areas (Danard et al. Citation2003; Webster et al. Citation2004, 2006) to reduce or avoid the flood risk associated with these events.
Climatic shifts in most of Canada to wetter winters and heavier summer rainfall events (Kunkel et al. Citation1999; Institute for Catastrophic Loss Reduction Citation2012) also may affect flooding in urban areas. Design storms based on specified return periods, durations and intensities have long been used to plan urban drainage systems, despite the imprecise definition of the design storm concept in Canada (Marsalek and Watt Citation1984; Watt and Marsalek Citation2013). Concerns about climate change and the need to adapt to it have prompted many municipalities in Canada to revisit the design storm event issue, particularly in connection with drainage design since non-stationarity likely means that design storms simply do not exist as static measures. This reanalysis has mostly focused on a single property of design storms: intensity–duration–frequency (IDF) relations and projected increases in rainfall intensity (Peck et al. Citation2012; Srivastav et al. Citation2014). Failure to revise design criteria in light of climate change effects on IDF relations may result in undersized infrastructure and increased flood risk (e.g. Mailhot et al. Citation2012). Urban drainage design practice would significantly benefit from the adoption of a comprehensive approach that considers all design storm event characteristics and their sensitivity to climate change and inherent uncertainties in existing IDF relations, as well as hydraulic design of sewer networks (Buttle and Lafleur Citation2007; Guo and Zhuge Citation2008). Such an approach should incorporate LID practices, and research should address (amongst other issues) the rainfall magnitudes and frequencies at which LID control needs to be supplemented by end-of-pipe practices such as stormwater ponds, as well as the ability of LID designs to function effectively in Canadian cities during the winter when soil freezing may limit water infiltration (Zimmer et al. Citation2007).
Human actions or inactions play an important role in both the changes of flood magnitude and frequency and the risk to society. Changes in land use also play an important and understudied role in changes in floods. Whether or not future floods increase in frequency or magnitude, Canadians need to recognize that continued development in floodplains and areas of urban development increase the risk and potential costs of flooding. The decisions that our society makes will determine if flooding is going to remain the most common and costliest natural disaster for Canadians.
Acknowledgements
The authors acknowledge the significant contributions of the many colleagues who have over the past decades provided the foundation for the study of floods in Canada. Carole Holt-Oduro (Alberta Environment and Parks) provided unpublished groundwater data, and Blair Birch (Town of Canmore) provided information regarding groundwater levels. The Hydrological Expertise Center of the Québec Department of Environment, Sustainable Development and Climate Change (https://www.cehq.gouv.qc.ca/, accessed 18 September 2014) was an important source of information regarding floods in Québec. We also express our thanks to the reviewers and editors for their suggestions.
References
- Ahmair, H., E. Blais, and J. Grehuk. 2016. The 2014 flood event in the Assiniboine River Basin: Causes, assessment and damages. Canadian Water Resources Journal.
- Alberta Transportation. 2004. Guidelines on extreme flood analysis. Civil Projects Branch, Transportation and Civil Engineering Division, Edmonton: Alberta Transportation, 87 pp. + appendices.
- Alila, Y. 2000. Regional rainfall depth-duration-frequency equations for Canada. Water Resources Research 36: 1767–1778.
- Ashton, G. D. 1986. River and lake ice engineering, 485. Littleton, CO: Water Resources Publications.
- Beltaos, S., and B. Burrell. 2010. Ice-jam model testing: Matapedia River case studies, 1994 and 1995. Cold Regions Science and Technology 60: 29–39.
- Beltaos, S., and B. C. Burrell. 2015. Hydroclimatic aspects of ice jam flooding near Perth-Andover, New Brunswick. Canadian Journal of Civil Engineering 42: 686–695.
- Blais, E., S. Clark, K. Dow, B. Rannie, T. Stadnyk, and L. Wazney. 2016. Background to flood control measures in the Red and Assiniboine River Basins. Canadian Water Resources Journal.
- Blais, E., J. Greshuk, and T. Stadnyk. 2016. The 2011 flood event in the Assiniboine River Basin: Causes, assessment and damages. Canadian Water Resources Journal.
- Bobanović, J., K. R. Thompson, S. Desjardins, and H. Ritchie. 2006. Forecasting storm surges along the east coast of Canada and the north-eastern United States: The storm of 21 January 2000. Atmosphere-Ocean 44: 151–161.
- Brooks, G.F., S. G. Evans, and J. J. Clague. 2001. Flooding. In A synthesis of natural geological hazards in Canada. Geological Survey of Canada Bulletin 548, ed. G.R.Brooks, 101–143. Ottawa: Geological Survey of Canada.
- Brown, D. M., G. A. McKay, and L. J. Chapman. 1968. The climate of southern Ontario. Climatological Studies No. 5. Toronto: Meteorological Branch, Department of Transport, 50 pp.
- Bruce, E. L. 1939. The Canadian Shield and its geographic effects. The Geographical Journal 93: 230–239. doi:10.2307/1788358.
- Burn, D. H., J. M. Cunderlik, and A. Pietroniro. 2004. Hydrological trends and variability in the Liard River basin. Hydrological Sciences Journal 49: 53–67.
- Burn, D. H., and P. H. Whitfield. 2016. Changes in floods and flood processes in Canada. Canadian Water Resources Journal.
- Buttle, J. M. 2011. Streamflow response to headwater reforestation in the Ganaraska River basin, southern Ontario, Canada. Hydrological Processes 25: 3030–3041.
- Buttle, J. M., and P. M. Lafleur. 2007. Anatomy of an extreme event: The July 14–15, 2004, Peterborough rainstorm. Canadian Water Resources Journal 32: 59–74.
- Byrne, J. M., A. Berg, and I. Townshend. 1999. Linking observed and general circulation model upper air circulation patterns to current and future snow runoff for the Rocky Mountains. Water Resources Research 35: 3793–3802.
- Caissie, D., and N.El-Jabi. 1993. Characterization of floods in Canada. In Extreme hydrological events: Precipitation, floods, and droughts. IAHS Publication No. 213, ed. Z. W.Kundzewicz, D. Rosbjerg, S. P. Simonovic, and K. Takeuchi, 325–332. Wallingford, UK; IAHS Pres.
- Caissie, D., and S. Robichaud. 2009. Towards a better understanding of the natural flow regimes and streamflow characteristics of rivers of the Maritime Provinces. Canadian Technical Report of Fisheries and Aquatic Sciences 2843, Ottawa: Fisheries and Oceans Canada, viii + 53 pp.
- Cantafio, L. J., and M. C. Ryan. 2014. Quantifying baseflow and water-quality impacts from a gravel-dominated alluvial aquifer in an urban reach of a large Canadian river. Hydrogeology Journal 22: 957–970.
- Carey, S. K., and M.-K. Woo. 1999. Hydrology of two slopes in subarctic Yukon, Canada. Hydrological Processes 13: 2549–2562.
- Castonguay, S. 2007. The production of flood as natural catastrophe: Extreme events and the construction of vulnerability in the drainage basin of the St. Francis River (Quebec), mid-nineteenth to mid-twentieth century. Environmental History 12: 820–844.
- Church, M. 1988. Floods in cold climates. In Flood geomorphology, eds. V.R. Baker, R.C. Kochel and P.C. Patton, 205–229. New York, NY: John Wiley.
- Cloutier, C.-A., T. Buffin-Bélanger, and M. Larocque. 2014. Controls of groundwater floodwave propagation in a gravelly floodplain. Journal of Hydrology 511: 423–431.
- Cogley, J. G., and S. B. McCann. 1976. An exceptional storm and its effects in the Canadian High Arctic. Arctic and Alpine Research 8: 105–110.
- Crawford, B., P. Chandler, M. Horita, L. Neil, B.Snyder, and B. Chan. 2000. Evaluation of the risk of erosion and flooding along coastal British Columbia. Paper presented at the 34th Annual CMOS Congress, Victoria, BC, 29 May to 2 June, 2000.
- Cunderlik, J. M., and T. M. B. J. Ouarda. 2009. Trends in the timing and magnitude of floods in Canada. Journal of Hydrology 375: 471–480.
- Danard, M., A. Munro, and T. Murty. 2003. Storm surge hazard in Canada. Natural Hazards 28: 407–434.
- Department of Environment and Lands. 1992. Water resources atlas of Newfoundland. St. John’s, NL: Water Resources Division, Government of Newfoundland and Labrador, 76 pp. + appendices.
- Desloges, J. R., and M. Church. 1992. Geomorphic implications of glacier outburst flooding: Noeick River valley, British Columbia. Canadian Journal of Earth Sciences 29: 551–564.
- Desloges, J. R., and J. S. Gardner. 1984. Process and discharge estimation in ephemeral channels, Canadian Rocky Mountains. Canadian Journal of Earth Sciences 21: 1050–1060.
- Dettinger, M. 2011. Climate change, atmospheric rivers, and floods in California: A multimodel analysis of storm frequency and magnitude changes. Journal of the American Water Resources Association 47: 514–523.
- Devito, K. J., I. F. Creed, and C. J. D. Fraser. 2005. Controls on runoff from a partially harvested, aspen-forested headwater catchment, Boreal Plain, Canada. Hydrological Processes 19: 3–25.
- Dingman, S. L. 2002. Physical hydrology. 2nd ed, 646. Upper Saddle River, NJ: Prentice-Hall.
- Dugan, H. A., S. F. Lamoureux, M. J. Lafreniere, and T. Lewis. 2009. Hydrological and sediment yield response to summer rainfall in a small high Arctic watershed. Hydrological Processes 23: 1514–1526.
- Dumanski, S., J. W. Pomeroy, and C. J. Westbrook. 2015. Hydrological regime changes in a Canadian Prairie basin. Hydrological Processes 29: 3893–3904. doi:0.1002/hyp.10567.
- Eaton, B., M. Church, and D. Ham. 2002. Scaling and regionalization of flood flows in British Columbia, Canada. Hydrological Processes 16: 3245–3263.
- Edwards, R. J. G. 1997. A review of hydrogeological studies for the Cardiff Bay Barrage. Quarterly Journal of Engineering Geology 30: 49–61.
- Elliott, J. A., B. M. Toth, R. J. Granger, and J. W. Pomeroy. 1998. Soil moisture storage in mature and replanted sub-humid boreal forest stands. Canadian Journal of Soil Science 78: 17–27.
- Essery, R., L. Li, and J. W. Pomeroy. 1999. Blowing snow fluxes over complex terrain. Hydrological Processes 13: 2423–2438.
- Fang, X., and J. W. Pomeroy. 2008. Drought impacts on Canadian prairie wetland snow hydrology. Hydrological Processes 22: 2858–2873.
- Fang, X., and J. W. Pomeroy. 2009. Modelling blowing snow redistribution to prairie wetlands. Hydrological Processes 23: 2557–2569.
- Fang, X., J. W. Pomeroy, C. J. Westbrook, X. Guo, A. G. Minke, and T. Brown. 2010. Prediction of snowmelt-derived streamflow in a wetland dominated prairie basin. Hydrology and Earth System Sciences 14: 991–1006.
- Fisheries and Environment Canada. 1978. The hydrological atlas of Canada. Ottawa: Natural Resources Canada.
- Ford, J. D. 1924. Floods in the southern parts of Alberta and Saskatchewan during 1923, 85. Calgary: Department of the Interior, Dominion Water Power Branch.
- Fortier, C., A. Assani, M. Mesfioui, and A. G. Roy. 2011. Comparison of the interannual and interdecadal variability of heavy flood characteristics upstream and downstream from dams in inversed hydrologic regime: Case study of the Matawin River (Québec, Canada). River Research and Applications 27: 1277–1289.
- Geertsema, M., and J. J. Clague. 2005. Jokulhlaups at Tulsequah Glacier, northwestern British Columbia. The Holocene 15: 310–316.
- Gerard, R. L., and K. S. Davar. 1995. Introduction. In River ice jams, ed. S. Beltaos, 1–28. Highlands Ranch CO: Water Resources Publications.
- Gingras, D., and K. Adamowski. 1995. The impact of El Nino Southern Oscillation on central Canadian floods and droughts. Canadian Journal of Civil Engineering 22: 834–837.
- Gingras, D., K. Adamowski, and P. J. Pilon. 1994. Regional flood equations for the provinces of Ontario and Quebec. Water Resources Bulletin 30: 55–67.
- Godwin, R. B., and F.R.J.Martin. 1975. Calculation of gross and effective drainage areas for the Prairie Provinces. In Proceedings of the Canadian Hydrology Symposium–1975, Winnipeg, Manitoba, 11–14 August 1975, 219–223. Ottawa: National Research Council of Canada.
- Gouvernement du Québec. 2003. Vegetation zones and bioclimatic domains in Québec. http://www.mern.gouv.qc.ca/english/publications/forest/publications/zone-a.pdf (accessed September, 2015).
- Granger, R. J., and D. M. Gray. 1989. Evaporation from natural non-saturated surfaces. Journal of Hydrology 111: 21–29.
- Granger, R. J., D. M. Gray, and G. E. Dyck. 1984. Snowmelt infiltration to frozen prairie soils. Canadian Journal of Earth Sciences 21: 669–677.
- Granger, R. J., and J. W. Pomeroy. 1997. Sustainability of the western Canadian boreal forest under changing hydrological conditions. 2: Summer energy and water use. In Sustainability of water resources under increasing uncertainty. IAHS Publication No. 240, ed. D. Rosjberg, N. Boutayeb, A. Gustard, Z. Kundzewicz, and P. Rasmussen, 243–250. Wallingford, UK: IAHS Press.
- Gray, D. M. 1970. Handbook on the principles of hydrology: With special emphasis directed to Canadian conditions in the discussions, applications and presentation of data, 591. New York: Water Information Center.
- Gray, D. M., P. G. Landine, and R. J. Granger. 1985. Simulating infiltration into frozen Prairie soils in stream flow models. Canadian Journal of Earth Sciences 22: 464–474.
- Gray, D. M., J. W. Pomeroy, and R. J. Granger. 1986. Prairie snowmelt runoff. In Proceedings, water research themes, conference commemorating the official opening of the National Hydrology Research Centre, 49–68. Saskatoon: Canadian Water Resources Association.
- Gray, D. M., and T. D. Prowse. 1993. Snow and floating ice. In Handbook of hydrology, ed. D. R. Maidment, 7.1–7.58. New York: McGraw–Hill.
- Guo, Y., and Z. Zhuge. 2008. Analytical probabilistic flood routing for urban stormwater management purposes. Canadian Journal of Civil Engineering 35: 487–499.
- Hall, M. J. 1984. Urban Hydrology, 299. London: Elsevier.
- Harder, P., J. W. Pomeroy, and C. J. Westbrook. 2015. Hydrological resilience of a Canadian Rockies headwaters basin subject to changing climate, extreme weather, and forest management. Hydrological Processes. 29: 3905–3924. doi:10.1002/hyp.10596.
- Harper, J. R., R. F. Hernry, and G. G. Stewart. 1988. Maximum storm surge elevations in the Tuktoyaktuk region of the Canadian Beaufort Sea. Arctic 41: 48–52.
- Hayashi, M., G. van der Kamp, and R. Schmidt. 2003. Focused infiltration of snowmelt water in partially frozen soil under small depressions. Journal of Hydrology 270: 214–229.
- Hogg, W. D., and D. A. Carr. 1985. Rainfall frequency atlas for Canada. Ottawa: Canadian Government Publishing Centre.
- Hoover, O. H. 1929. Floods in southern Alberta and Saskatchewan during 1929, 89. Calgary: Department of the Interior, Dominion Water Power and Reclamation Service.
- Hudon, C. 1997. Impact of water level fluctuations on St. Lawrence River aquatic vegetation. Canadian Journal of Fisheries and Aquatic Sciences 54: 2853–2865.
- Hughes, A. G., T. Vounaki, D. W. Peach, A. M. Ireson, C. R. Jackson, A. P. Butler, J. P. Bloomfield, J. Finch, and H. S. Wheater. 2011. Flood risk from groundwater: Examples from a Chalk catchment in southern England. Journal of Flood Risk Management 4: 143–155.
- Huntington, T. G. 2006. Evidence for intensification of the global water cycle: Review and synthesis. Journal of Hydrology 319: 83–95.
- Institute for Catastrophic Loss Reduction. 2012. Telling the weather story. Report prepared for the Insurance Bureau of Canada. Toronto, ON: Institute for Catastrophic Loss Reduction, 67 pp.
- Irvine, K. N., and J. J. Drake. 1987. Spatial analysis of snow- and rain-generated highflows in southern Ontario. The Canadian Geographer 31: 140–149.
- Irwin, R. W., and H. R. Whiteley. 1983. Effects of land drainage on stream flow. Canadian Water Resources Journal 8: 88–103.
- Jacobs GIBB Ltd. 2006. Making space for water: Groundwater flood records collation, monitoring and risk assessment, extended report (chalk aquifers). Technical Report HA5. Bristol: Environment Agency, 110 pp.
- Jakob, M., and M. Church. 2011. The trouble with floods. Canadian Water Resources Journal 36: 287–292.
- Jakob, M., J.J.Clague, and M.Church. 2016. Rare and dangerous: Recognizing extraordinary events in stream channels. Canadian Water Resources Journal.
- Jakob, M., and P. Jordan. 2001. Design flood estimates in mountain streams the need for a geomorphic approach. Canadian Journal of Civil Engineering 28: 425–439.
- Javelle, P., T. B. M. J. Ouarda, and B. Bobée. 2003. Spring flood analysis using the flood-duration–frequency approach: Application to the provinces of Quebec and Ontario, Canada. Hydrological Processes 17: 3717–3736.
- Jordan, P., and S. A. Covert. 2009. Debris flows and floods following the 2003 wildfires in southern British Columbia. Environmental & Engineering Geoscience 15: 217–234.
- Jung, M., T. P. Burt, and P. D. Bates. 2004. Toward a conceptual model of floodplain water table response. Water Resources Research 40: doi:10.1029/2003WR002619.
- Kane, D. L., L. D. Hinzman, R. E. Gieck, J. P. McNamara, E. K. Youcha, and J. A. Oatley. 2008. Contrasting extreme runoff events in areas of continuous permafrost, Arctic Alaska. Hydrology Research 39: 287–298.
- Kane, D. L., J. P. McNamara, D. Yan, P. Q. Olsson, and R. E. Gieck. 2003. An extreme rainfall/runoff event in Arctic Alaska. Journal of Hydrometeorology 4: 1220–1228.
- Kovacs, P., S. Guilbault, and D. Sandink. 2014. Cities adapt to extreme rainfall: Celebrating local leadership, 104. Toronto: Institute for Catastrophic Loss Reduction.
- Kunkel, K. E., K. Andsager, and D. R. Easterling. 1999. Long-term trends in extreme precipitation events over the conterminous United States and Canada. Journal of Climate 12: 2515–2527.
- LaBaugh, J. W., T. C. Winter, and D. O. Rosenberry. 1998. Hydrologic functions of prairie wetlands. Great Plains Research 8: 17–37.
- Leclerc, M., and Y. Secretan. 2016. La crue exceptionnelle du Saguenay en 1996 et ses conséquences géomorphologiques [The huge 1996 Saguenay flood: Geomorphological consequences]. Canadian Water Resources Journal.
- Leith, R. M., and P. H. Whitfield. 2000. Some effects of urbanization on streamflow records in a small watershed in the lower Fraser Valley, BC. Northwest Science 74: 69–75.
- Leopold, L. B. 1968. Hydrology for urban land planning: A guidebook on the hydrologic effects of urban land use. United States Geological Survey Circular 554. Washington, DC: United States Geological Survey, 18 pp.
- Lesack, L. F. W., and P. Marsh. 2010. River-to-lake connectivities, water renewal, and aquatic habitat diversity in the Mackenzie River Delta. Water Resources Research 46: W12504. doi:10.1029/2010WR009607.
- Loukas, A., L. Vasiliades, and N. R. Dalezios. 2000. Flood producing mechanisms identification in southern British Columbia, Canada. Journal of Hydrology 227: 218–235.
- Lyle, T., and T. Mills. 2016. Assessing Coastal Flood Risk in a Changing Climate for the City of Vancouver. Canadian Water Resources Journal doi.
- MacNider-Taylor, S., S. T. Buffin-Bélanger, D. Arseneault, and B. Hétu. 2009. On the use of dendrochronology to analyze ice jam occurrences at a fluvial transition on the Ouelle River, Quebec. In Proceedings of the 15th Workshop on the Hydraulics of Ice Covered Rivers, ed. S. Beltaos, 284–299. St. John's: Committee on River Ice Processes and the Environment.
- Mailhot, A., I. Beauregard, G. Talbot, D. Caya, and S. Biner. 2012. Future changes in intense precipitation over Canada assessed from multi-model NARCCAP ensemble simulations. International Journal of Climatology 32: 1151–1163.
- Marsalek, J., and H. Schreier. 2009. Overview of the theme issue. Innovation in stormwater management in Canada: The way forward. Water Quality Research Journal of Canada 44: v–x.
- Marsalek, J., and W. E. Watt. 1984. Design storms for urban drainage design. Canadian Journal of Civil Engineering 11: 574–584.
- Marsh, P., and L. F. W. Lesack. 1996. The hydrologic regime of perched lakes in the Mackenzie Delta: Potential responses to climate change. Limnology and Oceanography 41: 849–856.
- Marsh, P., and J. W. Pomeroy. 1996. Meltwater fluxes at an arctic forest–tundra site. Hydrological Processes 10: 1383–1400.
- Marsh, P., and T. Schmidt. 1993. Influence of a Beaufort Sea storm surge on channel levels in the Mackenzie Delta. Arctic 46: 35–41.
- Martin, F. R. J. 2001. Addendum no. 8 to Hydrology Report #104. Regina: Agriculture and Agri-Food Canada PFRA Technical Service, 109 pp.
- McCabe, G. J., L. E. Hay, and M. P. Clark. 2007. Rain-on-snow events in the western United States. Bulletin of the American Meteorological Society 88: 319–328.
- McRae, R., and S. Watt. 2006. Great Lakes hazard planning: Experience from southeastern Ontario. The Great Lakes Geographer 13: 1–13.
- Mekis, É., and W. D. Hogg. 1999. Rehabilitation and analysis of Canadian daily precipitation time series. Atmosphere-Ocean 37: 53–85.
- Melone, A. M. 1985. Flood producing mechanisms in coastal British Columbia. Canadian Water Resources Journal 10: 46–64.
- Milrad, S., E. H. Atallah, and J. R. Gyakum. 2009. Dynamical and precipitation structures of poleward-moving tropical cyclones in eastern Canada, 1979–2005. Monthly Weather Review 137: 836–851.
- Milrad, S., J. Gyakum, and E. Atallah. 2015. A meteorological analysis of the 2013 Alberta Flood: Antecedent large-scale flow pattern and synoptic-dynamic characteristics. Monthly Weather Review 143: 2817–2841.
- Moin, S. M. A., and M. A. Shaw. 1985. Regional flood frequency analysis for Ontario streams. Volume 1. Single station analysis and index method. Burlington: Canada/Ontario Flood Damage Reduction Program, Water Planning and Management Branch, Inlands Waters Directorate, Environment Canada, 126 pp. + appendices.
- Monk, W. A., D. L. Peters, R. A. Curry, and D. J. Baird. 2011. Quantifying trends in indicator hydroecological variables for regime-based groups of Canadian rivers. Hydrological Processes 25: 3086–3100.
- Moore, R. D., A. S. Hamilton, and J. Scibek. 2002. Winter streamflow variability, Yukon Territory, Canada. Hydrological Processes 16: 763–778.
- Morgan, A., B. Branfireun, and F. Csillag. 2004. An evaluation of the contributions of urbanization and climatic change to runoff characteristics in the Laurel Creek watershed, Ontario. Canadian Journal of Water Resources 29: 171–182.
- Mortsch, L., S. Cohen, and G. Koshida. 2015. Climate and water availability indicators in Canada: Challenges and a way forward. Part II – Historic trends. Canadian Water Resources Journal 40: 146–159.
- Murty, T. S., S. Venkatesh, M. B. Danard, and M. I. El-Sabh. 1995. Storm surges in Canadian waters. Atmosphere-Ocean 33: 359–387.
- Neiman, P. J., L. J. Schick, F. M. Ralph, M. Hughes, and G. A. Wick. 2013. Flooding in western Washington: The connection to atmospheric rivers. Journal of Hydrometeorology 12: 1337–1358.
- Newbury, R. W., G. K. McCullough, and R. E. Hecky. 1984. The Southern Indian Lake impoundment and Churchill River diversion. Canadian Journal of Fisheries and Aquatic Sciences 41: 548–557.
- Newton, B., and B. C. Burrell. 2016. The April–May 2008 flood event in the Saint John River basin: Causes, assessment and damages. Canadian Water Resources Journal.
- Ontario Ministry of Natural Resources. 1984. Water quantity resources of Ontario, 71. Toronto: Ontario Ministry of Natural Resources.
- Osborn, J., and C. Ryan. 2014. Ironies and issues float to surface after great flood. Calgary Herald, 2 May, p. A13.
- Ouranos. 2010. Québec’s climate and projected changes. http://adaptation.ouranos.ca/en/adaptation/portrait/climate/ (accessed September, 2015).
- Peck, A., P. Prodanovic, and S. P. Simonovic. 2012. Rainfall intensity duration frequency curves under climate change: City of London, Ontario, Canada. Canadian Water Resources Journal 37: 177–189.
- Peters, D., D. Caissie, W. A. Monk, S. B. Rood, and A. St-Hilaire. 2016. An ecological perspective on floods in Canada. Canadian Water Resources Journal.
- Peters, D., T. D. Prowse, A. Pietroniro, and R. Leconte. 2006. Flood hydrology of the Peace-Athabasca delta, northern Canada. Hydrological Processes 20: 4073–4096.
- Pietroniro, A., R. Halliday, N. Kouwen, D. H. Burn, C. Lin, and S.Figliuzzi. 2004. Floods. In Threats to water availability in Canada, ed. Ottawa: Environment Canada, 27–33.
- Pietroniro, A., T. Prowse, L. Hamlin, N. Kouwen, and R. Soulis. 1996. Application of a grouped response unit hydrological model to a northern wetland region. Hydrological Processes 10: 1245–1261.
- Pohl, S., and P. Marsh. 2006. Modelling the spatial–temporal variability of spring snowmelt in an arctic catchment. Hydrological Processes 20: 1773–1792.
- Pomeroy, J. W., and R. J. Granger. 1997. Sustainability of the western Canadian boreal forest under changing hydrological conditions. I: Snow accumulation and ablation. In Sustainability of water resources under increasing uncertainty. IAHS Publication No. 240, ed. D. Rosjberg, N. Boutayeb, A. Gustard, Z. Kundzewicz, and P. Rasmussen, 237–242. Wallingford, UK; IAHS Press.
- Pomeroy, J. W., R. J. Granger, A. Pietroniro, J. E. Elliott, B. Toth, and N. Hedstrom. 1997a. Hydrological pathways in the Prince Albert model forest: Final report. NHRI Contribution Series No. CS-97007, 153 pp. + appendices. Prince Albert, SK: Prince Albert Model Forest Association.
- Pomeroy, J. W., D. M. Gray, N. R. Hedstrom, and J. R. Janowicz. 2002. Physically based estimation of seasonal snow accumulation in the boreal forest. Proceedings of the Eastern Snow Conference 58: 93–108.
- Pomeroy, J. W., P. Marsh, and D. M. Gray. 1997. Application of a distributed blowing snow model to the Arctic. Hydrological Processes 11: 1451–1464.
- Pomeroy, J. W., J. Parviainen, N. Hedstrom, and D. M. Gray. 1998. Coupled modelling of forest snow interception and sublimation. Proceedings of the Eastern Snow Conference 55: 101–114.
- Pomeroy, J. W., K. R. Shook, X. Fang, S. Dumanski, C. Westbrook, and T. Brown. 2014. Improving and testing the Prairie Hydrological Model at Smith Creek Research Basin. Centre for Hydrology Report No. 14, 102 pp. Saskatoon, SK: Centre for Hydrology, University of Saskatchewan.
- Pomeroy, J. W., R. Stewart, and P. H. Whitfield. 2016. The 2013 flood event in the Bow and Oldman River basins: Causes, assessment, and damages. Canadian Water Resources Journal doi.
- Pomeroy, J. W., B. Toth, R. J. Granger, N. R. Hedstrom, and R. L. H. Essery. 2003. Variation in surface energetics during snowmelt in complex terrain. Journal of Hydrometeorology 4: 702–716.
- Prevost, M., R. Barry, J. Stein, and A. Plamondon. 1991. Snowmelt modelling in a balsam fir forest: Comparison between an energy balance model and other simplified models. Canadian Journal of Forest Research 21: 1–10.
- Prowse, T. D., and T. C. Carter. 2002. Significance of ice-induced storage to spring runoff: A case study of the Mackenzie River. Hydrological Processes 16: 779–788.
- Prowse, T. D., C. Furgal, B. R. Bonsal, and D. L. Peters. 2009. Climate impacts on northern Canada: Regional background. Ambio 38: 248–256.
- Public Safety Canada. 2014. The Canadian Disaster Database. http://www.publicsafety.gc.ca/cnt/rsrcs/cndn-dsstr-dtbs/index-eng.aspx (accessed March, 2014).
- Rannie, B. 2016. The 1997 flood event in the Red River basin: Causes, assessment, and damage. Canadian Water Resources Journal.
- Riboust, P., and F. Brissette. 2016. Analysis of Lake Champlain/Richelieu River’s historical 2011 flood. Canadian Water Resources Journal doi.
- Roberge, A., J. R. Gyakum, and E. H. Atallah. 2009. Analysis of intense poleward water vapor transports into high latitudes of western North America. Weather and Forecasting 24: 1732–1747.
- Robins, N. S., and J. W. Finch. 2012. Groundwater flood or groundwater-induced flood? Quarterly Journal of Engineering Geology and Hydrogeology 45: 119–122.
- Roehr, D., and Y. Kong. 2010. Runoff reduction effects of green roofs in Vancouver, BC, and Shanghai, PR China. Canadian Water Resources Journal 35: 53–68.
- Rood, S. B., L. A. Goater, J. M. Mahoney, C. M. Pearce, and D. G. Smith. 2007. Floods, fire, and ice: Disturbance ecology of riparian cottonwoods. Canadian Journal of Botany 85: 1019–1032.
- Roy, E., J. Rousselle, and J. Lacroix. 2003. Flood Reduction Program (FRDP) in Québec. Case study of the Chaudière River. Natural Hazards 28: 387–345.
- Saad, C. 2014. Analyse hydrométéorologique multivariée et modélisation déterministe des crues de la rivière Richelieu. Mémoire de maîtrise, INRS-ETE: Québec . 146 pp.
- Saad, C., A. St-Hilaire, P. Gachon, and S. El Adlouni. 2016. The 2011 flood event in the Richelieu River basin: Causes, assessment and damages. Canadian Water Resources Journal.
- Sandink, D., P. Kovacs, G. Oulahen, and G. McGillivray. 2010. Making floods insurable for Canadian homeowners: A discussion paper. Toronto: Institute for Catastrophic Loss Reduction & Swiss Reinsurance Company.
- Sangal, B. P., and R. W. Kallio. 1977. Magnitude and frequency of floods in southern Ontario. Technical Bulletin Series No. 99. Ottawa: Water Planning and Management Branch, Inland Waters Directorate, 336 pp.
- Shook, K. 2016. The 2005 flood events in the Saskatchewan River Basin: Causes, assessment and damages. Canadian Water Resources Journaldoi.
- Shook, K., and J. W. Pomeroy. 2012. Changes in the hydrological character of rainfall on the Canadian prairies. Hydrological Processes 26: 1752–1766.
- Shook, K., J. W. Pomeroy, C. Spence, and L. Boychuk. 2013. Storage dynamics simulations in prairie wetland hydrology models: Evaluation and parameterization. Hydrological Processes 27: 1875–1889.
- Shook, K., J. Pomeroy, and G. van der Kamp. 2015. The transformation of frequency distributions of winter precipitation to spring streamflow probabilities in cold regions: Case studies from the Canadian Prairies. Journal of Hydrology 521: 395–409.
- Smirnov, V. V., and G. W. K. Moore. 2001. Short-term and seasonal variability of the atmospheric water vapor transport through the Mackenzie River basin. Journal of Hydrometeorology 2: 441–452.
- Smith, D. G. 1980. River ice processes: Thresholds and geomorphologic effects in northern and mountain rivers. In Thresholds in Geomorphology, eds. D.R. Coates and J.D. Vitek, 323–343. London: Allen and Unwin.
- Spence, C. 2010. A paradigm shift in hydrology: Storage thresholds across scales influence catchment runoff generation. Geography Compass 4 (7): 819–833.
- Spry, C. M., K. E. Kohfeld, D. M. Allen, D. Dunkley, and K. Lertzman. 2014. Characterizing Pineapple Express storms in the Lower Mainland of British Columbia, Canada. Canadian Water Resources Journal 39: 302–323.
- Srivastav, R. K., A. Schardong, and S. P. Simonovic. 2014. Equidistance quantile matching method for updating IDF curves under climate change. Water Resources Management 28: 2539–2562. doi:10.1007/s11269-014-0626-y.
- Stadnyk, T., K. Dow, L. Wazney, and E. Blais. 2016. The 2011 flood event in the Red River Basin: Causes, assessment and damages. Canadian Water Resources Journal doi.
- Statistics Canada. 2014. Population, urban and rural, by province and territory (Canada). http://www.statcan.gc.ca/tables-tableaux/sum-som/l01/cst01/demo62a-eng.htm (accessed March, 2015).
- St-Laurent, D., M. Mesfioui, and G. Evin. 2009. Hydroclimatic variability and relation with flood events (Southern Québec, Canada). Water Resources 36: 43–56.
- Stone, D. A., A. J. Weaver, and F. W. Zwiers. 2000. Trends in Canadian precipitation intensity. Atmosphere-Ocean 38: 321–347.
- Toop, D. C., and N. N.de la Cruz. 2002. Hydrogeology of the Canmore Corridor and Northwestern Kananaskis Country, Alberta. Report to Western Economic Partnership Agreement, Western Economic Diversification Canada. Edmonton: Alberta Environment, Hydrogeology Section.
- Trebitz, A. S. 2006. Characterizing seiche and tide-driven daily water level fluctuations affecting coastal ecosystems of the Great Lakes. Journal of Great Lakes Research 32: 102–116.
- Urquizo, N., J. Bastedo, T. Bridges, and H. Shear, ed. 2000. Ecological assessment of the Boreal Shield ecozone. Indicators and Assessment Office, Environmental Conservation Service. Ottawa: Environment Canada, 71 pp.
- van der Kamp, G., and M. Hayashi. 2009. Groundwater–wetland ecosystem interaction in the semiarid glaciated plains of North America. Hydrogeology Journal 17: 203–214.
- van der Kamp, G., M. Hayashi, and D. Gallen. 2003. Comparing the hydrology of grassed and cultivated catchments in the semi-arid Canadian prairies. Hydrological Processes 17: 559–575.
- Viviroli, D., B. Schädler, P. Schmocker-Fackel, M. Weiler, and J. Seibert. 2012. On the risk of obtaining misleading results by pooling streamflow data for trend analyses. Water Resources Research 48: doi:10.1029/2011WR011690.
- von de Wall, S. 2011. An assessment of the river ice break-up season in Canada. M.Sc. thesis, Department of Geography, University of Victoria, British Columbia.
- von de Wall, S., L. P. de Rham, and T. D. Prowse. 2009. Open water and ice-induced extreme water levels on Canadian rivers. In Proceedings of the 17th International Northern Research Basins Symposium and Workshop, Iqaluit-Pangnirtung-Kuujjaq, NU, August 12-18, 2009, ed. K. L. Young, and W. Quinton, 337–347. Toronto: York University.
- von de Wall, S., L. P. de Rham, and T. D. Prowse. 2010. The river ice break-up season in Canada: Variations in water levels and timing. Proceedings of the Eastern Snow Conference 67: 5–15.
- Waller, D. H. 1976. Problems and possibilities in urban drainage. Canadian Journal of Civil Engineering 3: 392–401.
- Water Survey of Canada (WSC). 2014. Archived hydrometric database. http://www.wsc.ec.gc.ca/applications/H2O/ (accessed July, 2014).
- Watt, W. E., K. W. Lathem, C. R. Neill, T. L. Richards, and J. Rousselle (ed). 1989. Hydrology of floods in Canada: A guide to planning and design. Ottawa: National Research Council of Canada. 245 pp.
- Watt, W. E., and J. Marsalek. 2013. Critical review of the evolution of the design storm event concept. Canadian Journal of Civil Engineering 40: 105–113.
- Wazney, L., and S. P. Clark. 2016. The 2009 flood event in the Red River Basin: Causes, assessment and damages. Canadian Water Resources Journal doi.
- Webster, T. L., D. L. Forbes, S. Disckie, and R. Shreenan. 2004. Using topographic LiDAR to map flood risk from storm-surge events for Charlottetown, Prince Edward Island, Canada. Canadian Journal of Remote Sensing 30: 64–76.
- Webster, T. L., D. L. Forbes, E. MacKinnon, and D. Roberts. 2006. Flood-risk mapping for storm-surge events and sea-level rise using LiDAR for southwest New Brunswick. Canadian Journal of Remote Sensing 32: 194–211.
- Whitfield, P. H. 2012. Floods in future climates: A review. Journal of Flood Risk Management 5: 336–365.
- Whitfield, P. H., J. Y. Wang, and A. J. Cannon. 2003. Modelling future streamflow extremes: Floods and low flows in Georgia Basin, British Columbia. Canadian Water Resources Journal 28: 633–656.
- Woo, M.-K. 1983. Hydrology of a drainage basin in the Canadian High Arctic. Annals of the Association of American Geographers 73: 577–596.
- Woo, M.-K., D. L. Kane, S. K. Carey, and D. Yang. 2008. Progress in permafrost hydrology in the new millennium. Permafrost and Periglacial Processes 19: 237–254.
- Woo, M.-K., and C. Liu. 1994. Mountain hydrology of Canada and China: A case study in comparative hydrology. Hydrological Processes 8: 573–587.
- Woo, M.-K., and J. Sauriol. 1980. Channel development in snow-filled valleys, Resolute, NWT, Canada. Geografiska Annaler 62A: 37–56.
- Woo, M.-K., and P. R. Waylen. 1984. Areal prediction of annual floods generated by two distinct processes. Hydrological Sciences Journal 29: 75–88.
- Woo, M.-K., and K. L. Young. 2006. High Arctic wetlands: Their occurrence, hydrological characteristics, and sustainability. Journal of Hydrology 320: 432–450.
- Xiong, S. Y., Z. X. Xiong, and P. W. Wang. 1996. Soil salinity in the irrigated area of the yellow river in Ningxia, China. Arid Soil Research and Rehabilitation 10: 95–101.
- Zhang, X., W. D. Hogg, and É. Mekis. 2001. Spatial and temporal characteristics of heavy precipitation events over Canada. Journal of Climate 14: 1923–1936.
- Zhang, X., L. A. Vincent, W. D. Hogg, and A. Niitsoo. 2000. Temperature and precipitation trends in Canada during the 20th century. Atmosphere-Ocean 38: 395–429.
- Zimmer, C. A., I. W. Heathcote, H. R. Whiteley, and H. Schroeter. 2007. Low-impact-development practices for stormwater: Implications for urban hydrology. Canadian Water Resources Journal 32: 193–212.
- Zwiers, F. W., and V. V. Kharin. 1998. Changes in the extremes of the climate simulated by CCC GCM2 under CO2 doubling. Journal of Climate 11: 2200–2222.