
 ?Mathematical formulae have been encoded as MathML and are displayed in this HTML version using MathJax in order to improve their display. Uncheck the box to turn MathJax off. This feature requires Javascript. Click on a formula to zoom.
Abstract
Building silt storage dams is an important measure to control soil erosion. Sensitivity analysis of the parameters in a deep learning model is the premise of extracting high-precision silt storage dams from high-resolution remote sensing (RS) images. In this study, watershed features of Hulu River and Lanni River in the Loess Plateau, China, are extracted using a geographic information system and digital elevation model. The detection of silt storage dams using the U-Net model considered three high-resolution RS image datasets to evaluate the effect of different input sizes, batch sizes, and sample sizes on accuracies of silt storage dams. The results show that a large input size, batch size, and sample size can improve the accuracy of silt storage dams extracted by U-Net. U-Net with Dataset 3, input size of 576 × 576, and batch size of 4 achieved an overall accuracy of 96.26%, F1 score of 70.61%, mean intersection over union of 75.33%, training time of 485 ms/step, minimum noises and shadow, and clear outlines of silt storage dams. This study provides theoretical and practical decision-making for the planning, construction, and maintenance of silt storage dams, as well as ecological protection and high-quality development of the Yellow River Basin.
RÉSUMÉ
La construction d’un barrage de retenue en limon est une mesure importante de lutte contre l’érosion. L'analyse de sensibilité des paramètres d‘un modèle d‘apprentissage profond est la condition préalable à l‘extraction précise des barrages de retenue en limon à partir d‘images haute résolution. Dans cette étude, les caractéristiques des bassins versants des rivières Hulu et Lanni sur le plateau de Loess, en Chine, sont extraites à l‘aide d‘un système d‘information géographique et d‘un modèle numérique d‘altitude. La détection des barrages de retenue à l‘aide du modèle U-Net a été appliquée sur trois ensembles d‘images haute résolution pour évaluer l‘effet de différentes tailles d‘entrées et du nombre de lots et d‘échantillons sur la précision des extractions des barrages. Les résultats montrent qu’une grande taille d‘entrées, un grand nombre de lots et d‘échantillons peuvent améliorer la précision des extractions des barrages par U-Net. Avec le jeu de données #3, une taille d‘entrées de 576 × 576 pixels et un nombre de lots de 4, le réseau U-Net a atteint une précision globale de 96,26%, un score F1 de 70,61%, une intersection moyenne sur l‘union de 75,33%, un temps d‘apprentissage de 485 ms/étape, un minimum de bruits et d‘ombres, et des contours clairs des barrages de retenue. Cette étude fournit une prise de décision théorique et pratique pour la planification, la construction et l‘entretien des barrages de retenue en limon, ainsi que pour la protection écologique et le développement durable du bassin du fleuve Jaune.
Introduction
Silt storage dams are built for retaining mud, silting land, water storage, and construction of farmland in all levels of ditches in areas with severe soil erosion (Chen et al. Citation2020). China has built various large, medium, and small silt storage dams in the Loess Plateau to control soil erosion (Fang Citation2021). China will invest 17.4 billion CNY from 2021 to 2025 to build 1461 new silt storage dams, 2559 sediment storage dams, and slope cropland of 2.71 × 10⁴ ha (Guo et al. Citation2020). Therefore, it is necessary to study the number, location, and spatial layout of existing silt storage dams for further planning, design, and construction of new silt storage dams to achieve the construction target of silt storage dams from 2021 to 2025 in China.
Locations and shapes of silt storage dams can be extracted from remote sensing (RS) images using several methods, such as artificial visual interpretation, minimum distance classification, and maximum likelihood classification (Mhiret et al. Citation2020). However, it is difficult to extract silt storage dams using low and medium-resolution RS images due to the small area of most silt storage dams and the slight difference in their surrounding color and texture (Rafiee et al. Citation2013; Kang et al. Citation2019; Li et al. Citation2021). Silt storage dams can be effectively identified and segmented using high-resolution RS images, such as Google Earth, IKONOS, SPOT5, and low-altitude unmanned aerial vehicles (UAVs). The image segmentation methods mainly include Bayesian classification, RGB-HSI fusion, neural network, edge detection segmentation, pixel segmentation, threshold segmentation, fuzzy C-means segmentation, unsupervised segmentation, and object-oriented multiscale segmentation (Pal and Mather Citation2005; Yousefi et al. Citation2016). These methods improve the segmentation accuracy of ground objects (Wang et al. Citation2020; Pi et al. Citation2021). However, they have disadvantages, such as low calculation efficiency, misclassifications, and weak generalization ability (Pradhan et al. Citation2020).
Deep learning methods have been widely used in image classification, target detection, and image segmentation (Paoletti et al. Citation2018). It can extract high-accuracy ground objects from high-resolution RS images. Deep learning models mainly include deep belief network, convolutional neural network (CNN), stacked auto encoder, and generative adversarial networks (Badrinarayanan et al. Citation2017; Chen et al. Citation2018). These models can implement semantic segmentation in complex scenes.
A deep learning model has many parameters, such as the learning rate, attenuation factor, number of hidden layers, weight, step size, regularization coefficient, image input size, batch size, and sample size (Shamsolmoali et al. Citation2019). Some parameters are sensitive and uncertain, and interact with their boundary conditions. Slight changes in the values of parameters might cause large fluctuations and uncertainty in the performance of a deep learning model due to different study scales, image resolutions, and object types (Yang et al. Citation2021). Therefore, it is necessary to analyze the sensitivity of parameters before using a deep learning model to extract silt storage dams.
Parameter sensitivity analysis, including local and global analyses, involves adjusting the values of input parameters to identify and screen parameters that substantially affect the output results for the control of uncertainty caused by parameters. Local sensitivity analysis involves studying the effect of the change in a single input variable (other variables remain unchanged) on the output results. Global sensitivity analysis involves studying the effect of simultaneous changes in multiple input variables on the output results.
Much attention has been paid to the sensitivity of certain parameters of deep learning, such as learning rate (Kussul et al. Citation2017). The training process will fluctuate if the learning rate is too large; in contrast, convergence speed will be reduced if the learning rate is too low. Attenuation strategies of learning rate, such as polynomial, cosine, and exponential attenuations, are generally used to balance the relationship between too large and too small learning rates (Wang et al. Citation2015). However, less attention is paid to the effect of other parameters, such as input size, batch size, and sample size on the accuracy of ground object extraction.
Very large sample size in a training set can lead to a considerable calculation and gradient difference. In contrast, a very small sample size can lead to overfitting, weak generalization ability, and poor segmentation accuracy (Zhang et al. Citation2020). In addition, a very large batch size affects the direction of gradient descent and training speed, resulting in the overflow, memory crash of a single machine, gradient disappearance, and gradient explosion. The mini-batch gradient descent and momentum methods are used to make the gradient direction in iteration consistent with the optimal direction of the whole training set to make the full use of the computing and parallel abilities of a computer (Zhu Citation2021).
There is no specific formula to calculate the parameters, so it is impossible to obtain the best parameter configuration at one time. A satisfactory combination of parameters can be obtained after trial and error to adjust the values of parameters according to the dataset scale, calculation capacity, and experience, which is time-consuming and laborious.
The watersheds of Hulu River and Lanni River in Xiji County, Ningxia, China, were selected for this study. Many silt storage dams are constructed in the watersheds due to severe soil erosion. Three different datasets of RS images containing silt storage dams were constructed according to the Google images with a ground resolution of 0.54 m and digital elevation model (DEM) with 12 m resolution. The DEM and Google images were reconciled using a resampling method for their same resolution and an ortho-rectification method for their high-accuracy registration. Watershed features were extracted using a geographic information system (GIS) and RS. A U-Net model was constructed based on the TensorFlow framework. Local sensitivity analysis was conducted to obtain the optimal parameter combination and high-accuracy silt storage dams. The sensitivity of accuracy of silt storage dams extracted by U-Net from RS images was evaluated according to different input sizes, patch sizes, and sample sizes. The results provide theoretical and practical decision making for the parameter optimization of deep learning, extraction, planning, construction, and maintenance of silt storage dams, as well as ecological conservation and high-quality development of the Yellow River Basin.
Materials and methods
Study area and data processing
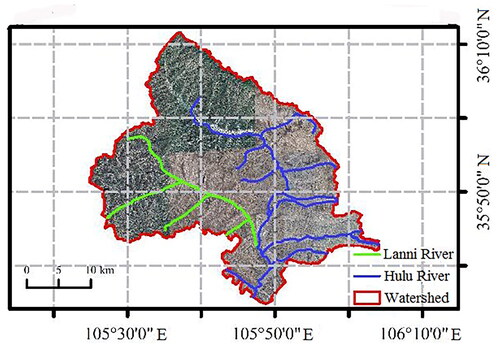
The watersheds of Hulu River and Lanni River in Xiji County, Ningxia, China, were selected as the study area to extract silt storage dams (). The study area is located in the south of Ningxia, with a longitude of 105°25′–106°04′E and latitude of 35°33′–36°12′N. The watersheds belong to temperate continental monsoon climate with an annual average precipitation of 570.2 mm. Hulu River and Lanni River are the tributaries of Yellow River, with an annual runoff of about 180 million m3. The watersheds are located in the west of the Loess Plateau with a total drainage area of 1957.4 km2 and many gullies due to severe soil erosion. Many large, medium, and small silt storage dams have been built in the study area to control severe soil erosion. However, some silt storage dams are damaged after long-term operation. It is necessary to study the locations and spatial distribution of silt storage dams for the planning, construction, maintenance, and target implementation from 2021 to 2025. The traditional field investigation of silt storage dams is time-consuming and laborious. Therefore, it is urgent to extract silt storage dams of the watersheds of Hulu River and Lanni River with the help of RS images.
Figure 1. Location of the watersheds of Hulu River and Lanni River.
Data processing is the premise of training images of silt storage dams using a deep learning model, which includes watershed extraction, labeling of silt storage dams, image segmentation, data enhancement, and construction of datasets.
First, high-resolution Google images of Xiji County were downloaded using a local space viewer. The geographic coordinate system of Google images is WGS84 with RGB bands and spatial resolutions of 20 levels. The highest resolution of image is 0.27 m at the 20th level. In this study, the 19th level images with scale of 1:1500, a ground resolution of 0.54 m, and an acquisition time of January 1, 2020 were downloaded to extract the silt storage dams.
Second, the watersheds of Hulu River and Lanni River were extracted using the DEM and vector layer of water system. The DEM of 12 m resolution was obtained from Advanced Land Observing Satellite-1 with a PALSAR sensor launched by Japan Aerospace Exploration Agency and downloaded from http://www.tuxingis.com/resource/dem_12_download.html. Depression depths were calculated using ArcGIS 10.6 according to the lowest and outlet elevations of the DEM. Depressions were filled according to depression depths to obtain a non-depression DEM. Flow directions were extracted using a D8 algorithm of single flow direction. River network was generated using a confluence accumulation method and a Shreve algorithm. Watershed outline was obtained using a burn-in algorithm. The downloaded RS images were cropped by the watershed outline.
Third, the cropped images were labeled. A new vector layer was created in ArcGIS to vectorize the silt storage dams in the cropped images through manual visual interpretation. A total of 144 images containing silt storage dams were finally extracted. The images containing silt storage dams are labeled with “1” to represent silt storage dams and “0” to represent non-silt storage dams. The polygon layers of the labeled silt storage dams were converted into raster images in .dat format.
Fourth, a sliding window was used to crop the images for data enhancement. The size of the sliding window was set according to the size of the images in a dataset. Then, 120 images with large areas were cropped into image slices with a size of 800 × 800. The slices were numbered in order. Similarly, the labeled images were cropped using the sliding window. The position of the sliding window is the same as that of the cropped image. The ID of the cropped label image is the same as the name of the corresponding image. There are 5344 image slices containing silt storage dams after the data enhancement, such as rotation, mirror image, histogram equalization, log correction, and gamma correction.
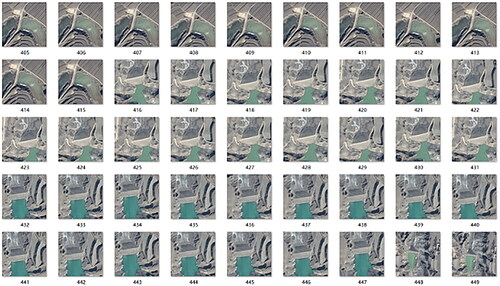
Fifth, data cleaning was carried out to find incomplete images and incorrect XML syntax before the training. Confidence learning, which is an open source of cleanlab Python package and a framework of deep learning with labeled errors, was used to identify the labeled errors in image slices. The labeled mistakes in the image slices of the training set cannot be processed if the mistakes are randomly made because the deep learning algorithm is robust to the random errors. However, it is necessary to correct the labeled errors of the image slices if the errors affect the trained result significantly. In this study, 100 samples with the labeled errors were randomly selected to calculate their error rate, which was greater than a preset threshold of 2%. The slices with the labeled errors were processed preferentially using the slight disturbance of training dataset to filter an optimal learner from the complex hypothesis categories to obtain a robust model. shows examples of some image slices.
Figure 2. Examples of image slices.
Finally, all the image slices were divided into three datasets to verify the effect of different parameters of U-Net model on the extraction accuracy of silt storage dams. Each dataset was divided into three subsets: training set, test set, and validation set. Dataset 1 has a total of 1240 image slices, including 952 slices in the training set, 144 slices in the test set, and 144 slices in the validation set. Dataset 2 has a total of 1800 image slices, including 1440 slices in the training set, 216 slices in the test set, and 144 slices in the validation sets. Dataset 3 has a total of 2304 image slices, including 1872 slices in the training set, 288 slices in the test set, and 144 slices in the validation set.
Construction of U-Net model
Model calibration is to ensure that the predicted probability of a model is consistent with the actual empirical probability (Hendrycks and Gimpel Citation2017). The baseline method was used for model calibration in this study to output the maximum predicted probability using softmax to detect whether a sample was misclassified and out-of-distribution (Hendrycks and Dietterich Citation2019). Uncertainty baselines were used to select evaluation metrics, training dataset, and base model to set up each benchmark (Ovadia et al. Citation2019; Nado et al. Citation2021). The baselines, such as TensorFlow, Keras, Caffe2, and mlpack2 were selected to find an optimal baseline to extract silt storage dams. The baseline of TensorFlow + Keras was finally used as the framework of the U-Net model after trial and error.
TensorFlow was used as the framework of U-Net model. TensorFlow is an end-to-end platform with flexibility, open source, and high availability characteristics. It can use API to build and deploy deep learning models and support kernel library to accelerate the computation based on CPU and GPU.
The U-Net model is one of the deep learning models with a fully CNN (FCN) (Gang et al. Citation2017), which merges encoder-decoder, full convolution to extract image feature, deconvolution to restore image feature, and jumping structure to extract context details (). The model is suitable for training a dataset with some image slices, which is widely used for the segmentation of RS image and medical image (Ren et al. Citation2020).
Figure 3. Structure of U-Net (source: https://www.jianshu.com/p/0bb14fb7de62).
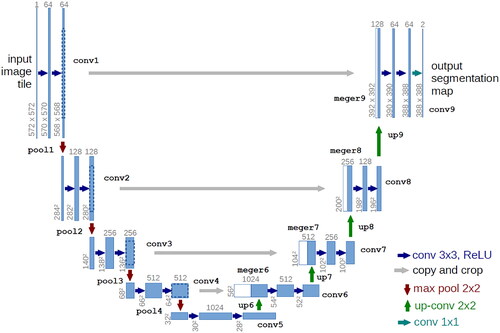
The U-Net model has a U-shape: The left part of the model is a typical structure of CNN used for image compression, and the right part is a deconvolution structure used to restore the information lost during image convolution. The left part contains two convolution layers with a convolutional kernel of 3 × 3 and a 2 × 2 maxpooling layer. The number of feature channels is doubled after each pooling. There are five scales of feature maps after four poolings. ReLU activation function is used on the results obtained from convolution operation to prevent the gradient from disappearing and improve the training speed. The deconvolution structure on the right side of the model was designed as follows: a deconvolution operation of 2 × 2 halves the number of channels of the feature map. The feature maps cropped by the convolution compression were spliced and then merged into a feature map with a size of twice the original feature map. The features were extracted using two convolution kernels of 3 × 3. Each feature vector was mapped to the output layer of the network using a convolution kernel of 1 × 1. The feature maps containing two classes (silt storage dam and non-silt storage dam) were converted into a probability map using a softmax classifier. The predicted image was output according to the probability of each pixel.
The U-Net model is over fitted if the accuracy obtained from a training set increases while the accuracy obtained from a validation set decreases (Malik et al. Citation2021). The training of the model should be stopped to adjust the model’s hyper-parameters, then continue to train until the error rate obtained from the validation set is less than a preset threshold.
The sensitivity of image input size, batch size, and sample size of U-Net were analyzed. The U-Net model was trained with Datasets 1, 2, and 3 by changing the value of one of the above three parameters and keeping other conditions unchanged. First, the image slices in Dataset 1 were segmented into small slices with different input sizes of 288 × 288, 384 × 384, 480 × 480, and 576 × 576, respectively. The U-Net model was trained with the segmented slices of the four input sizes to analyze the effect of different input sizes on the U-Net model for the extraction of silt storage dams. The optimal input size of U-Net model was found according to the extraction accuracies of silt storage dams. Second, the dataset with the optimal input size was input into the U-Net model by changing the values of batch size to 2, 3, and 4 and keeping the values of other parameters unchanged. The optimal parameter of batch size was found according to the best extraction accuracy of silt storage dams. Finally, the image slices of Datasets 2 and 3 are segmented into those with the obtained optimal input size. The U-Net model was trained with Datasets 1, 2, and 3 using the optimal input size and batch size and keeping other conditions unchanged to find an optimal parameter combination to extract silt storage dams.
Evaluation of model accuracy
In this study, precision rate, F1 score, mean intersection over union (MIoU), and training time were selected to evaluate the accuracy of silt storage dams segmented by the U-Net model.
The precision rate refers to the proportion of the number of silt storage dams, which are correctly predicted to the number of those with positive category.
(1)
(1)
where P is the precision rate, Tp is the true positives, and Fp is false positives.
F1 score was obtained by averaging the weighted sum of precision rate and recall rate. Recall rate refers to the proportion of the number of silt storage dams, which are correctly predicted as positive category to the number of true positive category.
(2)
(2)
(3)
(3)
where F1 is the F1 score, P is the precision rate, R is the recall rate, Tp is the true positives, and Fn is the false negatives.
MIoU is the mean of the sum of the ratio of intersection over union of each class.
(4)
(4)
where MIoU is the mean intersection over union. m is the number of categories, Tpi is the number of true positives of the ith category, Fpi is the number of false positives of the ith category, and Fni is the number of false negatives of the ith category.
Because training time is inversely proportional to training speed, the training time of U-Net model spent for one epoch was used in this study in millisecond/step (ms/step).
Results
Optimization of hyper-parameters
The hardware configuration used in the experiment is as follows: independent graphics card, Intel (R) Core (TM) i7-10750H CPU @ 2.60 GHz, 512 G hard disk, 16 G memory, NVIDIA GeForce RTX2060 6 G GPU. The software configuration used in the experiment is as follows: Windows 10 operating system, Anaconda VS Code 1.52.1, Python 3.6 programming language, TensorFlow + Keras development framework, and 10.1 CUDA.
Bayesian optimization was used in this study to tune the hyper-parameters of deep learning, such as optimizer, iteration, activation function, learning rate, and attenuation of learning rate. Bayesian optimization is an informed search to optimize the distribution p (y | x) and fluctuation range of each parameter in an objective function to reduce search space and improve search efficiency (Bergstra et al. Citation2011).
Optimization procedure of hyper-parameters was designed as follows:
Step 1. A probabilistically distributed model of Gaussian process regression (GPR) was constructed according to the history of parameter tuning H = (x, f(x)), where f is the optimized function, x is the hyper-parameter combination.
Step 2. The next hyper-parameter xnew was selected according to an acquisition function of the expected improvement (EI) as follows:
(5)
(5)
where xnew is the next searched hyper-parameter, y∗ is the threshold value, which is the best observed result y in the GPR, M is the probabilistically distributed model, EIy*(x) is the increased expectation of y∗ relative to y for a given x.
Step 3. ynew was obtained according to p (y | xnew). A new observation (xnew, f(xnew)) was added to H.
Step 4. Repeating Steps 1, 2, and 3, and termination until the maximum iteration is reached.
The parameters of U-Net were obtained according to the Bayesian optimization as follows: Loss function of cross entropy was used to calculate the error between the predicted and true values. ReLU function was used to transfer the data from a node to another node. Learning rate = 0.0001. Attenuation of learning rate = 0.5. Epoch = 40. ε = 1e-8. β1 = 0.9. β2 = 0.999. Optimizer = Adam. Batch size = 2. Iterations = (epoch × sample count)/batch size. Classifier of output layer is the softmax. The training will be terminated in advance if the validation loss does not decrease in 10 epochs.
Effect of image input size on the semantic segmentation of silt storage dams
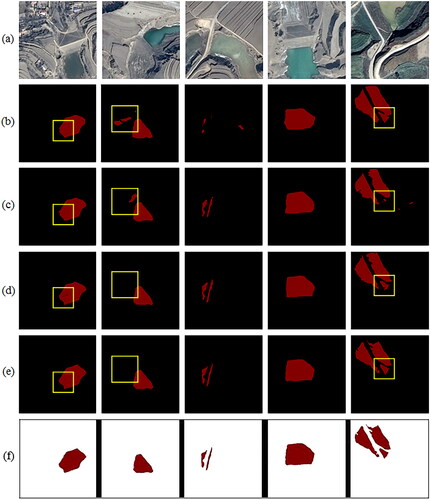
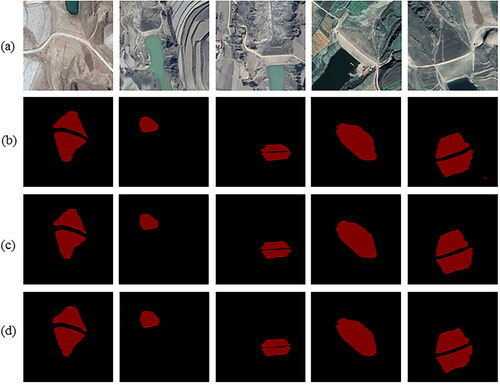
Images in Dataset 1 were sliced at varying height and width pairs, such as 288 × 288, 384 × 384, 480 × 480, and 576 × 576. The visual segmentation results were obtained after the U-Net model was trained with the four input sizes (). shows the original image slices. show the silt storage dams segmented by U-Net with the four input sizes. Boxes with yellow edges show a small number of misclassifications between silt storage dams and non-silt storage dams. The position and shape of the silt storage dam in the first original image can be accurately identified by the U-Net model with different input sizes. However, the U-Net model with input sizes of 288 × 288 and 384 × 384 does not correctly identify the road in the middle of the silt storage dam, while the model with input sizes of 480 × 480 and 576 × 576 can identify partial road. Similarly, the segmentation effects from the second and fifth original images with input sizes of 480 × 480 and 576 × 576 are better than those with input sizes 288 × 288 and 384 × 384. The silt storage dam in the third original image is very small, so the U-Net with an input size of 288 × 288 cannot effectively segment the silt storage dam. However, the position and shape of silt storage dams can be accurately segmented using U-Net with an input size of 576 × 576. The extent of misclassification can be visualized according to the positions and shapes of water bodies and terraces, the textures and colors of vegetation and farmland, and topographic relief around a silt storage dam, and the width and direction of the road through a silt storage dam. Therefore, the U-Net model with a large input size can identify the edge details of silt storage dams better than those with a small input size.
Figure 4. Visualized silt storage dams of original images (a), segmented by U-Net with different input sizes of 288 × 288 (b), 384 × 384 (c), 480 × 480 (d), and 576 × 576 (e), and ground truth of silt storage dams (f).
The accuracies of silt storage dams were evaluated using the interfaces of test and metrics of TensorFlow (). The P, F1, MIoU, and training time of U-Net model increased with the increase in input size, except that the P (95.70%) obtained from the input size of 384 × 384 is less than that (95.78%) obtained from the input size of 288 × 288. The U-Net model with an input size of 576 × 576 can extract the best accuracy of silt storage dam with a P of 96.10%, F1 of 68.63%, and MIoU of 74.08%, although the training time of 410 ms/step is the longest. The improvement in accuracy can be ignored if the increment of input size is very small. However, the accuracy can be improved to a certain extent to generate a substantial segmentation effect, especially for the segmentation of small objects, if the input size increases to a certain size. The increase in input size enlarges the details of small objects, in which more features can be extracted after multiple convolutions than those from small-size image slices. At the same time, an increase in input size increases the memory occupancy rate, resulting in slow training speed.
Table 1. Accuracies of silt storage dams semantically segmented by U-Net with different input sizes.
Effect of batch size on semantic segmentation of silt storage dams
The U-Net model was trained with Dataset 1, an input size of 576 × 576, batch sizes of 2, 3, and 4 (the maximum batch size = 4 due to the limitation of experimental hardware). Other parameters are set the same as those in Section Optimization of hyper-parameters. The visual silt storage dams segmented by the U-Net model with batch sizes of 2, 3, and 4 are shown in . The segmentation effects from the three batch sizes are almost the same, so it is difficult to evaluate which batch size has a better segmentation effect. However, the edges and details of silt storage dams extracted by three batch sizes are slightly different, i.e., the edges and details extracted from batch size of 4 are better than those extracted from the batch size of 2.
Figure 5. Visualized silt storage dams of original images (a) and segmented by U-Net with batch sizes of 2 (b), 3 (c), and 4 (d).
The segmentation accuracies of silt storage dams based on the U-Net model with different batch sizes are shown in . P, F1, MIoU, and training time increased with the increase in batch size, except that the P (96.12%) obtained from the batch size of 4 is lower than that (96.19%) obtained from the batch size of 3. F1 and MIoU of silt storage dams obtained from the batch size of 4 are 69.18% and 74.41%, respectively.
Table 2. Accuracies of silt storage dams segmented by U-Net with different batch sizes.
The training time during iteration is positively correlated with the batch size. However, the training time during an epoch decreased with the increase in batch size. The number of iterations was determined using the formula: sample size/batch size. Each epoch in the U-Net model was iterated 476, 318, and 238 times (rounded up if indivisible) according to the training set in Dataset 1 of 952 samples and the batch size of 2, 3, and 4, respectively. The training time of each epoch is 143s, 122s, and 114s, as shown in . The total time to train the model with a batch size of 4 is 20 min faster than that of the model with a batch size of 2. Therefore, increasing the batch size can substantially improve the running speed and occupancy rate of video memory of the U-Net model while ensuring the segmentation accuracy.
Effect of sample size on semantic segmentation of silt storage dams
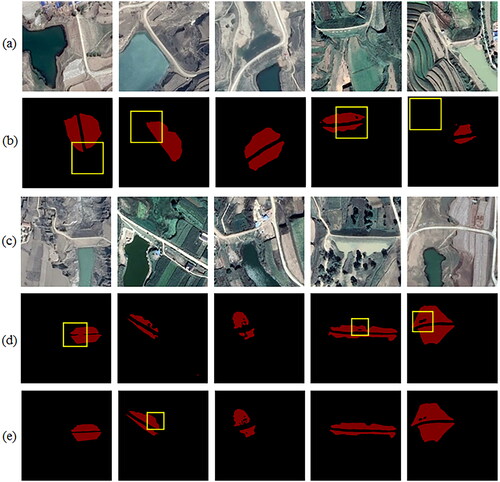
The silt storage dams were segmented using the U-Net model with a batch size of 4, input size of 576 × 576, and Datasets 1, 2, and 3 (). Network structure and other parameters are the same as those described in Section Optimization of hyper-parameters. show the original image slices. show the segmentation results of U-Net trained by Datasets 1, 2, and 3, respectively. The effect of silt storage dams segmented by U-Net with different sample sizes is better than those described in Sections Optimization of hyper-parameters and Effect of image input size on the semantic segmentation of silt storage dams. The outlines of silt storage dams are clear and consistent with the actual outlines. Roads in the middle of silt storage dams are effectively differentiate from the non-silt storage dams. Outlines and shapes of silt storage dams, with less misclassification, are more consistent with the actual outlines and shapes. The details of silt storage dams are more visible, and the noise, such as shadow can be recognized more effectively with a large sample size than those with a small sample size.
Figure 6. Visualized silt storage dams of original images (a and c) and segmented by U-Net model using Datasets 1 (b), 2 (d), and 3 (e).
The accuracies of silt storage dams extracted by the U-Net model with Datasets 1, 2, and 3 are shown in . The accuracies of silt storage dams extracted from different datasets showed a slight difference. The accuracy obtained from Dataset 3 is slightly lower than that obtained from Dataset 2. F1 and MIoU increased with the increase in sample sizes. The largest F1 and MIoU are 70.61% and 75.33%, respectively, which are obtained from Dataset 3. The training time of iteration obtained from Datasets 1, 2, and 3 fluctuates in a small range. However, the training time increased with the increase in sample size. Therefore, the accuracy of the U-Net model increased with the increase in sample size.
Table 3. Accuracies of silt storage dams segmented by U-Net with different sample sizes.
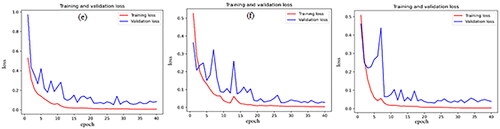
shows the convergence of loss curves obtained by the U-Net model based on Datasets 1, 2, and 3 with the increase in the epoch. The curves of training loss are smoother than those of validation loss obtained from Datasets 1, 2, and 3. The training loss gradually decreases and finally became stable and reached a fitting state with the increase in the epoch. Training loss is large at the beginning of training. However, the convergence performance is very good at the later iteration. The curves of validation loss obtained from Datasets 1, 2, and 3 clearly showed oscillation at the beginning of the iteration and converged to a stable state at the later stage. The curves of validation loss are closer to those of training loss in the later stage of iteration with the increase in sample size, indicating a strong generalization ability of U-Net with a large sample size. Therefore, the performance of U-Net based on Dataset 3 is better than those based on Datasets 1 and 2 in extracting silt storage dams.
Figure 7. Loss curves obtained by U-Net based on Datasets 1 (a), 2 (b), and 3 (c).
The silt storage dams were segmented using the U-Net model with a batch size of 4, input size of 576 × 576, and Dataset 3 for 30 repeated trials to obtain the averages and standard deviations of P, F1, MIoU, and training time (). Network structure and other parameters are the same as those described in Section Optimization of hyper-parameters.
Table 4. Averages and standard deviations (SD) of accuracies of silt storage dams segmented by U-Net and FCN with input size of 576 × 576, batch size of 4, and Dataset 3 for 30 repeated trials.
Standard deviation is the square root of the variance, which can reflect the dispersion degree of a dataset. The standard deviations of P, F1, MIoU, and training time are all very small according to , indicating that the values of evaluation indicators are clustered and close to their average values.
The FCN model was selected as a baseline to segment silt storage dams from images of Dataset 3. The structure of FCN includes the full convolutional layers for extracting network features and the deconvolution layers for semantical segmentation of images using an upsampling method. The parameter settings of the FCN model were the same as those of the U-Net model. The input size and batch size of the FCN model were 576 × 576 and 4, respectively. The model was trained for 30 repeated trials to obtain the averages and standard deviations of P, F1, MIoU, and training time (). The average values of P, F1, and MIoU obtained from the FCN model are larger than those obtained from the U-Net model except for training time according to . Therefore, the performance of the U-Net model is superior to that of the FCN model.
The training time for deep learning is usually longer than the testing time. It is because that the training set is larger than the testing set; multiple epochs of training are conducted on the training set, while only one epoch of testing is conducted on the testing set; forward calculation and back propagation with large calculational costs are required for training, while forward calculation is only required for testing.
Computational cost of deep learning can be reduced using the methods of network pruning, weight quantification, and knowledge distillation. Network pruning is to define the importance of each connection according to the maximum value of the connection weight, find out redundant connections, and prune their weights not to participate in the forward or backward operation, during or at the end of the training process. Weight quantization is to obtain the update amount of a cluster center, which is the summation of weight gradients in the cluster, with the method of k-means clustering of all weights in the weight matrix. An updated cluster center in the next epoch of training is obtained using the cluster center value to subtract the product of the update amount and the learning rate. Knowledge distillation is to train a small network using a large pre-trained network to transfer knowledge from a cumbersome model to a small model that is suitable for deployment.
Computing power of a large-scale cluster makes batch size larger and larger. Large batch size can expand the number of GPUs without reducing the computing load of each GPU. However, too large batch size can reduce the randomness of samples and the accuracy of training, which neutralizes the benefits of increased computing power. The following methods can be used to increase batch size and decrease calculational cost without reducing the training accuracy. (i) The training data and parameters are represented by floating-point numbers with single precision, and combined with a layer adaptive rate scaling algorithm to obtain learning rates of different layers (You et al. Citation2017). (ii) Regularization is used for weights, not for the parameters of bias, beta, and gamma in a deep learning model. (iii) Parameter values are divided by a large stride at first, and a small stride in the late.
Performance of labeling functions and label model
A snorkel system, including context hierarchy, labeling function interface, and generative model, was used for batch data labeling (Ratner et al. Citation2017). Labeling functions, including pattern-based, distant supervision, weak classifiers, and labeling function generators, were used to label data samples and obtain label matrix. 1872 slices in the Dataset 3, as a training set, were labeled using the labeling functions in the snorkel to obtain a labeling matrix of 1872 × 3. A generative model was trained using the snorkel to obtain the prediction values of labels. The U-Net model was trained using labeled samples.
288 slices in the Dataset 3, as a test set, were manually labeled using three labeling functions (pattern-based 1, 2, and 3) to test F1, P, and MIoU of each labeling function and the generative model ().
Table 5. Comparison of F1, P, and MIoU obtained from the labeling functions and the label model with the images of input size of 576 × 576 and batch size of 4.
The F1, P, and MIoU of the label model are a compromise result of different labeling functions. Pattern-based labeling function 1 obtains better results than other pattern-based ones because the distribution of the test samples is closer to the pattern-based labeling function 1. Increase in the number of labeling functions can improve the generalization ability of the model because different labeling functions represent different information.
Discussion
In fact, the minimal number of experiments is determined usually based on a task and experience, mainly the coverage and similarity of data to the actual task. If it is a simple task, a small size of data, which there are generally one or two thousand representative labeled images, can have a better performance of training with fast convergence. In this study, 952 slices in Dataset 1, 1440 slices in Dataset 2, and 1872 slices in Dataset 3 were selected from 5344 image slices to train the U-Net mode to extract silt storage dams with the accuracies of 96.12, 96.39, 96.26, respectively. Several experiments with small sample sizes, such as 600, 200, and 40, respectively, should be carried out to validate the segmented accuracies of silt storage dams with the minimal number of experiments (Rodriguez-Lujan et al. Citation2014).
Different sizes of patch, image, and feature map can generate different losses, gradients, backpropagations, and times of data load. Batch size determines the time spent in each epoch and the smoothness of the gradient of a model. Too small batch size can spend too much training time and generate large gradient oscillations, which is not conducive to convergence. On the contrary, too large batch size can prevent the oscillation of loss curves, maintain a stable gradient direction, and decrease iterations and speed gain, which is easy to fall into local minima.
Different batch sizes are required to set different learning rates. Too large learning rate with a batch size = 1 can cause explosive increase of loss in the later training because an abnormal value may seriously disturb the training process. Small learning rate should be set for small batch size to avoid disturbance of outliers to training. On the contrary, large learning rate should be set for large batch size to accelerate the convergence process because the gradient direction of a model with large batch size is relatively stable in each iteration.
A model with large sample size can extract more generalized image features than that with small sample size. However, too large sample size has little effect on the classification accuracy.
An image with too large or too small image objects should be cropped into several slices with a resize tool to speed up data input and increase the image resolution. An image with both large and small objects can be trained with a pyramid pooling to obtain receptive fields of different scales, because the pyramid pooling can combine the local and the global context information, and the outline and the detailed texture information (Sofiiuk et al. Citation2019). Large image has more texture and context information to capture more accurate image features than small image.
Fine tuning is used to initialize the weights of a deep learning model obtained from a pre-trained large dataset to improve the segmentation accuracy, convergence speed, and generalization ability of the model (Chi et al. Citation2017). First, a deep learning model is pre-trained using a large dataset, such as ImageNet. Structures and parameters of the model are copied to a new deep learning model except its output layer. Second, a new output layer to output the number of target categories are added to the new model. The parameters of the new output layer are initialized randomly. In particular, the learning rate of the new output layer is set to 10 times those of other layers. Third, fine tuning of the parameters of other layers is performed by setting large batch size and small learning rate, iteration, and stride. Finally, the order of images in the target dataset is perturbed randomly to improve the segmentation accuracy of the new model.
The fine-tuning technology is used according to the size of a new dataset and its similarity to a pre-trained dataset (Papa et al. Citation2017). The last several layers or the final softmax layer to output categories are only required to modify if the new dataset is small and the targets of the dataset are similar to those of the pre-trained dataset. The architecture and initial weights of the pre-trained model are retained to train the new model if the new dataset is large and the targets of the dataset are similar to those of the pre-trained dataset. However, the fine-tuning technology cannot be used if the new dataset is small and the targets of the dataset are not similar to those of the pre-trained dataset. In addition, training from scratch is performed if the new dataset is large and the targets of the dataset are not similar to those of the pre-trained dataset.
This study analyzes the effects of image input size, batch size, and sample size on the accuracy of silt storage dams extracted using a U-Net model from high-resolution RS images. Three datasets, which contain Google image slices with a resolution of 0.54 m in the watersheds of Hulu River and Lanni River, China, were constructed and enhanced using GIS. A U-Net model was constructed to compare the accuracies of silt storage dams extracted from different parameters of the model. The results show that the input size, batch size, and sample size affect the accuracy of U-Net model in segmenting the silt storage dams from the RS images. Increasing the input size, batch size, and sample size can improve the P, F1, and MIoU. Segmentation accuracy and training speed were improved using an input size of 576 × 576, a batch size of 4, and 2304 image slices. The sensitivity analysis of parameters in a deep learning model can identify the key parameters of the model and provide a priori knowledge for the semantic segmentation of silt storage dams. The results can help to better understand the sensitivity and sampling distribution of parameters for the selection of boundary conditions of sensitive parameters and optimization of parameter combination. High-accuracy silt storage dams provide a reference for the planning, construction, and maintenance of silt storage dams, as well as ecological conservation and high-quality development in the Yellow River Basin.
The extraction effect of silt storage dams from the images based on a deep learning model is related to the network structure, learning rate, number of nodes, number of samples, and other parameters. There is no selection standard at present to determine an optimal parameter combination to further improve the convergence speed and prediction accuracy. Moreover, the batch size is small because the hardware configuration in this study is low, resulting in the limited computing power. In fact, a large batch size can improve the operation efficiency of the U-Net model and the accuracy of edge segmentation. An ablation study should be performed on higher batch size with smaller image size to see the possible effect. In addition, data preprocessing and parameter adjustment are time-consuming and laborious. Semi supervised and unsupervised algorithms can be used to automatically preprocess the data and adjust the parameters in the future.
Author contributions
Jingwei Hou contributed conceptualization, methodology, writing, reviewing, and editing. Moyan Zhu contributed investigation, data curation, software, and visualization. Ji Zhou contributed supervision and validation. Qiong Tian contributed original draft preparation and improvement of the written language of the manuscript.
Disclosure statement
No potential conflict of interest was reported by the author(s).
Additional information
Funding
References
- Badrinarayanan, V., Kendall, A., and Cipolla, R. 2017. “Segnet: A deep convolutional encoder-decoder architecture for image segmentation.” IEEE Transactions on Pattern Analysis and Machine Intelligence, Vol. 39(No. 12): 2481–2495. doi:10.1109/TPAMI.2016.2644615.
- Bergstra, J., Bardenet, R., Bengio, Y., and Kégl, B. 2011. “Algorithms for hyper-parameter optimization.” Conference and Workshop on Neural Information Processing Systems (NIPS), Granada, Spain.
- Chen, L. C., Zhu, Y., Papandreou, G., Schroff, F., and Adam, H. 2018. “Encoder-decoder with atrous separable convolution for semantic image segmentation.” Proceedings of the European Conference on Computer Vision (ECCV), Cham, Switzerland, Vol. 11211: 833–851.
- Chen, J., Xiao, H., Li, Z., Liu, C., Ning, K., and Tang, C. 2020. “How effective are soil and water conservation measures (SWCMs) in reducing soil and water losses in the red soil hilly region of China? a meta-analysis of field plot data.” The Science of the Total Environment, Vol. 735: 139517. doi:10.1016/j.scitotenv.2020.139517.
- Chi, J., Walia, E., Babyn, P., Wang, J., Groot, G., and Eramian, M. 2017. “Thyroid nodule classification in ultrasound images by fine-tuning deep convolutional neural network.” Journal of Digital Imaging, Vol. 30(No. 4): 477–486. doi:10.1007/s10278-017-9997-y.
- Fang, H. 2021. “Effect of soil conservation measures and slope on runoff, soil, TN, and TP losses from cultivated lands in northern China.” Ecological Indicators, Vol. 126(No. 6): 107677. doi:10.1016/j.ecolind.2021.107677.
- Gang, F., Liu, C.J., Rong, Z., Sun, T., and Zhang, Q.J. 2017. “Classification for high resolution remote sensing imagery using a fully convolutional network.” Remote Sensing, Vol. 9(No. 5): 498. doi:10.3390/rs9050498.
- Guo, Y., Chen, G., Mo, R., Wang, M., and Bao, Y. 2020. “Benefit evaluation of water and soil conservation measures in Shendong based on particle swarm optimization and the analytic hierarchy process.” Water, Vol. 12(No. 7): 1955. doi:10.3390/w12071955.
- Hendrycks, D., and Dietterich, T.G. 2019. “Benchmarking neural network robustness to common corruptions and perturbations.” 7th International Conference on Learning Representations, New Orleans, USA, May 2019.
- Hendrycks, D., and Gimpel, K. 2017. “A baseline for detecting misclassified and out-of-distribution examples in neural networks.” International Conference on Learning Representations, Toulon, France, May 2017.
- Kang, W., Xiang, Y., Wang, F., and You, H. 2019. “Eu-net: An efficient fully convolutional network for building extraction from optical remote sensing images.” Remote Sensing, Vol. 11(No. 23): 2813. doi:10.3390/rs11232813.
- Kussul, N., Lavreniuk, M., Skakun, S., and Shelestov, A. 2017. “Deep learning classification of land cover and crop types using remote sensing data.” IEEE Geoscience and Remote Sensing Letters, Vol. 14(No. 5): 778–782. doi:10.1109/LGRS.2017.2681128.
- Li, X., Du, Z., Huang, Y., and Tan, Z. 2021. “A deep translation (GAN) based change detection network for optical and SAR remote sensing images.” ISPRS Journal of Photogrammetry and Remote Sensing, Vol. 179: 14–34. doi:10.1016/j.isprsjprs.2021.07.007.
- Malik, K., Robertson, C., Braun, D., and Greig, C. 2021. “U-Net convolutional neural network models for detecting and quantifying placer mining disturbances at watershed scales.” International Journal of Applied Earth Observation and Geoinformation, Vol. 104: 102510. doi:10.1016/j.jag.2021.102510.
- Mhiret, D.A., Dagnew, D.C., Guzman, C.D., Alemie, T.C., Zegeye, A.D., Tebebu, T.Y., Langendoen, E.J., Zaitchik, B.F., Tilahun, S.A., and Steenhuis, T.S. 2020. “A nine-year study on the benefits and risks of soil and water conservation practices in the humid highlands of Ethiopia: The Debre Mawi watershed.” Journal of Environmental Management, Vol. 270: 110885. doi:10.1016/j.jenvman.2020.110885.
- Nado, Z., Band, N., Collier, M., Djolonga, J., Dusenberry, M.W., Farquhar, S., Feng, Q., Filos, A, Havasi, M. and Jenatton, R. 2021. “Uncertainty baselines: Benchmarks for uncertainty & robustness in deep learning.” arXiv:2106.04015v1. doi:10.48550/arXiv.2106.04015.
- Ovadia, Y., Fertig, E., Ren, J., Nado, Z., Sculley, D., Nowozin, S., Dillon, J. V., Lakshminarayanan, B., and Snoek, J. 2019. “Can you trust your model’s uncertainty? evaluating predictive uncertainty under dataset shift.” Proceeding of the 33rd Conference on Neural Information Processing Systems (NeurIPS 2019), Vancouver, Canada.
- Pal, M., and Mather, P.M. 2005. “Support vector machines for classification in remote sensing.” International Journal of Remote Sensing, Vol. 26(No. 5): 1007–1011. doi:10.1080/01431160512331314083.
- Papa, J.P., Rosa, G.H., Pereira, D.R., and Yang, X.S. 2017. “Quaternion-based deep belief networks fine-tuning.” Applied Soft Computing, Vol. 60: 328–335. doi:10.1016/j.asoc.2017.06.046.
- Paoletti, M., Haut, J., Plaza, J., and Plaza, A. 2018. “A new deep convolutional neural network for fast hyperspectral image classification.” ISPRS Journal of Photogrammetry and Remote Sensing, Vol. 145: 120–147. doi:10.1016/j.isprsjprs.2017.11.021.
- Pi, Y.L., Nath, N.D., and Behzadan, A.H. 2021. “Detection and semantic segmentation of disaster damage in UAV footage.” Journal of Computing in Civil Engineering, Vol. 35(No. 2): 04020063. doi:10.1061/(ASCE)CP.1943-5487.0000947.
- Pradhan, B., Al-Najjar, H.A.H., Sameen, M.I., Tsang, I., and Alamri, A.M. 2020. “Unseen land cover classification from high-resolution Orthophotos using integration of zero-shot learning and convolutional neural networks.” Remote Sensing, Vol. 12(No. 10): 1676. doi:10.3390/rs12101676.
- Rafiee, G., Dlay, S.S., and Woo, W.L. 2013. “Region-of-interest extraction in low depth of field images using ensemble clustering and difference of Gaussian approaches.” Pattern Recognition, Vol. 46(No. 10): 2685–2699. doi:10.1016/j.patcog.2013.03.006.
- Ratner, A., Bach, S.H., Ehrenberg, H., Fries, J., Wu, S., and Ré, C. 2017. “Snorkel: Rapid training data creation with weak supervision.” Proceedings of the VLDB Endowment. International Conference on Very Large Data Bases, Vol. 11(No. 3): 269–282. doi:10.14778/3157794.3157797.
- Ren, Y., Yu, Y., and Guan, H. 2020. “DA-Caps UNet: A dual-attention capsule UNet for road extraction from remote sensing imagery.” Remote Sensing, Vol. 12(No. 18): 2866. doi:10.3390/rs12182866.
- Rodriguez-Lujan, I., Fonollosa, J., Vergara, A., Homer, M., and Huerta, R. 2014. “On the calibration of sensor arrays for pattern recognition using the minimal number of experiments.” Chemometrics and Intelligent Laboratory Systems, Vol. 130: 123–134. doi:10.1016/j.chemolab.2013.10.012.
- Shamsolmoali, P., Zareapoor, M., Wang, R., Zhou, H., and Yang, J. 2019. “A novel deep structure U-Net for sea-land segmentation in remote sensing images.” IEEE Journal of Selected Topics in Applied Earth Observations and Remote Sensing, Vol. 12(No. 9): 3219–3232. doi:10.1109/JSTARS.2019.2925841.
- Sofiiuk, K., Barinova, O., and Konushin, A. 2019. “AdaptIS: Adaptive Instance Selection Network.” IEEE International Conference on Computer Vision, arXiv:1909.07829, Seoul, South Korea, October–November, 2019.
- Wang, J., Song, J., Chen, M., and Yang, Z. 2015. “Road network extraction: A neural-dynamic framework based on deep learning and a finite state machine.” International Journal of Remote Sensing, Vol. 36(No. 12): 3144–3169. doi:10.1080/01431161.2015.1054049.
- Wang, L., Li, Z., Wang, D., Hu, X., and Ning, K. 2020. “Self-organizing map network-based soil and water conservation partitioning for small watersheds: case study conducted in Xiaoyang watershed, China.” Sustainability, Vol. 12(No. 5): 2126. doi:10.3390/su12052126.
- Yang, C., Hou, J.W., and Wang, Y.J. 2021. “Extraction of land covers from remote sensing images based on a deep learning model of NDVI-RSU-Net.” Arabian Journal of Geosciences, Vol. 14(No. 20): 2073. doi:10.1007/s12517-021-08420-5.
- You, Y., Gitman, L., and Ginsburg, B. 2017. “Large Batch Training of Convolutional Networks.” arXiv:1708.03888. doi:10.48550/arXiv.1708.03888.
- Yousefi, P., Jalab, H.A., Ibrahim, R.W., Noor, N.F.M., Ayub, M.N., and Gani, A. 2016. “River segmentation using satellite image contextual information and Bayesian classifier.” The Imaging Science Journal, Vol. 64(No. 8): 453–459. doi:10.1080/13682199.2016.1236067.
- Zhang, L., Wu, J., Fan, Y., Gao, H., and Shao, Y. 2020. “An efficient building extraction method from high spatial resolution remote sensing images based on improved mask R-CNN.” Sensors, Vol. 20(No. 5): 1465. doi:10.3390/s20051465.
- Zhu, M.Y. 2021. Semantic segmentation of warping dams in remote sensing image based on deep learning. Master dissertation. Yinchuan: Ningxia University. (in Chinese)