
Abstract
Understanding the processes driving terrestrial vegetation productivity dynamics in boreal ecosystems is critical for accurate assessments of carbon dynamics. Monitoring these dynamics typically requires a fusion of broad-scale remote sensing observations, climate information and other geospatial data inputs, which often have unknown errors, are difficult to obtain, or limit spatial and temporal resolutions of productivity estimates. The past decade has seen notable advances in technologies and the diversity of observed wavelengths from remote sensing instruments, offering new insights on vegetation carbon dynamics. In this communication, we review key current approaches for modeling terrestrial vegetation productivity, followed by a discussion on new remote sensing instruments and derived products including Sentinel-3 Land Surface Temperature, freeze & thaw state from the Soil Moisture & Ocean Salinity (SMOS) mission, and soil moisture from the Soil Moisture Active Passive (SMAP) mission. We outline how these products can improve the spatial detail and temporal representation of boreal productivity estimates driven entirely by a fusion of remote sensing observations. We conclude with a demonstration of how these different elements can be integrated across key land cover types in the Hudson plains, an extensive wetland-dominated region of the Canadian boreal, and provide recommendations for future model development.
RÉSUMÉ
Il est essentiel de comprendre les processus régissant la dynamique de la productivité de la végétation terrestre des écosystèmes boréaux pour pouvoir évaluer avec précision les flux de carbone. Le suivi de cette dynamique nécessite la fusion d‘observations de télédétection à grande échelle, d‘informations climatiques, et d‘autres données géospatiales, lesquelles comportent des erreurs inconnues, sont difficiles à obtenir, et limitent les résolutions spatiales et temporelles des estimations de la productivité. Au cours de la dernière décennie, des progrès technologiques notables ont diversifié les longueurs d‘onde observées par les instruments de télédétection, ce qui a permis de mieux comprendre la dynamique du carbone liée à la végétation. Dans cette communication, nous passons en revue les principales approches pour la modélisation de la productivité de la végétation terrestre, suivies d‘une discussion sur les nouveaux instruments de télédétection et leurs produits dérivés, notamment la température de la surface terrestre extraite de Sentinel-3, l‘état de gel ou de dégel du sol dérivé de la mission SMOS, et l’humidité du sol dérivée de la mission SMAP. Nous décrivons comment ces produits peuvent améliorer le détail spatial et la représentation temporelle des estimations de la productivité boréale entièrement basées sur une fusion d‘observations de télédétection. Nous concluons par une démonstration de la façon dont ces différents éléments peuvent être intégrés dans les principaux types de couverture terrestre des plaines hudsoniennes, une vaste région de la forêt boréale canadienne dominée par des zones humides, et nous formulons des recommandations pour de futures améliorations du modèle.
Introduction
Forests cover approximately 31% of the world’s terrestrial area (Keenan et al. Citation2015), sequestering ∼30% of annual anthropogenic carbon emissions from the atmosphere (Canadell and Raupach Citation2008; Xu et al. Citation2019). Between the tropical, subtropical, temperate, and boreal biomes, the boreal is the most northern and largest terrestrial biome in the world (Brandt et al. Citation2013; Douglas et al. Citation2014). Canada’s boreal zone accounts for 28%, or 552 Mha, of the global boreal ecosystem, and is characterized by a variety of forest stand ages, complex disturbance histories, a small number of dominant species, and high-latitude continental climatic conditions (Brandt et al. Citation2013; Kurz et al. Citation2013; Price et al. Citation2013). With regional variation in species distribution, their productivity, and underlying soils, the total boreal ecosystem is estimated to sequester an average of 8850 TgC yr−1 (1E + 9 Kg of Carbon per year), 62% of which is during the growing season (Virkkala et al. Citation2021). Due to these complex heterogenous patterns and drivers of land cover and land cover change, quantifying the rate of carbon sequestration in these boreal environments is challenging. Overcoming these challenges is imperative for the continued improvement of robust boreal vegetation productivity models and the interannual estimates of regional carbon sequestration they provide. These improved productivity estimates and their impact as a key policy driver forms the motivation of this communication.
The boreal is a patchwork of fine scale vegetation structure and composition reflective of the heterogeneous climate, moisture regimes, permafrost and natural & anthropogenic disturbances (Bonan and Shugart Citation1989; Chapin et al. Citation2010). Boreal ecosystem function and structure is primarily driven by climate and weather through temperature, precipitation, and disturbances such as wind, fire, and insect & disease infestation (Brandt et al. Citation2013; Friend et al. Citation2014). In the boreal forests of North America, the majority of the characteristically modest precipitation falls in the brief summer period, whilst the cold & long winters are typically dry (Bonan and Shugart Citation1989; Brandt et al. Citation2013). The boreal forest is typically underlain by low relief terrain, acidic and nutrient-poor soils, and discontinuous permafrost, with continuous permafrost present north of the treeline (Smith et al. Citation2010). Permafrost regions may be defined as “substrate remaining below 0 °C for more than 2 consecutive years” (Douglas et al. Citation2014) and account for approximately 388 Mha, or 70%, of the total Canadian boreal zone (Kurz et al. Citation2013). Notably, permafrost constrains the movement of water and nutrients to the active layer, which freezes and thaws annually, strongly impacting soil and vegetation processes linked to the carbon cycle (Douglas et al. Citation2014; Petrone et al. Citation2006). Changing seasonal dynamics and increased permafrost thaw under warming climate scenarios may thus lead to alterations in the distribution, function and structure of Canada’s northern forests (Mekonnen, Grant, and Schwalm Citation2018; Price et al. Citation2013; Friend et al. Citation2014).
Despite the limited productivity of boreal vegetation, warming climates will likely significantly impact the distribution of key land cover types for carbon storage such as wetlands. Boreal wetlands are recognized as a key carbon sink, storing approximately 20-30% of the world’s carbon (Lal Citation2008; Kendall et al. Citation2021; Coletti et al. Citation2013). The Canadian boreal is home to some of the world’s largest wetlands, and includes treed swamps, shrub swamps, treed fens, and bogs (Kendall et al. Citation2021). Capturing the heterogeneity of these environments in modeling efforts, particularly as components of the terrestrial carbon cycle, is difficult. Using traditional field-based methods and in-situ data has been limited given the vast and remote boreal expanse, which presents many challenges for geospatial modeling.
Under rapidly changing climatic conditions, the interplay between permafrost thaw, wetland expansion and the northward movement of the treeline will translate into dynamic carbon productivity conditions. In order to monitor the carbon cycle of Canadian boreal forested ecosystems, it is imperative that we understand the underlying environmental dynamics and drivers of change, and develop robust terrestrial carbon estimates at appropriate temporal and spatial scales. Impacts of changing climate have complex impacts on these landscapes, and failure to capture changing conditions and resultant vegetation and landscape patterns may translate into considerable uncertainty in modeling estimates (Srinet et al. Citation2022; Lees et al. Citation2021; Xie and Li Citation2020).
Our aim is to review the key drivers of boreal forest productivity, assess the models used to estimate carbon dynamics and land cover change, and highlight current gaps in model development which could be improved by considering a number of recently available satellite datasets and products. To do so, we first review and summarize key drivers of land cover change in the Canadian boreal, and discuss methods for modeling boreal vegetation productivity in section 2. In section 3 we then discuss several novel and thematic remote sensing datasets that can be leveraged to address key uncertainties identified in current modeling approaches. Specifically, new remote sensing datasets, and remote sensing derived products, are highlighted to address key knowledge gaps in current modeling frameworks.
In the 4th section of the review, we demonstrate a conventional remote sensing-based productivity model across the Hudson Plains Ecozone, characterized by boreal forests and wetlands, and the most southern continuous permafrost in Canada. Following this, we propose a new modeling framework which integrates a number of these new satellite datasets for improved model performance in boreal environments.
Drivers of change in the Canadian boreal
In order to capitalize on newly available remote sensing products, and produce a robust approach for modeling vegetation carbon dynamics at appropriate spatial and temporal resolutions, it is critical to identify the key drivers of change in boreal ecosystems. Anthropogenic and natural disturbances drive mortality, succession, and carbon dynamics in boreal ecosystems (Maynard et al. Citation2014; Price et al. Citation2013). The most prominent of these disturbances in the boreal terrestrial ecosystem are fire, insects, and disease, which are integral to biogeochemical cycling and productivity maintenance (Maynard et al. Citation2014). The impacts of these types of disturbances include single tree mortality and reduced growth rates for low severity disturbances, but in severe scenarios, may also lead to stand replacement (Kurz et al. Citation2013). The degree of disturbance impact subsequently results in the redistribution of carbon in the ecosystem (Kurz et al. Citation2013). Stand replacing disturbances turn the carbon sinks associated to a landscape into a carbon source, and have complex periods of recovery time, determined by factors such as drought, soil type, disturbance frequency and intensity, and competing vegetation (Douglas et al. Citation2014). Disturbance regimes and species adaptations are thus key in understanding carbon dynamics, the most prominent of which are discussed in more detail below.
Fire
Coupled with warming climates and increased periods of drought, fires are a critical driver behind boreal species composition (Price et al. Citation2013). For example, well-adapted deciduous species such as Aspen and Birch are unlikely to experience difficulty in post-fire recovery given their ability to directly regrow their vegetation. Conversely conifer species may be outcompeted, as increasingly hot and dry conditions, along with increasing disturbance frequency, limit new seedling establishment (Price et al. Citation2013, Citation2001). In addition to the implications for forest species distribution, there is an increasing trend of fires in peatlands, which not only contribute to increased permafrost degradation, but also the release of considerable amounts of stored carbon, influencing the global carbon cycle (Price et al. Citation2013). During the 1990-2008 period, boreal fires in Canada are reported to have released an average of 23 TgC yr−1 (Stinson et al. Citation2011). These fires are the source of 9% of global fire emissions, and are the primary driver behind stand renewal in the Canadian boreal (van der Werf et al. Citation2010; Brandt et al. Citation2013).
Insects and disease
Insects and pathogens regulate primary productivity through their impact on the structure and composition of the forest, in turn, they are themselves heavily influenced by fire disturbance and climate (Fleming and Volney Citation1995; Price et al. Citation2013). The steadily warming climate across the Canadian boreal is projected to intensify current disease dynamics involving forest pathogens and insect species (Price et al. Citation2013), particularly through the expansion of insect species range (Kurz et al. Citation2013). Warming climates are expected to increase the rate of insect species development and reproduction, whilst also reducing winter mortality, which will greatly impact insect distribution as they expand their ranges northwards (Harrington, Fleming, and Woiwod Citation2001; Price et al. Citation2013). Insect outbreaks and disease create complex mosaics of impacted forest stands across the landscape (Maynard et al. Citation2014), many impacting at the individual tree or small patch scale. Consequently, we must carefully consider the spatial scale of modeling efforts moving forward, and critically assess whether they are able to capture the spatial patterns of prevalent disturbances.
Climate, temperature, and drought
Moisture is known as a key control factor governing growth, mortality, and biomass accumulation (Hogg and Wein Citation2005; Price et al. Citation2013). Soil moisture in particular, is a primary driver behind vegetative processes like water use, photosynthesis and the decomposition of organic materials, all of which are key components to carbon flux (Jones et al. Citation2017; He et al. Citation2017). The drying climate is impacting forests directly through temperature-induced drought stress and decreasing regeneration, and indirectly through drought-related increases in mortality related to disturbances like fire and disease (Price et al. Citation2013; Hogg and Wein Citation2005). The Canadian boreal zone is likely to experience increased frequency and severity of drought in the 21st century, with drought related mortality expected to increase significantly (Hely et al. Citation2001; Kurz et al. Citation2013; Michaelian et al. Citation2011; van der Molen et al. Citation2011). Under an intermediate future emissions scenario (scenario ‘RCP 4.5′, Taylor et al Citation2012), extreme drought events are projected to increase by a factor of 3.1 whereby the contribution of drought on global GPP loss is increased from 28% during 1850-1999 to 49% by 2075-2099 (Xu et al. Citation2019). Future increases in drought are predicted to result in significant alterations in species distribution (Coops and Waring Citation2011), as well as an overall decrease in productivity of surviving species in the boreal forest, particularly in western North America (van Mantgem et al. Citation2009; Michaelian et al. Citation2011).
Recent warming trends have also led to observed increases in productivity, however, largely due to increases in growing season length and available atmospheric carbon in boreal forests (Briffa et al. Citation2008; Greenwood and Jump Citation2014; Magnani et al. Citation2007; Mekonnen, Grant, and Schwalm Citation2018). The impacts of climate change on boreal forest composition will be more pronounced along the ecotones than the center of a given species’ survival range (Stratton, Price, and Gajewski Citation2011), and it is expected that climate-sensitive species such as boreal conifers will gradually disappear from the southern boundaries of their current extent by 2100 (Price et al. Citation2013). With the aforementioned warming climate and changes in permafrost thaw, Canada’s forests are expected to move northwards in latitude and upward in elevation (Price et al. Citation2013; Greenwood and Jump Citation2014). Consequently, modeling changes in terrestrial productivity in these transition zones is an area of considerable uncertainty. Remote sensing data products that can be leveraged to address these uncertainties will be revisited later in this communication.
Remote sensing approaches to support modelling of boreal vegetation carbon dynamics
Conventional GPP modelling
Measures of forest vegetation growth and carbon accumulation have conventionally been performed using field inventory plots (Asner et al. Citation2013). In response to the challenges and labor associated with plot-based measurements, eddy covariance data from tower networks became a prominent method by which to measure temporal dynamics of net CO2 flux and derived GPP. Similarly to field plot data, however, remote environments and the significant installation and maintenance cost of these towers serve to limit the number of eddy covariance sites (Srinet et al. Citation2022; Sims et al. Citation2008; Asner et al. Citation2013; Lees et al. Citation2021). In addition, regional (e.g., AmeriFlux) and global (i.e., FLUXNET) flux tower networks, via which these measurements are standardized and archived, under-sample the global range of vegetation, climate, and disturbances, leading to considerable bias in measurement-based estimates and model verification (Jones et al. Citation2017; Schimel et al. Citation2015). Additionally, GPP estimates from flux towers are themselves a model output with inherent bias and error, and represent the mean flux of the environment surrounding the sensors and tower (Lees et al. Citation2019), posing challenges as a data source for highly heterogeneous landscapes.
Basic remote sensing approaches for modelling vegetation carbon dynamics
Due to the high spatial and temporal variability of GPP, remote sensing is a critical component toward building regional and global GPP datasets (Verma et al. Citation2015; Xie and Li Citation2020). Many models designed to estimate GPP include the fusion of remote sensing data with other geospatial environmental layers and climate data. Some of these datasets, such as Leaf Area Index (LAI) and gridded products derived from ground-based meteorological observations, are difficult to obtain and include substantial errors, making the models challenging to apply accurately over large spatial extents (Flack-Prain et al. Citation2019; Liu et al. Citation1997; Z. Wang et al. Citation2021). In response, remote sensing has become increasingly central to carbon estimation efforts (Asner et al. Citation2013; Lees et al. Citation2019; Ciais et al. Citation2014). Remote sensing methods represent an approach which can directly assess changes in carbon dynamics and land cover transitions without reliance on ground-based inputs, and offer an opportunity for improving our projections of future changes in these environments (Sims et al. Citation2008; Verma et al. Citation2015; Schimel et al. Citation2015; Lees et al. Citation2021).
Some of the simplest model formulations for GPP prediction are based on the correlation between GPP and a remotely sensed greenness index (Zhang and Ye Citation2021). Greenness indices from remote sensing observations commonly make use of Near Infrared (NIR) and Red wavelengths of the electromagnetic spectrum. Changes in these indices reflect vegetation growth and vigor, and are key in GPP predictions (Tang et al. Citation2021). The Enhanced Vegetation Index (EVI) for example, has become increasingly prominent in estimations of GPP. It is commonly applied in models such as the Vegetation Photosynthesis Model (VPM), Temperature and Greenness (TG) model, Greenness and Radiation (GR) model, and the Vegetation Index (VI) model (Jinwei Dong et al. Citation2015). Research has demonstrated that these models typically have good agreement with eddy-covariance data, yet are commonly noted for their inaccurate performance under drought conditions as a result of lacking sensitivity to water stress related variables (Jinwei Dong et al. Citation2015).
More recently, advances in microwave remote sensing technologies have presented an alternative to the use of the direct relationship between greenness indices and GPP through the introduction of Vegetation Optical Depth (VOD) products. VOD captures the radiation absorbed by vegetation as observed by microwave observations, which is primarily driven by water content, biomass, vegetation type, and vegetation density (Wild et al. Citation2022). Notably, microwave observations are not affected by the impact of cloud cover as optical remote sensing products like greenness indices are (Kumar et al. Citation2018). Due to this key advantage, VOD has become a commonly used proxy for above-ground biomass, and has been used alongside flux tower observations to model GPP (Wild et al. Citation2022; Scholze et al. Citation2019).
In addition to greenness indices and microwave observations of VOD, land surface temperature (LST) is a remotely sensed variable which has proven valuable in GPP estimation. LST is an essential climate variable, driven by land surface type and emissivity properties, and with its detection impacted by illumination, and atmospheric conditions amongst other considerations (Yang et al. Citation2020). Because of the complex relationship between LST and these factors, it is challenging to collect large in-situ LST datasets capable of accurately representing large areas, highlighting the potential for satellite-based observations (Yang et al. Citation2020).
An example of a relatively simple approach to estimating productivity which integrates the drivers of greenness and temperature is presented by Sims et al. (Citation2008), who developed the temperature-greenness (TG) model for GPP prediction, based solely on remotely sensed inputs. The TG model uses two key drivers: vegetation greenness and LST, which are scaled using reference GPP information. In their 2008 demonstration of this model framework, Sims et al. leveraged EVI and LST from MODIS along with reference GPP from eddy covariance flux tower data to model GPP across their 11 sites. To account for the inactive winter period, Sims et al. set GPP to 0 when LST falls bellow 0 °C. To account for drought stress, the maximum tolerable LST is set to 30 °C, and GPP is set to 0 if temperatures exceed 50 °C. Parameterizing the TG model then relies on estimating the slope between the combined EVI & LST information and the reference GPP dataset (Sims et al. Citation2008).
The TG model was found to be successful at predicting GPP across a wide range of vegetation types in North America, reporting mean coefficients of determination (r2) of 0.83 for evergreen needleleaf forest sites, and 0.91 for broadleaf forest sites relative to flux tower GPP estimates from 2003-2005 across four and three sites, respectively (Sims et al. Citation2008). The TG model, like many relatively simple spectral index based approaches, has difficulty in predicting productivity in environments which are heavily influenced by moisture dynamics, principally those affected by drought or high moisture wetland environments (Lees et al. Citation2019; Sims et al. Citation2008; Srinet et al. Citation2022; Tang et al. Citation2021). The inclusion of additional remote sensing variables to improve model performance and address such limitations has therefore become a key area of exploration as remote sensing technologies and data products continue to develop. For example, in their assessment of simple Light Use Efficiency (LUE) remote sensing-based models for productivity estimation, Wang et al. (Citation2021) found that, compared to eight other model formats, their two new proposed models including correction factors for moisture out-performed the other models they investigated. They implemented moisture scalars via the use of evaporative fraction and the normalized difference water index (NDWI), respectively, reporting r2 of 0.86 and 0.82 in relation to a global network of 151 flux towers (Z. Wang et al. Citation2021).
Comprehensive approaches to modelling vegetation carbon dynamics
In addition to the development of remote-sensing based models, the past decade has seen development of comprehensive terrestrial remote-sensing based carbon dynamics models designed for carbon cycle estimation (see Li et al., Citation2018 for a comprehensive review of several key satellite-based models). One such modeling approach is the Carnegie Ames Stanford Approach (CASA), which estimates net primary productivity (NPP) through the use of absorbed photosynthetically active radiation (APAR) and LUE (Y. Wang et al. Citation2019). A limitation of CASA is that it relies on APAR as a function of NDVI, which may result in underestimation in densely vegetated areas due to saturation issues with optical spectral indices (Fang et al. Citation2021). In addition, the original CASA model has notable issues regarding its soil moisture parameter, and fails to distinguish between vegetation types in its use of LUE (Y. Wang et al. Citation2019). In contrast, boreal biome-specific models such as the Boreal Ecosystem Productivity (BEPS), explicitly incorporate soil water holding capacity, vegetation and soil information to model productivity in boreal environments (Liu et al. Citation2002, Citation1997). Similar to other models, however, BEPS relies on flux data, and is limited by the spatial resolution of meteorological information.
Data from the MODerate-resolution Imaging Spectroradiometer (MODIS) onboard the Terra and Aqua platforms has also been utilized to derive GPP estimates via the use of the MOD17 GPP algorithm (Running et al. Citation2004). The MOD17 is based on LUE models, and uses APAR and land cover information with constants representative of physiological attributes such as biome specific scaling for LUE (Schubert et al. Citation2012). Evaluations of the MOD17 GPP product have noted uncertainties related to both the APAR and input meteorological data, leading to updated versions of the product being released. Although it is regarded as a useful measure of GPP, and often used for model comparison, MOD17 is limited by the uncertainty and spatial resolution of its inputs. Most notably, the input MODIS 1-km landcover product used in MOD17 is spatially coarse and therefore not well suited for accurately capturing the heterogenous landscapes of Canadian boreal environments.
Although these aforementioned models focus directly on the estimation of GPP, there have also been models dedicated to monitoring carbon sinks and sources that incorporate estimates of GPP as an intermediate variable. Incorporating microwave-derived VOD introduced in the previous section, recent works such as Scholze et al. (Citation2019) highlight the potential of remotely sensed atmospheric carbon and biomass estimates in quantifying carbon sinks through an adaptation of a diagnostic biosphere model from Kaminski et al. (Citation2017). This biosphere model calculates carbon uptake through the LUE approach, incorporating a vegetation specific light-use efficiency parameter, a water stress factor, and incident solar radiation (Kaminski et al., Citation2017). Assimilating in-site atmospheric carbon into this model framework along with soil moisture and VOD, Scholze et al. (Citation2019) demonstrate the potential of new remotely sensed estimates of carbon dynamics drivers to produce estimates of carbon sinks that are consistent with more traditional modeling approaches. In particular, they found that the inclusion of microwave derived soil moisture and VOD can reduce flux uncertainty by an additional 15-25% relative to models that only assimilate CO2.
In addition to the continued development of productivity models, new remote sensing missions have been developed to provide new insights on soil moisture, landscape freeze/thaw state, boreal carbon dynamics and their drivers, as well as deepening long-term data archives on land cover and land cover change dynamics. These missions present opportunities for new model formulations which utilize a wider range of remote sensing input, allowing finer spatial and temporal time scales to be modeled and with a reduced set of input variables thereby increasing its applicability and ease of use over larger areas. Whilst remote sensing-only model formulations have biases of their own, they may offer the most viable means for assessing long-term carbon dynamics assuming desired accuracies and appropriate lengths of observations can be achieved (Schimel et al. Citation2015).
New remote sensing datasets for boreal productivity modelling
Whilst the basic model formulation using remote sensing observations of landscape greenness and temperature is common to many productivity modeling frameworks, many studies have investigated the need for additional input variables (Lees et al. Citation2019; Sims et al. Citation2008; Xie and Li Citation2020) to ensure the models produce accurate results over a variety of land cover types (Jiaqi Dong et al. Citation2017; Lees et al. Citation2021). These additional variables are intended to represent key drivers of vegetation productivity either directly, or through proxy as scalar correction factors. Capturing these drivers of carbon flux at sufficiently fine spatial scales from remote sensing observations has remained a challenge, whilst robust, fine scale predictions of a variety of these additional model drivers are needed. Such predictions may be pursued using several new and exciting satellite missions; a number of which are described more fully below.
Remote sensing of water availability status
Small changes in soil moisture and water stress have large effects on carbon dynamics, and are required to ensure accurate GPP modeling, especially in boreal forest and wetland environments (Ju et al. Citation2006; Chen et al. Citation2007; Jones et al. Citation2017; Flack-Prain et al. Citation2019; Tang et al. Citation2021; Jinwei Dong et al. Citation2015). A viable method to capture seasonal variability in GPP is through the introduction of soil moisture as a proxy for drought; a well-documented control on GPP not captured by LST (Stocker et al. Citation2019; Verma et al. Citation2015; Xu et al. Citation2019). Ground-based soil moisture observations have insufficient spatial density to accurately represent the heterogeneity of soil moisture at spatially extensive scales, and remote sensing measurements of soil moisture are thus a promising alternative (Kumar et al. Citation2018).
SMOS was launched in November 2009 and was the first satellite mission to provide global measurements of L-band brightness temperatures, from which soil moisture and ocean salinity data products were derived. SMOS is equipped with the Microwave Imaging Radiometer using Aperture Synthesis (MIRAS), which is a passive microwave 2-D interferometric radiometer operating at 1.413 GHz (Mecklenburg et al. Citation2016). L-band microwave observations are highly sensitivity to soil moisture (Jackson and Schmugge Citation1991), which along with near-transparency of the atmosphere in the L-band spectral range, allows for both accurate and consistent global observations of emitted radiation from land and ocean surfaces (Mecklenburg et al. Citation2016).
SMOS measures the brightness temperature emitted from the earth at L-band across a swatch of approximately 1000-km, with a spatial resolution of 35-50-km, and a revisit time of 3 days at the equator (Mecklenburg et al. Citation2016). Soil Moisture products are available in several products with varying processing levels, with gridded spatial resolutions ranging from 15-25km.
The Soil Moisture Active Passive (SMAP) mission, launched in January 2015, commenced operations in April 2015. Notably, the SMAP radar instrument (providing 1-km resolution measurements) failed after three months of science data collection, necessitating sole use of the radiometer measurements (at 9 to 36-km resolution). SMAP retrieves soil moisture from measurements of naturally emitted L-band (1-2 GHz) microwave radiation, the observed radiance of which is highly sensitive to soil moisture in the top 5 cm of the soil column (Reichle et al. Citation2019). Notably, these microwave wavelengths are not limited by traditional optical remote sensing concerns such as solar illumination and cloud cover (Kumar et al. Citation2018). SMAP provides global coverage at a temporal resolution of 2 to 3 days, and can provide insights into both soil moisture status as well as landscape freeze/thaw state. Global grid-projected estimates of soil moisture are available as L3 products and consist of daily global composites of landscape soil moisture, derived from the radiometer brightness temperature measurements at 36-km. Level 4 products are also available, which model soil moisture through the use of SMAP observations and the NASA Catchment land surface model. Beyond an estimate of surface (0-5cm) soil moisture, the Level 4 algorithm also produces an estimate of root-zone (0-100cm) soil moisture at 9-km resolution (Reichle et al. Citation2019). Although coarse resolution remote sensing information is able to capture regional scale soil moisture anomalies, stand-level information on the interplay between drought, disturbances, and productivity can be difficult to estimate.
Remote sensing of near-Surface soil state and growing season length
In addition to providing information on water availability and drought, another key use of L-band measurements is for monitoring landscape freeze/thaw state. Seasonal freeze/thaw (F/T) dynamics are key drivers of vegetation productivity and soil respiration in boreal and arctic regions, where vegetation growth and photosynthetic activity is heavily constrained by the short growing season, or non-frozen period (Kim et al. Citation2012; Kalantari et al. Citation2015). Soil freeze is notably not a primary cause for decreasing plant productivity, yet serves as a suitable proxy for delimiting the end of the vegetation active period - defined as a dormant state for photosynthetic activity and carbon assimilation during winter conditions (Böttcher et al. Citation2018), and is the primary driver of growing season length in boreal and arctic regions (Kalantari et al. Citation2015; Derksen et al. Citation2017). The surface F/T state is monitored by the combined use of active and passive microwave instruments, each with their own unique advantages and limitations (Rautiainen et al. Citation2014; Derksen et al. Citation2017). Active RADAR is able to detect freeze/thaw state at high spatial resolution, but is limited by low temporal resolutions (Podest, McDonald, and Kimball Citation2014). Passive microwave instruments conversely have high temporal resolution, but are limited by their coarse spatial resolution.
Derived from the aforementioned SMOS L-band radiometer observations, the SMOS Level 3 Freeze/Thaw product is gridded at a spatial resolution of 25-km at 3-day time-steps (Böttcher et al. Citation2018; Kim et al. Citation2011; Rautiainen et al. Citation2014). Freezing of moisture in the first 5 cm of ground surface and in vegetation increases the measurements of brightness temperature captured by the L-band due to the high contrast in permittivity between frozen and thawed states (Rautiainen et al. Citation2014; Roy et al. Citation2020; Mecklenburg et al. Citation2016). Capitalizing on this relationship, NASA’s SMAP mission also provides users with a Level 3 Freeze/Thaw product, derived from 36-km spatial resolution L-band observations, and gridded with a spatial resolution of 9 km. Derksen et al. (Citation2017) note several key uncertainties for L-band retrievals of F/T state such as an insensitivity to the soil state when wet snow is present (Derksen et al. Citation2017).
Fine scale land cover and land cover change datasets
The relationships between greenness, temperature and GPP differs across land cover types due to the variable conditions under which the vegetation is photosynthetically active. In order to understand the impacts of heterogeneous land cover on these relationships, fine-scale land cover information is critical. Canada-wide land cover information is available annually at 30-m from 1984 to present via the National Terrestrial Ecosystem Monitoring System (NTEMS). Landsat annual image composites, produced following the Composite2Change (C2C) approach (Hermosilla et al. Citation2016) utilize the free and open Landsat archive (White et al. Citation2014) to produce annual, gap-free, surface-reflectance image composites with a 30-m spatial resolution as well as the detection and characterization of forest disturbance information (Hermosilla et al. Citation2015). The Landsat archive allows pixel scoring functions to be developed to create best-available pixel image (BAP) composites (White et al. Citation2014). The pixel scoring function ranks and selects the optimum annual pixel observation to be used in an image composite based on sensor type, day of acquisition, distance to cloud or cloud shadow, and atmospheric opacity (White et al. Citation2014). The Virtual Land Cover Engine (VLCE) is a methodological framework that utilizes time series of Landsat surface reflectance to enable change-informed annual land cover mapping across Canada’s forested ecosystems (Hermosilla et al. Citation2018). The VLCE 2.0 extends on the original framework through the refinement of calibration data, the integration of new predictor variables and the optimization of regional model development and implementation (Hermosilla et al. Citation2022). Annual land cover maps for 1984 to 2019 were produced following the VLCE framework to map 12 land cover classes across Canada at a 30 m spatial resolution (Hermosilla et al. Citation2022). Out of the 12 classes, there are four vegetated treed classes: deciduous, coniferous, mixedwood and wetland-treed, as well as a wetland class. This land cover information can be used to assess complex and heterogenous landscape patterns and trends of change.
Sentinel 3-Derived land surface temperature
In addition to these new data products, refined and modern estimates of previously explored variables have also been developed over the past decade. Notably, the European Space Agency has introduced new estimates of LST via the Sentinel-3 program, with Sentinel-3A being launched in February 2016, and Sentinel-3B in April 2018. Sentinel-3 carries the Sea and Land Surface Temperature Radiometer (SLSTR) sensor, which is an infrared radiometer with six channels covering visible, near infrared, and shortwave infrared wavelengths, and three channels covering thermal infrared wavelengths (Yang et al. Citation2020). The Level-2 LST product is created using the SLSTR sensor (channels S7, S8 and S9), and is derived from a split window algorithm using information on surface biome, water vapor content, and vegetation fraction cover (Pérez-Planells et al. Citation2021; Yang et al. Citation2020). With a sun-synchronous orbit and high observation frequency, Sentinel-3 provides daily global coverage of LST at 1-km spatial resolution. Given the importance of LST as an indicator of environmental factors such as hydrology and drought, and the documented difficulty of collecting in-situ LST information, Sentinel-3 LST provides modern, high-quality insight into the drivers behind terrestrial carbon sequestration.
Knowledge gaps in predicting vegetation carbon dynamics in the boreal
Given existing modeling approaches, the advent of new remote sensing technologies and products, and the drivers of change in boreal environments, several key knowledge gaps stand out from the literature. Despite the aforementioned efforts for modeling vegetation carbon dynamics, global carbon observation efforts have been described as a “sparse, exploratory framework” (Ciais et al. Citation2014), with the various carbon monitoring models and products often diverging on estimates (Schimel et al. Citation2015). In the Canadian boreal, key sources of uncertainty are: the impact of the warming climate on the northern treeline, carbon estimates in wetland landscapes, and the implications of permafrost thaw.
The Canadian treeline
Changes in the timing of seasonal freeze and thaw transitions has a major impact on the growing season length and carbon flux in boreal regions (Kalantari et al. Citation2015; Derksen et al. Citation2017; Madani et al. Citation2021; Pulliainen et al. Citation2017). With warmer temperatures and longer growing seasons, we anticipate more rapidly regenerating forests, and northward movement of forest vegetation along the treeline (Beck and Goetz Citation2011; Nemani et al. Citation2003; Cazzolla Gatti et al. Citation2019). Although the rate at which species will migrate northward as climate warms is highly variable (Greenwood and Jump Citation2014), average northward shifts of climate envelopes in North America are predicted to reach as much as 700-km by 2071-2100 (Price et al. Citation2013; D. W. McKenney et al. Citation2007).
In the boreal zone, this migration rate is heavily constrained by seed dispersal distance, soil suitability, water, and the suitability of soil conditions (Asner et al. Citation2009; Price et al. Citation2013; D. McKenney, Pedlar, and O’Neill Citation2009; Higgins et al. Citation2003). In the Alaskan boreal for example, GPP has been increasing by 3.2 +/− 1.9 Tg C yr−1 over the past 20 years, an increase attributable largely in part due to increased productivity early in the growing season (Madani et al. Citation2021). Although not directly indicative of treeline migration, this increase in GPP does offer some indication of increasingly suitable conditions for vegetation growth. Overall, the advancement of the treeline and the resultant impact on carbon dynamics will be slow and small per unit area (Limpens et al. Citation2021), yet can collectively magnify carbon accumulation at national levels (Greenwood and Jump Citation2014).
Wetlands
Despite their widespread distribution in Canada’s boreal (Wulder et al. Citation2018), the carbon flux related to boreal wetlands is poorly documented, and remains largely unknown (Magnan et al. Citation2020; Junttila et al. Citation2021; Lees et al. Citation2019). Forested wetland ecosystems across Canada accumulated an estimated 70.5 Tg C yr−1 during the 20th century (Ju et al., Citation2006) through the slow accumulation of carbon in wetlands due to decomposition of organic matter under anaerobic conditions. Sequestration rates between wetland types are strongly influenced by moisture availability, drainage, vegetation composition, and nutrient availability. Ju et al. (Citation2006) note that well-drained regions accumulate an average of 10.8 kg C m−2 yr−1, whilst poorly drained areas accumulate an average of 175 kg C m−2 yr−1. Even within one wetland type, however, notable variability can exist. A study of carbon sequestration in forested peatland in Quebec by Magnan et al. (Citation2020) suggests wetlands store between 62 to 172 kg C m−2 in their organic layers, with an average accumulation rate across six sites of 15.9 g C m−2 yr−1.
Wetlands in particular are highly sensitive to disturbance, and large amounts of carbon can be released into the atmosphere through permafrost thaw and severe forest fires (Frolking and Roulet Citation2007; Magnan et al. Citation2020; Oris et al. Citation2014; Turetsky et al. Citation2011). Without accounting for disturbances, studies suggest that carbon sequestration still exceeds carbon release in forested wetlands by vast margins, despite changing climate (Kendall et al. Citation2021). Considering the Canadian boreal contains approximately 127 Mha of wetlands (Ju et al. Citation2006), addressing knowledge gaps in GPP modeling for this specific landcover type is a particularly important consideration for Canada-wide boreal modeling efforts.
Permafrost thaw
Carbon stored in boreal forests contain an estimated 10-20% of the global soil carbon pool (Alster, Allison, and Treseder Citation2020), yet these estimates do not account for the significant amounts of carbon stored in permafrost. Using the Northern Circumpolar Soil Carbon Database, estimates by Tarnocai et al. (Citation2009) indicate an organic soil carbon pool of 1,672 billion metric tons attributable to the northern permafrost region, representing 50% of global belowground organic carbon. Permafrost temperatures in the northern circumpolar permafrost region have increased over the last several decades (Smith et al. Citation2010; Biskaborn et al. Citation2019). Carbon storage in these landscapes is highly sensitive to warming climates (O’Donnell et al. Citation2012), and may decrease due to rising microbial and enzyme activity, or growing litter inputs and root production, both resultant from climatic warming (Alster, Allison, and Treseder Citation2020).
Thaw-induced waterlogging is a key driver of forest loss in permafrost transition zones, and one of the dominant drivers behind landcover change in the subarctic boreal, and must be considered in tandem with the aforementioned northward treeline migration in order to capture the full context of landcover change in Canada’s northern boreal (Carpino et al. Citation2018). Changes in fire regimes and temperature induced thaw are likely to result in significant changes to sequestration ability and hydrology, which may result in increased carbon release from permafrost landscapes back into the environment (Douglas et al. Citation2014; O’Donnell et al. Citation2012; Williams et al. Citation2020; Helbig et al. Citation2017). As permafrost thaw changes under climate warming, many of the aforementioned conditions for tree migration are expected to change, and thaw dynamics alongside growing season changes may be key indicators of how Canada’s treeline is responding to changing climatic conditions.
Downscaling
In order to address these knowledge gaps using the new remote sensing datasets identified earlier in this communication, the issue of spatial-temporal scale disparities must be addressed. Due to the orbit characteristics of satellite-based sensors, coarse spatial resolution data products are typically delivered with high temporal revisit, as is the case with the Sentinel 3 LST product and the SMOS F/T products. Conversely, remote sensing vegetation greenness indices such as the NDVI used in the TG modeling framework can be derived from Landsat and Sentinel 2, resulting in much finer spatial resolution, but with significantly longer revisit times. As such, optimizing the use of thematic data products representing complex drivers of vegetation productivity requires the implementation of data integration and downscaling approaches. Downscaling studies typically involve the use of multispectral imagery or topographic information with high spatial resolution to model downscaled interpretations of medium or coarse-scale data products. While not the focus of this review, challenges of downscaling approaches are considered in the proposed model framework presented later in this communication.
Demonstration of a simple model for estimating boreal productivity
In order to demonstrate the identified issues and knowledge gaps in modeling estimates of GPP in boreal environments, we apply the existing TG model (Sims et al. Citation2008) described in section 2.2 over the Hudson Plains Ecozone. Through this demonstration, we can identify the inherent model biases and limitations of a simple GPP model prior to discussing additional model inputs and improvements.
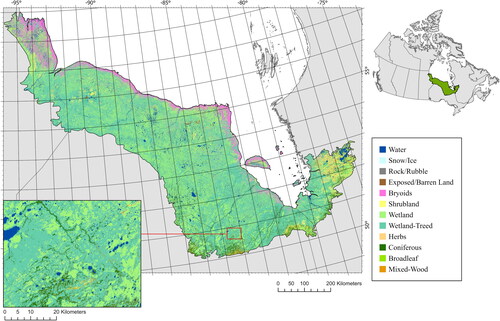
The Hudson Plains Ecozone is a 36,408,957-ha region in Canada containing the largest wetland complex in the country, and the most southern continuous permafrost in North America (Abraham and McKinnon Citation2011). Encompassing sub-arctic ecoregions in the North and mid-boreal ecoregions in the South, the climate of the Hudson Plains is typical of the Canadian boreal, with cold and dry winters, and cool short summers when most precipitation occurs (Brandt et al. Citation2013; Magoun et al. Citation2005). Due to characteristically wet soil conditions, forests in the Hudson Plains are typically found in small clusters across the landscape, interspersed with ponds, lakes, and forested & non-forested wetlands, as shown in (Hermosilla et al. Citation2022, Citation2018). Denser forests are present in southern parts of the Ecozone, where soil drainage is higher (Abraham and McKinnon Citation2011).
Figure 1. National Terrestrial Ecosystem Monitoring System (NTEMS) 30-m land cover map representing the Hudson Plains Ecozone, 2018 (Hermosilla et al. Citation2022, Citation2018).
Data
We utilized daily Sentinel 3 SLSTR LST & NDVI data for 3 years spanning Jan 1st 2017 through Dec 31st 2019. For model evaluation and parameterization, we utilized the SMAP L4C data product. Delivered as part of the SMAP suite of products, the L4C product provides daily model estimates of GPP based on a complex integrated model with inputs from the Goddard Earth Observing System Model (GEOS) surface meteorology, MODIS fractional photosynthetically active radiation (fPAR) climatology, and SMAP-derived soil moisture (Jones et al. Citation2017). The SMAP L4C product delivers daily estimates of GPP (g C m−2 day−1) at 9-km grid spacing. In their assessment of SMAP L4 carbon products, Jones et al. (Citation2017) reported a mean RMSE between L4C Ops products and 26 flux tower validation sites of 1.04 g C m−2 day−1. In addition, they note that, relative to other products, SMAP may be of particular use in areas impacted by drought due to the inclusion of SMAP soil moisture.
To enable the comparison, we resampled the 1-km Sentinel 3 SLSTR LST & NDVI to 9-km spatial resolution through bilinear interpolation using the resample function from the raster package in R (Hijmans and van Etten Citation2012). In order to ensure GPP is compared across relatively homogenous land cover types we extract NTEMS land cover information from 2018 using the ‘exact_extract’ function from the exactextractr package in R (Baston Citation2022), restricting analysis to 9-km cells which had a clear majority (>70%) of a single land cover type. Sentinel 3 SLSTR LST and NDVI were resampled and aggregated from their native resolution and used to predict 16-day mean GPP at 9-km resolution for 2018 & 2019 with reference to SMAP L4C, similar to the approach used for model parameterization per the concepts outlined by Sims et al. (Citation2008). For an overview of input data sources, see .
Table 1. Input data sources Sentinel 3 SLSTR LST & NDVI are resampled using bilinear interpolation to match the spatial resolution and grid of SMAP L4C GPP.
TG model & adaptation
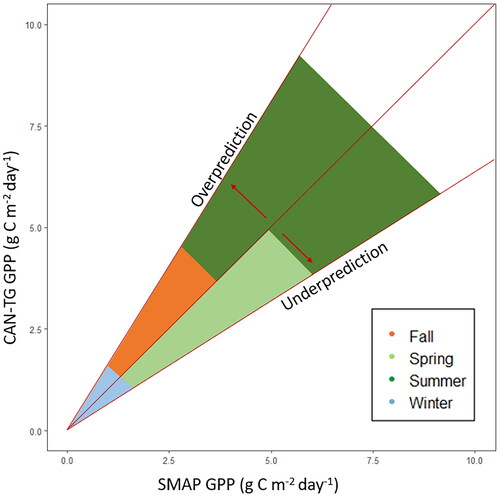
Following the TG concept, we utilized Sentinel 3 SLSTR LST and NDVI to create the product of (greenness * temperature) which was then scaled using the slope between this product and the commensurate SMAP L4C GPP (g C m−2 day−1), stratified by pixels containing homogenous (>70%) land cover types. Scalars were estimated based on the relationship between the combined NDVI & LST and SMAP GPP observations from 2017, and then set as constant for the 2018 and 2019 GPP simulations. A conceptual diagram of the TG model for the Hudson Plains Ecozone is shown in . We then calculated Pearson’s correlation coefficient ‘r’ between model and SMAP GPP for all 16-day mean estimates, across all pixels per stratified area. As shown in , correlations were generally high (>0.8), although notable patterns of seasonal over and under estimation are present, particularly in wetland and forested wetland environments.
Figure 2. 16-Day mean (2017/04/06 to 2017/04/22) LST (degrees Kelvin) (top-left), NDVI (bottom-left) for the Hudson Plains Ecozone (unstratified), combined following the TG concept into an initial estimate of TG GPP (g C m−2 day−1) (middle-right).
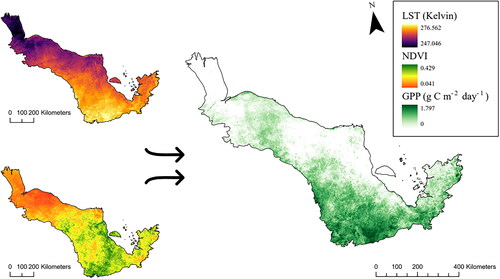
Figure 3. Estimated 16-day mean Gross Primary Productivity (GPP) per stratified land cover type across the Hudson Plains (2018 & 2019), where A = Coniferous > 70% (n = 598), B = Mixed-Wood > 70% (n = 6,440), C = Wetland-Treed > 70% (n = 84,318), and D = Wetlands > 70% (n = 9,016).
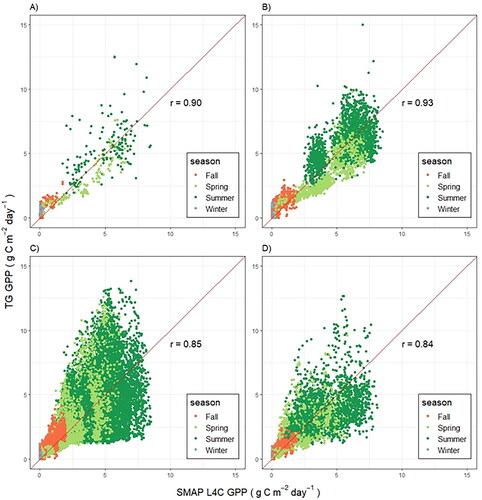
Amongst the four dominant land cover classes identified in the Hudson Plains, correlation coefficients (r) were higher for coniferous (, r = 0.90) and mixed-wood forests (, r = 0.93) than forested wetlands (, r = 0.85) and wetlands (, r = 0.84). The model shows higher overall prediction errors during spring and summer (), and consistently overestimates GPP during winter and fall (). These trends are summarized in .
Figure 4. Temporal variation of 16 day mean Gross Primary Productivity (GPP), averaged per stratified land cover type across the Hudson Plains (2018 & 2019) predicted by SMAP L4C or the adapted TG model. A = Coniferous > 70%, B = Mixed-Wood > 70%, C = Wetland-Treed > 70%, and D = Wetlands > 70%.
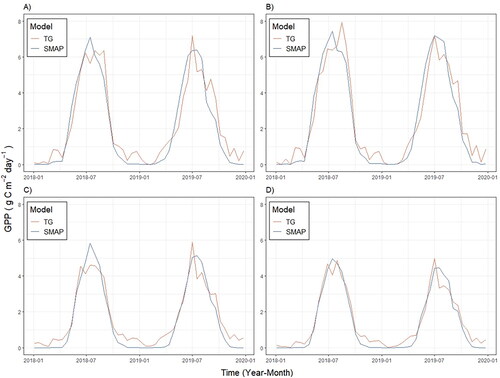
Figure 5. General trends of over and under-prediction of seasonal GPP per the adapted TG model, relative to SMAP L4C GPP based on model performance shown in .
A Proposed new model framework
Overcoming conventional model limitations
To improve model estimates of GPP in boreal environments, the knowledge gaps and conventional model limitations discussed in this communication will need to be meaningfully integrated into a robust new framework. Given the significant difference between TG and SMAP L4C model complexity, the results shown in and highlight the strong performance of the core TG modeling concept as the basis for this framework. The TG model framework demonstrated it was able to capture key trends present in the L4C product across various land cover types in the Canadian boreal, using significantly less input data.
Results reaffirmed that the relationship between greenness & temperature and GPP is not as strong in land cover types that are heavily influenced by moisture dynamics, suggesting there is significant variation in GPP not captured by LST and NDVI, and echoing the notion that the addition of land cover specific moisture scalars and parameterization is critical for optimizing TG model performance and constraining model variance (Jiaqi Dong et al. Citation2017; Sims et al. Citation2008). In addition, results shown in and suggest the TG model yields estimates of GPP during winter periods not shown in the SMAP estimates which suggests marking the winter inactive period by 0 °C may not be appropriate in boreal environments. Instead, constraining winter inactive periods through the use of F/T data (section 3.2) is expected to more accurately represent constraints on vegetation productivity in these northern landscapes.
Over and under-prediction of GPP seasonally, and by land cover type, is evident in and likely due to non-linear relationships between GPP and (scaled NDVI * scaled LST), particularly in the wetland-treed and wetland dominated pixels (), and during the spring and summer seasons. The non-linearity of this relationship is apparent given the inequality of variance visible across seasons in . If GPP were predicted across the entire Hudson Plains ecoregion without land cover specific stratification and model parameterization, there would be significant over and under prediction across the various land cover types (), given the land cover-specific differences in TG model parameters. Improved model performance will rely both on the implementation of appropriate model parameterizations to account for land cover type, as well as improved spatial resolution in model estimates of GPP through the application of downscaling approaches (Section 4.4).
Data & model overview
To address spatial and temporal heterogeneity, identify responses to disturbance, and integrate moisture information for improved GPP estimates, we propose a new modeling approach based on Sentinel-3 LST and greenness estimates combined with SMAP and SMOS derived soil moisture and freeze/thaw data. This approach capitalizes on the proven capabilities of a remote sensing-driven model using temperature and greenness, but augments this model with the required correction factors to address known uncertainties, and constrain estimates of GPP in boreal environments.
Soil moisture data will be downscaled using topographic information from a Digital Elevation Model (DEM) and used to compute a soil moisture modifier, whilst the wetland-oriented scalar NDWI will be derived from Sentinel 2, and introduced to capture the spatial variability in the heterogenous wetland landscapes. F/T data products will be downscaled via a Hidden Markov Model (HMM) algorithm to model downscaled transitions between F/T on a yearly basis to compute a growing season length modifier. Both SMAP and SMOS Soil Moisture and F/T products will be used to compute these model correction factors, and will be assessed for their ability to improve model performance.
Downscaling considerations
As outlined in the downscaling section earlier in this communication, the disparity in resolution between optical, topographic, temperature, and microwave remote sensing sensors and products translates into a need for the use of downscaling methods. In order to adequately capture drivers of GPP at appropriate spatial scales in heterogenous environments like wetlands and treeline transition zones, the resolution of key thematic datasets such as F/T have to meaningfully translated into fine-scale model inputs. At its core, downscaling methods revolve the identification of the relationship between a course-resolution dataset and finer-scale datasets that capture proxy indicators of the variable of interest. The downscaling approach then looks to minimize the error and maximize correlation and determination coefficients between the downscaled and reference dataset in order to provide a finer-scale product of the variable of interest. Recently, random forest regression models have become a popular method by which to achieve this. Wu & Li. (2019) used a random forest regression model to test downscaling of LST through the use of surface reflectance variables, as well as spectral indices, terrain factors, and land cover types. Similarly, Wei et al. (Citation2018) used random forest regression to downscale SMAP soil moisture products with 1 km resolution MODIS optical and thermal information. Vergopolan et al. (Citation2020) were able to improve the resolution of SMAP soil moisture through downscaling even further by applying a merged framework incorporating a land surface model, radiative transfer model, and Bayesian scheme to produce 30 m downscaled SMAP L3/4 soil moisture. Although outside of the scope of this communication, determining optimal downscaling approaches and output product resolution will have to carefully consider works such as those mentioned here, and how they impact model robustness, performance, and error propagation.
CAN-TG model of GPP
Once derived, these downscaled Soil Moisture and F/T products will be leveraged alongside Sentinel LST and Greenness in the newly developed CAN-TG GPP model, which is expected to result in improvements of interannual and intra-annual estimates of GPP at finer spatial scales than currently available (Li et al. Citation2018). Model parameterization will be achieved by first testing on homogenous areas to determine land cover specific slopes between the combined SM, FT, LST, & Greenness and the reference GPP. In principle, model testing in such areas would not require extensive downscaling, and could be used to build model confidence. Key downscaling methods can then be tested to bring the modeled GPP estimates down to appropriate spatial resolutions in key areas of interest, and assess changes in GPP along the northern Canadian tree line (Böttcher et al. Citation2018). For a proposed dataset overview, see ; for an overview of proposed model structure, see .
Figure 6. Proposed Model Framework Structure for CAN-TG. Red boxed indicate primary and secondary data sources. Green box indicates National Terrestrial Ecosystem Monitoring System (NTEMS) land cover attribution information.
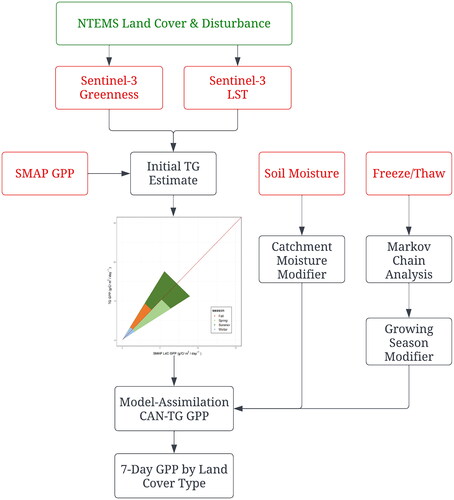
Table 2. Primary data sources for proposed modeling framework.
When adding variables to a model, their correlation is important to consider (Sims et al. Citation2008), therefore, the degrees of independence for the input variables will be investigated in order to present the most robust final modeling approach possible. Reducing model complexity in turn reduces the propagation of errors and uncertainties from the input data (Z. Wang et al. Citation2021), and will lead to improved GPP estimations in comparison to more complex models. In order to assess whether these simplified approaches can provide improved estimates of GPP across the heterogenous landscapes of the Canadian boreal, we recognize the outlined approach will need to be assessed against a suite of reference GPP datasets that accurately represent key boreal landscapes such as wetlands and forested wetlands. This assessment should use both collections of in-situ datasets and existing modeled estimates, and will demonstrate the potential advantages of CAN-TG over competing model frameworks such as SMAP L4 GPP.
Once verified, the new model will deliver spatial estimates of carbon and moisture dynamics from 2016-2020, as well as spatial information on drivers of northern treeline dynamics and wetland GPP accumulation. Due to the fine spatial and temporal resolution of the suggested model, this spatial information will also be appropriate for investigating the heterogenous impacts of disturbances such as wildfires and insect outbreaks on vegetation productivity. In addition, the model will be used to project future likely land cover changes by using existing climate change scenarios.
Conclusion
The Canadian boreal is a prominent component of the global terrestrial carbon cycle, sequestering significant amounts of carbon during its growing season, and accumulating vast stores of carbon in its wetlands. GPP, the rate at which vegetation sequesters carbon, is a key indicator of the complex carbon cycle, and may be modeled through various approaches. In this communication, we outline a variety of conventional and current frameworks for GPP modeling, and identify multi-source remote sensing frameworks based on the TG model ((scaled greenness * scaled land surface temperature) * GPP scalar) as a promising direction for continued GPP model development.
Estimates of GPP in the Canadian boreal are uniquely difficult to formulate due to the considerable uncertainty revolving wetland landscapes, a rapidly warming climate, and changing freeze/thaw dynamics. To address these uncertainties, we will utilize SMOS freeze/thaw, SMAP soil moisture, and Sentinel-3 greenness & land surface temperature information for the development of a remote sensing-driven way forward in GPP modeling.
Using the newly available greenness and land surface temperature information from Sentinel 3, we constructed this demonstration to provide initial GPP information for model parameterization and comparison, with reference to SMAP L4C. Although a highly complex model with its own uncertainties and limitations, these reference estimates provide an early indicator of how well trends in GPP may be captured via the approach we present. Model parameterization through the use of spatially explicit remote sensing datasets such as SMAP GPP provide a distinct advantage over traditional reference GPP data from flux towers, as they provide daily and spatially explicit reference data. Although both SMAP and flux-derived GPP are based on complex models, the spatial coverage of the remotely sensed SMAP GPP allows us to investigate drivers of carbon dynamics in unique Canadian boreal environments under changing climates on a pixel-by-pixel basis. This allows us to investigate the parametrization of robust model structures such as the one proposed in this communication with use of reference GPP which is not captured adequately in the flux station network.
Via the continued development of the adapted TG model through the proposed framework, we expect to capture greater levels of the variability present in SMAP L4C at fine spatial and temporal resolutions, leading to a robust, remote sensing driven model for accurate estimation of GPP in boreal environments. The inclusion of growing season length scalars is expected to constrain observed seasonal over-prediction of GPP in winter and fall, whilst the soil moisture modifier is expected to constrain underestimation of spring GPP, and overall variation of estimates during summer (). The addition of these scalars is also expected to significantly improve estimates of GPP in environments dominated by wetlands and treed wetlands, particularly during spring and summer.
We reaffirm the need for continued advancement of exclusively remote sensing-driven GPP modeling efforts. Per the identified drivers of carbon dynamics, present knowledge gaps, and proposed model framework, we expect that estimates of GPP through the continued development of the TG model concept will result in robust, high-resolution information on boreal carbon dynamics.
Acknowledgements
The authors acknowledge the help of Dr. Sara Knox for her input on the preparation of the manuscript.
Disclosure statement
No conflict of interest was reported by the authors(s).
Additional information
Funding
References
- Abraham, K. F., and McKinnon, L. M. 2011. Hudson Plains Ecozone + Evidence for Key Findings Summary. Canadian Councils of Resource Ministers. https://go.exlibris.link/xkvTVwYN
- Alster, C.J., Allison, S.D., and Treseder, K.K. 2020. “Carbon budgets for soil and plants respond to long-term warming in an Alaskan boreal forest.” Biogeochemistry, Vol. 150(No. 3): pp. 345–353. doi:10.1007/s10533-020-00697-0.
- Asner, G.P., Field, C.B., Hamilton, H., Loarie, S.R., Ackerly, D.D., and Duffy, P.B. 2009. “The velocity of climate change.” Nature, Vol. 462(No. 7276): pp. 1052–1055. doi:10.1038/nature08649.
- Asner, G.P., Mascaro, J., Anderson, C., Knapp, D.E., Martin, R.E., Kennedy-Bowdoin, T., van Breugel, M., et al. 2013. “High-fidelity national carbon mapping for resource management and REDD.” Carbon Balance and Management, Vol. 8(No. 1): pp. 7. doi:10.1186/1750-0680-8-7.
- Baston, Daniel. 2022. Exactextractr: Fast Extraction from Raster Datasets Using Polygons. https://cran.r-project.org/web/packages/exactextractr/index.html.
- Beck, P.S.A., and Goetz, S.J. 2011. “Satellite observations of high northern latitude vegetation productivity changes between 1982 and 2008: Ecological variability and regional differences.” Environmental Research Letters, Vol. 6(No. 4): pp. 045501. doi:10.1088/1748-9326/6/4/045501.
- Biskaborn, B.K., Smith, S.L., Noetzli, J., Matthes, H., Vieira, G., Streletskiy, D.A., Schoeneich, P., et al. 2019. “Permafrost is warming at a global scale.” Nature Communications, Vol. 10(No. 1): pp. 264. doi:10.1038/s41467-018-08240-4.
- Bonan, G.B., and Shugart, H.H. 1989. “Environmental factors and ecological processes in boreal forests.” Annual Review of Ecology and Systematics, Vol. 20(No. 1): pp. 1–28. doi:10.1146/annurev.es.20.110189.000245.
- Böttcher, K., Rautiainen, K., Aurela, M., Kolari, P., Mäkelä, A., Arslan, A.N., Black, T.A., and Koponen, S. 2018. “Proxy indicators for mapping the end of the vegetation active period in boreal forests inferred from satellite-observed soil freeze and ERA-interim reanalysis air temperature.” PFG – Journal of Photogrammetry, Remote Sensing and Geoinformation Science, Vol. 86(No. 3-4): pp. 169–185. doi:10.1007/s41064-018-0059-y.
- Brandt, J.P., D Flannigan, M., Maynard, D.G., Thompson, I.D., and Volney, W.J.A. 2013. “An introduction to Canada’s boreal zone: Ecosystem processes, health, sustainability, and environmental issues.” Environmental Reviews, Vol. 21(No. 4): pp. 207–226. doi:10.1139/er-2013-0040.
- Briffa, K.R., Shishov, V.V., Melvin, T.M., Vaganov, E.A., Grudd, H., Hantemirov, R.M., Eronen, M., and Naurzbaev, M.M. 2008. “Trends in recent temperature and radial tree growth spanning 2000 years across Northwest Eurasia.” Philosophical Transactions of the Royal Society of London. Series B, Biological Sciences, Vol. 363(No. 1501): pp. 2271–2284. doi:10.1098/rstb.2007.2199.
- Canadell, J.G., and Raupach, M.R. 2008. “Managing forests for climate change mitigation.” Science (New York, N.Y.), Vol. 320(No. 5882): pp. 1456–1457. doi:10.1126/science.1155458.
- Carpino, O.A., Berg, A.A., Quinton, W.L., and Adams, J.R. 2018. “Climate change and permafrost thaw-induced boreal forest loss in Northwestern Canada.” Environmental Research Letters, Vol. 13(No. 8): pp. 084018. doi:10.1088/1748-9326/aad74e.
- Cazzolla Gatti, R., Callaghan, T., Velichevskaya, A., Dudko, A., Fabbio, L., Battipaglia, G., and Liang, J. 2019. “Accelerating upward treeline shift in the altai mountains under last-century climate change.” Scientific Reports, Vol. 9(No. 1): pp. 7678. doi:10.1038/s41598-019-44188-1.
- Chapin, F.S., McGuire, A.D., Ruess, R.W., Hollingsworth, T.N., Mack, M.C., Johnstone, J.F., Kasischke, E.S., et al. 2010. “Resilience of Alaska’s boreal forest to climatic change.” Canadian Journal of Forest Research, Vol. 40(No. 7): pp. 1360–1370. doi:10.1139/X10-074.
- Chen, X.F., Chen, J.M., Q An, S., and Ju, W.M. 2007. “Effects of topography on simulated net primary productivity at landscape scale.” Journal of Environmental Management, Vol. 85(No. 3): pp. 585–596. doi:10.1016/j.jenvman.2006.04.026.
- Ciais, P., Dolman, A.J., Bombelli, A., Duren, R., Peregon, A., Rayner, P.J., Miller, C., et al. 2014. “Current systematic carbon-cycle observations and the need for implementing a policy-relevant carbon observing system.” Biogeosciences, Vol. 11(No. 13): pp. 3547–3602. doi:10.5194/bg-11-3547-2014.
- Coletti, J.Z., Hinz, C., Vogwill, R., and Hipsey, M.R. 2013. “Hydrological controls on carbon metabolism in wetlands.” Ecological Modelling, Vol. 249 pp. 3–18. doi:10.1016/j.ecolmodel.2012.07.010.
- Coops, N.C., and Waring, R.H. 2011. “Estimating the vulnerability of fifteen tree species under changing climate in Northwest North America.” Ecological Modelling, Vol. 222(No. 13): pp. 2119–2129. doi:10.1016/j.ecolmodel.2011.03.033.
- Derksen, C., Xu, X., Scott Dunbar, R., Colliander, A., Kim, Y., Kimball, J.S., Black, T.A., et al. 2017. “Retrieving landscape freeze/thaw state from Soil Moisture Active Passive (SMAP) radar and radiometer measurements.” Remote Sensing of Environment, Vol. 194 pp. 48–62. doi:10.1016/j.rse.2017.03.007.
- Dong, J., Li, L., Shi, H., Chen, X., Luo, G., and Yu, Q. 2017. “Robustness and uncertainties of the ‘Temperature and Greenness’ model for estimating terrestrial gross primary production.” Scientific Reports, Vol. 7(No. 1): pp. 44046. doi:10.1038/srep44046.
- Dong, J., Xiao, X., Wagle, P., Zhang, G., Zhou, Y., Jin, C., Torn, M.S., et al. 2015. “Comparison of four EVI-based models for estimating gross primary production of maize and soybean croplands and tallgrass prairie under severe drought.” Remote Sensing of Environment, Vol. 162 pp. 154–168. doi:10.1016/j.rse.2015.02.022.
- Douglas, T.A., Jones, M.C., Hiemstra, C.A., and Arnold, J.R. 2014. “Sources and sinks of carbon in boreal ecosystems of interior Alaska: A review.” Elementa: Science of the Anthropocene, Vol. 2: pp. 000032. doi:10.12952/journal.elementa.000032.
- Fang, P., Yan, N., Wei, P., Zhao, Y., and Zhang, X. 2021. “Aboveground biomass mapping of crops supported by improved casa model and sentinel‐2 multispectral imagery.” Remote Sensing, Vol. 13(No. 14): pp. 2755. doi:10.3390/rs13142755.
- Flack-Prain, S., Meir, P., Malhi, Y., Smallman, T.L., and Williams, M. 2019. “The importance of physiological, structural and trait responses to drought stress in driving spatial and temporal variation in GPP across amazon forests.” Biogeosciences, Vol. 16(No. 22): pp. 4463–4484. doi:10.5194/bg-16-4463-2019.
- Fleming, R.A., and Volney, W.J.A. 1995. “Effects of climate change on insect defoliator population processes in Canada’s Boreal Forest: Some plausible scenarios.” Water, Air, & Soil Pollution, Vol. 82(No. 1-2): pp. 445–454. doi:10.1007/BF01182854.
- Friend, A.D., Lucht, W., Rademacher, T.T., Keribin, R., Betts, R., Cadule, P., Ciais, P., et al. 2014. “Carbon residence time dominates uncertainty in terrestrial vegetation responses to future climate and atmospheric CO2.” Proceedings of the National Academy of Sciences of the United States of America, Vol. 111(No. 9): pp. 3280–3285. doi:10.1073/pnas.1222477110.
- Frolking, S., and Roulet, N.T. 2007. “Holocene radiative forcing impact of northern peatland carbon accumulation and methane emissions.” Global Change Biology, Vol. 13(No. 5): pp. 1079–1088. doi:10.1111/j.1365-2486.2007.01339.x.
- Greenwood, S., and Jump, A.S. 2014. “Consequences of treeline shifts for the diversity and function of high altitude ecosystems.” Arctic, Antarctic, and Alpine Research, Vol. 46(No. 4): pp. 829–840. doi:10.1657/1938-4246-46.4.829.
- Harrington, R., Fleming, R.A., and Woiwod, I.P. 2001. “Climate Change Impacts on Insect Management and Conservation in Temperate Regions: Can They Be Predicted?” Agricultural and Forest Entomology, Vol. 3(No. 4): pp. 233–240. doi:10.1046/j.1461-9555.2001.00120.x.
- He, L., Chen, J.M., Liu, J., Bélair, S., and Luo, X. 2017. “Assessment of SMAP soil moisture for global simulation of gross primary production.” Journal of Geophysical Research: Biogeosciences, Vol. 122(No. 7): pp. 1549–1563. doi:10.1002/2016JG003603.
- Helbig, M., Chasmer, L.E., Desai, A.R., Kljun, N., Quinton, W.L., and Sonnentag, O. 2017. “Direct and indirect climate change effects on carbon dioxide fluxes in a thawing boreal forest–wetland landscape.” Global Change Biology, Vol. 23(No. 8): pp. 3231–3248. doi:10.1111/gcb.13638.
- Hely, C., Flannigan, M., Bergeron, Y., and McRae, D. 2001. “Role of vegetation and weather on fire behavior in the canadian mixedwood boreal forest using two fire behavior prediction systems.” Canadian Journal of Forest Research, Vol. 31(No. 3): pp. 430–441. doi:10.1139/cjfr-31-3-430.
- Hermosilla, T., Wulder, M.A., White, J.C., and Coops, N.C. 2022. “Land cover classification in an era of big and open data: optimizing localized implementation and training data selection to improve mapping outcomes.” Remote Sensing of Environment, Vol. 268 pp. 112780. doi:10.1016/j.rse.2021.112780.
- Hermosilla, T., Wulder, M.A., White, J.C., Coops, N.C., and Hobart, G.W. 2015. “An integrated landsat time series protocol for change detection and generation of annual gap-free surface reflectance composites.” Remote Sensing of Environment, Vol. 158 pp. 220–234. doi:10.1016/j.rse.2014.11.005.
- Hermosilla, T., Wulder, M.A., White, J.C., Coops, N.C., and Hobart, G.W. 2018. “Disturbance-informed annual land cover classification maps of Canada’s forested ecosystems for a 29-year landsat time series.” Canadian Journal of Remote Sensing, Vol. 44(No. 1): pp. 67–87. doi:10.1080/07038992.2018.1437719.
- Hermosilla, T., Wulder, M.A., White, J.C., Coops, N.C., Hobart, G.W., and Campbell, L.B. 2016. “Mass data processing of time series landsat imagery: pixels to data products for forest monitoring.” International Journal of Digital Earth, Vol. 9(No. 11): pp. 1035–1054. doi:10.1080/17538947.2016.1187673.
- Higgins, S.I., Clark, J.S., Nathan, R., Hovestadt, T., Schurr, F., Fragoso, J.M.V., Aguiar, M.R., Ribbens, E., and Lavorel, S. 2003. “Forecasting plant migration rates: Managing uncertainty for risk assessment.” Journal of Ecology, Vol. 91(No. 3): pp. 341–347. doi:10.1046/j.1365-2745.2003.00781.x.
- Hijmans, RobertJ., and van Etten, Jacob. 2012. Raster: Geographic Analysis and Modeling with Raster Data. http://CRAN.R-project.org/package=raster.
- Hogg, E.H., and Wein, R.W. 2005. “Impacts of drought on forest growth and regeneration following fire in Southwestern Yukon, Canada.” Canadian Journal of Forest Research, Vol. 35(No. 9): pp. 2141–2150. doi:10.1139/x05-120.
- Jackson, T.J., and Schmugge, T.J. 1991. “Vegetation effects on the microwave emission of soils.” Remote Sensing of Environment, Vol. 36(No. 3): pp. 203–212. doi:10.1016/0034-4257(91)90057-D.
- Jones, L.A., Kimball, J.S., Reichle, R.H., Madani, N., Glassy, J., Ardizzone, J.V., Colliander, A., et al. 2017. “The SMAP level 4 carbon product for monitoring ecosystem land-atmosphere co2 exchange.” IEEE Transactions on Geoscience and Remote Sensing, Vol. 55(No. 11): pp. 6517–6532. doi:10.1109/TGRS.2017.2729343.
- Ju, W., Chen, J.M., Andrew Black, T., Barr, A.G., McCaughey, H., and Roulet, N.T. 2006. “Hydrological effects on carbon cycles of Canada’s forests and wetlands.” Tellus B, Vol. 58(No. 1): pp. 16–30. doi:10.3402/tellusb.v58i1.16795.
- Junttila, S., Kelly, J., Kljun, N., Aurela, M., Klemedtsson, L., Lohila, A., Nilsson, M., et al. 2021. “Upscaling Northern Peatland CO2 fluxes using satellite remote sensing data.” Remote Sensing (Sensing, ) Vol. 13(No. 4): pp. 818. doi:10.3390/rs13040818.
- Kalantari, P., Bernier, M., McDonal, K.C., and Poulin, J. 2015. “Using SMOS passive microwave data to develop SMAP freeze/thaw algorithms adapted for the Canadian subarctic.” The International Archives of the Photogrammetry, Remote Sensing and Spatial Information Sciences, Vol. XL-1/W5 pp. 365–368. doi:10.5194/isprsarchives-XL-1-W5-365-2015.
- Kaminski, T., Scholze, M., Vossbeck, M., Knorr, W., Buchwitz, M., and Reuter, M. 2017. “Constraining a terrestrial biosphere model with remotely sensed atmospheric carbon dioxide”. Remote Sensing of Environment, Vol. 203: pp. 109–124. doi:10.1016/j.rse.2017.08.017.
- Keenan, R.J., Reams, G.A., Achard, F., de Freitas, J.V., Grainger, A., and Lindquist, E. 2015. “Dynamics of global forest area: Results from the FAO global forest resources assessment 2015.” Forest Ecology and Management, Vol. 352 pp. 9–20. doi:10.1016/j.foreco.2015.06.014.
- Kendall, R.A., Harper, K.A., Burton, D., and Hamdan, K. 2021. “The role of temperate treed swamps as a carbon sink in Southwestern Nova Scotia.” Canadian Journal of Forest Research, Vol. 51(No. 1): pp. 78–88. doi:10.1139/cjfr-2019-0311.
- Kim, Y., Kimball, J.S., McDonald, K.C., and Glassy, J. 2011. “Developing a global data record of daily landscape freeze/thaw status using satellite passive microwave remote sensing.” IEEE Transactions on Geoscience and Remote Sensing, Vol. 49(No. 3): pp. 949–960. doi:10.1109/TGRS.2010.2070515.
- Kim, Y., Kimball, J.S., Zhang, K., and McDonald, K.C. 2012. “Satellite detection of increasing Northern Hemisphere non-frozen seasons from 1979 to 2008: Implications for regional vegetation growth.” Remote Sensing of Environment, Vol. 121 pp. 472–487. doi:10.1016/j.rse.2012.02.014.
- Kumar, S.V., Dirmeyer, P.A., Peters-Lidard, C.D., Bindlish, R., and Bolten, J. 2018. “Information theoretic evaluation of satellite soil moisture retrievals.” Remote Sensing of Environment, Vol. 204 pp. 392–400. doi:10.1016/j.rse.2017.10.016.
- Kurz, W.A., Shaw, C.H., Boisvenue, C., Stinson, G., Metsaranta, J., Leckie, D., Dyk, A., Smyth, C., and Neilson, E.T. 2013. “Carbon in Canada’s boreal forest—a synthesis.” Environmental Reviews, Vol. 21(No. 4): pp. 260–292. doi:10.1139/er-2013-0041.
- Lal, R. 2008. “Carbon sequestration.” Philosophical Transactions of the Royal Society of London. Series B, Biological Sciences, Vol. 363(No. 1492): pp. 815–830. doi:10.1098/rstb.2007.2185.
- Lees, K., Khomik, M., Quaife, T., Clark, J., Hill, T., Klein, D., Ritson, J., and Artz, R. 2021. “Assessing the reliability of Peatland GPP measurements by remote sensing: From plot to landscape scale.” The Science of the Total Environment, Vol. 766 pp. 142613. doi:10.1016/j.scitotenv.2020.142613.
- Lees, K., Quaife, T., Artz, R.R.E., Khomik, M., Sottocornola, M., Kiely, G., Hambley, G., et al. 2019. “A model of gross primary productivity based on satellite data suggests formerly afforested peatlands undergoing restoration regain full photosynthesis capacity after five to ten years.” Journal of Environmental Management, Vol. 246 pp. 594–604. doi:10.1016/j.jenvman.2019.03.040.
- Li, L., Zhao, Y., Fu, Y., and Xin, Q. 2018. “Satellite-based models need improvements to simulating annual gross primary productivity: A comparison of six models for regional modeling of deciduous broadleaf forests.” Remote Sensing, Vol. 10(No. 7): pp. 1008. doi:10.3390/rs10071008.
- Limpens, J., Fijen, T.P.M., Keizer, I., Meijer, J., Olsthoorn, F., Pereira, A., Postma, R., Suyker, M., Vasander, H., and Holmgren, M. 2021. “Shrubs and degraded permafrost pave the way for tree establishment in subarctic Peatlands.” Ecosystems, Vol. 24(No. 2): pp. 370–383. doi:10.1007/s10021-020-00523-6.
- Liu, J., Chen, J.M., Cihlar, J., and Chen, W. 2002. “Net primary productivity mapped for Canada at 1-km resolution.” Global Ecology and Biogeography, Vol. 11(No. 2): pp. 115–129. doi:10.1046/j.1466-822X.2002.00278.x.
- Liu, J., Chen, J.M., Cihlar, J., and Park, W.M. 1997. “A process-based boreal ecosystem productivity simulator using remote sensing inputs.” Remote Sensing of Environment, Vol. 62(No. 2): pp. 158–175. doi:10.1016/S0034-4257(97)00089-8.
- Madani, N., Parazoo, N.C., Kimball, J.S., Reichle, R.H., Chatterjee, A., Watts, J.D., Saatchi, S., et al. 2021. “The impacts of climate and wildfire on ecosystem gross primary productivity in Alaska.” Journal of Geophysical Research: Biogeosciences, Vol. 126(No. 6): pp. e2020JG006078. doi:10.1029/2020JG006078.
- Magnan, G., Garneau, M., Le Stum-Boivin, É., Grondin, P., and Bergeron, Y. 2020. “Long-term carbon sequestration in boreal Forested Peatlands in Eastern Canada.” Ecosystems (Ecosystems, ) Vol. 23(No. 7): pp. 1481–1493. doi:10.1007/s10021-020-00483-x.
- Magnani, F., Mencuccini, M., Kowalski, A.S., Lankreijer, H., Law, B.E., Lindroth, A., Loustau, D., et al. 2007. “The human footprint in the carbon cycle of temperate and boreal forests.” Nature, Vol. 447(No. 7146): pp. 848–850. doi:10.1038/nature05847.
- Magoun, A.J., Abraham, K.F., Thompson, J.E., Ray, J.C., Gauthier, M.E., Brown, G.S., Woolmer, G., Chenier, C.J., and Dawson, F.N. 2005. “Distribution and relative abundance of caribou in the hudson plains ecozone of Ontario.” Rangifer, Vol. 25(No. 4): pp. 105. doi:10.7557/2.25.4.1776.
- Mantgem, P.J., van, N.L., Stephenson, J.C., Byrne, L.D., Daniels, J.F., Franklin, P.Z., Fulé, M.E., Harmon, et al. 2009. “Widespread increase of tree mortality rates in the western United States.” Science (New York, N.Y.), Vol. 323(No. 5913): pp. 521–524. doi:10.1126/science.1165000.
- Maynard, D.G., Paré, D., Thiffault, E., Lafleur, B., Hogg, K.E., and Kishchuk, B. 2014. “How Do Natural Disturbances and Human Activities Affect Soils and Tree Nutrition and Growth in the Canadian Boreal Forest?” Environmental Reviews, Vol. 22(No. 2): pp. 161–178. doi:10.1139/er-2013-0057.
- McKenney, D., Pedlar, J., and O’Neill, G. 2009. “Climate change and forest seed zones: Past trends, future prospects and challenges to ponder.” The Forestry Chronicle, Vol. 85(No. 2): pp. 258–266. doi:10.5558/tfc85258-2.
- McKenney, D.W., Pedlar, J.H., Lawrence, K., Campbell, K., and Hutchinson, M.F. 2007. “Potential impacts of climate change on the distribution of North American trees.” BioScience, Vol. 57(No. 11): pp. 939–948. doi:10.1641/B571106.
- Mecklenburg, S., Drusch, M., Kaleschke, L., Rodriguez-Fernandez, N., Reul, N., Kerr, Y., Font, J., et al. 2016. “ESA’s soil moisture and ocean salinity mission: From science to operational applications.” Remote Sensing of Environment, Vol. 180 pp. 3–18. doi:10.1016/j.rse.2015.12.025.
- Mekonnen, Z.A., Grant, R.F., and Schwalm, C. 2018. “Modelling impacts of recent warming on seasonal carbon exchange in higher latitudes of North America.” Arctic Science, Vol. 4(No. 4): pp. 471–484. doi:10.1139/as-2016-0009.
- Michaelian, M., Hogg, E.H., Hall, R.J., and Arsenault, E.R.I.C. 2011. “Massive mortality of aspen following severe drought along the southern edge of the canadian boreal forest.” Global Change Biology, Vol. 17(No. 6): pp. 2084–2094. doi:10.1111/j.1365-2486.2010.02357.x.
- Nemani, R.R., Keeling, C.D., Hashimoto, H., Jolly, W.M., Piper, S.C., Tucker, C.J., Myneni, R.B., and Running, S.W. 2003. “Climate-driven increases in global terrestrial net primary production from 1982 to 1999.” Science, Vol. 300(No. 5625): pp. 1560–1563. doi:10.1126/science.1082750.
- O’Donnell, J.A., Jorgenson, M.T., Harden, J.W., McGuire, A.D., Kanevskiy, M.Z., and Wickland, K.P. 2012. “The effects of permafrost thaw on soil hydrologic, thermal, and carbon dynamics in an Alaskan Peatland.” Ecosystems, Vol. 15(No. 2): pp. 213–229. doi:10.1007/s10021-011-9504-0.
- Oris, F., Asselin, H., Ali, A.A., Finsinger, W., and Bergeron, Y. 2014. “Effect of increased fire activity on global warming in the boreal forest.” Environmental Reviews, Vol. 22(No. 3): pp. 206–219. doi:10.1139/er-2013-0062.
- Pérez-Planells, L., Niclòs, R., Puchades, J., Coll, C., Göttsche, F.-M., Valiente, J.A., Valor, E., and Galve, J.M. 2021. “Validation of sentinel-3 SLSTR land surface temperature retrieved by the operational product and comparison with explicitly emissivity-dependent algorithms.” Remote Sensing, Vol. 13(No. 11): pp. 2228. doi:10.3390/rs13112228.
- Petrone, K.C., Jones, J.B., Hinzman, L.D., and Boone, R.D. 2006. “Seasonal export of carbon, nitrogen, and major solutes from alaskan catchments with discontinuous permafrost.” Journal of Geophysical Research: Biogeosciences, Vol. 111(No. G2): pp. G02020. doi:10.1029/2005JG000055.
- Podest, E., McDonald, K.C., and Kimball, J.S. 2014. “Multisensor microwave sensitivity to freeze/thaw dynamics across a complex boreal landscape.” IEEE Transactions on Geoscience and Remote Sensing, Vol. 52(No. 11): pp. 6818–6828. doi:10.1109/TGRS.2014.2303635.
- Price, D.T., Alfaro, R.I., Brown, K.J., D Flannigan, M., Fleming, R.A., Hogg, E.H., P Girardin, M., et al. 2013. “Anticipating the consequences of climate change for canada’s boreal forest ecosystems.” Environmental Reviews, Vol. 21(No. 4): pp. 322–365. doi:10.1139/er-2013-0042.
- Price, D.T., Zimmermann, N.E., van der Meer, P.J., Lexer, M.J., Leadley, P., Jorritsma, I.T.M., Schaber, J., et al. 2001. “Regeneration in gap models: priority issues for studying forest responses to climate change.” Climatic Change, Vol. 51(No. 3/4): pp. 475–508. doi:10.1023/A:1012579107129.
- Pulliainen, J., Aurela, M., Laurila, T., Aalto, T., Takala, M., Salminen, M., Kulmala, M., et al. 2017. “Early snowmelt significantly enhances boreal springtime carbon uptake.” Proceedings of the National Academy of Sciences of the United States of America, Vol. 114(No. 42): pp. 11081–11086. doi:10.1073/pnas.1707889114.
- Rautiainen, K., Lemmetyinen, J., Schwank, M., Kontu, A., Ménard, C.B., Mätzler, C., Drusch, M., Wiesmann, A., Ikonen, J., and Pulliainen, J. 2014. “Detection of soil freezing from L-band passive microwave observations.” Remote Sensing of Environment, Vol. 147 pp. 206–218. doi:10.1016/j.rse.2014.03.007.
- Reichle, R.H., Liu, Q., Koster, R.D., Crow, W.T., De Lannoy, G.J.M., Kimball, J.S., Ardizzone, J.V., et al. 2019. “Version 4 of the SMAP level‐4 soil moisture algorithm and data product.” Journal of Advances in Modeling Earth Systems, Vol. 11(No. 10): pp. 3106–3130. doi:10.1029/2019MS001729.
- Roy, A., Toose, P., Mavrovic, A., Pappas, C., Royer, A., Derksen, C., Berg, A., et al. 2020. “L-band response to freeze/thaw in a boreal forest stand from ground- and tower-based radiometer observations.” Remote Sensing of Environment, Vol. 237 pp. 111542. doi:10.1016/j.rse.2019.111542.
- Running, S.W., Nemani, R.R., Heinsch, F.A., Zhao, M., Reeves, M., and Hashimoto, H. 2004. “A continuous satellite-derived measure of global terrestrial primary production.” Bioscience, Vol. 54(No. 6): pp. 547–560. doi:10.1641/0006-3568(2004)054[0547:ACSMOG]2.0.CO;2
- Schimel, D., Pavlick, R., Fisher, J.B., Asner, G.P., Saatchi, S., Townsend, P., Miller, C., et al. 2015. “Observing terrestrial ecosystems and the carbon cycle from space.” Global Change Biology, Vol. 21(No. 5): pp. 1762–1776. doi:10.1111/gcb.12822.
- Scholze, M., Kaminski, T., Knorr, W., Voßbeck, M., Wu, M., Ferrazzoli, P., Kerr, Y., et al. 2019. “Mean European carbon sink over 2010–2015 estimated by simultaneous assimilation of atmospheric CO2, soil moisture, and vegetation optical depth.” Geophysical Research Letters, Vol. 46(No. 23): pp. 13796–13803. doi:10.1029/2019GL085725.
- Schubert, P., Lagergren, F., Aurela, M., Christensen, T., Grelle, A., Heliasz, M., Klemedtsson, L., et al. 2012. “Modeling GPP in the nordic forest landscape with MODIS time series data—comparison with the MODIS GPP product.” Remote Sensing of Environment, Vol. 126 pp. 136–147. doi:10.1016/j.rse.2012.08.005.
- Sims, D., Rahman, A., Cordova, V., Elmasri, B., Baldocchi, D., Bolstad, P., Flanagan, L., et al. 2008. “A new model of gross primary productivity for North American ecosystems based solely on the enhanced vegetation index and land surface temperature from MODIS.” Remote Sensing of Environment, Vol. 112(No. 4): pp. 1633–1646. doi:10.1016/j.rse.2007.08.004.
- Smith, S.L., Romanovsky, V.E., Lewkowicz, A.G., Burn, C.R., Allard, M., Clow, G.D., Yoshikawa, K., and Throop, J. 2010. “Thermal state of permafrost in North America: A contribution to the international polar year.” Permafrost and Periglacial Processes, Vol. 21(No. 2): pp. 117–135. doi:10.1002/ppp.690.
- Srinet, R., Nandy, S., Watham, T., Padalia, H., Patel, N.R., and Chauhan, P. 2022. “Spatio-temporal variability of gross primary productivity in moist and dry deciduous plant functional types of Northwest Himalayan Foothills of India using temperature-greenness model.” Geocarto International, Vol. 37(No. 7): pp. 2055–2067. doi:10.1080/10106049.2020.1801855.
- Stinson, G., Kurz, W.A., Smyth, C.E., Neilson, E.T., Dymond, C.C., Metsaranta, J.M., Boisvenue, C., et al. 2011. “An inventory-based analysis of canada’s managed forest carbon dynamics, 1990 to 2008.” Global Change Biology, Vol. 17(No. 6): pp. 2227–2244. doi:10.1111/j.1365-2486.2010.02369.x.
- Stocker, B.D., Zscheischler, J., Keenan, T.F., Prentice, I.C., Seneviratne, S.I., and Peñuelas, J. 2019. “Drought impacts on terrestrial primary production underestimated by satellite monitoring.” Nature Geoscience, Vol. 12(No. 4): pp. 264–270. doi:10.1038/s41561-019-0318-6.
- Stratton, T., Price, D.T., and Gajewski, K. 2011. “Impacts of daily weather variability on simulations of the canadian boreal forest.” Ecological Modelling, Vol. 222(No. 17): pp. 3250–3260. doi:10.1016/j.ecolmodel.2011.06.009.
- Tang, Y., Xu, X., Zhou, Z., Qu, Y., and Sun, Y. 2021. “Estimating global maximum gross primary productivity of vegetation based on the combination of MODIS greenness and temperature data.” Ecological Informatics, Vol. 63(No. July): pp. 101307. doi:10.1016/j.ecoinf.2021.101307.
- Tarnocai, C., Canadell, J.G., Schuur, E.A.G., Kuhry, P., Mazhitova, G., and Zimov, S. 2009. “Soil organic carbon pools in the northern circumpolar permafrost region”. Global Biogeochemical Cycles, Vol. 23(No. 2): pp. GB2023. doi: 10.1029/2008GB003327.
- Taylor, K.E., Stouffer, R.J., and Meehl, G.A. 2012. “An overview of CMIP5 and the experiment design”. Bulletin of the American Meteorological Society, Vol. 93(No. 4): pp. 485–498. doi:10.1175/BAMS-D-11-00094.1.
- Turetsky, M.R., Kane, E.S., Harden, J.W., Ottmar, R.D., Manies, K.L., Hoy, E., and Kasischke, E.S. 2011. “Recent acceleration of biomass burning and carbon losses in alaskan forests and Peatlands.” Nature Geoscience, Vol. 4(No. 1): pp. 27–31. doi:10.1038/ngeo1027.
- van der Molen, M.K., Dolman, A.J., Ciais, P., Eglin, T., Gobron, N., Law, B.E., Meir, P., et al. 2011. “Drought and ecosystem carbon cycling.” Agricultural and Forest Meteorology, Vol. 151(No. 7): pp. 765–773. doi:10.1016/j.agrformet.2011.01.018.
- Vergopolan, N., Chaney, N.W., Beck, H.E., Pan, M., Sheffield, J., Chan, S., and Wood, E.F. 2020. “Combining hyper-resolution land surface modeling with SMAP brightness temperatures to obtain 30-m soil moisture estimates”. Remote Sensing of Environment, Vol. 242: pp. 111740. doi: 10.1016/j.rse.2020.111740.
- Verma, M., Friedl, M.A., Law, B.E., Bonal, D., Kiely, G., Black, T.A., Wohlfahrt, G., et al. 2015. “Improving the performance of remote sensing models for capturing intra- and inter-annual variations in daily GPP: An analysis using global FLUXNET tower data.” Agricultural and Forest Meteorology, Vol. 214-215 (<SE-START>(NO. </SE-START > C): pp. 416–429. doi:10.1016/j.agrformet.2015.09.005.
- Virkkala, A.-M., Aalto, J., Rogers, B.M., Tagesson, T., Treat, C.C., Natali, S.M., Watts, J.D., et al. 2021. “Statistical upscaling of ecosystem CO 2 fluxes across the terrestrial tundra and boreal domain: Regional patterns and uncertainties.” Global Change Biology, Vol. 27(No. 17): pp. 4040–4059. doi:10.1111/gcb.15659.
- Wang, Y., Xu, X., Huang, L., Yang, G., Fan, L., Wei, P., and Chen, G. 2019. “An improved CASA model for estimating winter wheat yield from remote sensing images.” Remote Sensing, Vol. 11(No. 9): pp. 1088. doi:10.3390/rs11091088.
- Wang, Z., Liu, S., Wang, Y.-P., Valbuena, R., Wu, Y., Kutia, M., Zheng, Y., et al. 2021. “Tighten the bolts and nuts on GPP estimations from sites to the globe: An assessment of remote sensing based lue models and supporting data fields.” Remote Sensing, Vol. 13(No. 2): pp. 168. doi:10.3390/rs13020168.
- Wei, Z., Sanchez, N., Hui, L., and Ainong, L. 2018. “A spatial downscaling approach for the SMAP passive surface soil moisture product using random forest regression”. Journal of Hydrology (Amsterdam), Vol. 563: pp. 1009–1024. doi:10.1016/j.jhydrol.2018.06.081.
- Werf, G.R., van der, J.T., Randerson, L., Giglio, G.J., Collatz, M., Mu, P.S., Kasibhatla, D.C., Morton., et al. 2010. “Global fire emissions and the contribution of deforestation, Savanna, Forest, Agricultural, and Peat Fires (1997-2009).” Atmospheric Chemistry and Physics, Vol. 10(No. 23): pp. 11707–11735. doi:10.5194/acp-10-11707-2010.
- White, J.C., Wulder, M.A., Hobart, G.W., Luther, J.E., Hermosilla, T., Griffiths, P., Coops, N.C., et al. 2014. “Pixel-based image compositing for large-area dense time series applications and science.” Canadian Journal of Remote Sensing, Vol. 40(No. 3): pp. 192–212. doi:10.1080/07038992.2014.945827.
- Wild, B., Teubner, I., Moesinger, L., Zotta, R.-M., Forkel, M., van der Schalie, R., Sitch, S., and Dorigo, W. 2022. “VODCA2GPP–a new, global, long-term (1988–2020) gross primary production dataset from microwave remote sensing.” Earth System Science Data, Vol. 14(No. 3): pp. 1063–1085. doi:10.5194/essd-14-1063-2022.
- Williams, M., Zhang, Y., Estop-Aragonés, C., Fisher, J.P., Xenakis, G., Charman, D.J., Hartley, I.P., Murton, J.B., and Phoenix, G.K. 2020. “Boreal permafrost thaw amplified by fire disturbance and precipitation increases.” Environmental Research Letters, Vol. 15(No. 11): pp. 114050. doi:10.1088/1748-9326/abbeb8.
- Wulder, M., Li, Z., Campbell, E., White, J., Hobart, G., Hermosilla, T., and Coops, N. 2018. “A national assessment of wetland status and trends for Canada’s forested ecosystems using 33 years of earth observation satellite data.” Remote Sensing (Sensing), Vol. 10(No. 10): pp. 1623. doi:10.3390/rs10101623.
- Xie, X., and Li, A. 2020. “Development of a topographic-corrected temperature and greenness model (TG) for improving GPP estimation over mountainous areas.” Agricultural and Forest Meteorology, Vol. 295(No. December): pp. 108193. doi:10.1016/j.agrformet.2020.108193.
- Xu, C., McDowell, N.G., Fisher, R.A., Wei, L., Sevanto, S., Christoffersen, B.O., Weng, E., and Middleton, R.S. 2019. “Increasing impacts of extreme droughts on vegetation productivity under climate change.” Nature Climate Change, Vol. 9(No. 12): pp. 948–953. doi:10.1038/s41558-019-0630-6.
- Yang, J., Zhou, J., Göttsche, F.-M., Long, Z., Ma, J., and Luo, R. 2020. “Investigation and validation of algorithms for estimating land surface temperature from sentinel-3 SLSTR data.” International Journal of Applied Earth Observation and Geoinformation, Vol. 91(No. September): pp. 102136. doi:10.1016/j.jag.2020.102136.
- Zhang, Y., and Ye, A. 2021. “Would the obtainable Gross Primary Productivity (GPP) products stand up? A critical assessment of 45 global GPP products.” The Science of the Total Environment, Vol. 783(No. August): pp. 146965. doi:10.1016/j.scitotenv.2021.146965.