?Mathematical formulae have been encoded as MathML and are displayed in this HTML version using MathJax in order to improve their display. Uncheck the box to turn MathJax off. This feature requires Javascript. Click on a formula to zoom.
Abstract
The southern Great Plains (SGP) grassland of the United States has been largely encroached by evergreen forest in recent decades. The response of the grassland water and carbon cycles to the encroachment is not clear yet. Given so, this study quantified the changes in gross primary production (GPP), evapotranspiration (ET), and ecosystem water use efficiency (EWUE) between grassland pixels with evergreen forest encroachment and neighboring pure grassland pixels (500 m). We also assessed the spatial variation of the changes in relation to precipitation (mm), air temperature (°C), and evergreen forest coverage (%). These analyses were repeated, respectively for the years of 2004, 2008, 2016, and 2019 as robustness check. Results suggest that across the 4 years, 62–72% of encroached grassland pixels exhibit higher annual GPP, 67–74% exhibit higher annual ET, whereas 65–71% exhibit lower annual EWUE. The change ratio of ET is positively correlated with that of GPP but negatively correlated with that of EWUE. Additionally, the spatial variation in the change ratios of annual GPP and ET can be explained to a certain degree by the encroachment amount. These results further clarify the response of water and carbon cycles to evergreen forest encroachment in the SGP grassland.
RÉSUMÉ
Les prairies du sud des Grandes Plaines (SGP) des États-Unis ont été largement envahies par la forêt à conifère au cours des dernières décennies. La réponse des cycles de l’eau et du carbone des prairies à l’empiètement n’est pas encore claire. Étant donné, cette étude a quantifié les changements dans la production primaire brute (GPP), l’évapotranspiration (ET) et l’efficacité de l’utilisation de l’eau de l’écosystème (EWUE) entre les pixels des prairies avec l’empiètement des forêts à conifères et les pixels des prairies pures voisines (500 m). Nous avons également évalué la variation spatiale des changements par rapport aux précipitations (mm), à la température de l’air (°C) et à la couverture forestière des conifères (%). Ces analyses ont été répétées respectivement pour les années 2004, 2008, 2016 et 2019 comme test de robustesse. Les résultats suggèrent qu’au cours des quatre années, 62 à 72 % des pixels incrustés présentent une GPP annuelle plus élevée, 67 à 74 % une ET annuelle plus élevée, tandis que 65 à 71 % présentent une EWUE annuelle plus faible. Le taux de variation de ET est positivement corrélé avec celui de GPP, mais négativement corrélé avec celui de EWUE. De plus, la variation spatiale des rapports de variation du PPM et de l’ET annuels peut être expliquée dans une certaine mesure par le montant de l’empiétement. Ces résultats nous aident à mieux comprendre la réponse des cycles de l’eau et du carbone à l’empiètement des forêts de conifères dans les prairies de la SGP.
Introduction
Woody plant encroachment, the directional increase of woody plants in density and coverage, has been observed worldwide in grasslands, savannas, and other open areas (Stevens et al. Citation2017; Yang and Crews Citation2020; Wang et al. Citation2021). This phenomenon is proved to affect water and carbon cycles, as well as many other functions of the ecosystems (O’Donnell and Caylor Citation2012; Anadón et al. Citation2014; Qiao et al. Citation2017; Currey et al. Citation2022). For instance, Zou et al. (Citation2014) reported reduced amount and duration of streamflow in an encroached catchment of Oklahoma. Petrie et al. (Citation2015) revealed enhanced ecosystem carbon sequestration in northern Chihuahuan Desert (New Mexico, USA) as grassland transitions to shrubland.
To better characterize the resulting changes in ecosystem water and carbon fluxes, a few indices have been applied, including gross primary productivity (GPP), net primary productivity (NPP), evapotranspiration (ET), and ecosystem water use efficiency (EWUE) (Wang et al. Citation2018a; Deng et al. Citation2021). GPP refers to the amount of CO2 absorbed by all producers in an ecosystem through photosynthesis over a given time period (Beer et al. Citation2010). It is a key parameter demonstrating the CO2 fluxes between bio-geosphere and atmosphere (Damm et al. Citation2010). NPP represents the amount of CO2 retained in an ecosystem over a given time period and equals the difference between GPP and the amount of CO2 consumed for vegetation respiration (Ashton et al. Citation2012). It reflects ecosystem’s ability to accrue plant biomass over time. ET depicts the amount of water lost from Earth’s surface into atmosphere through vegetation transpiration, soil evaporation, and canopy interception evaporation (Zhang et al. Citation2016). EWUE, estimated as the ratio of GPP over concurrent ET, measures ecosystem’s carbon assimilation per unit of evapotranspiration (Brunsell et al. Citation2014).
The direction and magnitude of the encroachment-driven changes in these indices, however, have been found to vary across ecosystems and climate conditions. Data from eddy covariance towers in Kansas unveils higher carbon flux (GPP) of a woody site than its neighboring grassland site, and the difference is remarkably larger in the dry year of 2011 than in the wet years of 2008 and 2009 (Logan and Brunsell Citation2015). A synthesis across North American drylands suggests that woody plant proliferation elevated aboveground NPP in semiarid and subhumid regions, but lowered aboveground NPP in arid regions (Barger et al. Citation2011). Petrie et al. (Citation2015) found in northern Chihuahuan Desert that drier climate condition is more favorable for carbon sequestration (NPP) in the expansion of woody plants.
Wang et al. (Citation2018a) calculated the increase of GPP and ET of juniper-encroached grassland pixels (500 m) from adjacent pure grassland pixels in Oklahoma, on an annual basis from 2001 to 2010. The largest increase ratio in annual GPP and ET occurred in the driest year of 2006, while the lowest increase ratio was observed in the wettest year of 2007. In addition, both GPP and ET increase ratios exhibit a significant positive relationship with the amount of juniper encroachment. Deng et al. (Citation2021) analyzed the impact of woody plant encroachment on the water and carbon cycles across the globe. Increased ET was observed in semi-arid, dry sub-humid, and humid climate zones, while the opposite trend was found in hyper-arid and arid areas. Furthermore, it was found that the encroachment has the strongest impact on GPP and ET in semi-arid regions.
As for EWUE, Deng et al. (Citation2021) revealed that woody plant encroachment enhanced it in semi-arid climates, but lowered it in dry sub-humid regions. Whereas the encroachment has a very minimal impact on EWUE in humid climates. While an increment in EWUE was reported in mesic grasslands of North America as a consequence of woody plant encroachment, the opposite was found in a subtropical wetland (Brunsell et al. Citation2014; Budny and Benscoter Citation2016). In a US native tall-grass prairie, woody plant encroachment resulted in much larger increase in ET than in GPP, and consequently lower EWUE (Logan and Brunsell Citation2015).
In recent decades, the southern Great Plains (SGP) grassland of the United States experienced the most rapid woody plant encroachment across the country (Barger et al. Citation2011). Among others, evergreen forest (e.g. junipers) has been the most important encroachment component (Wang et al. Citation2018b; Yang and Crews Citation2020; Yang et al. Citation2021). As a result, many original grasslands in the SGP are now covered with evergreen trees (Leis et al. Citation2017). The encroachment aroused widespread concern about its consequences in terms of the grassland water and carbon cycles, especially under the context of global climate change (Twidwell et al. Citation2013; Wilcox et al. Citation2018). With regard to the aforementioned varying changes across ecosystems and climate conditions, it is hard to extrapolate the response of water-carbon cycles to the encroachment in the SGP grassland from other studies.
Given so, the first objective of this study is to quantify the changes in annual GPP, ET, EWUE in the SGP grassland due to evergreen forest encroachment. The focus on the impact of evergreen forest encroachment can also minimize the confounding effect of deciduous forest encroachment. These two forest types differ a lot in growing season length, evaporative fraction, and precipitation sensitivity, all of which could make a significant difference in water-carbon cycles (Wang et al. Citation2016; Burman et al. Citation2021). The second objective is to assess the correlation among the changes in annual GPP, ET, and EWUE. The third objective is to analyze the spatial variation of the changes in annual GPP, ET, and EWUE in relation to the encroachment amount, annual precipitation, and annual mean air temperature. Overall, this study will enrich our understanding of the encroachment-driven changes in water-carbon cycles and the underlying mechanism.
Materials and methods
Study area
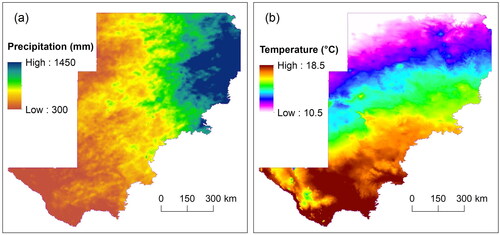
The southern Great Plains of the United States span the three states of Kansas, Oklahoma, and Texas (). This region encompasses broad environmental gradients in terms of precipitation and air temperature. Annual precipitation ranges between about 300 and 1450 mm, while annual mean air temperature varies approximately between 10.5 and 18.5 °C from north to south (). The SGP was previously extensively occupied by grasslands (Cunfer Citation2005), much of which has been encroached by evergreen forest (Yang et al. Citation2023). The substantial evergreen forest encroachment, along with the present broad environmental gradients, makes the SGP an ideal natural laboratory to study the spatial variation of the encroachment-driven changes in GPP, ET, and EWUE, especially its relation to precipitation, air temperature, and encroachment amount. This study will focus on the upper left part of the SGP (blue polygon in ). It is mainly because the lower right part has been under intensive human management (Wilcox et al. Citation2018). Exclusion of this sub-region can avoid human activity-induced bias in the research result.
Figure 1. (a) Location of the study area (blue polygon) in the United States, and distribution of evergreen forest (in red) according to National Land Cover Database (NLCD) 2019, (b) a sample site of grassland with evergreen forest encroachment, and (c) a sample site of pure grassland.
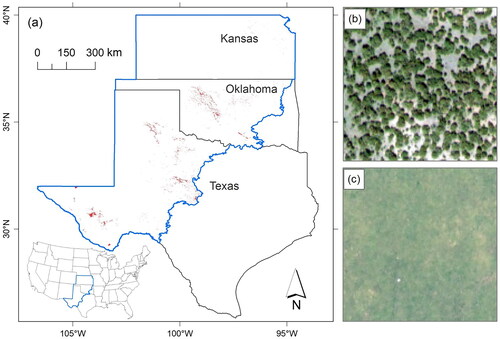
Figure 2. (a) Annual precipitation in 2019 and (b) annual mean air temperature in 2019 across the study area.
Data and preprocessing
Forest map and evergreen forest map
Forest maps and evergreen forest maps of the study area were derived from the United States National Land Cover Database (NLCD), which is developed based on Landsat data by the U.S. Geological Survey (USGS) in collaboration with other federal agencies (Yang et al. Citation2018). The NLCD products characterize land cover type (e.g. grassland and forest) of the United States at 30 m resolution over different epochs since 1992 (Dewitz Citation2021). Within the land cover type of forest, they distinguish between evergreen forest, deciduous forest, and mixed forest. We derived a forest map and an evergreen forest map (30 m) of the study area from the NLCD products for each of the four years (2004, 2008, 2016, and 2019). The binary forest and evergreen forest maps (30 m) were aggregated, respectively to fractional forest and evergreen forest maps at 500 m resolution, to match the spatial resolution of the MODIS GPP and ET products. These resulting fractional forest and evergreen forest maps will be used in the selection of sample grassland pixels of evergreen forest encroachment and in other data analyses.
Gross primary productivity and evapotranspiration products
The MOD17A2H (V6) Gross Primary Productivity (GPP), a product of the radiation-use efficiency concept, was used in this study (Running and Zhao Citation2019). It provides an estimate of 8-day cumulative GPP of the global land surface at 500 m spatial resolution (unit: kg C/m2). This GPP product has been widely utilized in carbon cycle modeling around the world (Turner et al. Citation2006; Wu et al. Citation2018). The evapotranspiration layer in the MODIS evapotranspiration product MOD16A2 (V6) estimates the total evapotranspiration of global land surface within each 8-day period at 500 m resolution (unit: kg/m2). This product is developed from meteorological reanalysis data and various other MODIS products (e.g. vegetation property dynamics, albedo) (Mu et al. Citation2013). Composited annual GPP (kg C/m2) and annual ET (kg/m2) layers of the study area were created for each of the four years (2004, 2008, 2016, and 2019).
Grassland and burned area maps
Annual grassland maps (500 m) of the study area were extracted from the MODIS Land Cover Type Product MCD12Q1 (Sulla-Menashe and Friedl Citation2018). This product is the result of supervised classification with MODIS surface reflectance data, under different classification schemes. The one with the International Geosphere-Biosphere Programme (IGBP) classification scheme was used in this study. The extracted annual grassland maps (2004, 2008, 2016, and 2019) were refined with corresponding annual fractional forest maps (500 m). Grassland pixels with any amount (>0) of forest were filtered out from the grassland maps.
Corresponding annual burned area maps (500 m) of the study area were derived from the MODIS Burned Area Product MCD64A1. This is a monthly product developed based on MODIS surface reflectance data and MODIS active fire product (Giglio et al. Citation2015). The BurnDate layer in MCD64A1 denotes the approximate Julian day of burning. This layer will be used as auxiliary data in the sampling of grassland pixels of evergreen forest encroachment. MCD64A1 and the aforementioned other MODIS products have been thoroughly validated and widely applied in research and application (Autovino et al. Citation2016; Boschetti et al. Citation2019; Deng et al. Citation2021).
Landsat surface reflectance data
The orthorectified and atmospherically corrected historical surface reflectance data (collection 2) from Landsat 5/7/8 was applied in this study. Specifically, an annual maximum Normalized Difference Vegetation Index (NDVImax) layer of the study area was created for each of the four years (2004, 2008, 2016, and 2019), with all available good quality observations. The NDVImax layers were used to assess vegetation coverage (%) in encroached grassland pixels and neighboring pure grassland pixels (500 m). These Landsat data and all the above remote sensing products were accessed from and processed in Google Earth Engine.
Precipitation and air temperature data
Precipitation and air temperature data of the study area was obtained from Parameter-elevation Relationships on Independent Slopes Model (PRISM) Climate Group. This research group modeled climate variables (e.g. precipitation, air temperature) for the year 1981 and forward by climatologically-aided interpolation (CAI), at monthly and daily scales (Daly et al. Citation2008). The CAI approach takes into account both long-term average pattern and all available station data of a given month or day. Composited annual precipitation and annual mean air temperature data were downloaded from the PRISM Climate Group website (https://prism.oregonstate.edu/recent/). Both datasets feature a spatial resolution of 4 km. Maps of annual precipitation and annual mean air temperature for the year 2019 are displayed in .
Pairwise comparison
The approach of pairwise comparison was adopted in this study to quantify the changes in annual GPP, ET, and EWUE of the SGP grassland in response to evergreen forest encroachment. This approach can examine the change of given ecological, hydrological, or climatic factors due to land cover change while keeping other related factors under the same condition (Peng et al. Citation2014; Wang et al. Citation2021). For instance, Petrie et al. (Citation2015) compared the carbon sequestration of established shrubland to that of nearby grassland in northern Chihuahuan Desert to study the effect of increased woody plant on ecosystem carbon cycle. Mendes and Prevedello (Citation2020) explored the effect of habitat fragmentation on local climate by comparing climatic variables of landscapes that have similar amount of forest but different number of forest patches.
Deng et al. (Citation2021) compared EWUE of lands with woody plant encroachment and their neighboring non-encroached lands to examine the response of EWUE to woody plant encroachment. They selected non-encroached pixels from a window of 11 × 11 pixels (500 m) centered around each encroached pixel for comparison, to ensure a similar environment between the paired lands and minimize the confounding effect of other factors (e.g. climate and topography). Wang et al. (Citation2021) also took a window of 11 × 11 pixels (500 m) to select paired pixels when studying the impact of juniper encroachment on local climate (e.g. land surface temperature, albedo). Following these studies, our study will adopt the same window size of 11 × 11 pixels (500 m) to select paired encroached and non-encroached grassland pixels for comparison.
Selection of sample grassland pixels with evergreen forest encroachment
Sample grassland pixels with evergreen forest encroachment were selected for each study year (2004, 2008, 2016, and 2019) separately, with the aforementioned annual fractional forest and evergreen forest maps, grassland maps, and burned area maps. All these maps share a spatial resolution of 500 m. Following Wang et al. (Citation2018a), the sample grassland pixels (500 m) of evergreen forest encroachment were selected according to these criteria: (1) fractional coverage of evergreen forest equal to or greater than 6.7% (15 out of 225 30-m pixels), (2) without deciduous or mixed forest, (3) no burned area in the 11 × 11 pixels window centered around it throughout the study year, (4) fully covered by vegetation, (5) has at least one neighboring grassland pixel (without forest, in the 11 × 11 pixels window) fully covered by vegetation (hereinafter referred to as pure grassland pixel).
The first three criteria were straightforward and easy to implement. Criteria (4) and (5) were implemented with the aforementioned Landsat-based annual NDVImax layer (30 m). Within a given 500-m pixel, if 280 or more 30-m pixels (out of 289) have an annual NDVImax value equal to or above 0.5, this 500-m pixel will be considered fully covered by vegetation. As a result, 975, 944, 3403, and 3501 sample grassland pixels (500 m) of evergreen forest encroachment were selected across the study area for the four years (2004, 2008, 2016, 2019), respectively ( in Appendix A). This process was carried out in the software ArcMap (10.8), involving various functions, such as Focal Statistics and Zonal Statistics.
Calculation of the change ratios of annual GPP, ET, and EWUE
For each sample grassland pixel of evergreen forest encroachment, it has an annual GPP value () and an annual ET value (
). Firstly, the average annual GPP (
) and average annual ET (
) of the pure grassland pixels within the 11 × 11 pixels window were calculated. Secondly, the change ratio of annual GPP and annual ET between the encroached grassland pixel and its neighboring pure grassland pixels were calculated as
,
, Thirdly, the annual EWUE of the encroached grassland pixel was calculated as
, while the annual EWUE of its neighboring pure grassland pixels was calculated as
. Lastly, the change ratio of annual EWUE was calculated as
. These calculations were performed with the Raster Calculator tool in ArcMap. The change ratios of annual GPP, ET, and EWUE would facilitate the spatial comparison of the response of water and carbon cycles to evergreen forest encroachment in the SGP grassland.
Analysis of the change ratios of annual GPP, ET, and EWUE
Firstly, we assessed the relationship among the change ratios of annual GPP, ET, and EWUE between encroached grassland pixels and neighboring pure grassland pixels. Specifically, a simple linear regression was performed between every two of ,
, and
. Secondly, we analyzed the spatial variation of each change ratio in relation to evergreen forest coverage, annual precipitation, and annual mean air temperature, through simple linear regression. All these analyses were conducted in the software RStudio for each of the four years (2004, 2008, 2016, and 2019) separately.
Results
Change ratios of annual GPP, ET, and EWUE
In the year 2019, the change ratio of annual GPP ranges between −0.14 (1st percentile) and 0.38 (99th percentile) across the study area. Out of the 3501 sample grassland pixels with evergreen forest encroachment, 2387 pixels (68%) exhibit higher annual GPP than their neighboring pure grassland pixels. The majority of the encroached grassland pixels (72, 69, and 62%) in the other three years (2004, 2008, and 2016) also have higher annual GPP due to evergreen forest encroachment.
In the year 2019, the change ratio of annual ET varies between −0.17 (1st percentile) and 0.41 (99th percentile). Among the 3501 encroached grassland pixels, 2487 pixels (71%) demonstrate higher annual ET than their neighboring pure grassland pixels. The majority of the encroached grassland pixels (74, 69, and 67%) in the other three years (2004, 2008, and 2016) also exhibit higher annual ET because of the encroachment.
In the year 2019, the change ratio of annual EWUE across the study area lies between −0.16 (1st percentile) and 0.15 (99th percentile). Out of the 3501 encroached grassland pixels, only 1192 (34%) exhibit higher annual EWUE compared to their neighboring pure grassland pixels, while 2309 pixels (66%) have lower EWUE. The majority of the encroached grassland pixels (67, 71, and 65%) in the other three years (2004, 2008, and 2016) also demonstrate lower EWUE as a result of evergreen forest encroachment.
Relationships among the three change ratios
In the year 2019, a strong positive linear relationship was found between the change ratios of annual GPP and annual ET (R2 = 0.66) (), while a strong negative linear relationship was revealed between the change ratios of annual EWUE and annual ET (R2 = 0.41). No significant relationship exists between the change ratios of annual GPP and annual EWUE. Consistent relationships were observed in the other three years (2004, 2008, and 2016) ( in Appendix A).
Figure 3. Scatterplots for the year 2019. (a) Annual GPP change ratio versus annual ET change ratio, (b) annual GPP change ratio versus annual EWUE change ratio, and (c) annual ET change ratio versus annual EWUE change ratio. Linear regression lines and details are overlaid on respective scatterplots.
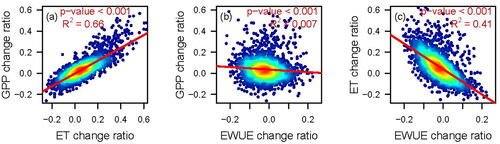
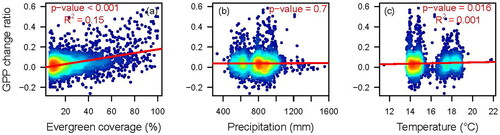
Figure 4. Scatterplots for the year 2019. Annual GPP change ratio versus (a) evergreen forest coverage, (b) annual precipitation, and (c) annual mean air temperature. Linear regression lines and details are overlaid on respective scatterplots.
Spatial variation of the three change ratios
As shown in , the spatial variation in the change ratio of 2019 annual GPP across the study area can be explained to a certain degree (R2 = 0.15) by the amount of evergreen forest encroachment, but not by annual precipitation or annual mean air temperature. Grassland pixels with more evergreen forest encroachment tend to have a higher annual GPP change ratio. Consistent results were found in the other three years (2004, 2008, and 2016) ( in Appendix A).
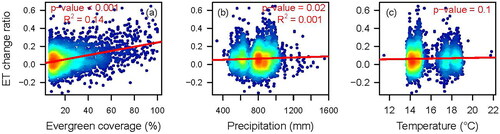
The spatial variation in the change ratio of 2019 annual ET across the study area can also be partly attributed to the varying amount of evergreen forest encroachment (R2 = 0.14), but not to annual precipitation or annual mean air temperature (). Grassland pixels with higher evergreen forest coverage tend to have a larger annual ET change ratio. These relationships were consistent in the other three years (2004, 2008, and 2016) ( in Appendix A).
Figure 5. Scatterplots for the year 2019. Annual ET change ratio versus (a) evergreen forest coverage, (b) annual precipitation, and (c) annual mean air temperature. Linear regression lines and details are overlaid on respective scatterplots.
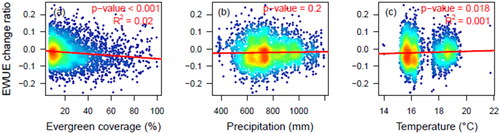
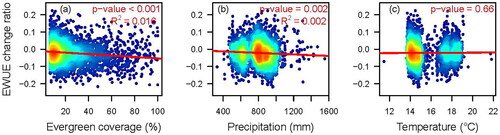
As displayed in , the spatial variation in the change ratio of 2019 annual EWUE, however, has no significant relationship with any of the three factors (evergreen forest coverage, annual precipitation, annual mean air temperature). This finding was corroborated in all the other three study years (2004, 2008, and 2016) ( in Appendix A).
Figure 6. Scatterplots for the year 2019. Annual EWUE change ratio versus (a) evergreen forest coverage, (b) annual precipitation, and (c) annual mean air temperature. Linear regression lines and details are overlaid on respective scatterplots.
Discussion
Changes in annual GPP, ET, and EWUE due to evergreen forest encroachment
In the SGP, the majority (62–74%) of the encroached grassland pixels exhibit higher annual GPP and annual ET but lower annual EWUE than their neighboring pure grassland pixels. This finding suggests an increasing trend of annual GPP and annual ET, but a decreasing trend of annual EWUE in the SGP grassland due to evergreen forest encroachment. It is consistent with the conclusion by Wang et al. (Citation2018a) that juniper encroachment in Oklahoma grassland enhanced GPP and ET. It also agrees with the report of increased GPP and ET due to woody plant encroachment across the globe (Deng et al. Citation2021).
The enhanced annual GPP and ET could be attributed to the intenser and longer photosynthesis (carbon assimilation with water) of trees than annual grasses, which is especially true for evergreen trees that persist year round (Moore et al. Citation2018). Another important reason is that woody plants have access to deeper soil moisture compared to grasses, consequently less susceptible to precipitation variability (Logan and Brunsell Citation2015). This finding further confirms the benefit of increased ecosystem carbon storage with regard to woody plant encroachment, despite other unfavorable consequences (e.g. endemic species loss; Throop and Lajtha Citation2018; Rosan et al. Citation2019). It also corroborates the facilitation of plant water uptake by woody plant encroachment (Honda and Durigan Citation2016). As such, the continuing evergreen forest encroachment in the SGP grassland would lead to reduced surface runoff in this region.
The revealed declining trend of annual EWUE in the SGP grassland due to evergreen forest encroachment suggests that the enhanced annual GPP comes with far more increase in annual ET. This finding is consistent with the observed lowered EWUE in dry sub-humid regions of the globe due to woody plant encroachment (Deng et al. Citation2021). It also agrees with the report by Logan and Brunsell (Citation2015) that carbon sequestration by woody plant encroachment in the native prairie of Kansas comes at the expense of far more water loss. Nevertheless, both positive and minimal changes in EWUE were reported in other regions due to woody plant encroachment (Brunsell et al. Citation2014; Deng et al. Citation2021). This discrepancy could be partly attributed to the variability in root depth and water source of trees and grasses (Brunsell et al. Citation2014). For instance, among the same encroaching tree species (Prosopis glandulosa) in Texas savanna, higher EWUE was observed for trees with the most effective root depth (Eggemeyer and Schwinning Citation2009).
Relationships among the change ratios of annual GPP, ET, and EWUE
The strong positive linear relationship between the change ratios of annual GPP and annual ET corroborates the coupling of carbon assimilation and water loss in plant photosynthesis. While the water loss consists of physical evaporation and biological transpiration, only the latter is directly involved in plant carbon assimilation (Hu et al. Citation2008). The strong negative linear relationship between the change ratios of annual EWUE and annual ET indicates that physical evaporation contributes more to the increased ET than biological transpiration in the process of evergreen forest encroachment. The non-significant relationship between the change ratios of annual GPP and annual EWUE could be attributed to the fact that the partition of evapotranspiration (ET) between physical evaporation and biological transpiration is susceptible to a lot of factors, such as root depth and water source of trees and grasses (Hu et al. Citation2008; Eggemeyer and Schwinning Citation2009).
Spatial variation of the change ratios of annual GPP, ET, and EWUE
The spatial variation in the change ratios of annual GPP and annual ET could be explained by the encroachment amount to certain degrees. The change ratios of annual GPP and annual ET across the study area tend to increase with evergreen forest encroachment. This finding agrees well with Wang et al. (Citation2018a) that the increased ratios of annual GPP and annual ET caused by juniper encroachment in Oklahoma grassland are positively correlated with juniper coverage. In contrast, the spatial variation in the change ratio of annual EWUE shows no significant relationship with the encroachment amount. It could be attributed to the aforementioned dependence of EWUE on plant root depth and water source (Eggemeyer and Schwinning Citation2009; Brunsell et al. Citation2014).
The spatial variation in all the three change ratios (annual GPP, ET, and EWUE) across the study area cannot be explained by annual precipitation or annual mean air temperature. However, previous temporal analysis suggests that the increased ratios of annual GPP and annual ET differ among years according to annual precipitation (Wang et al. Citation2018a). That is, the change ratios of annual GPP and ET tend to be higher in drought year than in wet year. Logan and Brunsell (Citation2015) also revealed that the encroached prairie site in Kansas had even higher carbon sequestration during drought year. In addition, drought was found to lower ecosystem water use efficiency at the encroached prairie site. The contrast between spatial and temporal analyses suggests that the role of precipitation in water and carbon cycles is more comparable temporally than spatially.
Limitation of this study
Limitation of this study should be acknowledged. Firstly, all the data used in this study are from remote sensing products rather than from in-situ measurement. The inherent uncertainty of remote sensing products may have been passed on to the results to some degree. But the large sample size should have compensated the uncertainty and ensured the legitimacy of the results. Secondly, a single NDVImax threshold (0.5) was applied across the whole study area to ensure both the encroached grassland pixels and their neighboring pure grassland pixels are fully covered by vegetation. However, the true NDVImax threshold may vary over the physiographic gradients (e.g. precipitation, temperature). Nevertheless, the consistent results among the four years of varying precipitation and temperature demonstrate the credibility of this study.
Conclusion
In conclusion, this study finds that the annual GPP and ET tend to increase with evergreen forest encroachment in the southern Great Plains grassland, while EWUE exhibits a decreasing trend. A higher change ratio of annual ET is associated with a higher change ratio of annual GPP but a lower change ratio of annual EWUE. The spatial variation in the change ratios of annual GPP and annual ET across the study area could be explained to a certain degree by the encroachment amount but not by annual precipitation or annual mean air temperature. This study also embodies the utility of remote sensing products in the study of water and carbon cycles at a broad scale.
Disclosure statement
No potential conflict of interest was reported by the author(s).
Additional information
Funding
References
- Anadón, J.D., Sala, O.E., Turner, B.L., and Bennett, E.M. 2014. “Effect of Woody-Plant Encroachment on Livestock Production in North and South America.” Proceedings of the National Academy of Sciences, Vol. 111: pp. 1–12. doi:10.1073/pnas.1320585111.
- Ashton, M.S., Tyrrell, M.L., Spalding, D., and Gentry, B., eds. 2012. Managing Forest Carbon in a Changing Climate. Berlin, Germany: Springer Science & Business Media.
- Autovino, D., Minacapilli, M., and Provenzano, G. 2016. “Modelling Bulk Surface Resistance by MODIS Data and Assessment of MOD16A2 Evapotranspiration Product in an Irrigation District of Southern Italy.” Agricultural Water Management, Vol. 167: pp. 86–94. doi:10.1016/j.agwat.2016.01.006.
- Barger, N.N., Archer, S.R., Campbell, J.L., Huang, C., Morton, J.A., and Knapp, A.K. 2011. “Woody Plant Proliferation in North American Drylands: A Synthesis of Impacts on Ecosystem Carbon Balance.” Journal of Geophysical Research, Vol. 116(No. G4): pp. 1–17. doi:10.1029/2010JG001506.
- Beer, C., Reichstein, M., Tomelleri, E., Ciais, P., Jung, M., Carvalhais, N., Rödenbeck, C., et al. 2010. “Terrestrial Gross Carbon Dioxide Uptake: Global Distribution and Covariation with Climate.” Science, Vol. 329(No. 5993): pp. 834–838. doi:10.1126/science.1184984.
- Boschetti, L., Roy, D.P., Giglio, L., Huang, H., Zubkova, M., and Humber, M.L. 2019. “Global Validation of the Collection 6 MODIS Burned Area Product.” Remote Sensing of Environment, Vol. 235: pp. 111490. doi:10.1016/j.rse.2019.111490.
- Brunsell, N.A., Nippert, J.B., and Buck, T.L. 2014. “Impacts of Seasonality and Surface Heterogeneity on Water-Use Efficiency in Mesic Grasslands.” Ecohydrology, Vol. 7(No. 4): pp. 1223–1233. doi:10.1002/eco.1455.
- Budny, M.L., and Benscoter, B.W. 2016. “Shrub Encroachment Increases Transpiration Water Loss from a Subtropical Wetland.” Wetlands, Vol. 36(No. 4): pp. 631–638. doi:10.1007/s13157-016-0772-5.
- Burman, P.K.D., Launiainen, S., Mukherjee, S., Chakraborty, S., Gogoi, N., Murkute, C., Lohani, P., Sarma, D., and Kumar, K. 2021. “Ecosystem-Atmosphere Carbon and Water Exchanges of Subtropical Evergreen and Deciduous Forests in India.” Forest Ecology and Management, Vol. 495: pp. 119371. doi:10.1016/j.foreco.2021.119371.
- Cunfer, G. 2005. On the Great Plains: Agriculture and Environment. Vol. 20. Texas A&M University Press.
- Currey, B., McWethy, D.B., Fox, N.R., and Brookshire, E.J. 2022. “Large Contribution of Woody Plant Expansion to Recent Vegetative Greening of the Northern Great Plains.” Journal of Biogeography, Vol. 49(No. 8): pp. 1443–1454.
- Daly, C., Halbleib, M., Smith, J.I., Gibson, W.P., Doggett, M.K., Taylor, G.H., Curtis, J., and Pasteris, P.P. 2008. “Physiographically Sensitive Mapping of Climatological Temperature and Precipitation across the Conterminous United States.” International Journal of Climatology, Vol. 28(No. 15): pp. 2031–2064. doi:10.1002/joc.1688.
- Damm, A., Elbers, J.A.N., Erler, A., Gioli, B., Hamdi, K., Hutjes, R., Kosvancova, M., et al. 2010. “Remote Sensing of Sun-Induced Fluorescence to Improve Modeling of Diurnal Courses of Gross Primary Production (GPP).” Global Change Biology, Vol. 16(No. 1): pp. 171–186. doi:10.1111/j.1365-2486.2009.01908.x.
- Deng, Y., Li, X., Shi, F., and Hu, X. 2021. “Woody Plant Encroachment Enhanced Global Vegetation Greening and Ecosystem Water-Use Efficiency.” Global Ecology and Biogeography, Vol. 30(No. 12): pp. 2337–2353. doi:10.1111/geb.13386.
- Dewitz, J. 2021. National Land Cover Database (NLCD) 2019 Products. Reston, Virginia, U.S.: U.S. Geological Survey. doi:10.5066/P9KZCM54.
- Eggemeyer, K.D., and Schwinning, S. 2009. “Biogeography of Woody Encroachment: Why Is Mesquite Excluded from Shallow Soils?” Ecohydrology, Vol. 2(No. 1): pp. 81–87. doi:10.1002/eco.42.
- Giglio, L., Justice, C., Boschetti, L., and Roy, D. 2015. “MCD64A1 MODIS/Terra + Aqua Burned Area Monthly L3 Global 500m SIN Grid V006.” NASA EOSDIS Land Processes DAAC. doi:10.5067/MODIS/MCD64A1.006.
- Honda, E.A., and Durigan, G. 2016. “Woody Encroachment and Its Consequences on Hydrological Processes in the Savannah.” Philosophical Transactions of the Royal Society B: Biological Sciences, Vol. 371(No. 1703): pp. 20150313. doi:10.1098/rstb.2015.0313.
- Hu, Z., Yu, G., Fu, Y., Sun, X., Li, Y., Shi, P., Wang, Y., and Zheng, Z. 2008. “Effects of Vegetation Control on Ecosystem Water Use Efficiency within and among Four Grassland Ecosystems in China.” Global Change Biology, Vol. 14(No. 7): pp. 1609–1619. doi:10.1111/j.1365-2486.2008.01582.x.
- Leis, S.A., Blocksome, C.E., Twidwell, D., Fuhlendorf, S.D., Briggs, J.M., and Sanders, L.D. 2017. “Juniper Invasions in Grasslands: Research Needs and Intervention Strategies.” Rangelands, Vol. 39(No. 2): pp. 64–72. doi:10.1016/j.rala.2017.03.002.
- Logan, K.E., and Brunsell, N.A. 2015. “Influence of Drought on Growing Season Carbon and Water Cycling with Changing Land Cover.” Agricultural and Forest Meteorology, Vol. 213: pp. 217–225. Elsevier: doi:10.1016/j.agrformet.2015.07.002.
- Mendes, C.B., and Prevedello, J.A. 2020. “Does Habitat Fragmentation Affect Landscape-Level Temperatures? A Global Analysis.” Landscape Ecology, Vol. 35(No. 8): pp. 1743–1756. doi:10.1007/s10980-020-01041-5.
- Moore, C.E., Beringer, J., Donohue, R.J., Evans, B., Exbrayat, J.-F., Hutley, L.B., and Tapper, N.J. 2018. “Seasonal, Interannual and Decadal Drivers of Tree and Grass Productivity in an Australian Tropical Savanna.” Global Change Biology, Vol. 24(No. 6): pp. 2530–2544. doi:10.1111/gcb.14072.
- Mu, Q., Zhao, M., and Running, S. W. 2013. “MODIS Global Terrestrial Evapotranspiration (ET) Product (NASA MOD16A2/A3).” In Algorithm Theoretical Basis Document, Collection 5, 600. Washington, DC: NASA.
- O’Donnell, F.C., and Caylor, K.K. 2012. “A Model-Based Evaluation of Woody Plant Encroachment Effects on Coupled Carbon and Water Cycles.” Journal of Geophysical Research: Biogeosciences, Vol. 117(No. G2): pp. 1–16. doi:10.1029/2011JG001899.
- Peng, S.-S., Piao, S., Zeng, Z., Ciais, P., Zhou, L., Li, L.Z.X., Myneni, R.B., Yin, Y., and Zeng, H. 2014. “Afforestation in China Cools Local Land Surface Temperature.” Proceedings of the National Academy of Sciences, Vol. 111(No. 8): pp. 2915–2919. doi:10.1073/pnas.1315126111.
- Petrie, M.D., Collins, S.L., Swann, A.M., Ford, P.L., and Litvak, M.E. 2015. “Grassland to Shrubland State Transitions Enhance Carbon Sequestration in the Northern Chihuahuan Desert.” Global Change Biology, Vol. 21(No. 3): pp. 1226–1235. doi:10.1111/gcb.12743.
- Qiao, L., Zou, C.B., Stebler, E., and Will, R.E. 2017. “Woody Plant Encroachment Reduces Annual Runoff and Shifts Runoff Mechanisms in the Tallgrass Prairie, USA.” Water Resources Research, Vol. 53(No. 6): pp. 4838–4849. doi:10.1002/2016WR019951.
- Rosan, T.M., Aragão, L.E.O.C., Oliveras, I., Phillips, O.L., Malhi, Y., Gloor, E., and Wagner, F.H. 2019. “Extensive 21st-Century Woody Encroachment in South America’s Savanna.” Geophysical Research Letters, Vol. 46(No. 12): pp. 6594–6603. doi:10.1029/2019GL082327.
- Running, S.W., and Zhao, M. 2019. “Daily GPP and Annual NPP (MOD17A2H/A3H) and Year-End Gap-Filled (MOD17A2HGF/A3HGF) Products NASA Earth Observing System MODIS Land Algorithm.” MOD, Vol. 17.
- Stevens, N., Lehmann, C.E., Murphy, B.P., and Durigan, G. 2017. “Savanna Woody Encroachment Is Widespread across Three Continents.” Global Change Biology, Vol. 23(No. 1): pp. 235–244. doi:10.1111/gcb.13409.
- Sulla-Menashe, D., and Friedl, M. A. 2018. “User Guide to Collection 6 MODIS Land Cover (MCD12Q1) Product.” In NASA EOSDIS Land Processes. Sioux Falls, SD: DAAC.
- Throop, H.L., and Lajtha, K. 2018. “Spatial and Temporal Changes in Ecosystem Carbon Pools Following Juniper Encroachment and Removal.” Biogeochemistry, Vol. 140(No. 3): pp. 373–388. (Springer: doi:10.1007/s10533-018-0498-y.
- Turner, D.P., Ritts, W.D., Cohen, W.B., Gower, S.T., Running, S.W., Zhao, M., Costa, M.H., et al. 2006. “Evaluation of MODIS NPP and GPP Products across Multiple Biomes.” Remote Sensing of Environment, Vol. 102(No. 3–4): pp. 282–292. doi:10.1016/j.rse.2006.02.017.
- Twidwell, D., Rogers, W.E., Fuhlendorf, S.D., Wonkka, C.L., Engle, D.M., Weir, J.R., Kreuter, U.P., and Taylor, C.A.Jr. 2013. “The Rising Great Plains Fire Campaign: Citizens’ Response to Woody Plant Encroachment.” Frontiers in Ecology and the Environment, Vol. 11(No. S1): pp. e64–e71. doi:10.1890/130015.
- Wang, J., Xiao, X., Basara, J., Wu, X., Bajgain, R., Qin, Y., Doughty, R.B., and Moore, B.III. 2021. “Impacts of Juniper Woody Plant Encroachment into Grasslands on Local Climate.” Agricultural and Forest Meteorology, Vol. 307: pp. 108508. doi:10.1016/j.agrformet.2021.108508.
- Wang, J., Xiao, X., Qin, Y., Doughty, R.B., Dong, J., and Zou, Z. 2018b. “Characterizing the Encroachment of Juniper Forests into Sub-Humid and Semi-Arid Prairies from 1984 to 2010 Using PALSAR and Landsat Data.” Remote Sensing of Environment, Vol. 205: pp. 166–179. doi:10.1016/j.rse.2017.11.019.
- Wang, J., Xiao, X., Wagle, P., Ma, S., Baldocchi, D., Carrara, A., Zhang, Y., Dong, J., and Qin, Y. 2016. “Canopy and Climate Controls of Gross Primary Production of Mediterranean-Type Deciduous and Evergreen Oak Savannas.” Agricultural and Forest Meteorology, Vol. 226–227: pp. 132–147. doi:10.1016/j.agrformet.2016.05.020.
- Wang, J., Xiao, X., Zhang, Y., Qin, Y., Doughty, R.B., Wu, X., Bajgain, R., and Du, L. 2018a. “Enhanced Gross Primary Production and Evapotranspiration in Juniper-Encroached Grasslands.” Global Change Biology, Vol. 24(No. 12): pp. 5655–5667. doi:10.1111/gcb.14441.
- Wilcox, B.P., Birt, A., Archer, S.R., Fuhlendorf, S.D., Kreuter, U.P., Sorice, M.G., Van Leeuwen, W.J., and Zou, C.B. 2018. “Viewing Woody-Plant Encroachment through a Social–Ecological Lens.” BioScience, Vol. 68(No. 9): pp. 691–705. doi:10.1093/biosci/biy051.
- Wu, X., Xiao, X., Zhang, Y., He, W., Wolf, S., Chen, J., He, M., et al. 2018. “Spatiotemporal Consistency of Four Gross Primary Production Products and Solar-Induced Chlorophyll Fluorescence in Response to Climate Extremes across CONUS in 2012.” Journal of Geophysical Research: Biogeosciences, Vol. 123(No. 10): pp. 3140–3161. doi:10.1029/2018JG004484.
- Yang, L., Jin, S., Danielson, P., Homer, C., Gass, L., Bender, S.M., Case, A., et al. 2018. “A New Generation of the United States National Land Cover Database: Requirements, Research Priorities, Design, and Implementation Strategies.” ISPRS Journal of Photogrammetry and Remote Sensing, Vol. 146: pp. 108–123. doi:10.1016/j.isprsjprs.2018.09.006.
- Yang, X., and Crews, K.A. 2020. “The Role of Precipitation and Woody Cover Deficit in Juniper Encroachment in Texas Savanna.” Journal of Arid Environments, Vol. 180: pp. 104196. doi:10.1016/j.jaridenv.2020.104196.
- Yang, X., Xiao, X., and Zhang, C. 2023. “Spatiotemporal variability and key factors of evergreen forest encroachment in the southern Great Plains.” Journal of Environmental Management, Vol. 329: pp. 117012. doi:10.1016/j.jenvman.2022.117012.
- Yang, X., Xiao, X., Qin, Y., Wang, J., and Neal, K. 2021. “Mapping Forest in the Southern Great Plains with ALOS-2 PALSAR-2 and Landsat 7/8 Data.” International Journal of Applied Earth Observation and Geoinformation, Vol. 104: pp. 102578. doi:10.1016/j.jag.2021.102578.
- Zhang, Y., Peña-Arancibia, J.L., McVicar, T.R., Chiew, F.H.S., Vaze, J., Liu, C., Lu, X., et al. 2016. “Multi-Decadal Trends in Global Terrestrial Evapotranspiration and Its Components.” Scientific Reports, Vol. 6(No. 1): pp. 19124. doi:10.1038/srep19124.
- Zou, C.B., Turton, D.J., Will, R.E., Engle, D.M., and Fuhlendorf, S.D. 2014. “Alteration of Hydrological Processes and Streamflow with Juniper (Juniperus virginiana) Encroachment in a Mesic Grassland Catchment.” Hydrological Processes, Vol. 28(No. 26): pp. 6173–6182. doi:10.1002/hyp.10102.
Appendix A
Figure A1. Distribution of sample grassland pixels with evergreen forest encroachment in the four study years.
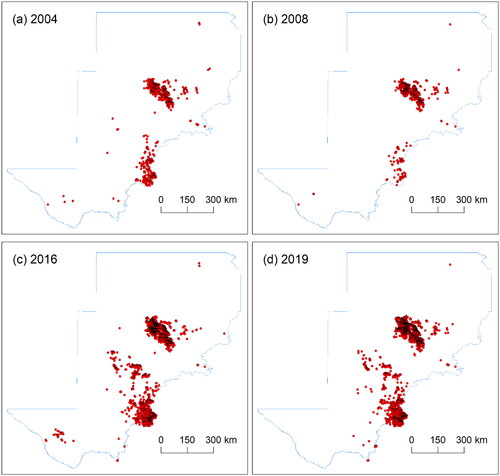
Figure A2. Scatterplots for the year 2004. (a) Annual GPP change ratio versus annual ET change ratio, (b) annual GPP change ratio versus annual EWUE change ratio, and (c) annual ET change ratio versus annual EWUE change ratio.
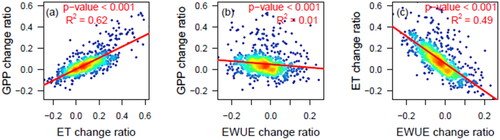
Figure A3. Scatterplots for the year 2008. (a) Annual GPP change ratio versus annual ET change ratio, (b) annual GPP change ratio versus annual EWUE change ratio, and (c) annual ET change ratio versus annual EWUE change ratio.
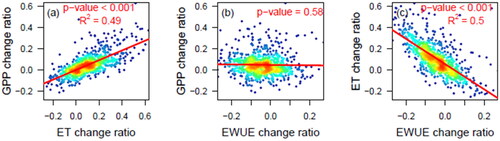
Figure A4. Scatterplots for the year 2016. (a) Annual GPP change ratio versus annual ET change ratio, (b) annual GPP change ratio versus annual EWUE change ratio, and (c) annual ET change ratio versus annual EWUE change ratio.
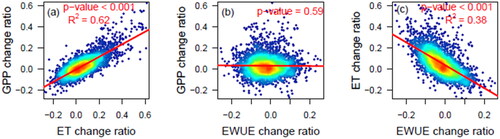
Figure A5. Scatterplots of 2004 annual GPP change ratio versus (a) evergreen forest coverage, (b) annual precipitation, and (c) annual mean air temperature.
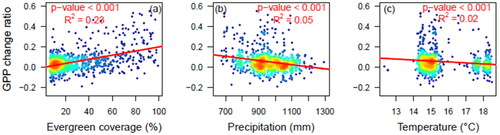
Figure A6. Scatterplots of 2008 annual GPP change ratio versus (a) evergreen forest coverage, (b) annual precipitation, and (c) annual mean air temperature.
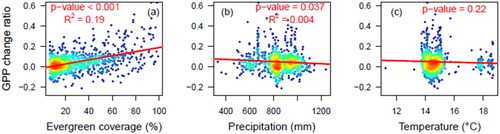
Figure A7. Scatterplots of 2016 annual GPP change ratio versus (a) evergreen forest coverage, (b) annual precipitation, and (c) annual mean air temperature.
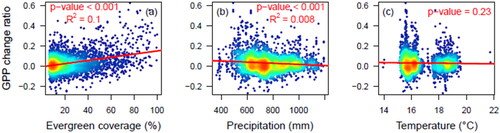
Figure A8. Scatterplots of 2004 annual ET change ratio versus (a) evergreen forest coverage, (b) annual precipitation, and (c) annual mean air temperature.
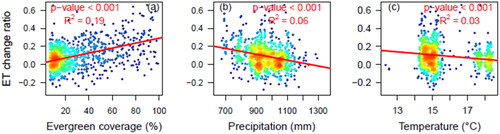
Figure A9. Scatterplots of 2008 annual ET change ratio versus (a) evergreen forest coverage, (b) annual precipitation, and (c) annual mean air temperature.
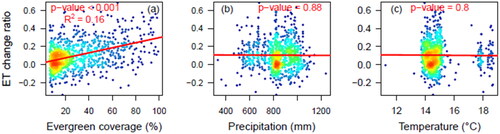
Figure A10. Scatterplots of 2016 annual ET change ratio versus (a) evergreen forest coverage, (b) annual precipitation, and (c) annual mean air temperature.
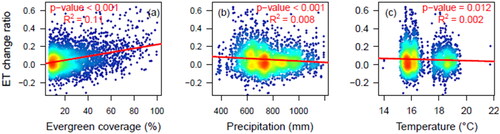
Figure A11. Scatterplots of 2004 annual EWUE change ratio versus (a) evergreen forest coverage, (b) annual precipitation, and (c) annual mean air temperature.
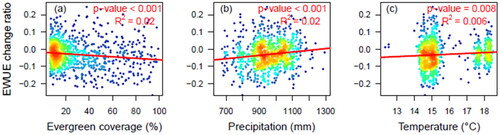
Figure A12. Scatterplots of 2008 annual EWUE change ratio versus (a) evergreen forest coverage, (b) annual precipitation, and (c) annual mean air temperature.
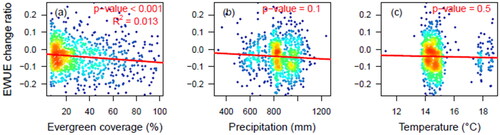
Figure A13. Scatterplots of 2016 annual EWUE change ratio versus (a) evergreen forest coverage, (b) annual precipitation, and (c) annual mean air temperature.