
 ?Mathematical formulae have been encoded as MathML and are displayed in this HTML version using MathJax in order to improve their display. Uncheck the box to turn MathJax off. This feature requires Javascript. Click on a formula to zoom.
Abstract
The RADARSAT Constellation Mission (RCM) performance evaluation is currently in progress for core Synthetic Aperture Radar (SAR) applications. This study aims to investigate the retrieval of Soil Moisture Content (SMC) in bare soil with RCM compact polarimetry and Random Forest Regression (RFR). The focus is on RH (right circular transmit and linear horizontal receive signal) and RV (right circular transmit and linear vertical receive signal) backscattering, which are the primary RCM Compact Polarimetric (CP) products. SMC retrieval is pursued over a wide range of radar incidence angles. Then, an attempt is made to retrieve SMC at higher radar incidence angles only. Furthermore, soil moisture maps are produced and used for analyzing the captured soil moisture variability. CP SAR images acquired with the RCM SC30MCP mode over three Canadian experimental sites are considered in our study. The sites are equipped with calibrated Real-Time In-Situ Soil Monitoring for Agriculture (RISMA) stations. A RFR retrieval algorithm was able to predict SMC with a correlation of 0.75 when compared to in-situ soil moisture measurements. A Root Mean Square Error (RMSE) = 5.9%, a bias = −1.5%, and an unbiased RMSE (ubRMSE) = 5.7% are achieved. A degradation in performance is reported for SMC retrieval under higher radar incidence angles. Results of our study indicate promising performance for capturing near-surface soil moisture variability under bare soil conditions.
RÉSUMÉ
L’évaluation du rendement de la mission de la Constellation RADARSAT (MCR) est actuellement en cours pour les principales applications des radars à synthèse d’ouverture (ROS). Cette étude vise à étudier l’estimation de la teneur en eau du sol de sols nus avec la polarimétrie compacte MCR et la régression Random Forest. L’accent est mis sur la rétrodiffusion DH (polarisation circulaire dextrorsum et signal de réception horizontale linéaire) et DV (polarisation circulaire dextrorsum droite et signal de réception verticale linéaire), qui sont les principaux produits polarimétriques compacts. L’estimation de la teneur en eau du sol considère une large gamme d’angles d’incidence radar. Ensuite, une tentative est faite pour estimer la teneur en eau du sol avec seulement les angles d’incidence radar les plus élevés. De plus, des cartes de l’humidité du sol ont été produites et utilisées pour analyser la variabilité de l’humidité du sol estimée. Les images polarimétriques compactes acquises avec le mode SC30MCP de la MRC sur trois sites expérimentaux canadiens ont été prises en compte dans notre étude. Les sites étaient équipés de stations étalonnées de surveillance in situ des sols agricoles. Le modèle de régression Random Forests a été en mesure de prédire la teneur en eau du sol avec une corrélation de 0,75 par rapport aux mesures in situ de de teneur en eau du sol. On a obtenu une erreur quadratique moyenne de 5,9 %, avec un biais de -1,5 % et une erreur quadratique moyenne non biaisée de 5,7 %. Le modèle a été moins performant quand seulement les angles d’incidence radar élevés sont utilisés. Les résultats de notre étude indiquent des performances prometteuses pour l’estimation de la variabilité de la teneur en eau du sol près de la surface dans des conditions de sol nu.
Introduction
The retrieval of Soil Moisture Content (SMC) is necessary for an effective ecosystem monitoring. Furthermore, its temporal and spatial observation is of particular importance for agriculture due to its linkages to annual crop health, drought and flood risk, and water supply management. Synthetic Aperture Radar (SAR) has been an attractive technology for observation of soil moisture at high spatial resolution (Chung et al. Citation2022; Gharechelou et al. Citation2021; Seung-Bum and Tien-Hao Citation2021; Gururaj et al. Citation2021; Dabboor et al. Citation2019; Merzouki and McNairn Citation2015). SMC retrieval attempts using SAR remote sensing have typically relied on either conventional single/dual (Ezzahar et al. Citation2019; Greifeneder et al. Citation2021; Chung et al. Citation2022) or full polarimetric SAR imagery (Merzouki and McNairn Citation2015).
In June 2019, Canada launched the RADARSAT Constellation Mission (RCM), as a follow-on project to the RADARSAT-1&2 satellites (Séguin and Ahmed Citation2009). The RCM is the evolution of the Canadian RADARSAT program in the sense that it is designed to not only provide C-band SAR data continuity for RADARSAT-2 users, but also to add a new series of applications enabled through the constellation approach (Séguin and Ahmed Citation2009). Thus, the RCM with its identical three SAR satellites is expected to improve the operational use of SAR technology for Earth observation applications (Dabboor et al. Citation2018; Dabboor et al. Citation2022).
An innovative characteristic of RCM is the Compact Polarimetric (CP) SAR configuration (Raney Citation2007), which provides CP SAR imagery in operational mode. The potential of CP SAR configuration for Earth observation applications has been attracting the attention of researchers due to its enhanced radar target information compared to conventional SAR systems over large spatial coverage areas (Charbonneau et al. Citation2010). The enhanced radar target information is achieved by transmitting a circular polarization signal and coherently receiving both the horizontal and vertical components of the scattered signal. This is in contrast to the conventional SAR signal, which transmits only a single linear polarization, either vertical or horizontal (Raney Citation2007). The CP option in RCM is achieved by transmitting a right-circularly polarized radar signal.
Ecosystem monitoring applications, such as SMC retrieval, is one of the core RCM applications. Considering the impact of climate change on soil moisture triggered by variations in precipitation and evapotranspiration, mapping SMC values and variability is a top-priority application for Canada. Limited studies have investigated the potential of CP SAR imagery for SMC retrieval. The first study to investigate the SMC retrieval by means of compact polarimetry was presented in Williams (Citation2008). This study indicated that a two-component model of surface polarimetric coherency matrix has the potential for SMC estimation in bare soil. In Freeman et al. (Citation2009), simulated long wavelength P-band CP measurements presented a minor degradation in SMC estimation with a residual error of 2%, when compared to conventional co-polarized HH (horizontal transmit and receive signal) and VV (vertical transmit and receive signal) data. In Freeman et al. (Citation2009), it was indicated that this finding is valid in bare soil, even in the presence of Faraday rotation. The sensitivity of simulated RH (right circular transmit and linear horizontal receive signal) and RV (right circular transmit and linear vertical receive signal) to SMC was examined in Charbonneau et al. (Citation2010) under constant surface roughness conditions. The potential of simulated CP SAR data for SMC estimation in the presence of vegetation was evaluated in Ouellette et al. (Citation2014). Herein, a time series data cube retrieval algorithm is developed and evaluated. A minor degradation in SMC estimation using CP SAR data was indicated in Ouellette et al. (Citation2014), when compared to the performance of full polarimetric SAR. Das and Paul (Citation2015) developed a semi-empirical model for soil moisture estimation using CP SAR imagery acquired by the RISAT-1 mission. This study focused on soil moisture retrieval at high radar incidence angle. The capability of RISAT-1 for soil moisture retrieval was also investigated in Ponnurangam et al. (Citation2016). Herein, the soil moisture retrieval was achieved through the implementation of a methodology which combines a data decomposition method and a surface component inversion.
The expected potential of RCM for SMC retrieval was first evaluated in Merzouki et al. (Citation2019). CP SAR data of the ScanSAR medium resolution 30 m (SC30M) and 50 m (SC50M) imaging modes was simulated and examined for SMC retrieval. In Merzouki et al. (Citation2019), the Integral Equation Model (IEM) was calibrated for the RH and RV polarizations and used in a soil moisture retrieval approach. Results by Merzouki et al. (Citation2019) indicated a good performance expectation of RCM with correlation between measured and predicted soil moisture >0.70 and an unbiased Root Mean Square Error (ubRMSE) better than 6%. A subsequent study by Santi et al. (Citation2019) confirmed the expected potential of RCM for SMC monitoring. In Santi et al. (Citation2019), several CP parameters were simulated and examined for their sensitivity to SMC. Using CP parameters, a correlation between measured and predicted soil moisture higher than 0.80 with Root Mean Square Error (RMSE) better than 6% was achieved. The correlation exceeds 0.90 (RMSE <5%) when a combination of both linear and CP parameters is used (Santi et al. Citation2019). Dabboor et al. (Citation2023) developed a Deep-Learning (DL) framework for soil moisture retrieval using RCM CP SAR imagery. Herein, a DL-based data augmentation technique was implemented to enhance the prediction performance of several machine learning models, with the best performance observed in Gaussian Process Regression (GPR).
This study explores SMC retrieval in bare soil using RCM compact polarimetry and Random Forest Regression (RFR). The primary focus centers on RH and RV backscattering, the key RCM CP products, but without any data augmentation. The sensitivity of soil moisture is analyzed across a wide range of radar incidence angles for both RH and RV backscattering. Subsequently, an RFR model is developed and applied for the retrieval of SMC. The RFR is a compelling choice for regression tasks due to its high accuracy, non-linearity handling capabilities, and robustness to overfitting (Kulkarni and Sinha Citation2013; Sarica et al. Citation2017). By combining predictions from multiple decision trees, it captures complex relationships in the data, making it suitable for various scenarios. Additionally, the model’s out-of-the-box performance makes it a reliable choice, especially when efficiency and scalability are important considerations. SMC retrieval is investigated across a broad spectrum of radar incidence angles, followed by a targeted examination at higher angles. The study also involves generating soil moisture maps for analyzing variations in soil moisture levels. For this study, we use CP SAR images acquired by the RCM SC30MCP imaging mode over three Canadian experimental sites located in Ontario (ON), Manitoba (MB), and Saskatchewan (SK). The acquired RCM images overlap with Real-Time In-Situ Soil Monitoring for Agriculture (RISMA) stations managed by Agriculture and Agri-Food Canada (AAFC). The RISMA stations collect SMC measurements every 15 minutes.
The contribution of this study is notable as it presents a unique analysis of the sensitivities of RH and RV backscattering across varying soil moisture conditions, from dry to wet. This examination is distinctively carried out over an extensive range of radar incidence angles, spanning from 20.8° to 42.9°. Another significant contribution of our study is the innovative methodology employed for soil moisture retrieval and variability mapping in bare soil settings. Leveraging RCM compact polarimetry in tandem with RFR across a comprehensive array of radar incidence angles, we integrate these angles as variables within the regression model. We further enhance the analysis by generating two-dimensional soil moisture variability maps, both in the presence and absence of precipitation events prior to RCM imagery acquisition.
Brief theoretical background
The Canadian RCM is a SAR satellite mission consisting of three satellites with several polarimetric modes, including the CP mode. The CP mode which comprises a hybrid mode was first proposed in Souyris et al. (Citation2005) and subsequently developed in Raney (Citation2007). This mode involves the transmission of a single polarization which is usually circular, and the simultaneous coherent orthogonal linear reception of the backscattered signal (Cloude et al. Citation2012). The scattering vector for a CP SAR mode transmitting a right circular signal and coherently receiving the linear horizontal and vertical components of the backscattered signal is given by Raney (Citation2007):
(1)
(1)
where T denotes the transpose operator and RH and RV are the complex elements of the scattering vector defined as follows (Raney Citation2007):
(2)
(2)
In (2), and
are the backscattering coefficients of RH and RV, while
and
are the phases of RH and RV, respectively. In terms of linear polarization, the elements of the scattering vector of compact configuration can be written as follows (Cloude et al. Citation2012):
(3)
(3)
As shown in (3), CP scattering vector is a measure of the projection of the 2 × 2 scattering matrix (Cloude et al. Citation2012).
Study area and datasets
Experimental sites
The three study sites () are located in topographically flat agricultural landscapes with four RISMA networks which belong to AAFC. The first site is located within the South Nation River watershed, close to the town of Casselman in eastern Ontario (ON). This site has one network with four RISMA stations.
Figure 1. Location of the three experimental sites in Ontario (ON), Manitoba (MB), and Saskatchewan (SK) indicated by red squares. SAR images are RH backscattering. Red pins indicate the location of the RISMA stations.
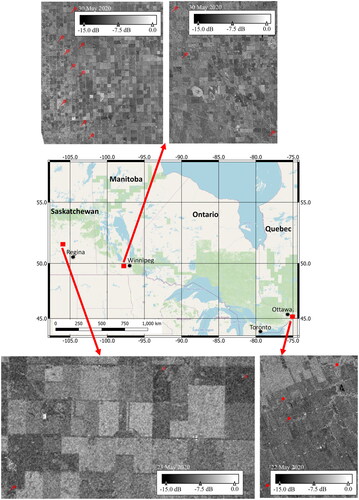
The second site consists of two networks in southern Manitoba (MB). The first MB network consists of nine RISMA stations and is located near the towns of Carman and Elm Creek, southwest of the city of Winnipeg. The second MB network consists of three RISMA stations immediately northwest of the city of Winnipeg, in the Sturgeon Creek watershed. Both the ON and MB test sites are characterized by intensive agriculture activity dominated by annual crops which include wheat, soybeans, canola, and corn (McNairn et al. Citation2015). The selected sites in ON and MB exhibit no vegetation cover during the spring season. Instead, they are characterized by relatively smooth bare soil surfaces with minor variation in surface roughness as annual crops are seeded. Typically, crops are seeded with low disturbance seeders and planters with minimal cultivation to conserve surface soil moisture. Surface roughness will not change during the growing season as there is no disturbance to the soil during crop growth. An NDVI (Normalized Difference Vegetation Index) map derived from a Sentinel-2 image captured over the MB experimental site near the towns of Carman and Elm Creek on 10 May 2021 is presented in . As demonstrated in , the NDVI values within the crop fields are very low, approximately 0.1, suggesting barren crop fields.
Figure 2. NDVI maps of the MB experimental site near the towns of Carman and Elm Creek derived from Sentinel-2 images acquired on (a) 10 May 2021 and (b) 24 July 2021.
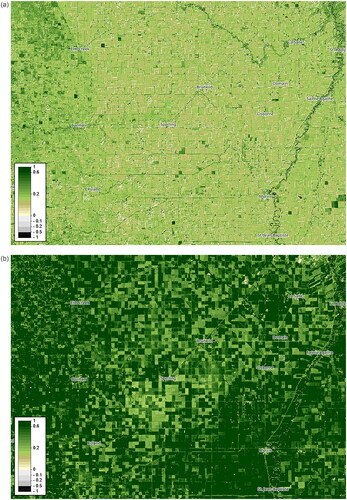
Vegetation cover will change markedly during the growing season (summer). Analysis of Leaf Area Index (LAI) data from Sentinel-2 satellite imagery show low LAI values (0 to 1) in spring and fall. In the summer, LAI values spike to 3–5. High biomass crops such as canola and corn will routinely range from 5–7. The crop fields are harvested in August and return to the no vegetation cover condition by fall (October). presents an NDVI map derived from a Sentinel-2 image taken on 24 July 2021, capturing the peak of the growing season in the MB experimental site near the towns of Carman and Elm Creek. As shown in , the crop fields in the MB experimental site exhibit high NDVI values due to the presence of vegetation.
The third site is in Saskatchewan (SK) near the town of Kenaston. Unlike the ON and MB sites, the SK location is characterized by grassland pastures. This site includes one network with four RISMA stations.
In-situ data
The RISMA stations are equipped with Stevens HydraProbe sensors that record soil temperature and a real dielectric permittivity measurement which is converted to a volumetric soil moisture value based on the Seyfried empirical model (Seyfried et al. Citation2005). The sensors are installed at the surface (0–5 cm), 5 cm, 20 cm, 50 cm and 100 cm depths. The SK site also have sensors installed at 150 cm (Pacheco et al. Citation2012). There are two to three probes at each depth which provide a measurement of spatial variability in soil moisture and a redundancy in the event of a sensor malfunction (Pacheco et al. Citation2012). The MB and SK sites are also equipped with a wind gauge, precipitation bucket and air temperature sensors. The ON sites are only equipped with precipitation buckets.
In our study, we consider the integrated SMC measured vertically from 0 to 5 cm due to the limited penetration capability of C-band SAR in bare soil (Ulaby et al. Citation1986). However, during the early spring thaw, we consider the measured soil moisture at 5 cm. This is because the 0 to 5 cm probes are inserted vertically at the soil surface, and in many instances, the frost will force the probes partially out of the ground during the spring thaw. This exposes the probe tines to the air and causes lower dielectric values, leading to underestimation of the integrated SMC measured vertically from 0 to 5 cm. Annually, AAFC conducts the required maintenance of the stations before the middle of May, by resetting the surface probes that have been displaced.
RCM acquisitions
In our study, 127 RCM SC30MCP images from both ascending and descending satellite orbits were acquired over the three selected experimental sites in 2020 and 2021. presents the number of RCM acquisitions obtained for each experimental site.
Table 1. Number of RCM acquisitions over the selected experimental sites.
Imagery acquisition was achieved by the four beams of the RCM SC30MCP imaging mode. presents the number of acquired images by each beam and the radar incidence angle of each beam.
Table 2. Number of RCM images for each beam of the SC30MCP imaging mode.
All the acquired images are multilooked (2 × 2) Ground Range Detected (GRD) products, providing the amplitude information of the backscattered signal. The RCM Data Management System (DMS) further reduces the speckle noise in amplitude images by applying a 3 × 3 boxcar filter. For our study, we managed to acquire images in either the beginning of the growing season (15 April to 15 June) or after the growing season (01 October to 31 October). Agricultural fields at the time of RCM imagery acquisitions should have no crops or significant row structures. Thus, fields are characterized by unvegetated bare soil with relatively smooth random roughness state. Subsequently, the backscattered radar signal should be mainly linked to the real part of the dielectric constant of the soil. The weather information collected by the RISMA stations is used to confirm snow-free unfrozen soil conditions in spring and fall.
Methodology
Data sampling
In all the acquired RCM images, the RH and RV backscattering values are sampled at the location of the RISMA stations, with a buffer zone having a radius of 15 m. The choice of a buffer zone with a radius of 15 m implies the calculation of the average backscattering within a circle with a diameter of 30 m. This diameter corresponds to the spatial resolution of the acquired SAR imagery. Furthermore, the local radar incidence angle at those locations is also derived. It is noteworthy that in our study, the local and nominal incidence angles should be equal, considering the flat terrain of the experimental sites. The arithmetic average of the measured SMC by the probes at the time of the image acquisition is calculated for each RISMA station. Thus, each obtained sample includes the RH and RV backscattering, the radar incidence angle and the average SMC measurement at the time of the image acquisition. The RCM SC30MCP imaging mode has an incidence angle range between 17.30° and 48.30° (). However, in our study we only consider samples with radar incidence angles between 20° and 43°. Any sample linked to a radar incidence angle <20° or >43° is ignored. This is following a recommendation by the RCM’s calibration and validation team, confirming the minor impact of the imperfect emitted RCM circular polarization signal, triggered by a dissimilarity between the H and V antenna gains, for a radar incidence angle between 20° and 43°. Within this range axial ratio of the transmitted signal is <0.5 dB. The non-circularity becomes problematic for radar incidence angles <20° or >43°. Herein, the axial ratio of the emitted signal is >0.5 dB. Consequently, sampling of the acquired 127 RCM images over RISMA stations offered a total of 323 samples.
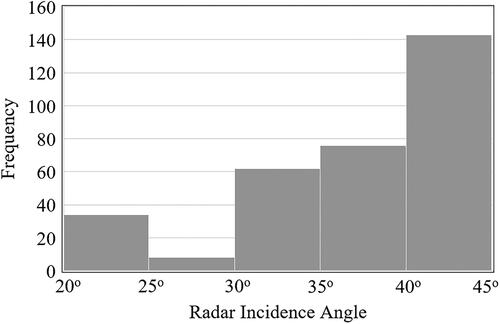
presents a histogram of the SMC measurements in our study. As shown in , a wide range of soil moisture conditions existed, starting from 5.8% (very dry conditions) to 46.4% (very wet conditions). However, the distribution of the SMC samples suggests that most of the SMC values are medium in the range of 15–25%. In our 323 samples, the minimum radar incidence angle was 20.8°, while the maximum was 42.9°. As shown in the histogram presented in , samples with incidence angles between 40° and 42.9° present the highest frequency. The lowest frequency is presented between 25° and 30°. The frequency of the samples in depends on the observation frequency of the RISMA stations within the specific range of incidence angles.
Figure 3. Histogram of the SMC measurements collected at the time of RCM SAR imagery acquisitions.
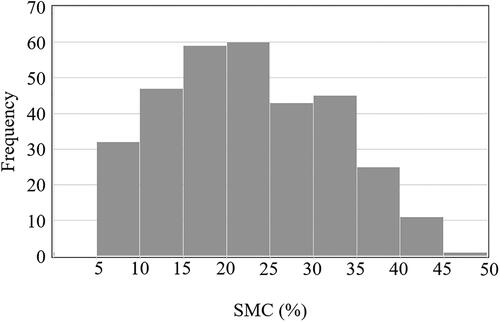
Figure 4. Histogram of the distribution of the radar incidence angles at the location of the RISMA stations.
Random forest regression implementation
The Random Forest Regression (RFR) machine learning technique is adopted as the retrieval algorithm in our study (Breiman Citation2000). In RFR, the algorithm uses a random split selection technique to construct multiple decision trees during the training phase. Next, it outputs the prediction results by averaging individual trees (Breiman Citation2000). Regression decision trees recursively split the values of continuous variables to grow a tree structure with multiple nodes. In order to avoid building many highly correlated decision trees, RF grows the individual decision trees from different bootstrapped training samples (Wang et al. Citation2018). All decision tree models are treated equally with one vote each, and all models vote to generate the final result. For each bootstrapped training samples, the decision tree model keeps growing with only a small group of predictor variables in each split, until the stopping criterion is reached. In RFR, the final result is the mean of all prediction values from each decision tree model (Breiman Citation2000).
In our study, optimization of RF models was conducted by tuning the RF hyperparameters through grid search. The grid search technique involves discretizing the hyperparameter domain into a grid. Subsequently, all possible combinations of grid values are tested, and performance metrics are calculated through cross-validation. The grid point that maximizes the average cross-validation value represents the optimal combination of hyperparameter values (Goodfellow et al. Citation2016). This is a critical step since values of the hyperparameters define the structure of the model and influence its performance. For this purpose, the 10-fold cross-validation approach was adopted to achieve the best performance for a training set. This approach selects the optimal combination of the number of decision trees in the forest, the maximum growing depth of the decision tree, the minimum number of samples at the leaf node, the minimum number of samples to split a node and the number of features considered by each decision tree when splitting a node (Ojala and Garriga Citation2009). A training set is randomly divided into ten folds with equal size. Processing iteratively, each fold serves once as a validation set during model fitting, while the remaining folds form the training set. Thus, each sample is given the opportunity to be used in the validation set one time and in training the model k-1 times, where k is the number of folds. Each corresponding fitted model is applied on the validation set to compute the RMSE. Finally, a grid search method is used to determine the optimal hyperparameter combination by minimizing the mean RMSE across all the ten validation sets. From our sample dataset (323 samples), training and testing subsets are created. For the RFR training, 80% of the samples are randomly selected. The remaining 20% of the samples are used to independently test the developed SMC retrieval algorithm. The RH and RV backscattering values, the radar incidence angle, and the measured SMC are used in the training process for the development of the retrieval algorithm. The testing process is achieved by predicting the SMC, using as input the RH and RV backscattering as well as the radar incidence angle. The predicted SMC is compared with the measured SMC from the test samples. The inclusion of the radar incidence angle as one of the variables for the development of the retrieval algorithm is necessary. This is because of the wide range of values this variable can take within the RCM SC30MCP imaging mode, which in the existing samples lies between 20.8° and 42.9° (). In the RFR implementation, the importance score for each variable is calculated by evaluating the regression tree with and without that variable (Schonlau and Zou Citation2020). This information describes the relevance of each parameter. It is worth noting that in this study, the random division of the sample dataset (80% for training and 20% for testing), as well as the implementation of the RFR was repeated one thousand times. The results presented in the following section are based on the sample dataset division that yielded the highest model performance.
Results analysis
Sensitivity analysis of radar backscattering to SMC
Scatterplots of the SMC as a function of radar incidence angle and polarization is shown in , with samples from MB, ON, and SK highlighted in orange, red, and green, respectively. The sensitivity of RH () and RV () backscattering to SMC is presented for small (20°–30°), medium (30°–40°), and large (40°–43°) radar incidence angles. illustrates that there is a large dispersion of radar backscattering in all radar polarizations and incidence angles, but it is not biased toward any particular location. This dispersion could be attributed to local surface features at the RISMA locations (e.g., soil texture and surface roughness). The linear correlation (R) between radar backscattering and SMC is weak (). This weak linear correlation relationship of radar backscattering to SMC has been reported in the literature by various studies (e.g. see Santi et al. Citation2019; El Hajj et al. Citation2017; Baghdadi et al. Citation2007). These studies (Santi et al. Citation2019; El Hajj et al. Citation2017; Baghdadi et al. Citation2007) have highlighted the weak correlation between co- and cross-polarization and SMC for C-band SAR data. This weak correlation likely arises from the complex interactions between radar signals and various surface properties, as well as the high variability in soil moisture levels. In our study, the maximum achieved R in RH backscattering is 0.22 in the radar incidence angle range of 40°–43° (). For RV backscattering, the maximum achieved R is 0.31 for a radar incidence angle range of 20°–30° (). However, it is obvious from that the radar backscattering in both RH and RV has an increasing trend as the SMC increases for all ranges of radar incidence angle. This increasing trend is validated by testing whether the slope of the fitted regression line is statistically different from zero. Therefore, we apply the t-test to examine the null hypothesis that the slope of the regression line is zero against the alternative hypothesis that the slope is statistically different from zero. The test hypothesis is applied for alpha value equal to 0.05. The obtained p-values for RH backscattering are 0.048, 0.021, and 0.009, for small (20°–30°), medium (30°–40°) and large (40°–43°) radar incidence angles, respectively. For RV backscattering, the obtained p-values are 0.044, 0.001, and 0.0003, respectively. Since the obtained p-value is <0.05 we reject the null hypothesis, and so we can not conclude that the slope of the fitted regression line is zero. The observed increasing trend in radar backscattering with rising soil moisture content, as depicted in , aligns with reported sensitivities of radar signal backscattering to soil moisture in the existing international literature for both HH and VV polarizations (Champion and Faivre Citation1997; Baghdadi et al. Citation2007; Mardan and Ahmadi Citation2021).
Figure 5. Sensitivity of RH and RV radar backscattering to measured surface SMC at RISMA stations for radar incidence angle range of (a), (d) 20°–30°, (b), (e) 30°–40°, and (c), (f) 40°–43°. Orange circles indicate samples from MB, red circles indicate samples from ON, and green circles indicate samples from SK.
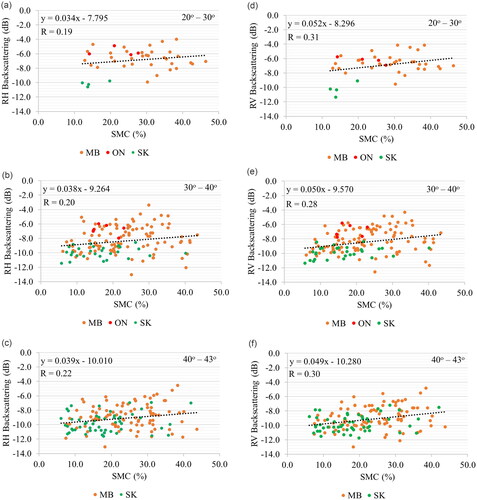
Interestingly, the slope of the RH fitted regression line increases as the radar incidence angle increases from the range 20°–30° to the range 40°–43°. For our case study, this is an indication of increasing sensitivity of RH to the measured SMC as the radar incidence angle increases. This observation might be linked to increased sensitivity of RH polarization to the dielectric properties of the soil at higher radar incidence angles. This observation should explain the reported highest correlation (0.22) of RH to SMC in the radar incidence angle range of 40°–43° (). Our finding agrees with the reported increased sensitivity of the radar signal to soil moisture within the low to medium radar incidence angles, as reported by Baghdadi et al. (Citation2007) in the context of HH polarization. It is worth noting that, RH polarization should be highly correlated with HH given the relatively smooth soil conditions which lead to very low cross polarization in (3).
In contrast, the slope of the RV fitted regression line decreases as the radar incidence angle increases from the range of 20°–30° to the range of 40°–43°. This observation is likely due to the increased impact of surface roughness on RV backscattering at larger incidence angles. Consequently, this may indicate an inverse relationship between RV sensitivity to SMC and increasing radar incidence angle. This observation explains the reported highest correlation (0.31) of RV to SMC in the radar incidence angle range of 20°–30° (). It is worth noting that our observations for RH and RV backscattering are valid independently of the soil moisture conditions within each range, which span all states from dry to wet soil.
RFR retrieval of soil moisture
The two following subsections delve into the examination of soil moisture retrieval using RFR under distinct conditions related to radar incidence angles. The first subsection examines soil moisture retrieval under varying radar incidence angles, considering the radar incidence angle as one of the regression variables. In contrast, the second subsection focuses on a scenario with small range of large incidence angles (40°–43°) where the impact on backscattering becomes negligible. In this case, the incidence angle is intentionally excluded as a variable in the RFR model, aiming to assess the model’s performance when only RH and RV backscattering are considered as regression variables.
Retrieval with radar incidence angle inclusion
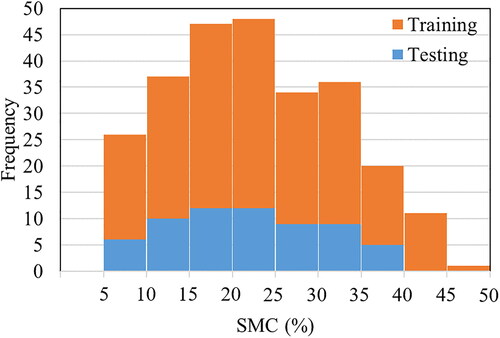
After grid searching with 10-fold cross-validation, the tuned setting of the RFR model was achieved with optimum number of decision trees in the forest = 100, maximum growing depth of the decision tree = 16, minimum number of samples at the leaf node = 1, minimum number of samples to split a node = 2, and number of features considered by each decision tree when splitting a node = 3. The retrieval algorithm obtained by the RFR model is independently assessed with the 20% testing subset. This testing subset was not involved in any of the RFR training steps. shows the histogram of the used samples for both training and testing. The performance of the retrieval algorithm is statistically evaluated using four statistical indices. These indices are the Pearson’s correlation coefficient (R), the RMSE, the bias, and the ubRMSE (Entekhabi et al. Citation2010).
Figure 6. Histogram of the training and test samples used in the retrieval algorithm.
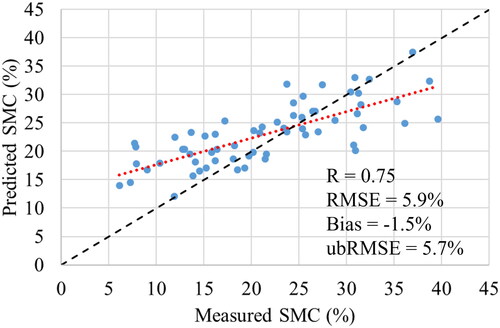
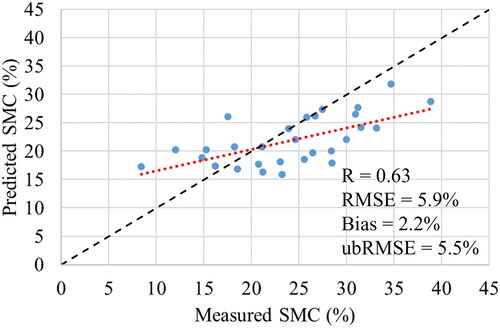
A comparison plot of the measured SMC at the RISMA stations in ON, MB, and SK, versus the predicted SMC by the RFR retrieval algorithm is shown in . Estimation of the strength of the linear relationship between RISMA in-situ measurements and predictions of SMC () reported R = 0.75. This comes with estimation error statistics of RMSE = 5.9%, bias = −1.5%, and ubRMSE = 5.7%. The obtained R is indicative of a well-correlated measured and predicted SMC values. However, estimates provided by the RFR shows an overestimation of soil moisture for extremely low values and underestimation of extremely high values (). The degraded RFR performance for extreme soil moisture conditions should be linked to the limited number of in-situ measurements in our dataset with extremely high or low moisture values ().
Figure 7. Comparison between measured SMC at RISMA stations and predicted SMC using the RFR retrieval algorithm. Radar incidence angle range is 20.8°–42.9°. Dotted line represents the fitted regression line. Dashed line = 1:1 match.
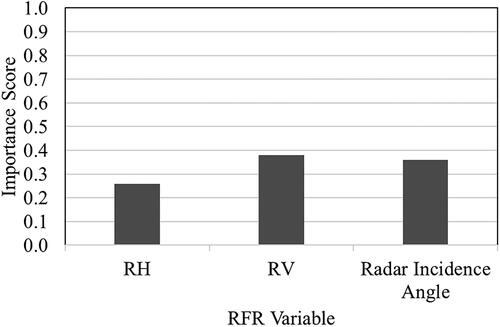
In addition to the SMC prediction, we also estimate the importance score for the three input variables (RH, RV, and the radar incidence angle) in the RFR training procedure (Schonlau and Zou Citation2020). presents a plot of the estimated importance scores for each of the three variables of the RFR. All scores are less than 0.5, but higher than 0.25. This indicates relevance of all the utilized variables. RV backscattering achieved the highest importance score of 0.38, while RH provides the lowest importance score of 0.26. Interestingly, the radar incidence angle achieves an importance score of 0.36, which is the second among the three variables. This elevated importance should be triggered by the wide range of incidence angle values (20.8°–42.9°) in our sample dataset. Therefore, the target backscattering would be different at different radar incidence angles, even for similar soil moisture conditions (). It is worth mentioning that the sum of all three importance scores is 1.
Figure 8. Importance score for the input variables in the RFR.
Retrieval with radar incidence angle exclusion
Fortunately, our sample dataset includes 143 samples within a radar incidence angle range of 40°–43° (). This provides an opportunity to test the RFR technique for soil moisture retrieval using only the two variables; RH and RV backscattering. We exclude the radar incidence angle parameter, given that the maximum difference of this variable within the subset of the 143 samples is negligible (2.3°). Therefore, the same RFR configuration adopted in our study is repeated with RH and RV backscattering of the 143 samples. 80% of the samples are randomly selected for the training process and the remainder are for the performance testing. presents the histogram of the distribution of the selected training and test samples. A comparison plot between the measured and predicted SMC values is presented in .
Figure 9. Histogram of the training and test samples used in the retrieval algorithm excluding the radar incidence angle.
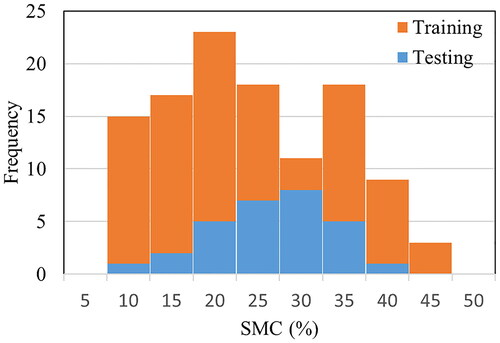
Figure 10. Comparison between measured SMC at RISMA stations and predicted SMC within a radar incidence angle range of 40°–43°. Dotted line represents the fitted regression line. Dashed line = 1:1 match.
Herein, the correlation R between SMC measurements and predictions is equal to 0.63. Moreover, the results yielded estimation error statistics of RMSE = 5.9%, bias = 2.2%, and ubRMSE = 5.5%. A decrease in the correlation between SMC measurements and predictions, accompanied by a slight increase in absolute bias is reported. However, the RMSE remains the same with slightly improved ubRMSE. This overall decrease in the SMC retrieval when compared to the performance using the entire sample dataset (323 samples) could be due to the fact that the SMC retrieval is attempted at higher radar incidence angles (40°–43°). A decrease of R combined with smaller ubRMSE is normally due to a decrease of the variance of the samples, which is visible in . This might be triggered by the small range of the radar incidence angles (40°–43°) of the samples. Our finding agrees with the findings of previous studies, which showed a performance decline in SMC retrieval algorithms at higher radar incidence angles (Baghdadi et al. Citation2007).
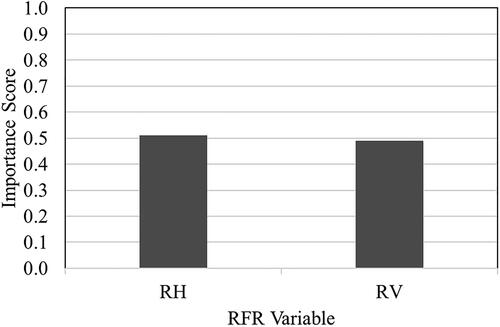
Interestingly for our case study, the importance score for the two variables RH and RV () appears to be comparable, with the RH importance score (0.51) to slightly outperform RV (0.49). The increase in the importance score of RH, compared to the previously achieved score using the entire sample dataset (), could be linked to our observation of an increasing sensitivity of RH backscattering to SMC within higher incidence angle ranges. This was indicated by the increasing slope of the fitted regression line (). For RH backscattering, the highest fitted regression line slope was reported for incidence angle range of 40°–43°, as illustrated in , which agrees with the incidence angle range of the 143 samples used in our RFR experiment.
Figure 11. Importance score for the input variables in the RFR.
Soil moisture spatial variability
We examine the capability of the RFR retrieval algorithm in terms of capturing the soil moisture spatial variability. For this purpose, we apply the retrieval algorithm to two selected SAR images acquired over our experimental site in MB (). The selected images were acquired in two different seasons; spring and fall. The first image was acquired on 6 May 2021 by the SC30MCPB beam mode. This mode has an incidence angle range between 26.09° and 36.30°. The second image was acquired on 28 October 2021 by the SC30MCPC beam mode. This mode has a range of larger incidence angles between 33.89° and 42.75°. Both images belong to our initial set of 127 RCM images used in this study. The retrieval algorithm was applied to the entire set of images by estimating the soil moisture value pixel by pixel. Information about the RH and RV backscattering of each pixel, and the related radar incidence angle is used for the soil moisture retrieval. The derived soil moisture maps are presented in . Precise masks to mask out all nonagricultural land covers (e.g. urban areas, forests, and waterbodies) and limit the retrievals to pixels belonging to agricultural fields only were not available. Therefore, results in should be carefully analyzed by focusing on soil moisture retrievals in bare agricultural fields only.
Figure 12. Soil moisture maps produced for MB from acquired RCM images on (a) 6 May 2021 with the SC30MCPB imaging beam mode in ascending pass, and (b) 28 October 2021 with the SC30MCPC imaging beam mode in descending pass. Yellow polygon indicates MB experimental site.
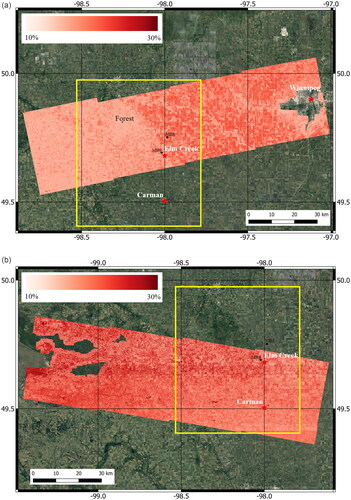
As shown in , the spatial variability of the soil moisture is captured at field scale. A visually clear contrast within our MB experimental site (yellow polygon) is depicted in . The east region appears to be wet compared to the region to the west, which shows drier soil conditions. Soil texture information, provided by AAFC at a 90 m spatial resolution () within the yellow polygon, highlights the influence of soil texture on the observed contrast in soil moisture values. As shown in , fine textured clay soils dominate the eastern region of the site. However, coarser textured sediments (sands) dominate the region from center to the west of the experimental site (). Therefore, the contrast between the two regions should be related to the different water holding capacity of the soil.
Figure 13. Percentage of (a) clay, and (b) sand in the MB experimental site.
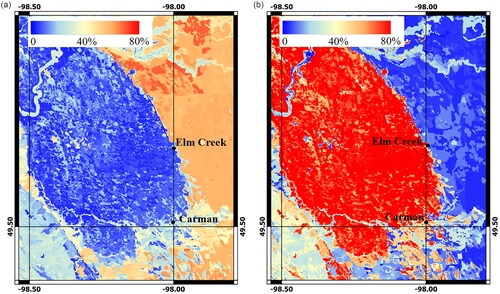
Unlike coarse textured sandy soils which allow for a rapid internal drainage of water and lower water storage capacity through a greater presence of soil macro-pores, fine textured clay soils are characterized by increased soil water storage capacity and slower internal drainage through a large presence of micro soil pores (O’Geen Citation2013). The increased water holding capacity of clay soils is depicted in with the fields with higher SMC located in the eastern region. The opposite is seen in the fields of the central and western regions linked to sandy soils, which appear drier. It is worth noting that the coarser textured soils region includes a forested area which is ignored in our analysis (). Agricultural fields in this region are located south of the forested area. We further validate our observation through the selection of two RISMA stations; MB8 located in fine textured clay soils and MB9 located in coarse textured sandy soils (). The average SMC recorded by MB8 at the time of image acquisition was 26.5%. However, MB9 recorded an average SMC equal to half of that reported by MB8 (13.2%). Precipitation information recorded by the MB8 and MB9 stations indicated no precipitation event before the RCM image acquisition. The last precipitation event was recorded on 2 May 2021, three days before the image acquisition.
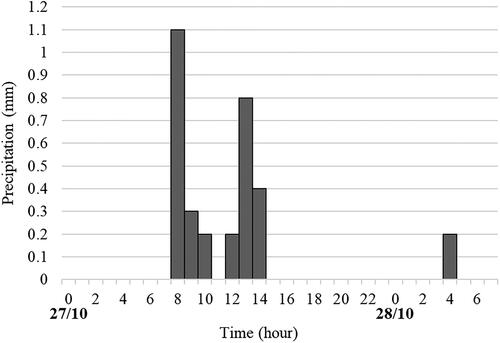
A generally increased SMC values is shown in , indicating wetter soil moisture conditions compared to the spring soil moisture map (). Weather information recorded by the MB8 and MB9 RISMA stations indicated precipitation events occurred before the acquisition time of the RCM image, which was at 6:47:35AM (CST) on 28 October 2021. A plot of the average hourly precipitation recorded by the two stations is presented in . Herein, a total average of 3.2 mm was recorded in less than 24 hours from the RCM image acquisition, explaining the increased soil moisture of the fall map (). The average SMC recorded by MB8 at the time of image acquisition was 35.3%, while the MB9 station recorded a SMC of 16.0%. Thus, both stations report higher SMC values in the fall, compared to the spring. It is worth mentioning that the previously observed contrast in the estimated SMC in sand and clay soils () is not repeated in . This is because the majority of the overlap area between the RCM image and the yellow polygon is characterized by coarse textured sandy soils.
Figure 14. Average hourly precipitation recorded by the MB8 and MB9 RISMA stations on 27 October and the morning of 28 October 2021.
Discussion
The findings from this study demonstrate encouraging results in the retrieval of soil moisture using RCM compact polarimetry by the SC30MCP imaging mode and the RFR machine learning technique. However, the assessment of additional imaging modes is still necessary for a conclusive analysis of the RCM performance. These modes could include the RCM 16MCP and 5MCP imaging modes, featuring spatial resolutions of 16 m and 5 m, respectively. While these modes offer higher spatial resolution compared to the SC30MCP mode examined in this study, they also exhibit higher noise floors (< −29 dB for the 16MCP mode and < −23 dB for the 5MCP mode) in contrast to the SC30MCP mode (< −31 dB). Such analysis would allow for studying the impacts of mode characteristics, such as spatial resolution and noise floor, on the retrieval accuracy.
The SMC retrieval using RH and RV backscattering is conducted in bare agricultural fields with relatively smooth random surface roughness. This leads to minimum contribution of the soil roughness in the backscattered signal. However, the analysis of the SMC retrieval capability of RH and RV backscattering should be treated with caution for soil conditions with increased roughness. This is because increased soil roughness would increase the contribution of cross-polarization in the RH and RV backscattering (EquationEquation (3)(3)
(3) ). Such conditions could lead to radar backscattered signals being heavily impacted by the roughness of the soil (Zribi et al. Citation2005; Alvarez-Mozos et al. Citation2009). In this scenario, it is necessary to collect and incorporate in-situ field measurements of soil roughness as an additional variable in the soil moisture retrieval model. Another potential solution to alleviate the impact of high soil roughness conditions is to employ a hybrid multi-angle and multipolarization approach for soil moisture retrieval, similar to the method proposed in Merzouki and McNairn (Citation2015) based on the integral equation model. It is important to emphasize that a priori characterization of soil surface roughness would be difficult to obtain for operational soil moisture monitoring as roughness varies spatially and temporally (Merzouki and McNairn Citation2015). However, a dedicated study investigating SMC retrieval using CP SAR imagery over various soil roughness conditions would be useful. While our study predominantly emphasizes soil moisture retrieval using C-band SAR during the spring and fall in Canada when soil is bare and relatively smooth, it is essential to contextualize the seasonal limitations of this approach. Winter months, characterized by snow cover and frozen soil, present challenges for SAR-based soil moisture estimation. Conversely, in the summer, the C-band SAR’s restricted penetration depth through dense vegetation hampers accurate retrievals. However, the upcoming NISAR and ROSE-L missions hold promise, with their anticipated capabilities for enhanced radar signal penetration through vegetation, paving the way for more comprehensive soil moisture monitoring across seasons.
The radar incidence angle emerges as a significant variable within the soil moisture retrieval algorithm. Our case study reveals that its importance score surpasses that of RH backscattering for soil moisture retrieval across a wide range of radar incidence angles. Furthermore, the sensitivity of RV to SMC, as indicated by the slope of the fitted regression line, appears to be greater than that of RH. Notably, our study identifies a decrease in RV sensitivity as radar incidence angle increases. In contrast, RH backscattering exhibits an opposing trend, yet RV backscattering consistently demonstrates higher sensitivity when compared to RH.
In this study, we utilized samples sourced from a collection of RCM images captured during various seasons (spring and fall) and years (2020 and 2021). Furthermore, we broadened the scope of our study by not confining it to a single experimental site; instead, we employed three entirely independent experimental sites. This approach was chosen to mitigate potential site-specific influences related to distinct environmental conditions, a common characteristic of data-driven methodologies (Santi et al. Citation2019). Recognizing the influence of soil texture on soil moisture, a future direction of our work will be to explore soil moisture retrieval, specifically focusing on the MB experimental site. This will involve incorporating the soil texture shown in Figuere 13 as a variable in the regression modeling for the retrieval algorithm. Although few studies have attempted to derive relationships between soil texture and radar scattering signal, these attempts were limited to high frequency X-band radar measurements (Baghdadi et al. Citation2008; Anguela et al. Citation2010; Aubert et al. Citation2011; Gorrab et al. Citation2015). In our study we use C-band radar measurements with lower frequency compared to X-band. Consequently, the soil texture should have a negligible impact on the radar signal in our study.
Enhancing the representativeness of our sample dataset remains achievable by introducing additional samples, possibly from new experimental sites characterized by diverse environmental conditions. While the sample count may be limited, it remains adequate for generating soil moisture maps that convincingly demonstrate the capability to capture spatial variations in soil moisture. It is important to note that aside from machine learning techniques, alternative methodologies could be explored for soil moisture retrieval using our SAR dataset. These methodologies might center on time series SAR data, like the Alpha approximation method introduced by Balenzano et al. (Citation2011). This method requires an initial estimation of upper and lower bound soil moisture values to constrain the soil moisture retrieval.
Conclusions
The objective of this study is to explore the retrieval of SMC in bare soil employing the RCM compact polarimetry and the RFR machine learning technique. While the main focus is on RH and RV backscattering, which are the primary RCM CP products, our study incorporates radar incidence angles as a variable in the retrieval process. This study is noteworthy for providing a distinctive examination of the sensitivities of RH and RV backscattering under diverse soil moisture conditions, ranging from dry to wet. The investigation of SMC retrieval spans a wide range of radar incidence angles, followed by a more focused examination at higher angles. Additionally, the study includes the generation of soil moisture maps for the analysis of spatial variations in soil moisture levels. This analysis is enhanced by considering scenarios with and without precipitation events occurring before the acquisition of RCM imagery. We obtained time-series data from CP SAR images at three experimental sites in Canada, each equipped with RISMA stations for in-situ soil moisture measurements recorded at 15-minute intervals.
In our study, we observed that as soil moisture levels escalated, there was a notable increase in radar backscattering. This trend was consistently observed for both RH and RV radar measurements. Importantly, this increasing trend was statistically confirmed using the t-test. In our analysis, we observed distinct trends in the sensitivity of radar backscattering with varying radar incidence angles. Specifically, for RH backscattering, there was a notable increase in sensitivity as the radar incidence angles increase. Conversely, for RV backscattering, sensitivity exhibited a decline with rising radar incidence angles. These contrasting patterns highlight the differential responses of RH and RV backscatter to changes in radar incidence angles.
Our study indicated encouraging results in the retrieval of near-surface moisture of bare soil using the RCM compact polarimetry by the SC30MCP imaging mode and the RFR machine learning technique. A correlation of 0.75 was achieved between measured and predicted soil moisture, with RMSE = 5.9%, bias = −1.5%, and ubRMSE = 5.7%. Furthermore, our study confirms the performance degradation of soil moisture retrieval at higher radar incidence angles. In addition, produced soil moisture maps convincingly demonstrate the capability to capture spatial variations in soil moisture at field scale linked to different soil textures.
Acknowledgments
The authors would like to thank the anonymous reviewers for their valuable comments. Additionally, the authors thank AAFC for funding this research project. RADARSAT Constellation Mission Imagery (c) Government of Canada (2020)-All Rights Reserved. RADARSAT is an official mark of the Canadian Space Agency.
Additional information
Funding
References
- Alvarez-Mozos, J., Verhoest, N.E.C., Larrañaga, A., Casalí, J., and González-Audícana, M. 2009. “Influence of surface roughness spatial variability and temporal dynamics on the retrieval of soil moisture from SAR observations.” Sensors, Vol. 9(No. 1): pp. 1–19. doi:10.3390/s90100463.
- Anguela, T.P., Zribi, M., Baghdadi, N., and Loumagne, C. 2010. “Analysis of local variation of soil surface parameters with TerraSAR-X radar data over bare agricultural fields.” IEEE Transactions on Geoscience and Remote Sensing, Vol. 48(No. 2): pp. 874–881. doi:10.1109/TGRS.2009.2028019.
- Aubert, M., Baghdadi, N., Zribi, M., Douaoui, A., Loumagne, C., Baup, F., El Hajj, M., and Garrigues, S. 2011. “Analysis of TerraSAR-X data sensitivity to bare soil moisture, roughness, composition and soil crust.” Remote Sensing of Environment, Vol. 115(No. 8): pp. 1801–1810. doi:10.1016/j.rse.2011.02.021.
- Baghdadi, N., Aubert, M., Cerdan, O., Franchistéguy, L., Viel, C., Eric, M., Zribi, M., and Desprats, J.F. 2007. “Operational mapping of soil moisture using synthetic aperture radar data: Application to the Touch Basin (France).” Sensors, Vol. 7(No. 10): pp. 2458–2483. doi:10.3390/s7102458.
- Baghdadi, N., Zribi, M., Loumagne, C., Ansart, P., and Anguela, T.P. 2008. “Analysis of TerraSAR-X data and their sensitivity to soil surface parameters over bare agricultural fields.” Remote Sensing of Environment, Vol. 112(No. 12): pp. 4370–4379. doi:10.1016/j.rse.2008.08.004.
- Balenzano, A., Mattia, F., Satalino, G., and Davidson, M.W.J. 2011. “Dense temporal series of C- and L-band SAR data for soil moisture retrieval over agricultural crops.” IEEE Journal of Selected Topics in Applied Earth Observations and Remote Sensing, Vol. 4(No. 2): pp. 439–450. doi:10.1109/JSTARS.2010.2052916.
- Breiman, L. 2000. Some Infinity Theory for Predictor Ensembles, Technical Report 579. California: Statistics Department UCB.
- Champion, I., and Faivre, R. 1997. “Sensitivity of the radar signal to soil moisture: Variation with incidence angle, frequency, and polarization.” IEEE Transactions on Geoscience and Remote Sensing, Vol. 35(No. 3): pp. 781–783. doi:10.1109/36.582001.
- Charbonneau, F., Brisco, B., Raney, K., McNairn, H., Liu, C., Vachon, P., Shang, J., et al. 2010. “Compact polarimetry overview and applications assessment.” Canadian Journal of Remote Sensing, Vol. 36(No. sup2): pp. S298–S315. (No doi:10.5589/m10-062.
- Chung, J., Lee, Y., Kim, J., Jung, C., and Kim, S. 2022. “Soil moisture content estimation based on Sentinel-1 SAR imagery using an artificial neural network and hydrological components.” Remote Sensing, Vol. 14(No. 3): pp. 465. doi:10.3390/rs14030465.
- Cloude, S.R., Goodenough, D.G., and Chen, H. 2012. “Compact decomposition theory.” IEEE Geoscience and Remote Sensing Letters, Vol. 9(No. 1): pp. 28–32. doi:10.1109/LGRS.2011.2158983.
- Dabboor, M., Atteia, G., Meshoul, S., and Alayed, W. 2023. “Deep learning-based framework for soil moisture content retrieval of bare soil from satellite data.” Remote Sensing, Vol. 15(No. 7): pp. 1916. doi:10.3390/rs15071916.
- Dabboor, M., Iris, S., and Singhroy, V. 2018. “The RADARSAT constellation mission in support of environmental applications.” Proceedings, Vol. 2(No. 7): pp. 323.
- Dabboor, M., Sun, L., Carrera, M.L., Friesen, M., Merzouki, A., McNairn, H., Powers, J., and Bélair, S. 2019. “Comparative analysis of high-resolution soil moisture simulations from the soil, vegetation, and snow (SVS) land surface model using SAR imagery over bare soil.” Water, Vol. 11(No. 3): pp. 542. doi:10.3390/w11030542.
- Dabboor, M., Olthof, I., Mahdianpari, M., Mohammadimanesh, F., Shokr, M., Brisco, B., and Homayouni, S. 2022. “The RADARSAT constellation mission core applications: First results.” Remote Sensing, Vol. 14 ((No. 2):pp. 301. doi:10.3390/rs14020301.
- Das, K., and Paul, P. 2015. “Soil moisture retrieval model by using RISAT-1, C-band data in tropical dry and sub-humid zone of Bankura district of India.” Egyptian Journal of Remote Sensing and Space Science, Vol. 18(No. 2): pp. 297–310.
- El Hajj, M., Baghdadi, N., Zribi, M., and Bazzi, H. 2017. “Synergic use of Sentinel-1 and Sentinel-2 images for operational soil moisture mapping at high spatial resolution over agricultural areas.” Remote Sensing, Vol. 9(No. 12): pp. 1292. doi:10.3390/rs9121292.
- Entekhabi, D., Reichle, R.H., Koster, R.D., and Crow, W.T. 2010. “Performance metrics for soil moisture retrievals and application requirements.” Journal of Hydrometeorology, Vol. 11(No. 3): pp. 832–840. doi:10.1175/2010JHM1223.1.
- Ezzahar, J., Ouaadi, N., Zribi, M., Elfarkh, J., Aouade, G., Khabba, S., Er-Raki, S., Chehbouni, A., and Jarlan, L. 2019. “Evaluation of backscattering models and support vector machine for the retrieval of bare soil moisture from Sentinel-1 data.” Remote Sensing, Vol. 12(No. 1): pp. 72. doi:10.3390/rs12010072.
- Freeman, A., Dubois-Fernandez, P.C., Pottier, E. and My-Linh Truong-Loi, 2009. “Estimation of soil moisture and Faraday rotation from bare surfaces using compact polarimetry.” IEEE Transactions on Geoscience and Remote Sensing, Vol. 47(No. 11): pp. 3608–3615. doi:10.1109/TGRS.2009.2031428.
- Gharechelou, S., Tateishi, R., Sri Sumantyo, J.T., and Johnson, B.A. 2021. “Soil moisture retrieval using polarimetric SAR data and experimental observations in an arid environment.” ISPRS International Journal of Geo-Information, Vol. 10(No. 10): pp. 711. doi:10.3390/ijgi10100711.
- Goodfellow, I., Bengio, Y., and Courville, A. 2016. Deep learning. Cambridge: MIT Press.
- Gorrab, A., Zribi, M., Baghdadi, N., Mougenot, B., Fanise, P., and Chabaane, Z.L. 2015. “Retrieval of both soil moisture and texture using TerraSAR-X images.” Remote Sensing, Vol. 7(No. 8): pp. 10098–10116. Vol doi:10.3390/rs70810098.
- Greifeneder, F., Notarnicola, C., and Wagner, W. 2021. “A machine learning-based approach for surface soil moisture estimations with Google earth engine.” Remote Sensing, Vol. 13(No. 11): pp. 2099. doi:10.3390/rs13112099.
- Gururaj, P., Umesh, P., Shetty, A., 2021. “Assessment of surface soil moisture from ALOS PALSAR-2 in small-scale maize fields using polarimetric decomposition technique.” Acta Geophysica, Vol. 69: pp. 579–588.
- Kulkarni, V., and Sinha, P. 2013. “Random forest classifiers: A survey and future research directions.” International Journal of Advanced Computing, Vol. 36: pp. 1144–1153.
- Mardan, M., Ahmadi, S., 2021. “Soil moisture retrieval over agricultural fields through integration of synthetic aperture radar and optical images.” GIScience & Remote Sensing, Vol. 58(No. 8): pp. 1276–1299. doi:10.1080/15481603.2021.1974276.
- McNairn, H., Jackson, T.J., Wiseman, G., Belair, S., Berg, A., Bullock, P., Colliander, A., et al. 2015. “The soil moisture active passive validation experiment 2012 (SMAPVEX12): Prelaunch calibration and validation of the SMAP soil moisture algorithms.” IEEE Transactions on Geoscience and Remote Sensing, Vol. 53(No. 5): pp. 2784–2801. doi:10.1109/TGRS.2014.2364913.
- Merzouki, A., and McNairn, H. 2015. “A hybrid (multi-angle and multipolarization) approach to soil moisture retrieval using the integral equation model: preparing for the RADARSAT constellation mission.” Canadian Journal of Remote Sensing, Vol. 41(No. 5): pp. 349–362. doi:10.1080/07038992.2015.1104629.
- Merzouki, A., McNairn, H., Powers, J., and Friesen, M. 2019. “Synthetic aperture radar (SAR) compact polarimetry for soil moisture retrieval.” Remote Sensing, Vol. 11(No. 19): pp. 2227. doi:10.3390/rs11192227.
- O’Geen, A.T. 2013. “Soil water dynamics.” Nature Education Knowledge, Vol. 4(No. 5): pp. 9.
- Ojala, M., and Garriga, G. 2009. “Permutation tests for studying classifier performance.” Journal of Machine Learning Research, Vol. 11: pp. 908–913.
- Ouellette, J.D., Johnson, J.T., Kim, S., Van Zyl, J., Moghaddam, M., Spencer, M.W., Tsang, L., and Entekhabi, D. 2014. “A simulation study of compact polarimetry for radar retrieval of soil moisture.” IEEE Transactions on Geoscience and Remote Sensing, Vol. 52(No. 9): pp. 5966–5973. doi:10.1109/TGRS.2013.2294133.
- Pacheco, A., L’Heureux, J., McNairn, H., Powers, J., Howard, A., Geng, X., Rollin, P., et al. 2012. “Real-time in-situ soil monitoring for agriculture (RISMA) network metadata." Agriculture and Agri-Food Canada. https://agriculture.canada.ca/SoilMonitoringStations/files/RISMA_Network_Metadata.pdf (accessed on 05 April 2022).
- Ponnurangam, G.G., Jagdhuber, T., Hajnsek, I., and Rao, Y.S. 2016. “Soil moisture estimation using hybrid polarimetric SAR data of RISAT-1.” IEEE Transactions on Geoscience and Remote Sensing, Vol. 54(No. 4): pp. 2033–2049. doi:10.1109/TGRS.2015.2494860.
- Raney, R.K. 2007. “Hybrid-polarity SAR architecture.” IEEE Transactions on Geoscience and Remote Sensing, Vol. 45(No. 11): pp. 3397–3404. doi:10.1109/TGRS.2007.895883.
- Santi, E., Dabboor, M., Pettinato, S., and Paloscia, S. 2019. “Combining machine learning and compact polarimetry for estimating soil moisture from C-band SAR data.” Remote Sensing, Vol. 11(No. 20): pp. 2451. doi:10.3390/rs11202451.
- Schonlau, M., and Zou, R.Y. 2020. “The random forest algorithm for statistical learning.” The Stata Journal: Promoting Communications on Statistics and Stata, Vol. 20(No. 1): pp. 3–29. doi:10.1177/1536867X20909688.
- Sarica, A., Cerasa, A., and Quattrone, A. 2017. “Random forest algorithm for the classification of neuroimaging data in Alzheimer’s disease: a systematic review.” Frontiers in Aging Neuroscience, Vol. 9: pp. 329. doi:10.3389/fnagi.2017.00329.
- Séguin, G., and Ahmed, S. 2009. “RADARSAT constellation, project objectives and status.” Proceedings of the IEEE International Geoscience and Remote Sensing Symposium, Cape Town, South Africa, pp. II-894–II-897.
- Seung-Bum, K., and Tien-Hao, L. 2021. “Robust retrieval of soil moisture at field scale across wide-ranging SAR incidence angles for soybean, wheat, forage, oat and grass.” Remote Sensing of Environment, Vol. 266: pp. 112712.
- Seyfried, M.S., Grant, L.E., Du, E., and Humes, K. 2005. “Dielectric loss and calibration of the hydra probe soil water sensor.” Journal of Vadose Zone, Vol. 4: pp. 1070–1079.
- Souyris, J.C., Imbo, P., Fjortoft, R., Mingot, S., and Lee, J.S. 2005. “Compact polarimetry based on symmetry properties of geophysical media: The π/4 mode.” IEEE Transactions on Geoscience and Remote Sensing, Vol. 43(No. 3): pp. 634–646. doi:10.1109/TGRS.2004.842486.
- Ulaby, F. T., Moore, R. K., and Fung, A. K. 1986. Microwave Remote Sensing: Active and Passive. Massachusetts: Artech House.
- Wang, Y., Xiu, C., Zhang, X., and Yang, D. 2018. “WiFi indoor localization with CSI fingerprinting-based random forest.” Sensors, Vol. 18(No. 9): pp. 2869. doi:10.3390/s18092869.
- Williams, M.L. 2008. “Potential for surface parameter estimation using compact polarimetric SAR.” IEEE Geoscience and Remote Sensing Letters, Vol. 5(No. 3): pp. 471–473. doi:10.1109/LGRS.2008.918012.
- Zribi, M., Baghdadi, N., Holah, N., Fafin, O., and Guérin, C. 2005. “Evaluation of a rough soil surface description with ASAR-ENVISAT radar data.” Remote Sensing of Environment, Vol. 95(No. 1): pp. 67–76. doi:10.1016/j.rse.2004.11.014.