Abstract
Near-surface air temperatures have been monitored from 2005 to the present in a mesoscale network of 280 sites in the foothills of the Rocky Mountains in southwestern Alberta, Canada. The monitoring network covers a range of elevations, topographic conditions and surface environments. In this paper, we report on the seasonal structure of temperature patterns and near-surface lapse rates in the region for the period 2005–09. Multivariate regression is used to model the influence of elevation, aspect, slope and surface cover on monthly mean temperatures. Regression models identify the influence of synoptic weather systems on regional temperature patterns and prevailing lapse rates. To explore this further, we examine daily temperature patterns under the influence of two common weather systems in the region: cold (continental polar) air masses and chinooks.
Résumé [Traduit par la rédaction] Nous avons surveillé les températures de l'air près de la surface de 2005 jusqu'à présent au moyen d'un réseau de mésoéchelle de 280 sites dans les contreforts des Rocheuses, dans le sud-ouest de l'Alberta, au Canada. Le réseau de surveillance englobe une gamme d'élévations, de conditions topographiques et d'environnements de surface. Dans cet article, nous présentons nos conclusions sur la structure saisonnière des configurations de température et des gradients thermiques verticaux près de la surface dans la région pour la période 2005 – 2009. Nous utilisons la régression multivariée pour modéliser l'influence de l'élévation, de l'aspect, de la pente et de la couverture de la surface sur les températures moyennes mensuelles. Les modèles de régression mettent en lumière l'influence des systèmes météorologiques synoptiques sur les configurations de température et les gradients thermiques verticaux prédominants dans la région. Pour mieux étudier cette question, nous examinons l'effet que produisent sur les configurations de température quotidiennes deux systèmes météorologiques communs dans la région : les masses d'air froid (continental polaire) et les chinooks.
1 Introduction
Spatial-temporal patterns of temperature variability are relevant to a broad range of Earth surface processes, and many scientific disciplines confront the need to estimate local- or regional-scale surface temperatures based on point measurements or atmospheric models. Temperature is considered to be a relatively straightforward meteorological variable to interpolate on climatic scales, because temperature fields are continuous; horizontal temperature gradients are typically low when averaged over many years, and the effects of individual weather systems average out over this time period.
This generalization breaks down in regions with complex terrain, such as mountain environments, where topographic effects can lead to processes such as cold air drainage and pooling in valley bottoms (Rolland, Citation2002), katabatic winds, adiabatically warmed winds in the lee slopes of mountains, and variations in solar radiative heating as a function of slope, aspect, and topographic shading (Barry, Citation2008). Contrasting surface conditions (e.g., snow, rock or forest environments) also lead to gradients in the surface energy balance processes that govern near-surface air temperature. These complications are rarely addressed in temperature interpolations, because meteorological data are generally unavailable to evaluate their importance. Instead, temperatures in complex terrain are commonly estimated based on low-elevation (e.g., valley-bottom data) along with vertical temperature gradients based on typical values of the free-air atmospheric lapse rate, −6° to −7°C km−1 (e.g., Legates and Willmott, Citation1990; Walland and Simmonds, Citation1996; Dodson and Marks, Citation1997).
Despite their broad application, it is not clear that free-air lapse rates offer an appropriate estimate of vertical gradients in near-surface temperatures when interpolating temperature observations over shorter time periods or in areas of variable terrain. Surface environment, terrain features and atmospheric conditions play a complicated role in dictating spatial and temporal patterns of surface temperature (McCutchan and Fox, Citation1986; Bolstad et al., Citation1998; Pepin et al., Citation1999; Joly et al., Citation2003). Synoptic weather systems and local-to-regional air mass movements, such as the chinook winds that descend in the lee slope of the Rocky Mountains, also alter surface temperatures in ways that cannot be estimated as a simple function of elevation.
Several studies have examined the seasonal and spatial variation in near-surface temperature patterns and lapse rates. Rolland Citation(2002) constructed seasonal lapse rates based on long-term climatological data from a network of 269 stations in northern Italy. Annual mean near-surface lapse rates in the region are −5.4° to −5.8°C km−1, steepening in the summer. Annual and summer values are less steep than average free-air values. This was also reported in other studies examining regional-scale near-surface lapse rates (e.g., Trombotto et al., Citation1997; Humlum and Christiansen, Citation1998; Shea et al., Citation2004), which found mean values in mountain regions that are in fact well-represented by the value first recommended by Angot Citation(1892), −5.5°C km−1. However, a constant value for the near-surface lapse rate neglects important and systematic variations associated with diurnal, synoptic and seasonal weather patterns (e.g., Pepin and Losleben, Citation2002; Marshall et al., Citation2007; Blandford et al., Citation2008).
Pepin and colleagues examined near-surface temperature lapse rates in England (Pepin et al., Citation1999), the eastern slopes of the Colorado Rockies (Pepin and Losleben, Citation2002), and the Spanish Pyrenees (Pepin and Kidd, Citation2006). In each case they found significant diurnal, synoptic-scale (daily to weekly) and seasonal variability, associated with local energy balance processes, weather conditions (e.g., cloud cover and wind strength), and synoptic conditions (e.g., cyclonic or anticyclonic flow). Pepin and Seidel Citation(2005) also reported that changes in near-surface temperatures in mountainous terrain are opposite to free-air patterns.
Most of these studies found an influence of terrain variables and synoptic weather systems, but the patterns and processes were not examined in detail. Further, the influence of the surface environment is not well-documented. In some cases the available station network was large-scale and may not have been fully representative of the terrain (e.g., Shea et al., Citation2004), while in other studies (e.g., Pepin and Losleben, Citation2002), results were based on a small number of stations spanning a one-dimensional transect, which made it difficult to assess the two-dimensional impact of different weather systems on regional temperature patterns. Hourly or daily data were also needed to examine specific weather systems, in contrast to monthly, seasonal, or annual means.
In this paper, we report on the initial results from a network of 280 temperature loggers installed over an area of 24,000 km2, covering an elevation range from 820 to 2950 m above sea level on the eastern slopes of the Canadian Rocky Mountains (). Section 4 examines mean seasonal temperature patterns for the period 2005–09. In Section 5 we evaluate mean monthly lapse rates using a multivariate statistical model that includes several terrain and surface factors. Daily temperature observations are then examined in Section 6 to explore how these relationships are affected by two dominant weather systems that affect the region during the winter: (i) cold, continental air masses that descend over the region from the north and (ii) westerly, lee-slope (chinook) winds that are associated with anomalously warm temperatures.
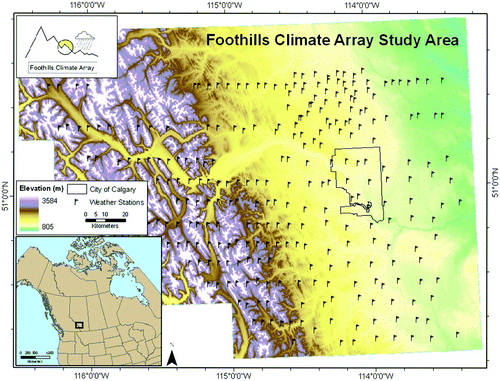
Fig. 1 Locations of the Foothills Climate Array (FCA) monitoring sites, 2004–10 and the geographic position of the FCA in southwestern Alberta, Canada (inset).
2 Study region
Data for this study were collected as part of the University of Calgary Foothills Climate Array (FCA). The FCA was established to provide a mesoscale observation network for temperature, humidity and rainfall in a region with complex terrain and high spatial variability of meteorological conditions. It has been in operation since the summer of 2004 and covers a broad range of altitudes and surface environments in the southwestern Alberta foothills. The average station density is one station per 86 km2.
The weather stations that make up the FCA are deployed in a grid placed over the study area (). The network begins at the continental divide, the provincial border between Alberta and British Columbia, traverses the eastern slopes of the Canadian Rocky Mountains and ends in the agricultural prairie lands approximately 50 km east of Calgary, Alberta. The study domain includes alpine terrain, forested slopes, prairie farmland and urban sites in the city of Calgary. Stations are located 5 to 10 km apart along twelve west–east running transects located between 116°21'W and 113°21'W. North–south transect spacing is approximately 10 km, ranging from 51°32'N to 50°18'N. A small high-density cluster of sites is located in the middle of the northern part of the study area, which was originally part of another study and was incorporated into the FCA.
The spatial coverage of the array is approximately 24,000 km2. The area of the FCA grid was selected in order to approximate the size of a global climate model (GCM) grid cell, which allows for comparisons with GCM predictions and analysis of GCM downscaling strategies. The network samples a broad range of elevations, slopes, aspects and surface environments, allowing us to study the mesoscale structure of weather systems and the impacts of terrain variability on surface weather. plots the distribution of FCA sites along with terrain statistics in the study region, based on a 250 m digital elevation model (DEM). Overall the sites represent the terrain well, but they undersample the highest elevations and steepest slopes. FCA site elevation, slope and aspect are, nevertheless, all statistically representative of the regional terrain, based on two-sample Kolmogorov-Smirnov tests, which determine whether two independent samples come from the same population (Wood, Citation2008).
Fig. 2 FCA site distributions (panels on the right) and DEM-derived terrain distributions (panels on the left) in the study region: (a and b) elevation, (c and d) slope, and (e and f) aspect (adapted from Wood (2008) by permission of the author).
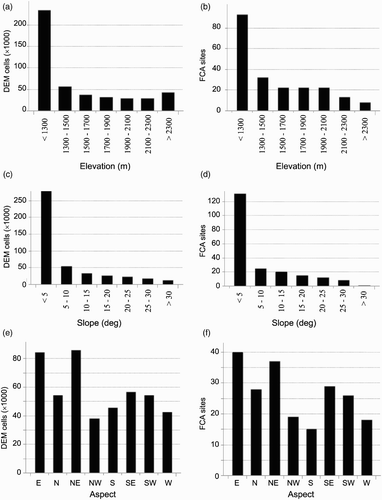
Quality control (QC) of temperature data is discussed further below. Numerous stations failed the initial QC tests and data are currently being examined in more detail to determine whether periods of data can be salvaged. For this study, we exclude any station with suspect data, reducing our total station network to 246 sites for the results presented here. provides information on the distribution of FCA surface environments and elevations for this subset of FCA stations.
Table 1. Meteorological station site distributions. Elevation is in kilometres above sea level.
FCA weather stations are equipped with an automatic tipping bucket rain-gauge and an automatic temperature and humidity logger (). The instruments are manufactured by Onset Scientific Ltd. (Hobo tipping buckets and data loggers) and Veriteq Instruments Inc. (SP-2000 temperature and humidity (T/RH) loggers). The rain-gauges record rainfall in 0.2 mm increments, logging the time of each tipping event. Veriteq T/RH measurements are collected hourly, set to record an instantaneous measurement at the top of each hour. The data logger is encased in a radiation shield manufactured by Onset Scientific Ltd. Below elevations of 2000 m, the Veriteq data loggers are set up at a height of 150 cm above ground and at elevations above 2000 m they are set up from 200–300 cm above ground, to minimize burial by snowfall. Data are collected once or twice per year by manually downloading stored data from the sensors. These data are then processed into daily and monthly average, minimum and maximum temperatures.
Fig. 3 Sample photos of FCA weather stations in the project: a) agricultural region west of Airdrie; b) agricultural region west of Longview; c) agricultural region west of Madden; d) Moose Mountain, Kananaskis Country; e) Mt. Evan Thomas, Kananaskis Country (reproduced from Fargey (Citation2007) by permission of the author).
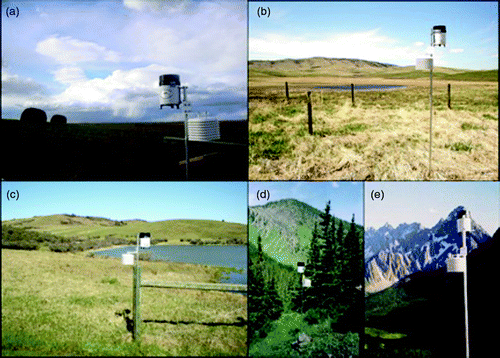
All instruments were calibrated prior to field installation and again when sensors were brought in from the field, through comparison with World Meteorological Organization (WMO) standard temperature measurements at the University of Calgary weather research station, which has been in operation since 1966. Sensors were installed at a height of 2 m for a period of at least two weeks and the average temperature offset was calculated relative to the University of Calgary sensor. Veriteq sensors deployed in the field were within 1°C of the reference sensor and tended to be consistent with each other (within 0.5°C and commonly within 0.2°C). Systematic offsets relative to the reference sensor were recorded to enable a constant bias correction during post-processing of data. On removal from the field for recalibration, approximately 10% of the sensors failed the calibration test, usually overtly (i.e., through unrealistically high temperatures). This breakdown during the study was usually obvious and the time at which sensors failed was caught during QC processing of the data. In general, it is our experience that the sensors either record accurately and faithfully or they fail catastrophically, through circuit board corrosion, so identification of errant data is not difficult.
The FCA study is philosophically different from standard meteorological monitoring stations such as those operated by Environment Canada or other agencies, under the auspices of the WMO. We do not attempt to maintain WMO standards with respect to installation of all sites on flat, grass-covered surfaces with minimum levels of site exposure. Rather, we measure “landscape-scale” meteorological conditions for different slopes, aspects and environments, including some cases of closed forest and urban sites that are in close proximity to asphalt. Our temperature sensors are also in unventilated screens, because our stations are deployed in the backcountry where there is no access to power. This makes it difficult to compare our measurements directly with Environment Canada data, but measurements compare favourably at sites near Environment Canada's Calgary and Banff stations (see Section 4).
There may, nevertheless, be some individual sites that are prone to daytime heating caused by the lack of ventilation in the instrument shelter (e.g., in sheltered, forested environments). Where egregious, this and other site-specific effects will be caught by the QC algorithm, which rejects data that are unreasonable or are poorly correlated with neighbouring sites. To minimize the impact of individual sites that may not be spatially representative, we also aggregated the sites into elevation categories for the regional lapse rate analysis. Overall, however, site-specific variability due to local terrain and environmental influences is of interest, and the FCA has been designed to enable an examination of local-scale processes. To some degree, then, site-specific anomalies have to be accepted as signal rather than aberration; however, caution is required in interpreting regional representativeness.
a Regional Weather Systems
The study region is temperate, continental and relatively arid because of its position on the eastern (lee) slopes of the Rocky Mountains. Precipitation drops off rapidly with distance from the continental divide, declining from values up to 1900 mm on the continental divide (Marshall et al., Citation2011) to a mean annual total of 430 mm in the city of Calgary. This is evidence of the greater degree of Pacific influence along the continental divide and on the western fringe of the FCA. This influence also has an impact on the regional temperature structure.
The weather systems that affect the region are controlled by the position and strength of the polar jet stream, with fluctuations in the position of the jet stream ushering in northerly or southerly air masses. The characteristics of the polar jet and the low-level westerly flow across the region are influenced by the presence of the Rocky Mountains. Continental polar air masses, maritime polar air from the North Pacific and continental tropical air masses from the southwestern United States are common year-round, bringing considerable temperature variability to the region in all seasons. Winter variability is most dramatic, with alternation of northerly (Arctic) and southwesterly (Pacific or subtropical) advection producing a temperature range from about −35°C to +15°C in most winter seasons (December to February, or DJF). Fluctuations of this magnitude commonly occur on time scales of days to weeks.
In addition to these synoptic influences, the lee slopes of the Rockies are subject to frequent chinook winds (Nkemdirim, Citation1986): dry, westerly winds that warm adiabatically as they descend from high elevations along the continental divide. Chinook winds occur in conjunction with strong westerly flow, moist Pacific air that has been warmed extensively through condensation and rainout on windward slopes, and low to moderate pressures on the eastern slopes which permits the westerly airflow to descend to ground level and displace the continental air mass.
There is frequent competition between Arctic and Pacific air masses in the winter. The mountainous terrain adds a level of complexity to this, because cold, dense air masses may pool at low altitudes or create shallow inversions that affect the lowest sites in the FCA but not the high-elevation sites. Northeasterly cold fronts travelling upslope do not always penetrate into British Columbia or to the continental divide, leading to colder temperatures in the interior plains at times when there are often warmer temperatures in the mountains, which remain under a westerly, Pacific influence. This is a common synoptic occurrence in the winter months and is one of the main patterns that we investigate in this paper.
3 Methods
We processed hourly station data for daily mean, minimum and maximum temperatures. Initial QC algorithms were developed to flag and omit suspect data, based on several known problems. Stations are occasionally knocked over by wildlife or cattle; when a sensor is on the ground it records higher-than-normal daily variability, so it is possible to tell when the station fell over. Conversely, stations can also become buried by snow in some years, which is possible to diagnose through muted daily temperature variability, as well as constant 100% relative humidity. Advertised sensor battery life is 10 years, and no batteries have died as yet, but sensor attrition is increasing with time and is usually manifest as unrealistically high temperatures. Inspection of faulty sensors indicates that this is a result of corrosion of the circuit boards, associated with the accumulation of dust and sulphur deposits.
Unreliable data were identified by the QC program based on unrealistic values, unusual daily standard deviations and poor correlation of daily mean values relative to data from the eight nearest neighbouring sites. Data that were retained were compiled into daily, monthly, seasonal and annual means, as well as several other diagnostics relevant to hydrological and ecological applications (e.g., positive degree days, frost days and growing degree days). In this paper, we focus on seasonal and annual means, to provide an initial overview of spatial patterns of temperature in the region. Seasonal means are calculated for each site based on the conventional meteorological seasons (DJF, MAM, JJA and SON). Mean values from a site were retained as long as no more than 10 days were missing from a particular season. We retained annual means when no more than 20 days were missing from the year. We then aggregated all available seasonal and annual data from each site to derive nominal five-year (2005–09) mean values, although means are calculated from fewer years for sites with missing data.
A total of 82% of data was available and retained for the sites discussed in this paper. Some of the omitted data is likely salvageable, but we apply a conservative QC filter in this study, assuming that the dense station coverage provided built-in redundancies that minimized the impact of missing data. Missing data were spatially variable, so there should be no systematic impacts of under-represented regions within the grid. There was some interannual variability from 2005–09; mean annual temperatures varied from 3.9°C to 5.3°C at Calgary Airport (YYC), with a five-year mean of 4.66°C. The final year, 2009, was the coldest of the five years, and there was less data coverage in 2009 in the FCA dataset, introducing a potential warm bias in five-year average temperatures from the FCA. This concern arises with less than 20% of the FCA sites. Moreover, a four-year average (2005–08) from YYC gives a mean temperature of 4.85°C, 0.2°C warmer, which is within our estimated sensor accuracy (0.5°C). Missing months or seasons are more temporally random within the FCA, so we do not believe that interannual variability is a concern in this study.
In Section 5 we explore the specific influences of terrain features such as slope, aspect and vegetation on surface temperature. A multivariate statistical model of monthly temperature patterns was developed, with independent variables selected based on readily estimated parameters that are hypothesized to impact local temperature. Non-trained variables such as slope and aspect are used instead of pure trained variables, such as potential direct radiation, because they provide a more direct test of the influence of regional terrain variables. By using a variable such as potential direct radiation, it would be difficult to isolate the impact of slope, aspect and elevation on surface temperature.
Slope and aspect values that we adopted refer to the general environment of each sensor (i.e., on a scale of hundreds of metres), rather than the local or point data, as we postulate that this is the relevant scale for mesoscale temperature patterns. Aspect is measured relative to north (0°) and for our purposes westerly aspects (180°–360°) were adjusted to range from 0°–180° so that smaller values indicated north-facing terrain and higher values indicated south-facing slopes (Regression Aspect = 360° – measured aspect, β >180°). Flat areas, such as prairie sites or hilltops, were given a value of 90° to indicate neutral north–south influence. This removes any east–west influence from the aspect value and gives a proxy for north–south exposure (Carrega, Citation1995), under the assumption that direct solar radiation is the main influence on temperature on a slope.
Surface environment was incorporated into the regression models through indicator vegetation variables and a simple presence or absence (binary) classification for forest, shrub (low-lying natural vegetation), prairie (grassland and agriculture), urban and alpine (rock) environments. Urban sites are classified as those sites located within Calgary's city limits. A secondary surface classification is also applied to distinguish between mountain and prairie sites, based on a simple dividing line that runs from the northwest to the southeast following an elevation of approximately 1450 m.
These variables account for the structural site type, thus including the combined effects of surface roughness, albedo and surface cover in dictating spatial and temporal patterns of surface temperature. While this is not a physically direct way to incorporate surface environment into the model, other methods require information that is not readily available, such as measurements of surface albedo, surface roughness and percentage cover throughout the year. If available, such information would provide a more detailed look at the impact of surface environment on surface temperature; the categorical groupings here act as simplified but readily attained proxies for these influences.
Classification of chinooks and continental polar air masses is based on Environment Canada daily weather observations from Calgary Airport. We confine the classification and selection of chinook and continental polar days to winter events during the period 2005–09. Chinooks are subjectively identified initially by temperature changes, including an abrupt rise and equally abrupt termination of unseasonably warm temperatures, along with the presence of gusty westerly winds. A secondary identification is based on pressure changes (high to low) and low relative humidity (Nkemdirim, Citation1986). Continental polar air masses are identified as days with average temperatures below −15°C. These are further confirmed by checking hourly pressure readings to ensure there is a high pressure system corresponding to the colder temperatures.
4 Mean seasonal temperature patterns
To provide assurance that the FCA sensors provided an accurate and reliable temperature record, we examined station data in proximity to the two primary Environment Canada stations in our study area, Calgary Airport and Banff. plots daily mean temperatures from Calgary Airport (YYC) and a nearby FCA sensor, FCA0334, which is planted on a grass surface at the Calgary Airport fire hall. The time series plots in are indistinguishable and the two daily temperature records are linearly correlated with a value of r = 0.99. However, there is a 0.5°C warm bias in the FCA record, on average.
Fig. 4 a) Comparison of daily average temperatures from the Environment Canada Calgary Airport station (YYC, black line) and the nearest FCA site, at the Calgary Airport fire station (FCA0334, red line). b) Temperature difference between the sites (T 0334 – T YYC) versus mean daily temperature. Data covers 1651 days from 3 May 2005 to 30 September 2009. The mean offset is +0.49°C.
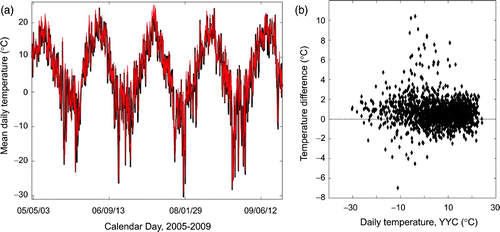
plots the temperature difference between the sites for each day as a function of the daily mean temperature at Environment Canada's Calgary Airport station. The slight warm bias is apparent here, and the plot also reveals that temperatures are occasionally off by several degrees Celsius, either too warm or too cold. Discrepancies of more than 3°C are rare, less than 2% of 1651 days plotted here. We are not sure of the cause of these deviations, but they are likely due to differences in the calculation of mean daily temperature. FCA sensors sample the temperature hourly, and we report a direct average of the 24 daily measurements, whereas Environment Canada reports mean daily temperature as the average of the minimum and maximum daily temperature, rather than a true average.
lists the mean seasonal and mean annual temperatures from the Calgary Environment Canada and FCA sites for 2005–09. Standard deviations in refer to the variability in daily mean temperatures within each season or year, on average, for the five-year record. Environment Canada and FCA results are also given in for Banff, although the comparison is weaker because the most proximal Banff FCA site, FCA0312, is located on a forested slope 245 m higher than the Environment Canada station. Mean seasonal and annual values are within approximately1°C and are slightly cooler at FCA0312, particularly in the spring and autumn. If a standard lapse rate correction (−6.5°C km−1) is applied to this site, FCA0312 would report temperatures from 0.5° to 1°C warmer than the Banff Environment Canada station. This is consistent with the small warm bias found with the Calgary data.
Table 2. Mean seasonal and annual temperatures in the region for 2005–09 (°C). Banff and Calgary are Environment Canada stations, at 1084 m and 1397 m, respectively. Standard deviations refer to the daily mean temperatures in each season. Minimum and maximum temperatures reported are the average (2005–09) of extreme annual minima and maxima. Results are also given for the FCA sites most proximal to the Banff and Calgary Environment Canada sites, FCA0312 (1642 m) and FCA0334 (in the city of Calgary, 1087 m), and for the coldest site in the grid, FCA0313 (Mt. Rundle, Banff National Park, 2910 m).
Variability, as measured by the average standard deviation of mean daily temperatures each season and year, is almost identical in both the Banff and Calgary “matched-pairs” comparison. Statistical tests of both mean temperatures and standard deviations indicate that the FCA sensors are statistically indistinct from the Environment Canada records at these two sites.
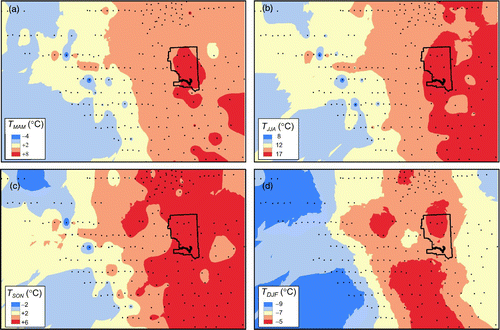
plots the spatial pattern of mean seasonal temperatures in the region. Contours are based on kriging of the temperature surface. There is an east–west gradient in all seasons, reflecting the increase in elevation to the west (). Other, more subtle, spatial patterns emerge, such as an apparent urban heat island effect associated with the city of Calgary. This is present throughout the year but is strongest in the summer, consistent with retention of daytime heating. Winter temperature structure is also interesting, with cooling on the eastern and northeastern flanks of the study region and the warmest temperatures occurring along a north–south band through the middle of the array. This is in opposition to the elevation gradient, but the relief is more subtle in this part of the region, sloping downwards to the east from approximately1050 m in Calgary to less than 900 m on the eastern margin of the array. Cooler winter temperatures to the east could reflect either weaker chinook effects or increased frequency and strength of continental polar air masses. The reverse temperature gradient is seen in spring and summer, indicating the potential role of increased continentality in the open prairie environment, further away from the more Pacific-influenced continental divide.
Fig. 5 Mean seasonal temperature patterns. a) spring (MAM), b) summer (JJA), c) autumn (SON) and d) winter (DJF). City of Calgary is outlined with a thick black line; FCA sites indicated with black dots.
The distribution of temperatures for all sites is plotted in , illustrating the variability of temperature across the FCA in different seasons. Extreme daily minimum and maximum temperatures are also shown in . The skew to warmer temperatures in all but the extreme minimum temperatures ( results from the heavier spatial concentration of low-elevation prairie sites.
Fig. 6 Distribution of daily temperatures at all stations in the FCA grid, 2005–09. Mean temperatures in a) spring (MAM), b) summer (JJA), c) autumn (SON) and d) winter (DJF). Extreme e) minimum and f) maximum daily mean temperatures, averaged over the five years.
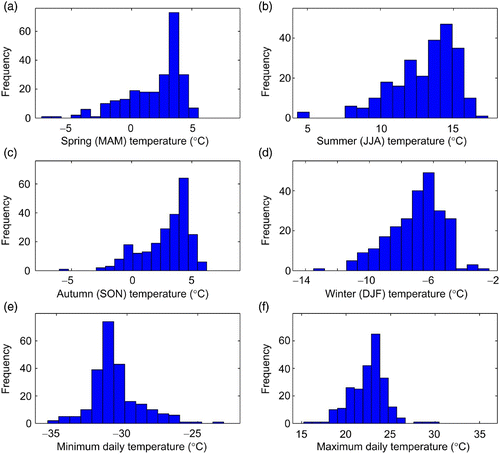
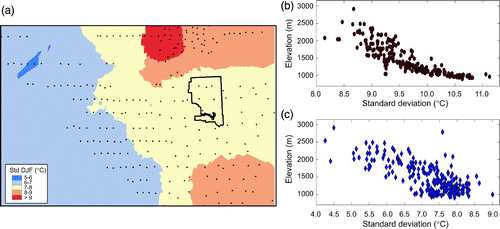
Values in also illustrate the differences in temperature variability in different seasons. Daily temperature variability is lowest in the summer and highest in the winter, with the spatial pattern of winter temperature variability plotted in . Variability is muted in the foothills and mountain section of the study region, again consistent with a less continental regime. This may reflect a reduced influence of continental polar air masses in the western portion of the grid in winter, although this reduced variability is also seen year-round. It is highly correlated with elevation, as seen in and ; higher elevations experience less variability, both annually and in the winter. The latter is a strong signal (with approximately twice as much variability at the low-elevation eastern sites), but there are local exceptions.
Fig. 7 Standard deviation of temperature at all FCA sites. a) Map view of winter temperature variability. b) annual and c) winter (DJF) standard deviation versus elevation. Data are based on daily mean temperatures from 2005–09. City of Calgary is outlined with a thick black line; FCA sites indicated with black dots.
The highest site in the grid, FCA0313, is situated on a steep alpine ridge at an elevation of 2950 m, just below the summit of Mt. Rundle in Banff. It experiences the lowest mean temperatures of all the FCA sites and also exhibits low variability (). This site is subject to high winds and sits above the influence of surface weather patterns, so it resembles a free-air site that is only weakly subject to terrestrial heating and cooling (Pepin and Seidel, Citation2005). Its behaviour is unusual, but we suspect it to be a good proxy for high alpine conditions. Unfortunately, it is the only high mountain-top site with reliable data from the study, so we cannot assess whether it is regionally representative of this environment or elevation.
Mean seasonal and annual lapse rates can be calculated from the data. The large number of stations at low elevation can, however, give a skewed weighting to these sites. We therefore adopt two approaches for calculating lapse rates through a linear regression of station temperature against elevation: (i) fitting all available mean station data and (ii) sorting the data into 100 m elevation bins, then calculating the mean temperatures in each bin. plots the mean annual elevation-temperature relation for these two cases. The slope of the best-fit line through the data is equal to 1/β, for lapse rate β. The mean annual lapse rates from the raw and binned data are −4.2°C km−1 and −4.6°C km−1, respectively.
Fig. 8 Mean annual (a and b) and mean winter (c and d) (DJF) temperature versus elevation for 2005–09. All FCA sites (a and c). Data averaged in 100 m elevation bins (b and d), giving less weight to the large number of low-elevation sites. Linear fits to the data correspond to the linear lapse rates (β) of (with a slope of dz/dT = 1/β in these plots).
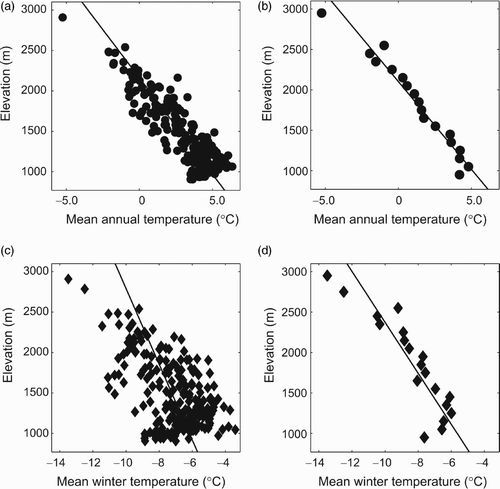
compiles monthly and seasonal lapse rates derived through the two approaches. Lapse rates are steepest in spring and early summer, about −6°C km−1, weakening in fall and winter. This pattern has been reported in previous studies (e.g., Shea et al., Citation2004). There is a large degree of scatter in the winter season, giving weak regression results (low R 2 values). Binning by elevation gives a stronger statistical result and a physically reasonable elevation profile, so the associated winter lapse rate, about −3°C km−1, may provide a good estimate. Inspection of reveals the presence of a persistent winter inversion structure in the region, up to an elevation of about 1400 m, with cooling above 1500 m.
Table 3. Monthly, seasonal and annual near-surface temperature lapse rates (°C km−1) for 2005–09, calculated by linear regression of temperature as a function of elevation for the full set of data and for means of temperature data in 100 m elevation bins.
5 Influences of terrain and surface environment
To examine the influences of terrain and surface cover, we developed multivariate statistical models of monthly mean temperature. Mattie (Citation2009) discusses the methods in greater detail and also develops separate models of daytime and overnight temperatures to examine diurnal variability in lapse rates and surface environmental influences. The analysis in Mattie (2009) is confined to a subset of the data from 2005–07. In this paper, we expand the analysis to the full record, 2005–09, but we restrict the discussion to regression models of mean monthly temperature.
The monthly regression models including elevation as the only independent variable (i.e., conventional lapse rate models) discussed in Section 4 provide a basis for comparison with the multivariate models. The monthly models perform well (high R 2 values and low residuals) from March to November, with poor performance in the winter months. Monthly lapse rates and mean absolute error values, | ε |, for the standard lapse rate model are plotted in (dark grey bars). The average monthly values of R 2 and | ε | for the univariate models are 0.66 and 0.85°C. This improves to means of 0.89 and 0.56°C from April to August.
Fig. 9 Monthly (a) elevation coefficients and (b) mean absolute errors for the univariate or “standard lapse rate” model (temperature as a function of elevation; dark grey bars) and the multivariate regression model (light grey bars).
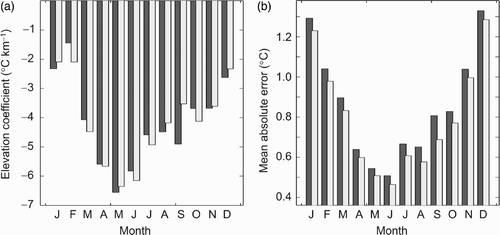
Multivariate models were considered using multiple linear regression for the full suite of terrain and environmental variables characterized at each site. The light grey bars in depict the monthly elevation coefficients and mean absolute residuals. Elevation coefficients in the regression range from −2.1° to −6.2°C km−1. These are significant at the 99% level and are the strongest predictor variable for all months. The average monthly values of the adjusted R 2 and | ε | for the multivariate models are 0.69 and 0.79°C, indicating only a slight improvement from the standard lapse-rate models.
This modest gain in model performance is reflected in the regression coefficients for the other independent variables, which are statistically insignificant (rejected by the multivariate model) in most months. presents the regression coefficients for variables which are statistically significant in some months, along with R 2 values and mean monthly residuals, allowing comparison of models throughout the year. There is good model performance from March to October, consistent with the conventional lapse rate models.
Table 4. Multivariate regression model coefficients and performance (adjusted R 2 and mean absolute error in the modelled monthly temperature at all sites, | ε |). Italicized numbers are significant at the 95% confidence level.
With the exception of urban sites, surface environment variables (alpine, forest, shrub and prairie sites) are not significant predictors. Regression-model coefficients are difficult to compare across months, because independent variables take up different proportions of the variance each month; there are tradeoffs between variables. However, the coefficients can still be interpreted physically. Urban sites are about 1°C warmer, with this influence statistically significant from April to August. This is consistent with other findings that urban areas hold heat during the evening in the summer (Wilby, Citation2003; Bornstein, Citation1968; Tso, Citation1996).
Mountain sites also experience temperature patterns distinct from those in the lower elevation prairie terrain. In most months this variable (mountain or prairie) introduces a cooling effect of 0.5° to 1°C in the regression model, in addition to the temperature structure explained by elevation, slope and aspect. This can be interpreted as a temperature effect that is uniform across elevation within mountain sites. The cooling influence is strongest in August and September. However, this influence is statistically insignificant in most months and is not seasonally consistent (). Mattie (2009) found that the effect is most pronounced on nighttime temperatures in the late summer and fall months; it may be related to cold air pooling in valley bottoms and delayed daytime heating (due to topographic shading) in mountainous terrain.
Slope and aspect are generally insignificant as predictor variables. The influences of both slope and aspect are positive and are stronger (higher coefficients) in the winter months, when the sun angle is low in the study region, increasing the importance of topographic shading and differential solar heating. South-facing slopes have higher aspect values (up to 180°), so a coefficient of 0.008°C deg−1 indicates a warming influence of 1.4°C. At the 95% confidence level, aspect is only significant in September and October. The direct influence of slope on surface temperature is small, at least as characterized here. Slope can nevertheless be expected to play a non-local role in the movement of air in mountainous areas, contributing to cold air drainage and temperature inversions.
In addition to terrain variables, interactions between air masses from different directions determine day-to-day conditions in the region. These influences are not accounted for in the regression models, resulting in spatially autocorrelated residual values. These spatial groupings indicate that there are meteorological processes that the model is not capturing accurately. In the next section we explore the influence of cold air masses and chinook conditions on daily temperature patterns within the study area.
6 Daily weather patterns: Chinooks and cold air masses
Different air masses and weather systems influence our study region, and it is likely that these have a non-uniform impact across the FCA sites. The northeast corner of the study area exhibits colder temperatures than predicted by the models during the winter months (October to March). This region is subject to cold, high-pressure air masses that descend from northern Canada during the winter months, when continental polar air masses are generated as a result of radiative cooling at high latitudes. These air masses are more common in the central Canadian Prairies than in the mountain regions of western Canada; we therefore hypothesize that the eastern stations in the FCA experience these cold air masses more frequently and/or more severely.
Similarly, studies of chinook conditions in southwestern Alberta indicate a complex and non-uniform spatial pattern of chinook frequency and the magnitude of the associated temperature anomaly (Nkemdirim, Citation1996). In particular, chinook effects are expected to be strongest in southern portions of the study region and at the lower elevation foothills and prairie sites, which permit a greater degree of adiabatic warming.
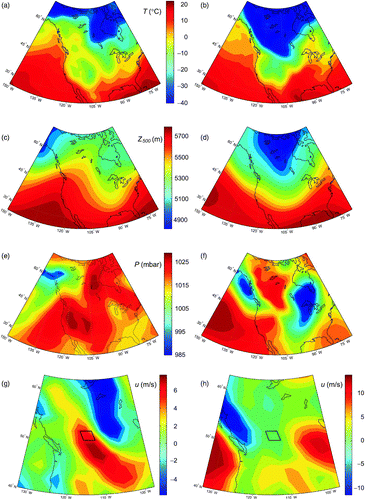
We examine temperature patterns for an ensemble of winter days when chinook or continental polar air masses prevail in the region (see Section 3 for methods). The number of air mass days compiled from 2005–09 for this analysis were 102 chinook days and 102 continental polar days. gives examples of each weather system based on reanalyzed climatology from the National Centers for Environmental Prediction (NCEP; Kalnay et al., Citation1996). These examples are from two of the days selected for our analysis, a chinook event on 13 January 2008 (panels on the left) and a continental polar air mass incursion on 29 January 2008 (panels on the right). Surface temperature, wind and pressure patterns are canonical for these two examples, with anomalous warmth, strong westerly winds and low pressures for the chinook event and cold, calm, high-pressure conditions when the continental polar air mass blanketed the region. and illustrate the typical synoptic set-up that accompanies these weather systems.
Fig. 10 Sample meteorological conditions during prominent chinook (panels on the left) and continental polar air mass (panels on the right) incursions in the study region: air temperature (a and b); 500 mb heights (c and d); surface air pressure (e and f), standardized to sea level; and surface zonal (westerly) wind speed (g and h). All plots are mean daily snapshots, with the chinook event on 13 January 2008 and the cold air mass on 29 January 2008. The insets in (g) and (h) denote the study region (NOAA, Citation2010).
For the ensemble of chinook events, the mean temperature at all FCA sites is 0.0°C, with a between-site standard deviation of 2.6°C. Corresponding values under the influence of continental polar air masses are −16.9° ± 1.4°C. and plot the spatial temperature patterns for the ensemble of chinook and continental polar days. Average temperature anomalies for these days are plotted in and . On chinook days, all sites were warmer than their mean DJF temperatures, with anomalies from 3.1° to 9.3°C. The mean site winter temperature anomaly is 7.1°C. The largest anomalies occur in the eastern part of the study area.
Fig. 11 Composite of chinook (panels on the left) and continental polar (panels on the right) temperature anomalies in the region: (a) mean temperature from 102 winter chinook events for 2005–09; (b) mean temperature from 102 cold air mass incursions for 2005–09; and (c) and (d) plot temperature anomalies relative to the mean winter temperatures. City of Calgary is outlined with a thick black line; FCA sites indicated with black dots.
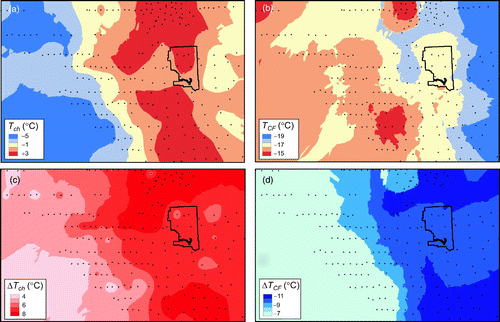
All sites are colder under the influence of continental polar air masses, with mean temperature anomalies from −13.0° to −3.9°C for the ensemble of continental polar days. The average temperature anomaly across all of the FCA sites is −9.8°C. Anomalies are again strongest in the eastern prairie portion of the study area and are muted in the foothills. Hence, both chinooks and continental polar air masses introduce high variability in the eastern part of the region.
Near-surface lapse rates are exceptionally divergent for these two weather systems. plots the ensemble mean temperature versus elevation for each case, for the full set of FCA stations and with sites binned into 100 m elevation bands once again. Chinooks are associated with a steep linear lapse rate, −6° to −8°C km−1, consistent with larger warm anomalies at the low-elevation sites on the eastern portion of the grid. This is steeper than the mean winter lapse rate, indicating that chinook events drive values that more closely resemble free-air rates. A low-level inversion structure is again seen in , however, with maximum chinook-event temperatures at elevations of 1200–1300 m. This indicates a more subtle temperature influence from chinook events, with maximum warming along the transition between the foothills and prairies, through the middle of the study area (. On average, chinooks have less impact on temperature at high elevations, near the continental divide and on the eastern fringe of the study region.
Fig. 12 Mean (composite) temperatures versus elevation for 2005–09 when the region was experiencing chinook (a and b) and continental polar (cP) air mass weather systems (c and d); all FCA sites (a and c); and data averaged for 100 m elevation bins (b and d), giving less weight to the large number of low-elevation sites.
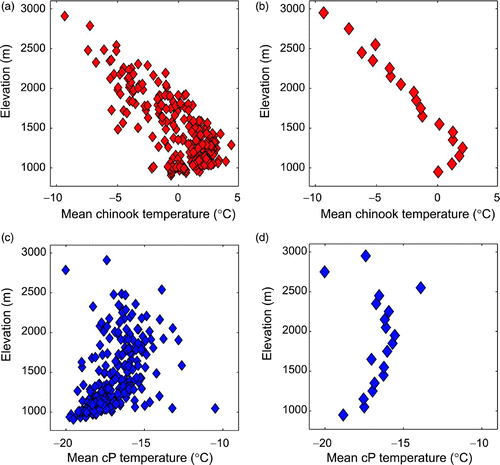
Lapse rates under the influence of cold air masses are in marked contrast to this, with a deep inversion structure and a positive temperature gradient. Linear regressions to the ensemble of continental polar air mass days ( and ) give values of +2° to +8°C km−1, with high scatter and complex spatial temperature patterns (. There is weak statistical significance to the linear fits to the data, but continental polar air masses are clearly attended by an inversion extending to elevations of 2000 m or more, on average. This inversion depth can be expected to vary on different days in the ensemble of continental polar air mass events. It is also clear that these events have their greatest impact in the prairie region on the eastern flanks of the study area and do not always penetrate to higher elevations on the eastern slopes of the Rocky Mountains.
These results are consistent with the contrasting nature of chinook and continental polar air masses. The latter are shallow, dense and stable air masses that are effectively decoupled from the free air above the boundary layer (i.e., the air circulating in the mid-tropospheric Rossby circulation). Pacific air masses that descend in the lee of the mountains, in contrast, are subject to adiabatic warming, resembling the processes governing cooling with altitude (free air lapse rates) in the troposphere.
7 Discussion and conclusions
The three phases to the analysis presented here paint a coherent picture of the patterns and controls of mesoscale temperature variability in the foothills region of southern Alberta. The eastern prairie sites within the study area experience more continental conditions, with a greater influence from continental polar air masses in winter and a greater degree of seasonal and annual temperature variability. The western edge of the study area has several high-elevation sites along or close to the continental divide. Both these sites and transitional sites in the foothills are colder overall but they experience less variability and less frequent influences from continental polar air masses; Pacific air masses are more influential here.
The chinook signal in the region introduces a notable exception to this. Anomalous seasonal warmth associated with chinooks is strongest at intermediate altitudes in the foothills region, with lesser warming along the western and eastern edges of the study area. This pattern explains some of the spatial and altitudinal temperature structure observed in the region in the winter, but it largely opposes the spatial structure induced by continental polar air masses. The average winter temperature patterns are a complex composite that reflects the relative frequency of these two influences, amongst other weather systems.
Near-surface temperature lapse rates constructed from the five years of data for the region indicate considerable temporal and spatial structure. Mean seasonal and annual lapse rates are less steep than typical free-air (environmental) values of −6.5°C km−1, particularly in winter months. Values in , from −2° to −6°C km−1, steepening in the summer, are regionally representative, with a mean annual value of about −4.4°C km−1. Winter temperature inversions contribute to weaker lapse rates and reduced significance of the linear regressions in winter models (Walker, Citation1961).
In addition to the broad seasonal lapse rate patterns identified here, there is evidence of local inversions and a shallow regional-scale inversion (a few hundred metres in depth) in the average winter temperature structure. Shallow temperature inversions lead to a non-linear structure (, with warming with elevation switching to cooling with elevation at some height above the surface (the inversion depth). Only linear regressions are considered in the models presented here, so this effect cannot be captured unless the depth of the inversion exceeds the elevation range of the FCA sites, such that all sites experience the inversion. The models presented here are based on monthly or seasonal averages, and they attempt to fit a blend of inversion and non-inversion regional temperature structures. We recommend that a piecewise linear model be adopted for average winter lapse rates.
We also recommend the lapse rates that are calculated from the reduced dataset, where stations are stacked in 100 m elevation intervals. This reduces the station density bias that otherwise results from having a higher concentration of low-altitude sites. However, this also smooths over potentially interesting local variability. Our results are sensitive to the accuracy of the relatively sparse number of high-elevation sites; problems with these data or non-representativeness of the high-elevation sites (e.g., south-facing slopes) could skew the lapse rate estimates.
For climatological purposes and many applications (e.g., ecological, agricultural or glaciological modelling), mean monthly or seasonal lapse rates may provide an adequate representation of temperature patterns, provided that data are available to constrain near-surface lapse rates and the application of free-air rates is avoided. Monthly or seasonal values would capture the marked seasonal cycle in near-surface lapse rates, which is also well-documented in other studies (e.g., Pepin and Losleben, Citation2002; Blandford et al., Citation2008). Steeper daytime and summer lapse rates are a result of strong radiative heating, in contrast to frequent low-level temperature inversions that occur overnight and in the winter.
For some applications (e.g., hydrological runoff and flood forecasting or operational weather forecasts) daily-varying lapse rates, as a function of synoptic conditions, would be advantageous. There are also predictable air mass (weather system) influences on the effective lapse rate. Adiabatic warming during chinooks produces a difference in temperature that is greater than expected because of elevation changes. As a result, lapse rates are anomalously strong during chinook conditions. In contrast, continental polar air masses produce what could be described as a systematic, regional-scale “inversion” in the study area, with warmer conditions at the mountain and foothills sites relative to the eastern prairie region.
A careful assessment of how to model daily lapse rates requires further study. If possible, daily lapse rates that are a function of the prevailing synoptic weather system would give the best representation of the altitudinal temperature structure in the region. We recommend that such an assessment include comparison with numerical weather forecast model output to examine the relationship between observed near-surface and regional free-air temperature patterns. Reanalysis-driven regional or mesoscale meteorological modelling for an ensemble of days with chinook and continental polar air mass conditions would help to interpret the observations presented here.
Terrain characteristics explored in the multivariate regression models indicate that various seasonal patterns exist for the influence of different terrain and surface variables on temperature. Other than elevation, no single variable was significant in all seasons. All of the models were more accurate in the summer months. Examination of residuals in the regressions (not presented here) reveals spatial autocorrelation (clustering of positive and negative residuals), indicating an influence of meteorological processes that are not accounted for in the multivariate model. We believe that these are associated with the different temperature patterns in the region that arise as a function of different synoptic-scale weather systems. Exploration of daily temperature structures under the influence of chinook and continental polar air masses confirms this; it is likely that monthly and seasonal generalizations are difficult as a result of contrasting day-to-day patterns.
The multivariate regression model gives a method of mesoscale temperature “modelling” that offers improvements on temperature extrapolation based on a standard free-air lapse rate (Mattie, 2009). However, there is negligible improvement compared with temperature models that use an FCA-derived monthly or seasonal lapse rate. Independent variables other than elevation offer little or no additional predictive skill for the terrain characterizations explored here. Rather, the generalized terrain variables in our study add complexity with little gain. It is possible that alternative variables or more direct temperature influences, such as potential solar radiation and surface albedo, would provide improvements. Our treatment of slope and aspect are simplistic, and we also do not consider important terrain characteristics such as exposure or convexity (see, for example, Carrega, Citation1995). This warrants further investigation.
Our findings are specific to the study area, although the seasonal structure and magnitude of near-surface lapse rates may be generally representative of the regional-scale structure in other mid-latitude mountain environments. The methods used to obtain the regional lapse rates are transferable to other study areas. The importance of synoptic conditions on the near-surface temperature structure has been identified in other studies (Blandford et al., Citation2008), but the influence of synoptic conditions can be expected to differ regionally as a function of the landscape and the prevailing weather systems. This is especially true in mountainous terrain.
Numerous smaller scale local and regional processes of interest are apparent in the scatter of the data. We have smoothed and neglected these by agglomerating the sites into average temperatures in each elevation band. Future studies will examine some of this smaller scale structure in more detail. For instance, a focused study of the local energy balance and temperature cycles for subsets of the data within the mountainous region is recommended to examine the effects of cold air drainage and ponding.
We also anticipate that different surface conditions in the prairie region (e.g., cultivated field, grassland or forest) give rise to subtle variations that are deterministic but require more detailed analysis to extract from the data. The urban heat island signature should also be investigated further, along with other features of the urban climatology as recorded within the FCA (e.g., precipitation patterns and frequency).
Acknowledgements
The Foothills Climate Array was enabled through funding from the Canadian Foundation for Innovation (CFI), Alberta Science and Research and Investments Project (ASRIP) and the University of Calgary. We thank Shannon Fargey, Terri Whitehead, Rick Smith, and a host of summer students for their help in establishing and maintaining the array. Eric White developed quality-control algorithms for initial data processing. Ongoing operational support is provided by the Natural Sciences and Engineering Research Council (NSERC) of Canada. Parks Canada and Alberta Sustainable Research Development kindly allowed us to set up stations on federal and provincial lands. We acknowledge the help of two anonymous reviewers, whose insightful and constructive suggestions greatly improved this manuscript.
Related Research Data
References
- ANGOT , A. 1892 . Sur la décroissance de la température de l'air avec la hauteur . C. R. Acad. Sci , 115 : 1272 – 1273 .
- BARRY , R. G. 2008 . Mountain Weather and Climate , 3 , Cambridge, , UK : Cambridge University Press .
- BLANDFORD , T. R. , HUMES , K. S. , HARSHBURGER , B. J. , MOORE , B. C. and WALDEN , V. P. 2008 . Seasonal and synoptic variations in near-surface air temperature lapse rates in a mountainous basin . J. Appl. Meteorol. Climatol , 47 : 249 – 261 .
- BOLSTAD , P. V. , SWIFT , L. , COLLINS , F. and R'EGINIERE , R. F. 1998 . Measured and predicted air temperatures at basin to regional scales in the southern Appalachian Mountains . Agr. Forest. Meteorol , 91 : 161 – 176 .
- BORNSTEIN , R. D. 1968 . Observations of the urban heat island effect in New York City . J. Appl. Meteorol , 7 : 575 – 582 .
- CARREGA , P. 1995 . A method for the reconstruction of mountain air temperatures with automatic cartographic applications . Theor. Appl. Climatol , 52 : 69 – 84 .
- DODSON , R. and MARKS , D. 1997 . Daily air temperature interpolated at high spatial resolution over a large mountainous region . Climate Res , 8 : 1 – 20 .
- Fargey, S. 2007. Spatial evaluation of rain events and growing season rainfall patterns in southwestern Alberta, 2005–2006 (Unpublished master's thesis). University of Calgary, Alberta.
- HUMLUM , O. and CHRISTIANSEN , H. H. 1998 . Mountain climate and periglacial phenomena in the Faroe Islands, SE North Atlantic Ocean . Permafrost. Periglac , 9 : 189 – 211 .
- JOLY , D. , NIELSEN , L. , FURY , R. , ELVEBAKK , A. and BROSSARD , T. 2003 . Temperature interpolation at a large scale; test on a small area in Svalbard . Int. J. Climatol , 23 : 1637 – 1654 .
- Kalnay , E. , Kanamitsu , M. , Kistler , R. , Collins , W. , Deaven , D. , Gandin , L. , Iredell , M. , Saha , S. , White , G. , Woollen , J. , Zhu , Y. , Leetmaa , A. , Reynolds , B. , Chelliah , M. , Ebisuzaki , W. , Higgins , W. , Janowiak , J. , Mo , K. C. , Ropelewski , C. , Wang , J. , Jenne , R. and Jospeh , D. 1996 . The NCEP/NCAR 40-year reanalysis project . Bull. Am. Meteorol. Soc , 77 : 437 – 470 .
- LEGATES , D. R. and WILLMOTT , C. J. 1990 . Mean seasonal and spatial variability in global surface air temperature . Theor. Appl. Climatol , 41 : 11 – 21 .
- MARSHALL , S. J. , SHARP , M. J. , BURGESS , D. O. and ANSLOW , F. S. 2007 . Near-surface-temperature lapse rates on the Prince of Wales Icefield, Ellesmere Island, Canada: Implications for regional downscaling of temperature . Int. J. Climatol , 27 ( 3 ) : 385 – 402 .
- MARSHALL , S. J. , WHITE , E. C. , DEMUTH , M. N. , BLOCH , T. , WHEAT , R. , MENOUNOS , B. , BEEDLE , M. and SHEA , J. M. 2011 . Glacier water resources and impacts of glacier decline in the eastern slopes of the Canadian Rockies . Can. Water Resour. J , 36 ( 2 ) doi:10.4296/cwrj3602823
- Mattie, R.M. 2009. Surface temperature as a function of terrain variables in the Rocky Mountain and Foothills region of southern Alberta. (Unpublished master's thesis). University of Calgary, Alberta
- MCCUTCHAN , M. H. and FOX , D. G. 1986 . Effect of elevation and aspect on wind, temperature, and humidity . J. Clim. Appl. Meteorol , 25 : 1996 – 2013 .
- NKEMDIRIM , L. C. 1986 . Chinooks in southern Alberta: Some distinguishing nocturnal features . J. Climatol , 6 : 593 – 603 .
- NKEMDIRIM , L. C. 1996 . Canada's chinook belt . Int. J. Climatol , 16 : 441 – 462 .
- NOAA (National Oceanic and Atmospheric Administration). 2010. NCEP/NCAR Reanalysis [Data file]. Retrieved from http://www.esrl.noaa.gov/psd/data/gridded/data.ncep.reanalysis.html
- PEPIN , N. , BENHAM , D. and TAYLOR , K. 1999 . Modeling lapse rates in the maritime uplands of northern England: Implications for climate change . Arct. Antarct. Alp. Res , 31 : 151 – 164 .
- PEPIN , N. and LOSLEBEN , M. 2002 . Climate change in the Colorado Rocky Mountains: free air versus surface temperature trends . Int. J. Climatol , 22 : 311 – 329 .
- PEPIN , N. C. and SEIDEL , D. J. 2005 . A global comparison of surface and free-air temperatures at high elevations . J. Geophys. Res , 110 D03104, doi:10.1029/2004JD005047
- PEPIN , N. and KIDD , D. 2006 . Spatial temperature variation in the Eastern Pyrenees . Weather , 61 ( 11 ) : 300 – 310 .
- ROLLAND , C. 2002 . Spatial and seasonal variations of air temperature lapse rates in Alpine regions . J. Climate , 16 : 1032 – 1046 .
- SHEA , J. M. , MARSHALL , S. J. and LIVINGSTON , J. M. 2004 . Glacier distributions and climate in the Canadian Rockies . Arct. Antarct. Alp. Res , 36 ( 2 ) : 272 – 279 .
- TROMBOTTO , D. , BUK , E. and HERNANDEZ , J. 1997 . Monitoring of mountain permafrost in the Central Andes, Cordon del Plata, Mendoza, Argentina . Permafrost. Periglac , 8 : 123 – 129 .
- TSO , C. P. 1996 . A survey of urban heat island studies in two tropical cities . Atmos. Environ , 30 ( 3 ) : 507 – 519 .
- WALKER , E. R. 1961 . A synoptic climatology for parts of the western cordillera , (Publication in Meteorology No. 35). Montreal. QC: Arctic Meteorology Research Group, McGill University
- WALLAND , D. J. and SIMMONDS , I. 1996 . Sub-grid scale topography and the simulation of northern hemisphere snow cover . Int. J. Climatol , 16 : 961 – 982 .
- WILBY , R. L. 2003 . Past and projected trends in London's urban heat island . Weather , 58 ( 7 ) : 251 – 260 .
- Wood, W. 2008. Modelling mean monthly temperatures in southwestern Alberta using multiple regression, focusing on the contribution of potential solar radiation. (Unpublished master's thesis). University of Calgary, Alberta.