Abstract
The advent of satellite remote sensing has led to new ways of monitoring and studying the near-surface ocean circulation, but its use has often been limited to the deep ocean. Here we present and validate a method of reconstructing the near-surface currents from multi-sensor satellite data off Atlantic Canada with a resolution of 0.25°, for the period from October 1992 to September 2006. The reconstructed ocean circulation consists of a superposition of 1) depth-variable wind-induced Ekman currents and surface wave-induced Stokes drift calculated from scatterometer-measured wind velocities using a theoretical formulation; 2) depth-invariant geostrophic surface current anomalies calculated from altimetric sea surface height anomalies; and 3) mean currents that are a combination of model-simulated currents for the Newfoundland and southern Labrador Shelves and satellite-observed currents for the rest of the study region. The method features two novel aspects: the integration of simulated and satellite-observed mean circulation fields, and the consideration of the surface wave-induced Stokes drift. Individual weekly-mean composite current fields show considerable temporal variation and spatial structure. Inclusion of the numerically simulated mean circulation field leads to better agreement between the composite currents and buoy-observed currents at 15 m depth, compared to using the satellite-derived mean current field alone. There is also fair agreement between the composite currents and instantaneous currents observed at various depths by shipboard acoustic Doppler current profiler (ADCP) data, with a correlation coefficient of 0.59 (a 95% confidence interval of 0.49–0.68) and a vector difference ratio of 0.61. The 15 m depth composite currents agree better with buoy-observed currents than a similar near-surface current product with coarser horizontal resolution. At the sea surface, composite currents calculated with Stokes drift have a mean speed of 0.35 m s−1, similar to currents observed by drifters (0.36 m s−1), but exclusion of the Stokes drift leads to an underestimation of the current speed. The present study demonstrates that an appropriate integration of multi-sensor satellite data can provide approximate near-surface current information and could be used for routine monitoring of the shelf circulation at synoptic scales, complementing in situ observations and numerical ocean modelling.
RÉSUMÉ [Traduit par la rédaction] La télédétection par satellite a fourni de nouveaux moyens de surveiller et d’étudier la circulation océanique près de la surface, mais son emploi a souvent été limité à l'océan profond. Ici, nous présentons et validons une méthode de reconstruction des courants près de la surface à partir des données de satellites multicapteurs au large du Canada atlantique avec une résolution 0.25° pour la période allant d'octobre 1992 à septembre 2006. La circulation océanique reconstruite consiste en une superposition 1) de courants d'Ekman de profondeur variable produits par le vent et de dérive de Stokes en surface due aux vagues calculée d'après des vitesses de vent mesurées par diffusomètre à l'aide d'une formulation théorique; 2) d'anomalies de courant géostrophique de surface de profondeur invariante calculées d'après les anomalies de hauteur altimétrique de la surface de la mer; et 3) de courants moyens qui sont une combinaison de courants simulés par modèle pour les plates-formes continentales de Terre-Neuve et du sud du Labrador et de courants observés par satellite pour le reste de la région à l’étude. La méthode employée fait intervenir deux aspects nouveaux : l'intégration de champs de circulation moyenne simulés et observés par satellite et la prise en compte de la dérive de Stokes en surface sous l'effet des vagues. Les différents champs de courants composites moyennés sur une semaine montrent une variation temporelle et une structure spatiale considérables. L'inclusion du champ de circulation moyenne numériquement simulé permet d'obtenir un meilleur accord entre les courants composites et les courants observés par bouées à une profondeur de 15 m que lorsqu'on utilise seulement le champ de courants moyens dérivé par satellite. Il y a aussi un assez bon accord entre les courants composites et les courants instantanés observés à diverses profondeurs selon les données de profileurs de courant acoustiques à effet Doppler (ADCP) embarqués, avec un coefficient de corrélation de 0.59 (un intervalle de confiance de 95% pour 0.49–0.68) et un rapport de différence vectorielle de 0.61. Les courants composites à 15 m s'accordent mieux avec les courants observés par bouées qu'un courant similaire près de la surface produit avec une résolution horizontale plus grossière. À la surface de la mer, les courants composites calculés avec la dérive de Stokes ont une vitesse moyenne de 0.35 m s−1, ce qui est très proche de celle des courants observés par bouées dérivantes (0.36 m s−1), mais l'exclusion de la dérive de Stokes mène à une sous-estimation de la vitesse des courants. La présente étude montre qu'une intégration appropriée des données de satellites multicapteurs peut fournir une information approximative sur les courants près de la surface et pourrait être utilisée pour la surveillance régulière de la circulation sur les plates-formes continentales aux échelles synoptiques et ainsi compléter les observations in situ et la modélisation numérique de l'océan.
1 Introduction
The circulation of the northwest Atlantic Ocean is of interest for various scientific and socio-economic reasons, such as the potential impact of deep water formation (in the Labrador Sea) on global climate and the adverse effect of storm waves and icebergs on marine operations. The large-scale currents that influence this region are the equatorward Labrador Current, which carries relatively cold and fresh water of Arctic origin, and the poleward Gulf Stream and North Atlantic Current, which carries relatively warm, saline water. The Gulf Stream/North Atlantic Current often forms meanders which, when pinched off to form rings, can facilitate exchange between the shelf and deep waters. Regionally, the wind stress field drives currents in the upper Ekman layer and associated responses (generally coastal upwelling resulting from southwesterly winds in summer and downwelling resulting from northwesterly winds in winter).
Past studies of the circulation in this region have generally focused on establishing the long-term mean and monthly or seasonal climatological patterns, or have examined interannual variabilities. Fratantoni and Pickart (Citation2007) used historical hydrographic data to describe the spatial evolution of the summertime shelf-break front (and its associated current system) from Greenland to the Middle Atlantic Bight and identified the Tail (southern end) of the Grand Banks as an important location in this spatial evolution. Numerical studies of the circulation in this region have included simulation by finite-difference (e.g., Tang et al., Citation2007) and finite-element (e.g., Han & Loder, Citation2003; Han et al., Citation2008) models. Perrie, Tang, Hu, and DeTracy (Citation2003) and Tang et al. (Citation2007) coupled wave models to ocean circulation models of the Newfoundland and Labrador Shelf, and found the effects of surface waves on surface currents and drifter trajectories to be significant. The advantage of such models, compared to a method such as ours, is that the models can account for the different processes involved in the interaction between winds, waves and currents (input of wind energy to waves, energy transfer between waves, and the distribution of dissipated energy among currents, wave breaking, etc.). Han et al. (Citation2008) provided a detailed description of the climatological monthly mean circulation fields over the Labrador and Newfoundland Shelves, especially the spatial and temporal variations of the Labrador Current.
Based on studies so far, it is evident that extensive temporal and spatial coverage of ocean observations in this region is crucial, whether the observations are to be used to characterize the circulation or to validate the results of numerical circulation models. Various observation methods have their advantages and disadvantages. Hydrographic observations are relatively abundant (e.g., Fratantoni & Pickart, Citation2007), but using the geostrophic method to calculate current speeds from them requires the assumption of a level of no motion, when in fact deep currents can be of significant strength in this region (Han et al., Citation2008). Current meters and Lagrangian methods (e.g., satellite-tracked drifters) provide absolute current speeds, but their spatial coverage is limited.
In the past few decades, the emergence of remote sensing has resulted in new ways to study the ocean. For example, sea surface heights derived from satellite-based radar altimeter measurements can be used as “levels of known motion” to calculate absolute current speeds from hydrographic measurements (Han, Citation2004; Han & Tang, Citation1999, Citation2001). Another advantage of satellite measurements is that they are synoptic and available on regular, relatively fine (O(days)) time intervals. For example, Bonjean and Lagerloef (Citation2002) developed a diagnostic model of near-surface circulation that uses satellite-observed sea level, winds and sea surface temperature; Lagerloef, Mitchum, Lukas, and Niiler (Citation1999) estimated surface currents in the tropical Pacific Ocean using satellite-observed sea level and wind stress, and Niiler, Maximenko, and McWilliams (Citation2003) calculated the global distribution of time-mean absolute sea level using data from satellite altimetry and drifters, and wind-driven currents calculated from reanalysis winds. However, global model products have often been found to be less accurate in coastal and shelf regions (e.g., off Canada's Pacific (Foreman, Crawford, Cherniawsky, & Galbraith, Citation2008) and Atlantic coasts (Han, Citation2011)).
In this study, we estimate the near-surface ocean circulation over the northwest Atlantic Ocean using satellite observations. The ocean circulation fields presented here include wind-driven currents calculated from wind velocities measured by satellite scatterometers and geostrophic current anomalies derived from satellite altimetry-derived sea surface height anomalies. The long-term mean circulation pattern is derived from satellite observations and a numerical simulation. Such “composite” circulation fields can be generated rapidly and provide an indication of the relative importance of various processes in the circulation for a given time and location. The wind-driven currents and the numerically simulated component of the mean field have a depth-dependence. In addition, the algorithm for calculating the wind-driven currents (Weber, Citation1983) enables separate calculations of wind-induced Ekman currents and the wave-induced Stokes drift. The near-surface circulation fields have been generated for the period from October 1992 to September 2006 on a 0.25° resolution grid that spans 60°W to 40°W in longitude and 35°N to 66°N in latitude (). Composite current velocities will be compared to observed current velocities (from buoys, Acoustic Doppler Current Profilers (ADCPs), and surface drifters), and to a diagnosed near-surface current product. The method of calculating the composite currents is described in the next section, followed by comparisons of the composite currents with observations in Section 3. Our results are summarized in Section 4.
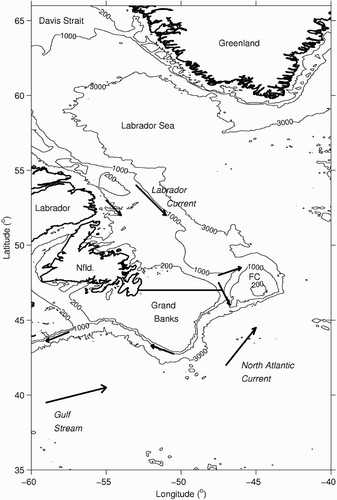
Fig. 1 Map of the area over which the composite currents were calculated. The Flemish Cap transect is shown with a thick line. Major currents are also shown schematically. Abbreviations are Nfld. = Newfoundland and FC = Flemish Cap. The depth contours are for the 200, 1000 and 3000 m depths.
2 Methodology
The composite near-surface currents consist of three components: 1) geostrophic current anomalies calculated from satellite-observed sea surface height anomalies, 2) mean currents derived from satellite observations and a numerical simulation, and 3) wind-driven currents (Ekman and Stokes drifts) calculated from satellite-observed winds. Note that while the third component and the numerically simulated part of the second component are depth-variable, the first component is depth-invariant.
a Altimetric Sea Surface Height and Geostrophic Current Anomalies
We use weekly sea surface height data, which are available for the period 1992–2006 and maintained by the organization for Archiving, Validation, and Interpretation of Satellite Oceanographic data (Aviso). The sea surface height dataset is a merged product of observations from various satellite missions (TOPEX/Poseidon, Jason-1, European Remote-Sensing Satellite (ERS)-1 and -2, Geosat-Follow-On and Envisat) objectively mapped onto a 0.25° Mercator projection grid (Ducet, Le Traon, & Reverdin, Citation2000). All standard corrections have been made to account for atmospheric (wet troposphere, dry troposphere and ionosphere delays) and oceanographic (electromagnetic bias, ocean, load, solid Earth and pole tides) effects. The mean sea surface topography for the period 1992–2006 was removed from the sea surface height to produce sea surface height anomalies. There are three weeks (centred on 11 October 2000, 30 January 2002 and 29 October 2003) when the height anomalies are not available and assumed to be zero.
Surface current anomalies are calculated from the sea surface height anomalies h using the geostrophic relationship:
b Mean Currents
Currents calculated from the sea surface height anomalies described in Section 2a are themselves anomalies, and thus there is a need to specify the mean circulation field. Here we use a combination of two approaches: a mean circulation field derived from satellite-observed sea surface height and a combination of the satellite-derived circulation field and a numerically simulated mean circulation field. Satellite-derived mean currents, although only available for the surface, can be more accurate in areas where the circulation features are difficult to simulate accurately, for example, the Gulf Stream meanders and pinched-off eddies. On the other hand, numerically simulated mean surface currents have been shown to be more accurate than satellite-based ones off Atlantic Canada (Han, Citation2011) and Pacific Canada (Foreman et al., Citation2008) and have the advantage of being able to account for the vertical variation of the mean current.
1 Satellite-based mean surface currents
This set of mean currents is derived from a satellite-based mean dynamic topography using the geostrophic relationship in Eq. (1). The mean dynamic topography is defined as the mean sea surface topography caused by ocean circulation and, therefore, can be obtained by subtracting the marine geoid from the satellite mean sea surface topography. In the present paper, it is constructed as the difference between the mean sea surface topography of Knudsen, Vest, and Andersen (Citation2004) and the Earth Gravitational Model (EGM) 2008 geoid of Pavlis et al. (personal communication, 2008) on a 0.5° grid. The mean sea surface topography of Knudsen et al. (Citation2004) was constructed from TOPEX/Poseidon, ERS-1, ERS-2 and Jason-1, Envisat, Geosat and Geosat-Follow-On data spanning 12 years (1993–2004). The EGM2008 geoid used up-to-date Gravity Recovery and Climate Experiment (GRACE) data, in combination with other satellite and in situ gravity observations.
2 Numerically simulated mean currents
We use a finite-element ocean circulation model (Han et al., Citation2008) to compute ocean currents under buoyancy and tidal forcings. The model domain covers the southern Labrador Shelf, the Newfoundland Shelf and adjacent deep oceans (b). The model's horizontal grid is a linear triangular mesh of variably spaced nodes. The grid resolution is higher over areas of shallow water or steep topography, with a typical nodal spacing of 5 km over the shelf and 1 km over the shelf edge. The vertical grid has 21 variably spaced nodes, with a minimum spacing of 1 m near the sea surface and near the seabed, and adjusts to track the movement of the sea surface during the model simulations. The model uses topography for the shelf compiled by the Canadian Hydrographic Service (with approximately 7 km resolution) and topography for deep oceans from the Earth Topography 5-arc-minute (ETOPO5) dataset.
Fig. 2 Long-term mean surface currents: a) satellite-derived; b) numerically simulated (z = −0.6 m); c) combination of the satellite-derived and numerically simulated fields; d) combination of the currents shown in c) and the long-term mean of wind-driven currents (z = 0 m). In this and subsequent plots, the current vectors are shown at every other location (i.e., at 0.5° resolution).
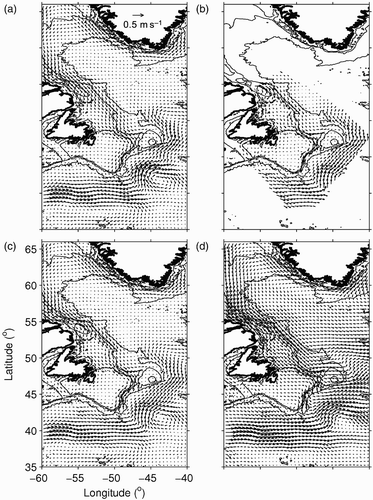
The model is initialized with monthly-mean temperature and salinity fields interpolated from the gridded monthly-mean climatology of Geshelin, Sheng, and Greatbatch (Citation1999), which was objectively analyzed from a historical hydrographic database for the northwest Atlantic Ocean. The monthly-mean temperature and salinity are prescribed along the model's open boundaries. Sea level is also specified along the open boundary, consisting of three components: (1) steric height calculated from the temperature and salinity climatology with the assumption of zero normal velocity at the sea bottom; (2) wind-driven sea level interpolated from a wind-driven barotropic circulation model of the North Atlantic (Han, Citation2005); and (3) sea level geostrophically associated with the additional volume transport to match (in an ad hoc way) observed estimates of the Labrador Current transport (specified only on the northern boundary across the Labrador Slope). Twelve monthly mean solutions are produced, which have been extensively validated against tide-gauge data, moored current measurements, vessel-mounted ADCP data, and satellite-tracked drifter observations (Han et al., Citation2008). The monthly currents at each node are averaged in time to produce the simulated currents used in this study.
3 Blending of the satellite- and model-derived mean currents
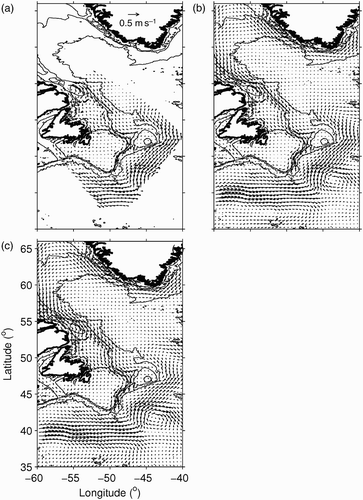
a and 2b show, respectively, the satellite-derived and numerically simulated mean circulation fields at the surface, both linearly interpolated to the 0.25° grid. (The simulated currents are shown at 0.6 m depth, which is the shallowest depth for which model output is available at all wet points.) c shows the result of blending the two fields using one iteration of the Barnes' algorithm (Barnes, Citation1964) with a radius of influence of 0.3°. A prominent feature of the satellite-derived field (a) is the current that starts as the East Greenland Current, turns anticyclonically around the southern tip of Greenland and turns cyclonically in the Labrador Sea where it is joined by the southward flow through Davis Strait to form the Labrador Current, which flows equatorward off Labrador and Newfoundland. The Gulf Stream/North Atlantic Current is visible as an eastward/northeastward current that flows offshore of the Scotian Shelf and the Grand Banks, then turns east towards deeper waters. Differences between the satellite-derived circulation fields and the numerically simulated currents (b) are most prominent over the continental shelf and slope off Newfoundland and Labrador, with the simulated currents being generally weaker over the shelf and with a shelf-break current that is narrower and follows the topography more closely. These features of the simulated current field are retained in the blended field (c). When the temporal mean of wind-driven currents is superimposed (d), the magnitude of the currents increases but the general pattern of the currents is generally unchanged. When b to 2d are repeated at 15 m depth (), the simulated currents are very similar to those at the surface, with the difference in speed being only O(0.01 m s−1) (a). In contrast, the temporal mean of wind-driven currents is weaker by O(0.1 m s−1) compared to the surface (c).
Fig. 3 Similar to to 2d, but for 15 m depth.
c Wind-Driven Currents
To calculate wind-driven currents, we use wind velocity products that combine measurements from two to six satellites, made available by the US National Climatic Data Center (Zhang, Bates, & Reynolds, Citation2006). These products provide wind velocities at 10 m above sea level on a global 0.25° grid and at various temporal resolutions from July 1987 to the present. We use products with a temporal resolution of six hours (the highest resolution available). Locations with less than five days' worth of data in a given week are treated as having no data for that week.
We use the algorithm for wind-driven currents from the theoretical study of Weber (Citation1983), which calculates wind-induced Ekman drift and wave-induced Stokes drift. The significance of the former and latter component in the surface currents over the Grand Banks was clearly demonstrated by Han (Citation2005) and Tang et al. (Citation2007), respectively. In this algorithm, the eddy viscosity ν is assumed to be proportional to the surface friction velocity u * and a characteristic depth H:
The friction velocity is defined as
If the winds are eastward, the wind-induced Ekman current WE is
The wave-induced flow WW is:
Here, ζ is the wave amplitude, calculated from the wavelength assuming a wave steepness of 0.055; σ is the frequency, which is (gk)1/2 using the deep water approximation, and γ is (σ/2ν)1/2.
3 Results and validation
a Comparison with Satellite-Tracked Drifter Data
We examine first the weekly mean near-surface (15 m depth) composite currents and their components, taking as examples the weeks centred on 2 and 16 October 2002. The composite currents, and the geostrophic current anomalies and wind-driven currents that contribute to them, are shown in and . (The mean circulation field is the combination of satellite-derived and numerically simulated fields shown in b). To evaluate the validity of the composite currents, we also show, in and , observed currents derived from satellite-tracked drifter buoys drogued at the 15 m depth, maintained by Fisheries and Oceans Canada's Integrated Science Data Management (Hansen & Poulain, Citation1996). The positions of these buoys were used to construct time series of current velocity, which were then low-pass filtered to remove variability at time scales less than 10 hours (Han et al., Citation2008). Here, the 12-hourly buoy-based current velocities are binned by week and averaged over 0.5° × 0.5° boxes. The resulting current velocities are shown at the centres of their respective 0.5° × 0.5° boxes in and .
Fig. 4 a) Weekly mean composite 15 m depth currents (black arrows) and buoy-derived observed currents (red arrows); b) altimetry-derived geostrophic currents; c) wind-driven currents, and d) the Ekman component of c), for the week centred on 2 October 2002.
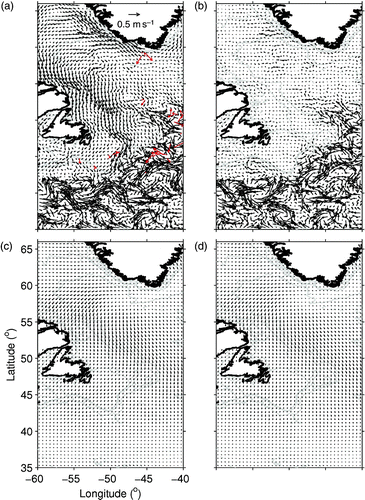
Fig. 5 Similar to , but for the week centred on 16 October 2002.
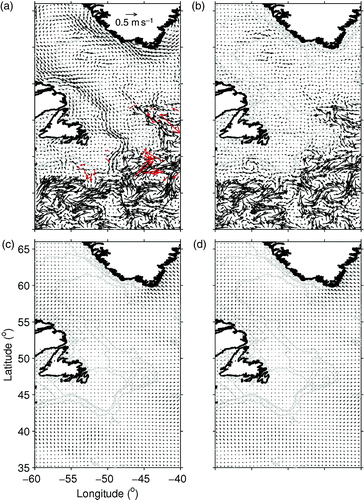
It can be seen that the weekly composite currents have significant spatial and temporal variability. In the southeastern portion of our study area, which is dominated by the Gulf Stream/North Atlantic Current, the circulation is characterized by meanders and eddies, whose sizes and positions differ between the two weeks. In the Labrador Sea and in the area surrounding Newfoundland, the circulation tends to be more spatially coherent, but the direction and strength of the currents differ between the two weeks. During the week of 2 October, currents over these areas tended to be southward or southeastward. During the week of 16 October, the currents were weaker and had more spatial variability in the Labrador Sea and over shelf areas. Comparison between the composite currents and their component geostrophic and wind-driven currents shows that the meanders and eddies in the southern and southeastern portions of our study area are contributed by the geostrophic current anomalies, while the wind-driven currents play a more dominant role in the Labrador Sea and the area surrounding Newfoundland, where the geostrophic currents are very weak. The composite currents are often qualitatively consistent with the buoy currents.
The buoy-observed and composite currents for the period 1993–2005 are quantitatively compared in using a variety of statistics. The statistics were compared for all buoy-composite current pairs and also after dividing them into four regions: 1) north of 52°N latitude and inshore of the 3000 m isobath, 2) north of 52°N and offshore of the 3000 m isobath, 3) south of 52°N and inshore of the 3000 m isobath, and 4) south of 52°N and offshore of the 3000 m isobath. (Krauss, Fahrbach, Aitsam, Elken, and Koske (Citation1987) identified 52°N as the latitude at which the North Atlantic Current tends to turn eastward.) The statistics calculated are the means and standard deviations of the observed and composite current speeds, the speed difference ratio (SDR), the vector difference ratio (VDR), and the correlation coefficient between current velocity components (R). The correlation coefficient is calculated for the u and v components collectively, with u and v treated as independent observations. The SDR is defined as the ratio between the sum of the squared differences between the observed and composite current speeds and the sum of the squared observed current speeds:
Table 1. Statistics comparing weekly-mean near-surface (15 m) composite currents to buoy-observed currents. See text for definitions of regions and Eqs (11) and (12) for definitions of SDR and VDR, respectively. R is the correlation between current velocity components (p = 0 in all cases).
The VDR is defined as the ratio between the sum of the squared differences between the observed and composite currents' velocity components and the sum of the squared observed currents' velocity components:
Thus, lower values of SDR and VDR indicate better agreement between the observed and composite currents, with a value of zero corresponding to exact agreement.
shows that, as expected, the strongest observed currents occur in region 4, where the Gulf Stream/North Atlantic Current dominates. The weakest observed currents occur in region 3 (shelf/slope waters south of 52°N). The composite currents underestimate the buoy-observed currents in all regions. The best agreement between the composite and observed currents occurs in region 4 for all statistics. Agreement between the composite and observed currents is worst in region 2 (deep waters north of 52°N).
When the same statistics are calculated for composite currents that do not include the Stokes drift (), the mean magnitude of the composite currents decreases only slightly (O(0.001 m s−1)). The comparison statistics are correspondingly similar to those for currents that include Stokes drift; this is in contrast to currents at the surface, which will be discussed in Section 3c.
Table 2. Similar to , but for composite currents calculated without the wave-induced (Stokes) component.
When the calculation of statistics is repeated with composite currents that use only the satellite-derived mean current fields and not the numerically simulated mean field (), the resulting statistics are generally similar to those in except in region 3, where the agreement is worse (an SDR of 0.56, VDR of 0.80 and a correlation of 0.45, compared to 0.53, 0.74, and 0.51, respectively, when the numerically simulated mean field is included). This indicates that inclusion of a numerically simulated field in the mean current field makes the composite current fields more realistic in the region that approximately coincides with the numerical model domain.
Table 3. Similar to , but for composite currents calculated using only the satellite-derived part of the mean current field.
These results are compatible with those of Sudre and Morrow (Citation2008), who carried out similar comparisons for a global current dataset and found the correlation between calculated and buoy-derived observed near-surface current velocity components to range between <0.1 and about 0.8 over our study area.
b Comparison with Acoustic Doppler Current Profiler (ADCP) Observations
The next evaluation of the composite currents is made by comparing them to current velocity observations made with shipboard ADCP by Fisheries and Oceans Canada's Atlantic Zone Monitoring Program along its Flemish Cap transect (Han et al., Citation2008; Senciall, Chen, Cobourne, Han, & Loder, Citation2006) (location shown in ). Tidal currents derived from a three-dimensional tidal model (Han, Citation2000) have been subtracted from the ADCP observations. These observations were made over approximately one-day periods, with temporal intervals of O(minutes) and spatial intervals of O(kilometres). Observations closest to the surface were interpolated over 0.25° intervals centred on the 0.25° resolution grid points at which the composite currents were calculated. Composite currents were calculated at the observation depths at six-hourly intervals (using six-hourly wind-driven currents instead of the usual weekly mean) and interpolated in two dimensions: temporally to the average observation time in each 0.25° interval and spatially to the centre of each 0.25° interval.
Examples of the resulting observed and composite currents are shown in Figs –. It can be seen that the composite currents are often able to reproduce the major spatial and temporal variations in the observed currents, especially in the offshore half of the transect. For example, in the 1993 cruise (), the composite current captures the turning of the currents from southward at approximately 200 km to westward/southwestward between approximately 250 km and 300 km, then turning southward again and becoming stronger at approximately 400 km (through Flemish Pass, between the Grand Banks and Flemish Cap). However, the composite currents at times underestimate the observed currents (as was also seen in comparisons with buoy observations) and have difficulty in reproducing currents with a poleward velocity component. This can also be seen when the same statistics in are calculated for the four cruises (), with an SDR of 0.37 and VDR of 0.61. The correlation is 0.59, with a 95% confidence interval of 0.49–0.68. The discrepancies suggest that forcings that are not included in the composite currents (e.g., wind variability on small temporal and spatial scales) play a significant role in the O(day) circulation variability in this region. From comparing panels b and c in Figs –, it is clear that inclusion of the numerically simulated currents in the mean circulation field leads to better agreement between the composite and ADCP currents.
Table 4. Statistics comparing ADCP-observed currents over the Flemish Cap transect (averaged over 0.25° intervals) and composite currents averaged spatially and temporally to locations and times of the averaged observed currents.
Fig. 6 Currents along the Atlantic Zone Monitoring Program's Flemish Cap transect: a) observed at 17 m depth by shipboard ADCP from 2 to 3 July 1993, averaged over 0.25° intervals; b) composite currents at 17 m depth interpolated spatially and temporally to locations and times of the currents in a); c) composite currents using only the satellite-derived long-term mean currents. The arrow at the upper right denotes the cruise direction.
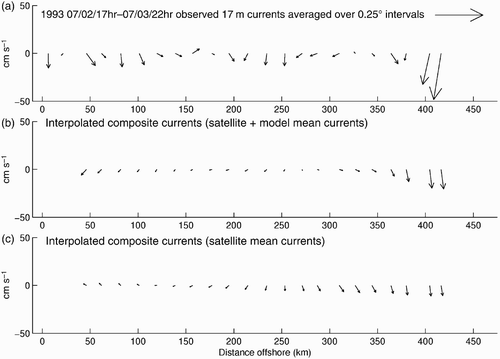
Fig. 7 Similar to , but for 15 to 16 July 1995, at 13 m depth.
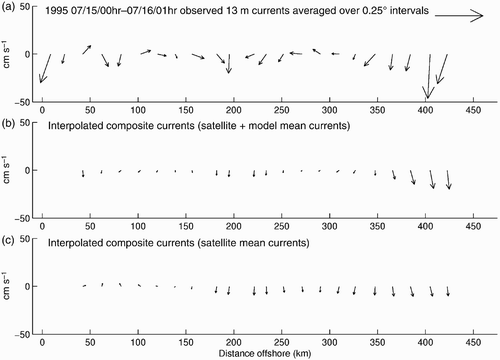
Fig. 8 Similar to , but for 20 to 21 November 2001, at 12 m depth.
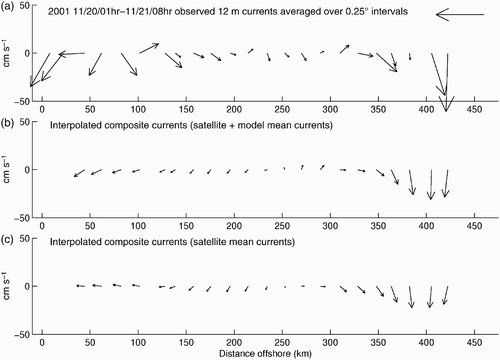
Fig. 9 Similar to , but for 24 to 25 April 2002, at 20 m depth.
c Comparison with Surface Drifters
In this section, we compare composite currents to surface drifters that were deployed over the Grand Banks in the fall of 2002 (Tang et al., Citation2007). Hourly data of surface currents derived from drifter positions (C. L. Tang, personal communication, 2012) were re-sampled every six hours and compared with composite currents that were calculated using six-hourly winds at the surface and the temporal mean currents shown in c. shows that the composite and observed currents at the surface are much closer than at 15 m depth, having mean speeds of 0.36 m s−1 and 0.35 m s−1, respectively, and an SDR of 0.20. When the Stokes drift is excluded, the SDR deteriorates to 0.28. Thus, as Perrie et al. (Citation2003) and Tang et al. (Citation2007) found using numerical ocean models, inclusion of the Stokes drift is necessary to represent the surface current speed in this region accurately.
Table 5. Statistics comparing six-hourly composite currents calculated at the surface to drifter-observed surface currents. The composite currents were calculated with and without Stokes drift. 448 observations were used.
d Comparison with OSCAR Product
The final evaluation of the composite currents is made by comparing them to a similar but global product known as Ocean Surface Current Analyses - Real time (OSCAR). This product consists of mean currents for the 0–30 m layer calculated from a diagnostic model using sea level, winds and sea surface temperature observed by satellites, together with a mean dynamic height field inferred from the World Ocean Atlas (Bonjean & Lagerloef, Citation2002). Thus the main differences between OSCAR and our composite currents are that 1) OSCAR uses a diagnostic model while our currents are a simple superposition of separately calculated components, and 2) OSCAR uses an observation-based mean dynamic height whereas our method combines numerically simulated and satellite-derived mean circulation fields.
We use five-day-averaged, unfiltered OSCAR data on a 1/3° grid, made available by the OSCAR Project Office (http://oscar.noaa.gov), for the period 1993–2005. The currents are interpolated onto the 0.25° composite current grid. The interpolated OSCAR currents for the five-day periods centred on 1 and 16 October October 2002 are shown in .
Fig. 10 Five-day-mean, 1/3° resolution OSCAR currents interpolated to the composite current grid, for the five-day periods centred on a) 1 October 2002 and b) 16 October 2002.
The interpolated OSCAR currents are compared with the buoy-observed currents described in Section 3a, after the latter's temporal averages were recalculated over the same five-day periods as the OSCAR currents. The 15 m composite currents agree better with the observed currents, having a correlation of 0.55 and a VDR of 0.70 () compared to 0.24 and 1.00, respectively, for the OSCAR currents (p = 0 for all correlations).
One possible reason the composite currents agree better with observations than the OSCAR currents is the use of a numerically simulated mean current field in the composite currents. As discussed earlier, the numerically simulated mean current field has more horizontal structure than its satellite-derived counterpart, and inclusion of the numerically simulated mean field led to improved agreement between the composite and observed currents, compared to using only the satellite-derived mean field, in the region corresponding to the model domain.
Another possible reason for the better agreement of the composite currents is that the components of the composite currents are available at an equal or finer horizontal resolution than those of the OSCAR currents. This is especially true of the numerically simulated mean current field, which is available on a horizontal grid whose spacing is approximately 5 km over shelf waters (Han et al., Citation2008).
4 Conclusions
We have developed a method to reconstruct the near-surface ocean circulation for the northwest Atlantic Ocean, using anomalous surface geostrophic currents derived from altimeter-observed sea surface height anomalies, long-term mean currents simulated from a numerical model and observed by satellites, and wind-induced Ekman currents and wave-induced Stokes drift calculated from scatterometer-observed winds. Two novel aspects in the methodology are the integration of modelled (Han et al., Citation2008) and satellite-derived mean circulation fields and the inclusion of the wave-induced Stokes drift based on the method of Weber (Citation1983).
Weekly composite currents showed considerable spatial and temporal variability and a tendency to be weaker than their observed counterparts. Quantitative agreement between composite currents (calculated at the 15 m depth) and currents observed by satellite-tracked buoys was best in the area where the Gulf Stream/North Atlantic Current and its associated meanders and eddies dominated the circulation. Comparison between the weekly composite currents and their constituent wind-driven and geostrophic currents suggested that the former tends to contribute to the circulation over the Labrador Sea and over the shelf areas, whereas the influence of the latter was most visible in the area of the Gulf Stream/North Atlantic Current. Use of the numerically simulated field as the mean current improves the agreement between the composite and observed currents for coastal and shelf waters.
The composite currents were often able to reproduce the major temporal and spatial variations of currents at various depths along the Flemish Cap transect, although there was again a tendency for the composite currents to underestimate the observed current speeds. Quantitatively, there is fair agreement between the composite currents and observed currents from shipboard ADCP data, with a correlation coefficient of 0.59.
When the composite currents were calculated at the surface for comparison with drifter-observed currents over the Grand Banks, the composite currents that included the Stokes drift had a mean speed very similar to the observed currents (approximately 0.35 m s−1), whereas exclusion of the Stokes drift led to an underestimation of observed current speeds. This indicates that inclusion of the Stokes drift is important in estimating the current speed at the surface. (Because the Stokes drift diminishes rapidly with depth, its exclusion did not have a significant effect at the 15 m depth, as can be seen when comparing and .)
The composite currents (at 15 m depth) outperformed a similar current product known as OSCAR that was linearly interpolated to the composite current grid. The finer horizontal resolution (compared with OSCAR before interpolation) of the composite currents' components, especially the numerically simulated field, is thought to be the cause of the better agreement of the composite currents with observations.
There are good prospects for the few outstanding issues in the present method. The altimetry current anomalies provide weekly surface information only. However, the fair agreement of the composite currents with the ADCP and buoy data suggest that the method seems to be robust even for currents at time scales less than a week and within approximately 15 m of the sea surface. There is also a mismatch between the time period over which the altimetric mean is calculated and removed and the period over which the model mean currents are calculated. With the 15 years of altimetric data in the present study, the mismatch does not seem to pose a problem of significant concern, because the decadal and secular changes are small relative to the mean and to variability at time scales ranging from the subtidal to the interannual. With a continuously increasing altimetric data record, this issue can surely be mitigated and overcome. The other prospect for tackling this issue is to use either a model mean simulated for exactly the same period or to use a satellite-based mean current field that is expected to be improved significantly with new satellite gravity missions. Other future work could include continued improvement and validation of the product, by incorporating surface current patterns derived from other types of satellite measurements, such as sea surface temperature, ocean colour, and synthetic aperture radars.
Compared to a fully coupled ocean circulation–wave model such as those used by Perrie et al. (Citation2003) or Tang et al. (Citation2007), our method is rather crude in that it consists of a simple superposition of components and includes a number of assumptions in the calculation of the wind-driven component (e.g., vertical eddy viscosity that is invariant with depth, fully developed sea and deep water). It also lacks several processes included in a numerical model, such as those related to the interaction between waves and currents. This is a likely reason why Tang et al. (Citation2007) found that inclusion of the Stokes drift led to improved agreement with observations in terms of both current speed and direction, while we have found improved agreement only in terms of current speed (). The fair agreement with independent observations that is achieved by our method despite these limitations and despite the significant spatial and temporal variability of circulation in this region suggests the potential of satellite-derived near-surface currents for various applications such as fisheries and ecosystem management. Although the derivation and validation were carried out for the northwest Atlantic only, the method may be used for other regions of the world.
Acknowledgements
The project is partially supported by the Canadian Space Agency's Government Related Initiative Program (GRIP) and the Canadian Program for Energy, Research and Development (PERD). The drifter observations were provided by Charles Tang (Fisheries and Oceans Canada). We thank two anonymous reviewers for helpful comments on an earlier version of this manuscript.
Additional information
Notes on contributors
Kyoko Ohashi
Current affiliation: Department of Oceanography, Dalhousie University, Halifax, Nova Scotia, Canada.References
- Barnes , S. L. 1964 . A technique for maximizing details in numerical weather map analysis . Journal of Applied Meteorology , 3 : 396 – 409 . (doi:10.1175/1520-0450(1964)003<0396:ATFMDI>2.0.CO;2)
- Bonjean , F. and Lagerloef , G. S. E. 2002 . Diagnostic model and analysis of the surface currents in the tropical Pacific Ocean . Journal of Physical Oceanography , 32 : 2938 – 2954 . (doi:10.1175/1520-0485(2002)032<2938:DMAAOT>2.0.CO;2)
- Ducet , N. , Le Traon , P. and Reverdin , G. 2000 . Global high-resolution mapping of ocean circulation from TOPEX/Poseidon and ERS-1 and -2 . Journal of Geophysical Research , 105 ( C8 ) : 19477 – 19498 . (doi:10.1029/2000JC900063)
- Foreman , M. G. G. , Crawford , W. R. , Cherniawsky , J. Y. and Galbraith , J. 2008 . Dynamic ocean topography for the northeast Pacific and its continental margins . Geophysical Research Letters , 35 : L22606 doi:10.1029/2008GL035152
- Fratantoni , P. S. and Pickart , R. S. 2007 . The western North Atlantic shelfbreak current system in summer . Journal of Physical Oceanography , 37 : 2509 – 2533 . (doi:10.1175/JPO3123.1)
- Geshelin , Y. , Sheng , J. and Greatbatch , R. J. 1999 . Monthly mean climatologies of temperature and salinity in the western North Atlantic . Canadian Technical Report of Hydrography and Ocean Sciences , 153
- Han , G. 2000 . Three-dimensional modeling of tidal currents and mixing quantities over the Newfoundland Shelf . Journal of Geophysical Research , 105 : 11407 – 11422 . (doi:10.1029/2000JC900033)
- Han , G. 2004 . Scotian Slope circulation and eddy variability from TOPEX/Poseidon and frontal analysis data . Journal of Geophysical Research , 109 : C03028 doi:10.1029/2003JC002046
- Han , G. 2005 . Wind-driven barotropic circulation off Newfoundland and Labrador . Continental Shelf Research , 25 : 2084 – 2106 . (doi:10.1016/j.csr.2005.04.015)
- Han , G. 2011 . Mean dynamic topography and surface circulation in the western Labrador Sea and Newfoundland offshore: Satellite observations and ocean modelling . International Journal of Remote Sensing , 32 : 5381 – 5391 . doi:10.1080/01431161.2010.498840
- Han , G. and Loder , J. W. 2003 . Three-dimensional seasonal-mean circulation and hydrography over the eastern Scotian Shelf . Journal of Geophysical Research , 108 ( C5 ) : 3136 doi:10.1029/2002JC001463
- Han , G. , Lu , Z. , Wang , Z. , Helbig , J. , Chen , N. and de Young , B. 2008 . Seasonal variability of the Labrador Current and shelf circulation off Newfoundland . Journal of Geophysical Research , 113 : C10013 doi:10.1029/2007/JC004376
- Han , G. and Tang , C. L. 1999 . Velocity and transport of the Labrador Current determined from altimetric, hydrographic, and wind data . Journal of Geophysical Research , 104 : 18047 – 18057 . (doi:10.1029/1999JC900145)
- Han , G. and Tang , C. L. 2001 . Interannual variations of volume transport in the western Labrador Sea based on TOPEX/Poseidon and WOCE data . Journal of Physical Oceanography , 31 : 199 – 211 . (doi:10.1175/1520-0485(2001)031<0199:IVOVTI>2.0.CO;2)
- Hansen , D. V. and Poulain , P.-M. 1996 . Quality control and interpolations of WOCE-TOGA drifter data . Journal of Atmospheric and Oceanic Technology , 13 : 900 – 909 . (doi:10.1175/1520-0426(1996)013<0900:QCAIOW>2.0.CO;2)
- Knudsen, P., Vest, A. L., & Andersen, O. (2004). Evaluating mean dynamic topography models within the GOCINA project. Proceedings of the 2004 Envisat & ERS Symposium, 6–10 September 2004, Salzburg, Austria (ESA SP– 572, April 2005). Published and distributed by ESA Publications Division, Noordwijk, the Netherlands.
- Krauss , W. , Fahrbach , E. , Aitsam , A. , Elken , J. and Koske , P. 1987 . The North Atlantic Current and its associated eddy field southeast of Flemish Cap . Deep-Sea Research , 34 : 1163 – 1185 . (doi:10.1016/0198-0149(87)90070-7)
- Lagerloef , G. S. E. , Mitchum , G. T. , Lukas , R. B. and Niiler , P. P. 1999 . Tropical Pacific near-surface currents estimated from altimeter, wind, and drifter data . Journal of Geophysical Research , 104 : 23313 – 23326 . (doi:10.1029/1999JC900197)
- Niiler , P. P. , Maximenko , N. A. and McWilliams , J. C. 2003 . Dynamically balanced absolute sea level of the global ocean derived from near-surface velocity observations . Geophysical Research Letters , 30 : 2164 doi:10.1029/2003GL018628
- Perrie , W. , Tang , C. L. , Hu , Y. and DeTracy , B. M. 2003 . The impact of waves on surface currents . Journal of Physical Oceanography , 33 : 2126 – 2140 . (doi:10.1175/1520-0485(2003)033<2126:TIOWOS>2.0.CO;2)
- Senciall, D., Chen, N., Cobourne, E., Han, G., & Loder, J. (2006). ADCP currents along the Flemish Cap Transect, The National Science Workshop, Fisheries and Oceans Canada, Mont- Joli, Quebec.
- Sudre , J. and Morrow , R. A. 2008 . Global surface currents: A high-resolution product for investigating ocean dynamics . Ocean Dynamics , 58 : 101 – 118 . (doi:10.1007/s10236-008-0134-9)
- Tang , C. L. , Perrie , W. , Jenkins , A. D. , DeTracy , B. M. , Hu , Y. , Toulany , B. and Smith , P. C. 2007 . Observation and modeling of surface currents on the Grand Banks: A study of the wave effects on surface currents . Journal of Geophysical Research , 112 : C10025 doi:10.1029/2006JC004028
- Weber , J. E. 1983 . Steady wind- and wave-induced currents in the open ocean . Journal of Physical Oceanography , 13 : 524 – 530 . (doi:10.1175/1520-0485(1983)013<0524:SWAWIC>2.0.CO;2)
- Zhang , H.-M. , Bates , J. J. and Reynolds , R. W. 2006 . Assessment of composite global sampling: Sea surface wind speed . Geophysical Research Letters , 33 : L17714 doi:10.1029/2006GL027086