Abstract
The first thorough examination of oxygen concentrations in Canadian waters of the Pacific Ocean reveals several patterns in space and time. Sub-surface concentrations of oxygen tend to be lower in shelf waters than in deep-sea waters on the same isopycnal and lower in southern waters of the continental shelf than farther north. The lowest near-bottom concentration was 0.7 ml L−1 (31 μmol kg−1) in mid-shelf waters in summer off southwest Vancouver Island in the Juan de Fuca Eddy region. Oxygen concentration there declined at a rate of 0.019 ml L−1 y−1 (0.83 μmol kg−1 y−1) from 1979 to 2011. This decline is attributed mainly to changes in oxygen concentrations on the same density surfaces, rather than to changes in the depth of constant-density surfaces. A numerical simulation of ocean currents and nutrient concentrations in and surrounding the Juan de Fuca Eddy in summer reveals persistent upwelling into the centre of this eddy and slow bottom currents within the eddy. Upwelled water at bottom of the Juan de Fuca Eddy has water properties associated with the California Undercurrent on the 26.6 sigma-t surface at 200 m depth, where oxygen concentration is typically 2.0 ml L−1 (87 μmol kg−1) and declined at a rate of 0.025 ml L−1 y−1 (1.1 μmol kg−1 y−1) from 1981 to 2011, mainly as a result of changes on constant-density surfaces rather than to uplifting isopycnals. We propose that upwelling advects deep, oxygen-poor water onto the continental shelf bottom, and the slow bottom currents allow time for oxidation of organic material in bottom waters to further reduce the oxygen concentration.
RÉSUMÉ [Traduit par la rédaction] Le premier examen approfondi des concentrations d'oxygène dans les eaux canadiennes de l'océan Pacifique révèle plusieurs configurations dans le temps et dans l'espace. Les concentrations d'oxygène sous la surface ont tendance à être plus faibles dans les eaux de la plate-forme continentale que dans les eaux de l'océan profond sur la même isopycne et plus faibles dans les eaux du sud de la plate-forme que plus loin au nord. La concentration la plus faible près du fond était de 0.7 ml L−1 (31 μmol kg−1) dans les eaux du milieu de la plate-forme en été au large du sud-ouest de l’île de Vancouver dans la région du remous de Juan de Fuca. Les concentrations en oxygène à cet endroit ont diminué au rythme de 0.019 ml L−1 a−1 (0.83 μmol kg−1 a−1) entre 1979 et 2011. Cette diminution est principalement attribuée aux changements dans les concentrations d'oxygène sur les surfaces d’égale densité plutôt qu'aux changements dans la profondeur des surfaces de densité constante. Une simulation numérique des courants océaniques et des concentrations de nutrients dans le remous de Juan de Fuca et dans les régions avoisinantes en été révèle des remontées d'eau froide persistantes vers le centre de ce remous et des courants de fond lents à l'intérieur du remous. L'eau qui a remonté au fond du remous de Juan de Fuca a des propriétés liées au sous-courant de Californie sur la surface sigma–t 26.6 à une profondeur de 200 m, où la concentration en oxygène est normalement de 2.0 ml L−1 (87 μmol kg−1), et a diminué au taux de 0.025 ml L−1 a−1 (1.1 μmol kg−1 a−1) de 1981 à 2011, principalement à cause des changements sur les surfaces de densité constante plutôt que du soulèvement des isopycnes. Nous pausons l'hypothèse que les remontées d'eau advectent des eaux profondes pauvres en oxygène au bas de la plate-forme continentale et que les lents courants de fond donnent le temps à l'oxydation de la matière organique dans les eaux de fond, ce qui réduit davantage la concentration de l'oxygène.
1 Introduction
In the Gulf of Alaska, oxygen concentration decreases with depth from near saturation levels at the ocean surface to very low levels in the oxygen minimum layer near 800 m depth. A critical depth for marine life is the thermocline below the winter mixed layer, where density increases and oxygen concentration decreases rapidly with depth. The re-supply of oxygen here is not from the ocean surface but rather is a result of horizontal advection from distant regions where these density layers outcrop. Much of this sub-surface oxygen begins its flow in the far northwest Pacific Ocean where it outcrops in winter (Whitney, Freeland, & Robert, Citation2007). These oxygenated waters sink and flow slowly toward the Gulf of Alaska, losing oxygen through remineralization of organic matter and also through mixing with oxygen-depleted waters from the eastern subtropical Pacific Ocean. This paper focuses on the spatial and temporal variability of oxygen in this sub-surface layer, with enhanced coverage in the coastal waters of British Columbia, Canada.
Serious concern about oxygen concentrations in coastal waters of the northeast Pacific Ocean began with the onset of hypoxia (oxygen <1.4 ml L−1) in relatively shallow waters of the Oregon continental shelf in summer 2002 (Grantham et al., Citation2004) followed by the occurrence of severe hypoxia in summer 2006 (Chan et al., Citation2008) not only in Oregon, but also on the Washington shelf (Connolly, Hickey, Geier, & Cochlan, Citation2010). These events led to mortality of marine life at the ocean bottom. These papers note that the very low concentration on the Oregon and Washington shelves requires local oxidation of organic matter to push oxygen levels to hypoxia, and that strong, persistent, summer upwelling winds are a factor as well. Both studies note that hypoxia and extreme hypoxia were found only in summer; downwelling winds and stronger wind-driven mixing flush oxygen-rich waters through these benthic regions in autumn and winter.
Declines in oxygen in the North Pacific are not confined to the continental shelf. Long-term decreases in oxygen concentrations have been observed in the centre of the North Pacific Ocean, Gulf of Alaska, and southern California waters. Emerson, Watanabe, Ono, and Mecking (Citation2004) noted evidence of declining oxygen concentrations in sub-surface waters of the North Pacific Ocean. They found that the apparent oxygen utilization (AOU), which is the difference between saturated and actual concentrations of oxygen, had increased in subarctic regions and increased most significantly from the mid-1980s to the mid-1990s along the boundary between subtropical and subarctic waters. Increases in AOU were centred on the 26.6 sigma-theta (σθ ) surface in the subarctic. Whitney et al. (Citation2007) examined trends in sub-surface oxygen concentrations at Ocean Station P (50°N, 145°W) between 1956 and 2006. Their analysis revealed considerable interannual variability and a decline of 0.67 μmol kg−1 y−1 on the 26.7 σθ surface over this period. Cummins and Masson (Citation2012) determined that declines at fixed depths below the mixed layer are attributable to declining oxygen concentrations on constant density surfaces, offset somewhat by long-term deepening of these surfaces. This shoaling is attributed to upwelling driven by increasing wind stress curl. Whitney et al. (Citation2007) also noted a decline of 1.22 μmol kg−1 y−1 on the 26.7 σθ surface at station P4 (48° 39′N, 126° 40′W) on the continental slope west of Vancouver Island over the period 1987 to 2006. Whitney (Citation2009) found a decline of about 1 μmol kg−1 y−1 at 200 m on the continental margin of northern Canada. Bograd et al. (Citation2008) examined oxygen concentrations in the southern California Current System over the period 1984 to 2006. Declines in oxygen as great as 2.1 μmol kg−1 y−1 were observed, with the largest relative declines occurring below the thermocline (mean decrease of 21% at 300 m). McClatchie, Goericke, Cosgrove, Auad, and Vetter (Citation2010) and Koslow, Goericke, Lara-Lopez, and Watson (Citation2011) examined oxygen observations from the California Cooperative Fisheries Investigation (CalCOFI) extending back to the 1950s, noting that oxygen increased until the late 1970s and has declined since the 1980s such that recent concentrations in the late 2000s were similar to those of the 1950s when observations began. Pierce, Barth, Shearman, and Erofeev (Citation2012) noted a decline in oxygen along the Oregon continental margin and slope since the 1960s, with some evidence for an accelerated decline since the 1980s.
Sub-surface waters of the subarctic Northeast Pacific Ocean and the California continental margin are source waters for the upper continental slope and lower shelf of Oregon to British Columbia. In this study, we describe characteristics of the temporal and spatial distribution of dissolved oxygen in bottom waters of the continental shelf of British Columbia, Canada, with special attention to southwest Vancouver Island and examine oceanic source waters that contribute to these temporal changes.
2 Data
For insight into oxygen concentrations throughout the Gulf of Alaska, we updated the analysis described by Crawford, Brickley, and Thomas (Citation2007) who presented the distribution of percentage oxygen saturation in the Gulf of Alaska on the 26.5 σθ surface. Only oxygen observations from seawater of σθ between 26.45 and 26.55 were included, whereas for studies of the Canadian continental shelf, the complete set of titrated samples of hydro bottles were examined from 1934 to present, as well as measurements since 2004 by SeaBird Instruments Ltd. electronic oxygen sensor SBE-43 attached to a SeaBird 911 conductivty, temperature, depth sensor (CTD) on a rosette equipped with Niskin bottles and lowered from research ships. Data for the SBE-43 were processed following SeaBird procedures and software and corrected by comparison with oxygen samples collected in the Niskin bottles and measured on board. Measurements of oxygen from the SBE-43 are archived at vertical intervals of one metre, providing excellent resolution to reveal changes in oxygen with depth.
To determine observations near bottom, the depth of the deepest bottle or electronic measurement was compared to the bottom depth as listed in the metadata. Several comparisons were made to determine differences in oxygen concentrations in bottles at 10, 15, and 20 m from the ocean bottom. Overall there were minor differences compared to interannual and spatial variability; therefore, we used data from the deepest measurement within 20 m of the ocean bottom to represent bottom concentrations. Samples collected farther from the ocean bottom were discarded, as were samples if the bottom depth was missing from the metadata. Accuracy of historical measurements is uncertain; in the last 15 years the quality control at the Institute of Ocean Sciences has identified errors in oxygen titrations, such as the accuracy being better than 0.1 ml L−1, and in most cases much better than this. Accuracy of measurements is described extensively by Whitney et al. (Citation2007).
NEPTUNE Canada deployed continuously recording sensors to measure oxygen and temperature near bottom at 100 m depth in Folger Passage on the continental shelf of southwest Vancouver Island, with all observations available on line (NEPTUNE Canada, Citation2012). We examined almost two years of these observations, beginning with the first deployment in October 2009. An Aanderaa oxygen sensor and SeaBird temperature sensor were used, and factory calibrations were applied to both measurements assuming a salinity of zero. We present results in percentage saturation rather than in micromoles per kilogram, because salinity observations are not available for the density calculations needed for micromoles per kilogram. These observations provide useful insight into relative changes over the annual cycle.
Observations of oxygen concentration are presented in several units. We use percentage oxygen saturation for the climatology of oxygen concentrations along constant density surfaces in the Gulf of Alaska. We use millilitres per litre (ml L−1) on the continental margin where we are looking for changes over decades and comparing them with the values of Chan et al. (Citation2008) and Connolly et al. (Citation2010). In addition, we provide concentration in micromoles per kilogram (μmol kg−1) as well as millilitres per litre, using 1 ml L−1 = 43.7 μmol kg−1. This ratio derives from the southwest Vancouver Island continental margin in late summer. Also, we follow Connolly et al. (Citation2010) who define hypoxia as <1.4 ml L−1 (61 μmol kg−1 approximately 20% saturation). Chan et al. (Citation2008) define extreme hypoxia as <0.5 ml L−1 (<22 μmol kg−1). These two papers describe conditions on the continental shelves of Oregon and Washington, and we apply the same hypoxia ranges for comparison. The concept of hypoxia is not well defined across scientific disciplines, and impacts of low oceanic oxygen vary greatly from one marine species to another. Therefore, the term hypoxia is applied here to define specific limits of oxygen concentration rather than to imply impacts on biota. Keeling, Kortzinger, and Gruber (Citation2010) provide an excellent overview of this topic, as well as insight into the distribution of hypoxia through the oceans. Hofmann, Peltzer, Walz, and Brewer (Citation2011) present a thorough summary of the topic of hypoxia in marine life.
3 Numerical model
A coupled physical-biogeochemical model was used to examine near-bottom ocean currents and nitrate distribution off the southwest coast of Vancouver Island during summer. The ocean circulation component is an implementation of the Regional Ocean Modelling System (ROMS) developed by Foreman et al. (Citation2008) to study the generation of the Juan de Fuca Eddy. Details of the ROMS model can be found in Haidvogel et al. (Citation2000) and Shchepetkin and McWilliams (Citation2005). The biogeochemical component is a nine-compartment Nutrient-Phytoplankton-Zooplankton-Detritus (NPZD) model, which includes nitrate, ammonia, and silicate as well as two size classes of phytoplankton and zooplankton. Recently, these models have been coupled to study the effect of the Juan de Fuca Eddy on summer phytoplankton bloom dynamics (Peña, Citation2009). The main processes incorporated in the model include phytoplankton growth controlled by light and nutrients, zooplankton grazing, and natural loss processes (i.e., mortality and excretion) by both phytoplankton and zooplankton. The model assumes instantaneous remineralization of organic particles (detritus compartment) when they reach the bottom layer. The model domain is bounded by approximately 45.5°N to 50.0°N and 123.5°W to 128.5°W, with 30 non-uniform vertical layers and increased resolution near the surface and bottom boundary layers. A stretched-coordinate rectangular grid was employed to obtain an accurate representation of topographic and coastal features of the region, with horizontal resolution varying from 1 km near the entrance of Juan de Fuca Strait to 5 km adjacent to the western boundary. The model is initialized with climatological summer temperature, salinity, and nutrients (nitrate and silicate) and forced with summer-average, upwelling-favourable winds, as well as tides and buoyancy boundary conditions that maintain an estuarine flow in Juan de Fuca Strait. A more complete description of the ROMS circulation model is given by Foreman et al. (Citation2008). The ROMS-NPZD model was spun up for 30 days and the next 30 days, representing average mid-summer flow, are presented here. Two simulations were carried out: a base run where all the biological source and sink terms were computed and a no-biology run where all biological processes were turned off such that nitrate becomes a passive tracer that moves with the currents.
4 Results and discussion
a Annual Cycle off Southwest Vancouver Island
Our study examines summer observations, because this season has the lowest oxygen concentration in sub-surface waters on the continental shelf. To illustrate the seasonal variability, the first continuous record of oxygen concentration and temperature in bottom waters at 100 m depth in Folger Passage in the southwest coast of Vancouver Island is shown in . Temperature was lowest in summer, about two degrees Celsius cooler than in winter, indicating that summer upwelling and winter downwelling dominate local solar heating. Oxygen concentration ranged from 30 to 85% of saturation with the highest concentration in winter and early spring and lowest in summer. The lowest oxygen concentration was in August to October 2010 and from July onwards in 2011. Oxygen changes episodically in late autumn and early winter. Rapid increases took place on 30 November 2009, 14 January 2010, and 10 and 26 December 2010.
Fig. 1 Temperature (°C) and oxygen percentage saturation measured at the ocean bottom in 100 m of water near Folger Passage, BC, at 48.814°N, 125.281°W (see map in b for location). Instrument and data are maintained by NEPTUNE Canada.
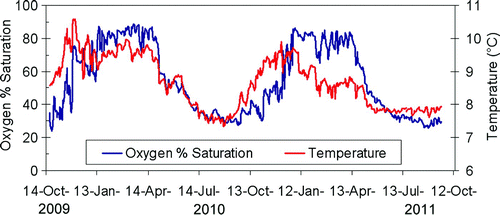
Although the seasonal cycle of oxygen concentration was similar over the 22-month period, there was between-year variability. Temperature in the winter of 2009–10 was considerably warmer than in the following winter. The warmer winter of 2009–10 was most likely a result of the difference in prevailing winds over these two winters, with the more southerly winds of 2009–10 associated with El Niño, and the cooler, more westerly winds of 2010–11 attributed to La Niña, respectively. The stronger southerly winds of the first winter brought warm waters northward along the west coast. This period of ocean conditions is described in more detail by Crawford and Irvine (Citation2011).
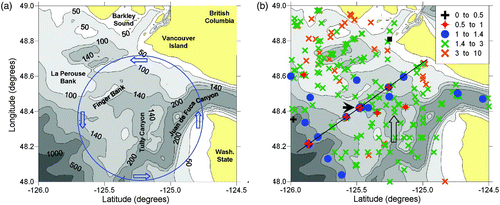
Fig. 6 (a) High-resolution map of the bathymetry off southwest Vancouver Island. Bottom contours are in metres. A blue circle marks the general location of the Juan de Fuca Eddy. (b) Near-bottom oxygen concentrations (ml L−1) off southwest Vancouver Island. Tully Canyon is marked by an open black arrow pointed to the north. The LB line of stations is marked by a black line. A solid black arrow points to Station LB08. The oxygen recorder of NEPTUNE Canada in Folger Passage is at the location marked by a black square.
b Spatial distribution
1 Gulf of Alaska
We next discuss the spatial distribution of sub-surface oxygen in the Northeast Pacific Ocean, to provide context for our study of one particular region within this ocean. presents the spatial distribution of sub-surface oxygen concentration on the 26.5 σθ isopycnal in summer (June to September) in the Gulf of Alaska. The 26.5 σθ isopycnal reaches the ocean surface in the far northwest Pacific Ocean in winter, but elsewhere it almost always lies below the surface mixed layer. This isopycnal lies near the bottom on the continental shelf in summer. Along this isopycnal, the oxygen concentration of the northeast Pacific Ocean decreases toward the east. Several processes contribute to this spatial gradient. The major source of seawater enriched in oxygen is the flow from the Sea of Okhotsk in winter, which loses oxygen through remineralization during the years required to advect to the eastern side of the North Pacific. The California Undercurrent carries oxygen-depleted water northward along the eastern margin. This water originates as Pacific Equatorial Water (PEW) in the eastern subtropical Pacific where its oxygen concentration is close to zero, and as it flows northward it acquires oxygen through mixing with adjacent deep-sea waters (Thomson & Krassovski, Citation2010) and loses oxygen on the continental shelf through remineralization of organic matter. Of all regions just below the surface mixed layer of the northeast Pacific Ocean from California northward, the lowest oxygen concentration is found on the North American continental shelf in summer, resulting from a combination of the eastward advection of oxygen-depleted water, the northward flow of the California Undercurrent with its very low oxygen concentration, the upwelling of this water onto the shelf in summer and additional depletion in the organic-rich bottom waters of this continental shelf.
Fig. 2 Measurements of oxygen percentage saturation on the 26.5 σθ surface, June to September, based on archived data. The solid grey line marks the 200 m depth contour. Each symbol represents a distinct measurement.
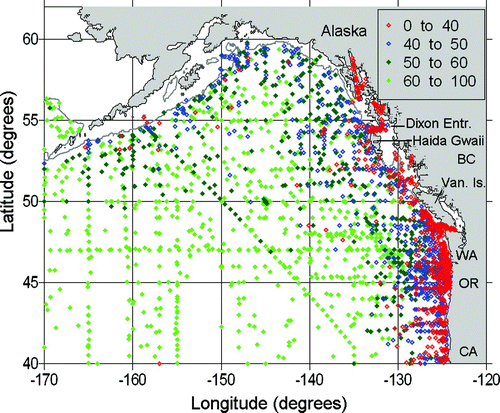
Our main interest is the low oxygen levels along the continental slope and shelf of northern California to southeast Alaska, where the oxygen concentration falls below 40% saturation, as shown by the red symbols in . Elsewhere, the oxygen concentrations are higher, especially in the deep-sea waters to the south of 50°N. Along the continental margin of central Alaska and the Aleutians the oxygen concentration is lower than in adjacent deep-sea waters, and the lowest oxygen saturation is generally between 40% and 50%, somewhat higher than found on the margin to the south.
2 British Columbia Shelf
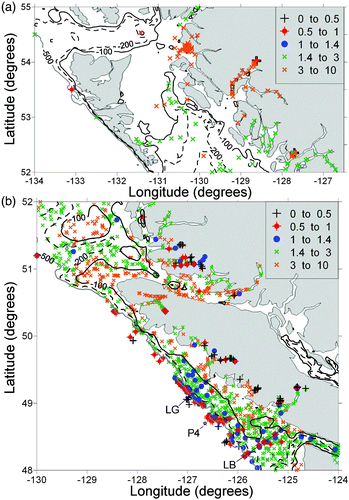
Horizontal gradients in sub-surface oxygen concentration are significant along and across the continental shelf of British Columbia (BC). The spatial distribution of near-bottom oxygen in June to September on the BC shelf and in inlets is shown in . The hypoxia range of Connolly et al. (Citation2010) is split into sub-ranges of 0.5 to 1.0 ml L−1 (22 to 44 μmol kg−1) and 1.0 to 1.4 ml L−1 (44 to 61 μmol kg−1) in this figure. A notable feature is that hypoxic bottom waters are not found along the inner shelf of Vancouver Island. Instead, almost all the hypoxic waters inside the 200 m contour are at mid-shelf off southwest Vancouver Island (b), where there is a broad shelf between 100 and 200 m depth. In addition, many of the fjord-type inlets are hypoxic or even anoxic at bottom because of both the very slow renewal of bottom waters and the local oxidation of organic material at the bottom (Pickard, Citation1961). Another factor is the low oxygen in the renewal waters that do occasionally flow into the bottoms of these fjords. Concentrations below 1.4 ml L−1 on the continental shelf are rarely observed in samples north of 49.5°N. Sampling north of 52°N (a) has been sparse and infrequent in summer, offering little insight into any spatial gradient of near-bottom oxygen in central and northern BC.
Fig. 3 Historical observations of oxygen concentration (ml L−1) within 20 m of the ocean bottom plotted on maps of the BC shelf and inlets, for the months of June to September. (a) northern BC; (b) southern BC. Depth contours are in metres. Straight black lines pass along the LB and LG lines. Station P4 is marked by a star.
a shows oxygen measurements along the LB line, one of the lines of stations off southwest Vancouver Island sampled in May and early September by Fisheries and Oceans Canada as part of a zooplankton-oceanography program (Mackas, Citation1992). The locations of this line and of the LG line are shown in b. Over the past few decades the deepest sample has generally been within 10 m of bottom, as determined by an acoustic bottom tracker during the CTD cast. The years shown in (2005–07) were chosen because oxygen was sampled with an electronic sensor, providing accurate measurements at one-metre vertical intervals. Earlier measurements were from hydro-bottles with much greater vertical separation. The lowest oxygen concentrations on this shelf are usually found midway across the shelf at stations LB06 to LB09, with the lowest being 0.7 ml L−1 (31 μmol kg−1) at station LB08 (48° 25.3′N, 125° 28.66′W) in both 2006 and 2009. Although nearby stations on the LB line also have low oxygen, their concentrations at bottom were higher than at LB08 in these two years.
Fig. 4 Contours of (a) oxygen concentration (ml L−1) and (b) σt along the LB line off southwest Vancouver Island in September of 2005 to 2007. Triangles mark the deepest measurements at station locations, with LB01 closest to shore and LB16 farthest offshore. Contouring extends to the deepest measurement not to the ocean bottom. LB08 is marked by a circle enclosing the triangle. Horizontal distance is measured in kilometres seaward of station LB01. Pressure is dbars.
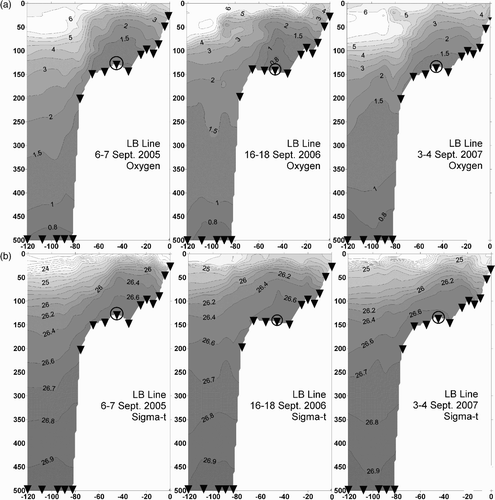
Section plots of seawater density (σt ) along the same LB Line (b) reveal that waters on the continental shelf with the lowest oxygen are also the densest water, consistent with coastal upwelling. Seawater on the continental slope of density similar to that at the bottom of station LB08 is found at about 200 m depth. In contrast, seawater on the continental slope of oxygen concentration similar to that at the bottom of station LB08 is found at about 450 m depth. This difference indicates that upwelling of deep water cannot by itself account for the very low oxygen concentrations at LB07 to LB09. Local oxidation of organic matter is the most likely additional factor responsible for the low oxygen levels, as is also found farther north at approximately 49°N on the BC shelf (Bianucci, Denman, & Ianson, Citation2011) and observed on the Oregon and Washington shelves (Chan et al., Citation2008; Connolly et al., Citation2010).
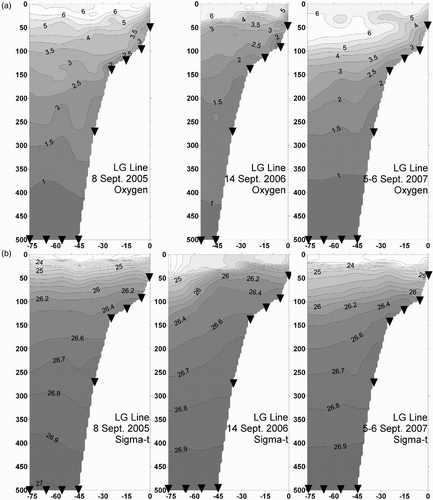
Contours of oxygen and σt for the LG line of stations on the central Vancouver Island shelf are presented in a and 5b, respectively. The near-bottom oxygen concentration along the LG line does not reach the low value found along the LB line, in agreement with the distribution of near-bottom oxygen determined from titrated samples plotted in b. There are almost no oxygen values below 1.0 ml L−1 on the LG line at depths above 200 m. Only in 2009 did this oxygen contour climb above 200 m depth and only in a very thin layer. By contrast, this oxygen contour was found on the shelf along the LB line during five of the six summers between 2005 and 2010. The doming of isopycnals at mid-shelf, always present in the September sampling along the LB line in 2005 to 2007, is barely noticeable along the LG line in these years.
Fig. 5 Contours of (a) oxygen concentration (ml L−1) and (b) σt along the LG line off southwest Vancouver Island in September of 2005 to 2007. Triangles mark the deepest measurements at station locations, with LG01 closest to shore and LG09 farthest offshore. Contouring extends to the deepest measurement not to the ocean bottom. Horizontal distance is measured in kilometres seaward of Station LG01. Pressure is dbars.
3 Southwest Vancouver Island shelf
We next focus on the portion of the continental shelf traversed by the LB Line, because this region has the lowest oxygen concentration. Large-scale maps of the southwest Vancouver Island shelf in show details of the bathymetry (a) and of the distribution of near-bottom samples of oxygen concentrations (b). The upward-pointing arrow in b marks the Tully Canyon, which lies near the centre of a cyclonic flow denoted as the Juan de Fuca Eddy (a), discovered by Tully (Citation1942) and first mapped by Freeland and Denman (Citation1982). Almost all the oxygen concentrations less than 1.4 ml L−1 inside the 200 m contour lie within the Juan de Fuca Eddy. Although this eddy is surface-intensified, it does extend to the bottom and creates a low-pressure zone in its centre that supports an inflow of deep water up the Tully Canyon (Freeland & Denman, Citation1982).
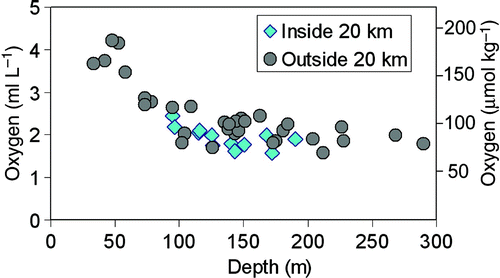
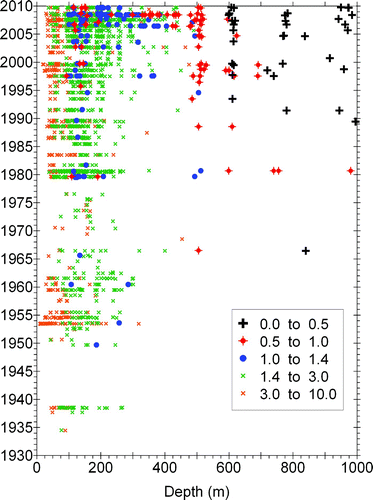
The most detailed synoptic sampling of near-bottom oxygen in the Juan de Fuca Eddy region took place in June 1985 when 45 near-bottom samples were collected over a period of three days to map the eddy and its impact on oxygen at ocean bottom (Dewey, Citation1987). In we present a plot of near-bottom measurements of oxygen versus depth, with distinct symbols for those within 20 km of the eddy centre at the head of Tully Canyon (48.41°N, 125.32°W). The lowest concentrations in the depth range of 100 to 200 m tend to lie close to this centre, suggesting a role for the Juan de Fuca Eddy in the low oxygen levels off southwest Vancouver Island.
Fig. 7 Near-bottom oxygen concentration (ml L−1) in June 1985 on the continental shelf of southwest Vancouver Island. Different symbols denote stations inside and outside a radius of 20 km from the eddy centre.
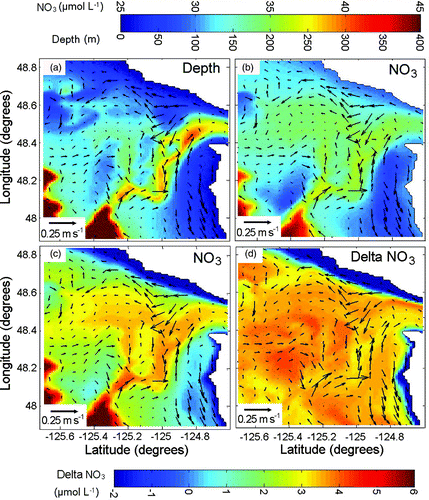
To illustrate the role of the Juan de Fuca Eddy on near-bottom oxygen distribution, we present model simulations of mid-summer flow over the Vancouver Island shelf in . The average, horizontal, near-bottom current vectors are superimposed on bathymetry (a) and on average nitrate fields (b to 8d). We track nitrate because oxygen is not specifically included in this model. As noted later, nitrate and oxygen at the bottom of the Juan de Fuca Eddy vary inversely in concentration, so high nitrate distribution is qualitatively useful to show the regions of upwelling and intrusion of deep, low oxygen water into this eddy. In agreement with observations (Freeland & Denman, Citation1982), the cyclonic Juan de Fuca Eddy extends to the bottom in the model, creating a low-pressure zone in its centre that allows water to be raised from depths greater than those expected from only wind-driven coastal upwelling. The resulting flow in the model carries high-nitrate (and low oxygen) waters along Tully Canyon onto the continental shelf into Juan de Fuca Eddy, as evident in the signature of nitrate-rich water within this eddy (b). In addition, biological processes further increase nitrate in bottom waters of the continental shelf as a result of remineralization of organic matter (c). In the model, both physical transport (b) and biological remineralization (d) contribute in similar magnitude to the increase in nitrate (decrease in oxygen) in the Juan de Fuca Eddy region. Model simulations also show a decrease in bottom current speed in the northern side of the eddy, which would increase the water residence time and local oxidation of organic material in bottom water, further reducing the oxygen concentration in this region.
Fig. 8 Results of a numerical model for the continental shelf of southwest Vancouver Island. All panels present vectors of average near-bottom current with the speed scale at bottom left. (a) Contours of bottom depth (m). (b) Contours of near-bottom nitrate concentration (μmol L−1) for the no-biology run where all biological processes are turned off. (c) Contours of near-bottom nitrate concentration (μmol L−1) for the base run where all the biological source and sink terms are computed. (d) Contours of near-bottom nitrate concentration (μmol L−1) obtained by subtracting nitrate concentrations from the no-biology run to the base run (nitrate in panel (c) minus nitrate in panel (b)).
4 Impact of the Vancouver Island Coastal Current and the Juan de Fuca Eddy
A major difference between the Vancouver Island shelf and the Oregon and Washington shelves is that hypoxic bottom water is not found along the inner shelf of Vancouver Island. Instead, oxygen increases and density decreases toward shore at all depths inside the 100 m contour. This near-shore region marks the Vancouver Island Coastal Current, with a high content of buoyant Juan de Fuca Strait water (Hickey, Thomson, Yih, & LeBlond, Citation1991; Thomson, Hickey, & LeBlond, Citation1990). The composition of seawater in Juan de Fuca Strait is the result of intense mixing in tidal channels, and the surface flow has relatively high concentrations of both nutrients and oxygen. Its presence along the Vancouver Island coast likely prevents denser hypoxic water from reaching shallower depths. In contrast, Chan et al. (Citation2008) and Connolly et al. (Citation2010) report extreme hypoxia (<0.5 ml L−1) in bottom waters less than 50 m deep on the Oregon and Washington continental shelves in summer 2006 and on the Oregon shelf in some summers since 2000, as noted in Section 4b2.
As shown in our model simulation, the cyclonic Juan de Fuca Eddy itself can support upwelling of deep water onto the continental shelf, consistent with Freeland and Denman (Citation1982). This deep water originates on the continental slope, flows along Juan de Fuca Canyon, then along Tully Canyon to reach shelf bottom. The route along Juan de Fuca Canyon and Tully Canyon is more direct than inflow from the west across the continental shelf, because the shelf shoals between LB08 and the continental slope. Freeland and Denman (Citation1982) proposed that the Juan de Fuca Eddy pulls deep water up Tully Canyon; however, a later study with moored current meters (Freeland & McIntosh, Citation1989) revealed that in spring and early summer the upwelling flow along the continental slope actually preceded the flow up Tully Canyon, suggesting that the flow up the canyon is pushed. Whether pushed or pulled, it is this canyon inflow that seems important for upwelled low oxygen water to reach mid-shelf with little mixing en route in the southwest Vancouver Island shelf (Mackas, Denman, & Bennett, Citation1987). At more shallow depths there is more mixing of water masses (MacFadyen, Hickey, & Cochlan, Citation2008).
The summer minimum in bottom oxygen is linked to local upwelling winds, but the annual timing of these two events is not the same. Upwelling winds are strongest in July and disappear by the end of September at weather buoy 46206 at 48° 50.1′N, 125° 59.9′W (Foreman, Pal, & Merryfield, Citation2011), whereas the lowest oxygen concentrations in near-bottom waters of the Juan de Fuca Eddy occur in July to October with evidence for slightly lower concentrations in September to early October than in July and August (see later). We suspect that upwelling of water onto the shelf lags the upwelling winds, and the decay of organic material also contributes to the late-summer timing of the lowest bottom oxygen concentration.
Although upwelling winds contribute to some of the rotation in this eddy and are the likely cause of its peak rotation in summer, tidal mixing near Cape Flattery at the mouth of Juan de Fuca Strait seems to be a main driver and contributor of cyclonic vorticity (Foreman et al., Citation2008). The strong role of tidal mixing likely accounts for the existence of cyclonic vorticity in the Juan de Fuca Eddy even in winter when downwelling winds dominate on the shelf (Freeland & McIntosh, Citation1989). We expect that the eddy-driven upwelling in late summer allows the most hypoxic waters to persist here into October. In contrast, Connolly et al. (Citation2010) found the lowest near-bottom hypoxia on the Washington State shelf in July and August with slightly higher values in September and no hypoxia at all in October, and on the Oregon shelf they found the lowest oxygen from July to mid-September and again no evidence for hypoxia in October. Pierce et al. (Citation2012) describe an annual cycle of near-bottom oxygen with a minimum in July at station NH5 in 50 m of water off Oregon. Therefore, the low oxygen season persists longer in the Juan de Fuca Eddy than along the Oregon and Washington coasts.
c Decadal Variability of Near-Bottom Oxygen in Southern BC
1 Continental shelf
Now that we have established that the lowest sub-surface oxygen concentration on the BC shelf occurs at and near bottom in summer, we turn our attention to decadal variability of near-bottom oxygen in this season. presents a time series of oxygen measurements near the ocean bottom in southern BC (region covered by ). We excluded data from inlets and from the Salish Sea (a collective name for the Strait of Georgia, Puget Sound and Juan de Fuca Strait). Only data from June to September were included. Because samples are from near bottom, the highest oxygen levels are closest to shore where waters are shallow and more easily oxygenated by surface wind mixing, in contrast to the spatial variation of oxygen on the isopycnal surfaces of .
Fig. 9 Near-bottom oxygen concentrations in southern BC from May to September plotted against the year of observation (y-axis) and depth of the ocean bottom in metres (x-axis). Oxygen concentrations (ml L−1) were determined by titrated water samples from hydro-bottles for the years 1934 to 2009 and electronic sensors after 2004. Only observations within 20 m of the ocean bottom are included.
Our search of historical oxygen observations found the earliest measurements in 1934 from a University of Washington survey (). It was not until 1949 that oxygen concentrations below 1.4 ml L−1 (hypoxia) were observed on the continental shelf (<200 m). In 1979, concentrations below 1.0 ml L−1 were measured for the first time on the shelf. Many more low values have been observed since 2000. The distribution of oxygen between 1.0 and 1.4 ml L−1 (blue symbols in ) reveals two clusters of observations between 1979 and 2000. One lies on the continental shelf, generally between 100 and 200 m depth, and a second lies deeper than 300 m. Beginning in 2002 and especially after 2005, these two clusters merge, with many more oxygen concentrations between 1.0 and 1.4 ml L−1 at all depths from 100 to 500 m. Red symbols denote concentrations of 0.5 to 1.0 ml L−1 and are more frequently observed on the continental shelf (< 200 m depth) in 1979 and after 1997. Oxygen concentrations below 0.5 ml L−1 (extreme hypoxia, black crosses) are not observed in waters less than 600 m deep on the Vancouver Island margin.
Although suggests an increase in the occurrence of hypoxia in southern BC shelf waters in recent summers, the sampling programs have changed over the decades, with more observations in recent summers and more observations since the late 1970s off southwest Vancouver Island where hypoxia is more widespread. Therefore, in order to obtain quantitative information on changes, we searched for single stations with long time series. We found Station LB08 (48° 25.3′N, 125° 28.66′W) located in the region of greatest hypoxia in summer, as shown by a solid black arrow in b. This station has been sampled frequently by scientists from Fisheries and Oceans Canada, beginning with the Coastal Ocean Dynamic Experiment (CODE) in 1979 to 1982, then with the Marine Survival of Salmon (MASS) project and continuing into the present La Perouse sampling program. We collected all the data in the archives of Fisheries and Oceans Canada with oxygen and/or nitrate measurements at this station. The results are plotted in .
Fig. 10 Oxygen (ml L−1) and nitrate (μmol kg−1) near bottom at Station LB08, 1978 to 2011. (a) Oxygen concentration versus day of year; (b) comparison of nitrate and oxygen concentrations. The black line has a slope of 9.
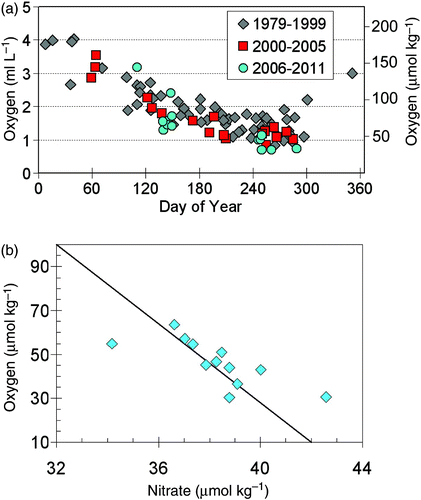
Each oxygen concentration in a is from the deepest sample of each profile. Bottom depth is almost 150 m, and sample depths varied from 145 to 120 m. We prepared a separate graph (not shown) of samples from 125 m only, and the patterns were not appreciably different from a, and usually oxygen was only 0.1 ml L−1 (4.4 μmol kg−1) lower near bottom than at 125 m in summer and early autumn. The lowest concentrations of near-bottom oxygen at LB08 occur from late August to mid-October, which is in general agreement with the temporal distribution of at the mouth of Barkley Sound. Oxygen concentration in a increases from mid-October (red square on 16 October at day 289) to early January coinciding with the most severe autumn and winter storms, and then slowly declines toward hypoxia from February to July. In general, the oxygen concentrations at LB08 from May to June and September to October prior to 2000 were higher than after 2000, matching the trend for the entire shelf of southern BC in summer (). The lowest oxygen concentrations have mostly occurred since 2005.
b presents a graph of the co-variability of oxygen and nitrate near bottom when these two properties were sampled simultaneously at LB08 between days 241 and 289. One expects nitrate concentrations to increase in sub-surface waters as oxygen declines, because of the oxidation of organic matter. The slope of the grey line represents the oxygen/NO3 ratio of 9; its intercept on the y-axis was fitted by eye. (See Whitney et al. (Citation2007) for a discussion of this ratio in the Gulf of Alaska. We selected a value of 9 to represent the range of 8.6 to 9.2 presented by these authors.) As expected, this slope appears to be a reasonable fit to the data, with two outliers perhaps attributed to inaccurate analyses or to water mass change. Therefore the decline in oxygen since 2000 in a is compatible with increased oxidation in subsurface waters.
To examine the decadal variability of oxygen at LB08 we extracted profiles from the archives with measurements of oxygen, temperature, and salinity from late August to mid-October. Observations at standard depths were averaged within each year to prepare a time series with no more than one data point per year. The time series of oxygen (a) shows a decline for the period 1979 to 2011 at both 125 and 100 m, with linear slopes of 0.019 and 0.017 ml L−1 y−1 (0.83 and 0.74 μmol kg−1 y−1), respectively, and an R 2 of 0. 44 and 0.33 and p < 0.006 and 0.001 (assuming each year's data point is statistically independent of the next), respectively. A smaller linear decline of 0.013 ml L−1 y−1 (0.57 μmol kg−1 y−1) per year at 75 m is significant only at p < 0.1. There is even less statistical significance to the linear trend at 50 m and no decrease at shallower depths.
Fig. 11 Oxygen and σt at station LB08 observed between days 241 (29 August) and 289 (16 October) from 1979 to 2011. (a) Oxygen versus year of observation. (b) σt versus year of observation. (c) Oxygen versus σt . Observations for (a) and (b) were averaged within each year prior to plotting. Colours denote depth of observation.
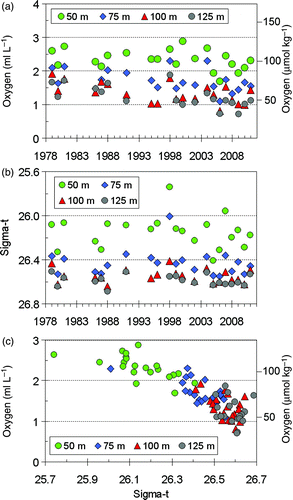
Similar trends in σt from 1978 to 2011 (b) were not observed at the four depths from 50 to 125 m. However, rather large year-to-year variability might mask the tendency for σt to have been greater from 2004 to 2010, when oxygen also tended to be lower. c presents the co-variability of σt and oxygen in the same data. At 50 and 75 m there is clear co-variability in these two properties, with lower oxygen on higher σt surfaces. The outliers with the lowest density occur in 1998. At both 100 and 125 m it is more difficult to see a relationship between σt and oxygen. The years with the lowest oxygen at 125 m (2006 and 2009) have a σt of about 26.61, with seven other years experiencing higher density but also higher oxygen. From b and 11c we conclude that the co-variability of σt and oxygen might explain some of the interannual variability of oxygen between 1979 and 2011 but not the general decline of oxygen at 100 and 125 m over this period.
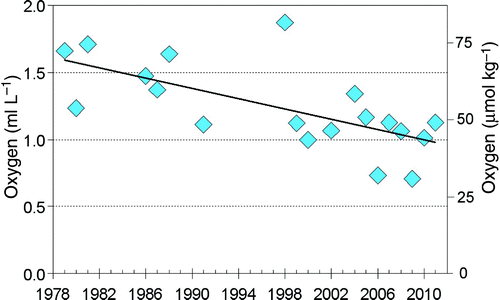
Because the decline in oxygen at 125 m in a is somewhat cluttered, we present in only the observations at 125 m depth. The black line is the linear trend noted for a, with a slope of −0.019 and R 2 of 0.44. The decline at 125 m does not rely solely on the observations from 2006 and 2009. We did not plot the trend over the years for samples collected in May–June (a). We felt there were too few observations in May to be confident in the quantitative value of a trend. In addition, rapid seasonal change in May would interfere with a search for interannual variability. However, one can see in a that there is a qualitative tendency of declining oxygen from 1979 to 2011.
Fig. 12 Oxygen concentration (ml L−1) at 125 m depth at LB08 versus year from the same profiles plotted in a.
2 Continental Slope
A longer time series of oxygen on density surfaces is available on the continental slope along Line P at Station P4 (b). This station lies in 1300 m of water off southwest Vancouver Island. Oxygen concentration has been measured here during almost every Line P cruise since the early 1980s and on several cruises in the early 1960s. We averaged August to September observations in each year, plotting one value per year. As shown in a, there is a decrease in oxygen from the 1980s to present at three of the depths. The lowest oxygen concentrations occurred in 2002, 2005, and 2009. The linear declines are 0.017, 0.025, and 0.024 ml L−1 y−1 (0.74, 1.1, 1.0 μmol kg−1 y−1) at 150, 200 and 250 m depths, respectively, with corresponding R 2 of 0.083, 0.32 and 0.36. Trends at 200 and 250 m are significantly different from zero at p < 0.01, while the trend at 150 m is not significant. Concentration at 100 m does not have a trend over this same interval. Although calculations indicate that oxygen has been decreasing at P4 more rapidly than at LB08 since 1980, the differences are not statistically significant. When observations from the 1960s are included in the calculation of trend, the linear rates of decline are 0.012 ml L−1 y−1 at both 250 and 200 m, with R 2 of 0.20 and 0.15, respectively (p > 0.07).
Fig. 13 Oxygen and σt at station P4 observed between day of year 221 and 272 from 1960 to 2011. (a) Oxygen versus year of observation. (b) σt versus year of observation. (c) Oxygen versus σt . Observations for (a) and (b) were averaged within each year prior to plotting. Colours denote depth of observation.
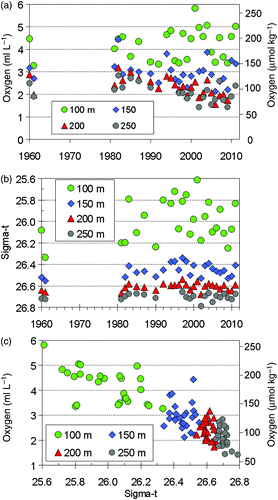
There is no significant linear trend in σt in b. However, at 150 m depth there is a minimum in σt from 1997 to 1998, corresponding to the prolonged El Niño impacts on local waters. We plotted σt versus oxygen concentrations at four depths in c to investigate any tendency for low oxygen concentrations to be caused by uplifting isopycnals. The three years 2002, 2005, and 2009 stand out from other data points at 250 m. These are the three years that provide the most recent lowest oxygen concentrations to the time series of a. However, even in the absence of these three years, a decrease in oxygen at 250 m is still present in this time series. A separate analysis revealed a decline of 0.022 ml L−1 y−1 (0.96 μmol kg−1 y−1) in oxygen on the 26.6 σt surface near P4, not significantly different from the rate of decrease at 200 m depth, close to this density surface.
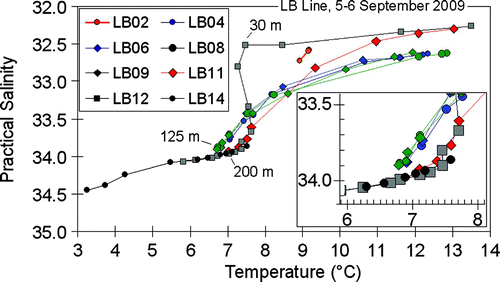
3 Upwelling from the continental slope
Temperature, salinity, and σt at 125 m depth at LB08 are a very close match to those on the same density surface of the continental slope at 200 m. To illustrate this, we extracted observations from the survey along the LB Line in September 2009, plotting T-S profiles of selected stations in . The 200 m depth on slope stations LB12 and LB14 and the 125 m depth of shelf stations LB08 and LB09 are noted in this figure. Their T-S properties are similar, as can be seen in the insert to , suggesting little mixing of slope water upwelled onto the bottom of the shelf at LB08 and nearby locations. At shallower depths, the T-S properties of LB08 diverge from those of LB12 and LB14, indicating more mixing of shelf water with other water masses at these depths.
Fig. 14 Temperature-salinity diagram for stations sampled along the LB Line in September 2009. The inset at bottom right shows an enlarged view of the water properties at the bottom of LB08 and at neighbouring LB stations.
The observations in derive from a single cruise. To determine if slope waters generally upwell onto the shelf at 125 m and deeper with little or no mixing, we examined T, S, oxygen, and σt at 125 m in all the profiles at LB08 from late August to mid-October of 1979 to 2010 presented in and compared these properties to measurements at 200 m depth averaged over all profiles at slope station P4, presented in . The results are listed in , where we also present T, S, and σt from of Thomson and Krassovski (Citation2010) at 200 m depth west of Vancouver Island. Properties between 125 m on the shelf and 200 m on the slope are numerically close (), leading to the conclusion that water at 125 m in the Juan de Fuca Eddy in summer is normally upwelled from about 200 m depth along the continental slope and adjacent canyons, with little en-route mixing. We expect water between 125 m and on the bottom of the shelf also shares properties with the slope water near 200 m depth. We attribute the decline in the oxygen concentration from 2.3 ml L−1 (100 μmol kg−1) at P4 to 1.2 ml L−1 (52 μmol kg−1) at LB08 mostly to oxidation as the upwelled water flows up the slope and while it is on the shelf bottom, as suggested by our model simulations. At shallower depths oxygen concentration increases as the water mass at LB08 is increasingly diluted with subarctic water and Juan de Fuca water, as described by Mackas et al. (Citation1987).
Table 1. Temperature, practical salinity, and σt averaged over all samples collected from late August to late October at specific depths at LB08 and P4, compared to the nominal values computed for Pacific Equatorial Water at 200 m depth west of Vancouver Island, as determined from Thomson and Krassovski (2010; TK2010).
d Comparison with Other Eastern Pacific Regions
Recent studies of decadal variability and trends of sub-surface oxygen concentration have been reported for the Gulf of Alaska at Ocean Station P and waters of the continental margin from southern California to northern BC (). presents these linear trends compared to our observations at P4 and LB08 for the past five decades and the past three decades.
Table 2. Comparison of changes in time of oxygen concentrations and trends at constant depth at various locations along the west coast of the United States and Canada, and at Ocean Station P in the Gulf of Alaska. Rates for Koslow et al. (Citation2011) were determined from of their paper. Gwaii Hanas is the present name for the Queen Charlotte Islands off the northwest British Columbia coast.
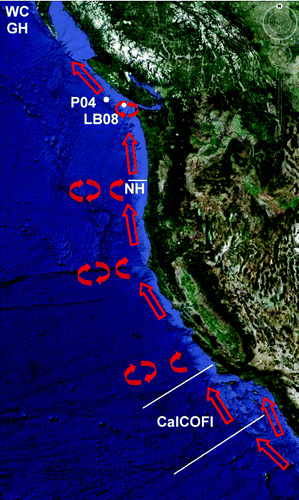
Fig. 15 Pathway of the California Undercurrent and sub-surface eddies formed along its flow (red arrows). The white labels indicate the locations of the studies listed in .
For southern California (CalCOFI region), Bograd et al. (Citation2008) observed a decline in oxygen for the entire domain from near the shore to the abyssal plane. The rate of decline is somewhat greater over the continental slope and in the Southern California Bight, but no numerical value is presented for this sub-region. The CalCOFI trends determined by Koslow et al. (Citation2011) are estimated visually from their and are based on observations at 200 to 400 m depth for the CalCOFI sub-region from San Diego to north of Point Conception and from the coast (approximately 50 m bottom depth) to an average of 400 km offshore. McClatchie et al. (Citation2010) examined trends in the Southern California Bight. All three studies found declines in oxygen from the 1980s to the mid-2000s, attributed to declining oxygen on constant density surfaces, as well as shoaling of these constant density surfaces. McClatchie et al. (Citation2010) and Koslow et al. (Citation2011) examined changes prior to the 1980s and both discovered that oxygen in the 1960s was about as low as in the 2000s.
Studies off Oregon (Pierce et al., Citation2012) and the analysis presented here for Vancouver Island reveal declining oxygen since the 1980s, mostly as a result of changes in oxygen on constant density surfaces. Both studies found some evidence that the trend was either close to zero from the 1960s to 1980s, or even increased slightly. Pierce et al. lacked sufficient observations in the 1980s to prove this trend, and we lack sufficient observations in the 1960s. But when these results are considered together, they provide more support for a break in the slope of the trend in the 1980s.
In contrast, Whitney et al. (Citation2007) and Falkowski et al. (Citation2011) note a general decline in oxygen at Ocean Station P since the late 1950s, both at constant depth surfaces and on constant density surfaces. Declines are greatest at depths of 100 to 300 m. The decadal variability of oxygen on constant density surfaces is mostly in phase with the 18.6 year lunar tidal cycle rather than either the El Niño Southern Oscillation (ENSO) or the Pacific Decadal Oscillation (PDO). There is no evidence of highest concentrations in the 1980s. Cummins and Masson (Citation2012) attribute declines in oxygen at 200 m to decreasing oxygen on isopycnal surfaces, moderated by deepening of isopycnal surfaces.
Changes in the oxygen concentration at P4 off southwest Vancouver Island can be attributed to changes in “upstream” oxygen in the California Undercurrent along the California–Washington slope and also to changes in the easterly flow across the North Pacific Ocean. This conclusion does not eliminate a role for changes in winds (Foreman et al., Citation2011) or in primary productivity, but it does indicate that these processes need not be invoked to account for changes in oxygen concentration at P4 near 200 m depth, at the depth of the continental shelf break.
5 Summary and conclusions
Least oxygenated water below the surface mixed layer of the Gulf of Alaska is found along the continental margin from California to Canada. Low concentrations here are attributed to low oxygen in the source waters of the California Undercurrent, as well as to remineralization of organic material along the continental margin as it flows northward. Oxidation along this northward path is countered by extensive entrainment of deep-sea waters with higher oxygen content (Castro, Chavez, & Collins, Citation2001).
Along the Pacific Canadian continental shelf, near-bottom oxygen is lower in summer off the west coast of Vancouver Island than in more northerly shelf waters. The lowest sub-surface oxygen concentration lies at mid-shelf off southwest Vancouver Island in late summer (August to mid-October) likely resulting from upwelling of deep water in the Juan de Fuca Eddy region. This upwelling is evident by the match of late summer temperature, salinity and density of average water at 200 m depth at station P4, on the southern BC continental slope, to that at 125 m depth at station LB08 on the mid-continental shelf of southwest Vancouver Island and is also evident in numerical model simulations of summer flows.
Despite the close match of temperature and salinity, the oxygen concentration at the bottom of LB08 in late summer is about 1 ml L−1 (44 μmol kg−1) lower than in this water mass on the continental slope at P4 indicating significant oxygen consumption. We attribute this decrease to oxidation of organic matter in the bottom and near-bottom water of the continental margin between P4 and the Juan de Fuca Eddy and within this eddy itself. Results from a numerical model reveal that bottom currents flow into the centre of the Juan de Fuca Eddy in summer from the deeper waters of the continental slope, along the path suggested by the water mass analyses described above. Once on the shelf bottom oxidation of organic material further reduces oxygen concentration.
A decline in oxygen has been observed in bottom water on the southern continental shelf and slope of Vancouver Island over the past several decades. At 125 m depth at station LB08 on the continental shelf of southwest Vancouver Island, oxygen has declined by 0.019 ml L−1 y−1 (0.83 μmol kg−1 y−1) from 1979 to 2011. Similarly, at station P4 on the nearby continental slope in 1300 m of water, oxygen concentration has declined significantly since the early 1980s, at rates of 0.025 and 0.024 ml L−1 y−1 (1.1 and 1.0 μmol kg−1 y−1) at 200 and 250 m depths, respectively. The declines in oxygen at LB08 and P4 mainly result from changes in oxygen on constant density surfaces rather than to upwelling of deeper, more oxygen-depleted waters to shallower depths.
Individual studies have revealed declines in oxygen near 200 m depth since the 1980s at Station P (Cummins & Masson, Citation2012; Falkowski et al., Citation2011; Whitney et al., Citation2007) and along the continental margins of southern California (Bograd et al., Citation2008; Koslow et al., Citation2011; McClatchie et al., Citation2010), Oregon (Pierce et al., Citation2012) and at P4 off Vancouver Island (our study). At 200 m depth (or 200–400 m for Koslow et al., Citation2011), rates of decline among these studies are in the range of 0.02 ± 0.01 ml L−1 y−1 (0.9 ± 0.4 µmol kg−1 y−1). This common rate of decrease suggests that subsurface decreases since the 1980s off Oregon and Vancouver Island can be attributed to oxygen declines in source waters flowing toward the Vancouver Island shelf. It is difficult to be more conclusive because sub-surface waters at Station P generally flow too far to the north to reach the Vancouver Island continental margin (Crawford, Sutherland, & van Hardenberg, Citation2005), and Station P must be considered a proxy for deep sea inflow rather than an actual source.
In contrast, changes from the early 1960s to 1980 were very different among these regions. Off southern California oxygen increased, remained about the same along Oregon and Vancouver Island, and decreased at Station P. The rate of increase off southern California matches the rate of decrease at Station P. These trends are compatible with the notion that the relatively steady oxygen concentrations off Oregon and Vancouver Island from the early 1960s to the 1980s can be attributed to mixing of water masses of southern and eastern origin in the California Undercurrent before their arrival off Oregon and Vancouver Island. However, local processes such as changes in winds, currents, and primary productivity in each region might also have a significant impact on the rates of change of oxygen and cannot be eliminated.
We continue to measure oxygen concentration at the bottom of the continental shelf on oceanographic research cruises and in recent years as a routine part of fisheries trawl surveys. The most intensively trawled bottom depth in BC is near 200 m, where declines in oxygen concentration have been significant during the past three decades. Oxygen at this depth is typically near 1 to 3 ml L−1, and future decreases might significantly impact distribution of the groundfish.
Acknowledgements
Much of the computer-based analysis was undertaken by Nick Bolingbroke. Thanks to Frank Whitney who provided insight during many discussions. This project was funded by the Department of Fisheries and Oceans (DFO) Climate Change Science Initiative. We are indebted to DFO oceanographic research projects and monitoring programs of the past decades, as well as to those scientists of the mid-twentieth century who measured oxygen concentration, temperature, and salinity with great care. Names on the data archives include a significant number of staff at the Institute of Ocean Sciences (IOS) since the 1970s. Prior measurements were undertaken and archived by staff of the Pacific Biological Station, as well as many academics. NEPTUNE Canada provided data at Folger Passage. We relied on the archives of the US National Oceanographic Data Center, as well as Integrated Science Data Management (ISDM) and IOS of Fisheries and Oceans Canada. We thank reviewers for helpful advice.
Related Research Data
References
- Bianucci , L. , Denman , K. L. and Ianson , D. 2011 . Low oxygen and high inorganic carbon on the Vancouver Island shelf . Journal of Geophysical Research , 116 ( C7 ) : C07011 doi:10.1029/2010JC006720
- Bograd , S. J. , Castro , C. G. , Di Lorenzo , E. , Palacios , D. M. , Bailey , H. , Gilly , W. and Chavez , F. P. 2008 . Oxygen declines and the shoaling of the hypoxic boundary in the California Current . Geophysical Research Letters , 35 : L12607 doi:10.1029/2008GL034185
- Castro , C. G. , Chavez , F. P. and Collins , C. A. 2001 . Role of the California Undercurrent in the export of denitrified waters from the eastern tropical North Pacific . Global Biogeochemical Cycles , 15 ( 4 ) : 819 – 830 . doi:10.1029/2000GB001324
- Chan , F. , Barth , J. A. , Lubchenco , J. , Kirincich , A. , Weeks , H. , Peterson , W. T. and Menge , B. A. 2008 . Emergence of anoxia in the California Current large marine ecosystem . Science , 319 ( 5865 ) : 920 doi:10.1126/science.1149016
- Connolly , T. P. , Hickey , B. M. , Geier , S. L. and Cochlan , W. P. 2010 . Processes influencing seasonal hypoxia in the northern California Current System . Journal of Geophysical Research , 115 : C03021 doi:10.1029/2009JC005283
- Crawford, W., & Irvine, J. (2011). State of physical, biological, and selected fishery resources of Pacific Canadian marine ecosystems in 2010. Department of Fisheries and Oceans, Canadian Science Advisory Secretariat, Research Document 2011/054. x + 163 p. Retrieved from http://www.dfo-mpo.gc.ca/csas-sccs/Publications/ResDocs-DocRech/2011/2011_054-eng.pdf
- Crawford , W. , Sutherland , P. and van Hardenberg , P. 2005 . Cold water intrusion in the eastern Gulf of Alaska in 2002 . Atmosphere-Ocean , 43 ( 2 ) : 119 – 128 . (doi:10.3137/ao.430201)
- Crawford , W. R. , Brickley , P. J. and Thomas , A. C. 2007 . Mesoscale eddies dominate surface phytoplankton in northern Gulf of Alaska . Progress in Oceanography , 75 ( 2 ) : 287 – 303 . (doi:10.1016/j.pocean.2007.08.016)
- Cummins , P. and Masson , D. 2012 . Wind-driven variability of dissolved oxygen below the mixed layer at Station P . Journal of Geophysical Research – Oceans , 117 : C08015 doi:10.1029/2011JC007847
- Dewey, R. K. (1987). Turbulent energy dissipation over the continental shelf (Ph.D. Thesis). The University of British Columbia, Canada.
- Emerson , S. , Watanabe , Y. W. , Ono , T. and Mecking , S. 2004 . Temporal trends in apparent oxygen utilization in the upper pycnocline of the North Pacific: 1980–2000 . Journal of Oceanography , 60 : 139 – 147 . doi:10.1023/B:JOCE.0000038323.62130.a0
- Falkowski , P. G. , Algeo , T. , Codispoti , L. , Deutsch , C. , Emerson , S. , Hales , B. , Huey , R. B. , Jenkins , W. J. , Kump , L. R. , Levin , L. A. , Lyons , T. W. , Nelson , N. B. , Schofield , O. S. , Summons , R. , Talley , L. D. , Thomas , E. , Whitney , F. and Pilcher , C. B. 2011 . Ocean deoxygenation: Past, present, and future . EOS, Transactions of the American Geophysical Union , 92 ( 46 ) : 409 – 410 . (doi:10.1029/2011EO460001)
- Foreman , M. G. G. , Callendar , W. , MacFadyen , A. , Hickey , B. M. , Thomson , R. E. and Di Lorenzo , E. 2008 . Modeling the generation of the Juan de Fuca Eddy . Journal of Geophysical Research , 113 doi:10.1029/2006JC004082
- Foreman , M. G. G. , Pal , B. and Merryfield , W. J. 2011 . Trends in upwelling and downwelling winds along the British Columbia shelf . Journal of Geophysical Research , 115 : C10023 doi:10.1029/2011JC006995
- Freeland , H. J. and Denman , K. L. 1982 . A topographically controlled upwelling centre off southern Vancouver Island . Journal of Marine Research , 40 ( 4 ) : 1069 – 1093 .
- Freeland , H. J. and McIntosh , P. 1989 . The vorticity balance on the southern British Columbia continental shelf . Atmosphere-Ocean , 27 ( 4 ) : 643 – 657 . (doi:10.1080/07055900.1989.9649359)
- Grantham , B. A. , Chan , F. , Nielsen , K. J. , Fox , D. S. , Barth , J. A. , Huyer , A. , Lubchenco , J. and Menge , B. A. 2004 . Upwelling-driven nearshore hypoxia signals ecosystem and oceanographic changes in the northeast Pacific . Nature , 429 : 749 – 754 . doi:10.1038/nature02605
- Haidvogel , D. B. , Arango , H. G. , Hedstrom , K. , Beckmann , A. , Malanotte-Rizzoli , P. and Shchepetkin , A. F. 2000 . Model evaluation experiments in the North Atlantic Basin: Simulations in nonlinear terrain following coordinates . Dynamics of Atmospheres and Oceans , 32 : 239 – 281 . (doi:10.1016/S0377-0265(00)00049-X)
- Hickey , B. M. , Thomson , R. E. , Yih , H. and LeBlond , P. H. 1991 . Velocity and temperature fluctuations in a buoyancy-driven current off Vancouver Island . Journal of Geophysical Research , 96 ( C6 ) : 10507 – 10538 . (doi:10.1029/90JC02578)
- Hofmann , A. F. , Peltzer , E. T. , Walz , P. M. and Brewer , P. G. 2011 . Hypoxia by degrees: Establishing definitions for a changing ocean . Deep Sea Research Part I , 58 ( 5 ) : 645 – 663 . doi:10.1016/j.dsr.2011.09.004
- Keeling , R. , Kortzinger , A. and Gruber , N. 2010 . Ocean deoxygenation in a warming world . Annual Review of Marine Science , 2 : 199 – 229 . doi:10.1146/annurev.marine.010908.163855
- Koslow , J. A. , Goericke , R. , Lara-Lopez , A. and Watson , W. 2011 . Impact of declining intermediate-water oxygen on deepwater fishes in the California Current . Marine Ecology Progress Series , 436 : 207 – 218 . doi:10.3354/meps09270
- MacFadyen , A. , Hickey , B. M. and Cochlan , W. P. 2008 . Influences of the Juan de Fuca Eddy on circulation, nutrients, and phytoplankton production in the northern California Current System . Journal of Geophysical Research – Oceans , 113 ( C08008 ) doi:10.1029/2007JC004412
- Mackas , D. L. 1992 . Seasonal cycle of zooplankton off southwestern British Columbia: 1979–89 . Canadian Journal of Fisheries and Aquatic Sciences , 49 : 903 – 921 . (doi:10.1139/f92-101)
- Mackas , D. M. , Denman , K. L. and Bennett , A. F. 1987 . Least squares multiple tracer analysis of water mass composition . Journal of Geophysical Research , 92 ( C3 ) : 2907 – 2918 . (doi:10.1029/JC092iC03p02907)
- McClatchie , S. , Goericke , R. , Cosgrove , R. , Auad , G. and Vetter , R. 2010 . Oxygen in the Southern California Bight: Multidecadal trends and implications for demersal fisheries . Geophysical Research Letters , 37 ( 19 ) : L19602 doi:10.1029/2010GL044497
- NEPTUNE Canada. (2012). NEPTUNE Canada: Transforming Ocean Science. Retrieved from http://www.neptunecanada.ca/
- Peña , M. A. 2009 . “ Modeling of biogeochemical cycles and climate change on the continental shelf: An example from the Pacific coast of Canada ” . In Proceeding of the Fourth Workshop on the Okhotsk Sea and Adjacent Areas Edited by: Kashiwai , M. and Kantakov , G. 49 – 54 . PICES Sci. Rep. No. 36
- Pickard , G. L. 1961 . Oceanographic features of inlets in the British Columbia mainland coast . Journal of the Fisheries Research Board of Canada , 18 ( 6 ) : 907 – 999 . (doi:10.1139/f61-062)
- Pierce , S. D. , Barth , J. A. , Shearman , R. K. and Erofeev , A. Y. 2012 . Declining oxygen in the Northeast Pacific . Journal of Physical Oceanography , 42 : 495 – 501 . doi:10.1175/JPO-D-11-0170.1
- Shchepetkin , A. F. and McWilliams , J. C. 2005 . The regional oceanic modeling system (ROMS): A split-explicit, free-surface, topography-following-coordinate oceanic model . Ocean Modelling , 9 : 347 – 404 . (doi:10.1016/j.ocemod.2004.08.002)
- Thomson , R. E. , Hickey , B. M. and LeBlond , P. H. 1990 . The Vancouver Island Coastal Current: Fisheries barrier and conduit. Effects of ocean variability on recruitment and an evaluation of parameters used in stock assessment models . Canadian Special Publication of Fisheries and Aquatic Sciences , 108 : 265 – 296 .
- Thomson , R. E. and Krassovski , M. V. 2010 . Poleward reach of the California Undercurrent extension . Journal of Geophysical Research , 115 : C09027 doi:10.1029/2010JC006280
- Tully , J. P. 1942 . Surface non-tidal currents in the approaches to Juan de Fuca Strait . Journal of the Fisheries Research Board of Canada , 5 : 398 – 409 .
- Whitney, F. A. (2009). Spreading hypoxia in deep waters along the west coast. In W. R. Crawford & J. R. Irvine (Eds.), State of physical, biological, and selected fishery resources of Pacific Canadian marine ecosystems. Department of Fisheries and Oceans, Can. Sci. Advis. Sec. Res. Doc. 2009/022. vi + 121 p.
- Whitney , F. A. , Freeland , H. J. and Robert , M. 2007 . Persistently declining oxygen levels in the interior waters of the eastern subarctic Pacific . Progress in Oceanography , 75 : 179 – 199 . doi:10.1016/j.pocean. 2007.08.007