
Abstract
The influence of variations in atmospheric temperature and ozone profiles on the total ozone column (TOC) derived from a Brewer MKII spectrophotometer operating in Thessaloniki, Greece, is investigated using three different sets of ozone absorption cross-sections. The standard Brewer total ozone retrieval algorithm uses the Bass and Paur (1985) cross-sections without accounting for the temperature dependence of the ozone cross-sections which produces a seasonally dependent bias in the measured TOC. The magnitude of this temperature effect depends on the altitude where the bulk of the ozone absorption occurs. Radiosonde measurements for the period 2000 to 2010 combined with climatological ozone profiles were used to calculate the effective temperature of ozone absorption and investigate its effect on the retrieved ozone column. Three different ozone absorption cross-section spectra convolved with the instrument's slit function were used: those of Bass and Paur (hereafter BP), currently used in the standard Brewer retrieval algorithm; those of Brion, Daumont, and Malicet (Malicet et al., 1985; hereafter BDM); and the recently published set by Serdyuchenko et al. (2013 hereafter S13). The temperature dependence of the differential ozone absorption coefficient ranges between 0.09 and 0.13% per degree Celsius for BP, between −0.11 and −0.06% per degree Celsius for BDM, and between 0.018 to 0.022% per degree Celsius for S13, resulting in a seasonal bias in the derived TOC of up to 2%, 1.8%, and 0.4%, respectively. The temperature sensitivity of the differential ozone absorption coefficient for the Brewer spectrophotometer at Thessaloniki for the BP and BDM cross-sections is found to be within the range reported for other Brewer instruments in earlier studies, whereas the seasonal bias in TOC is minimized when using the new S13 cross-sections because of their small temperature dependence.
Résumé
[Traduit par la rédaction] Nous étudions l'influence des variations dans les profils de température atmosphérique et d'ozone sur la colonne d'ozone total dérivée d'un spectrophotomètre Brewer MKII en service à Thessaloniki, en Grèce, au moyen de trois ensembles différents de sections efficaces d'absorption de l'ozone. L'algorithme standard d'extraction de l'ozone total du Brewer utilise les sections efficaces de Bass et Paur (1985) sans tenir compte de la dépendance de la température des sections efficaces de l'ozone, ce qui produit un biais dépendant de la saison dans les colonnes d'ozone total mesurées. La grandeur de cet effet de la température dépend de l'altitude où se produit le gros de l'absorption de l'ozone. Nous nous sommes servis de mesures de radiosonde pour la période 2000 à 2010 de pair avec des profils d'ozone pour calculer la température effective d'absorption de l'ozone et étudier son effet sur la colonne d'ozone extraite. Nous avons utilisé trois spectres différents de sections efficaces d'absorption de l'ozone convolués avec la fonction de fente de l'instrument : celles de Bass et Paur (ci-après BP), présentement utilisées dans l'algorithme conventionnel d'extraction du Brewer; celles de Brion, Daumont et Malicet (Malicet et al. 1995; ci-après BDM); et l'ensemble récemment publié par Serdyuchenko et al. (2013; ci-après S13). La dépendance de la température du coefficient d'absorption différentielle de l'ozone varie entre 0,09 et 0,13% par degré Celsius pour BP, entre −0,11 et −0,06% par degré Celsius pour BDM et entre 0,018 et 0,022% par degré Celsius pour S13, ce qui donne un biais saisonnier dans les colonnes d'ozone total dérivées de jusqu’à 2%, 1,8% et 0,4%, respectivement. Nous trouvons que la sensibilité à la température du coefficient d'absorption différentielle de l'ozone pour le spectrophotomètre Brewer de Thessaloniki pour les sections efficaces de BP et de BDM est dans l'intervalle signalé pour d'autres instruments Brewer dans des études antérieures alors que le biais saisonnier dans la colonne d'ozone total est réduit lorsqu'on utilise les nouvelles sections efficaces S13 à cause de leur faible dépendance de la température.
1 Introduction
Stratospheric ozone is expected to return to its pre-1980 levels over the next few decades because of the reduction in ozone-depleting substances (ODS) as a result of the implementation of the Montreal Protocol. At the same time, other factors, mostly related to climate change, will influence the recovery of the ozone layer from the effects of ODSs and will affect the detection and attribution of the recovery of the ozone layer (CCSP, Citation2008; WMO, Citation2011). At extra-polar latitudes, the signal of these effects on the total ozone column (TOC) is greatly masked by the natural variability of ozone, introducing difficulties in the detection of the corresponding TOC changes; hence, it follows from the above that widespread, reliable, and high quality measurements of TOC are of great importance.
Total ozone is calculated by remote-sensing techniques using both ground- and satellite-based instruments that measure radiances in the ultraviolet (UV) absorption spectrum of ozone between 300 and 340 nm. Satellite-based instruments measure TOC daily and at a global scale, but an important disadvantage is the inhomogeneity of the datasets from the satellite-based instruments resulting from their limited lifespan and differences in their measurement and retrieval methodologies. Ground-based instruments measure TOC at a specific location, but they have the advantage of constant calibration and longer lifetimes; this provides consistent and valuable information for long-term TOC trends enabling validation of satellite data. Ground-based TOC measurements have been performed regularly since 1958, the International Geophysical Year, when the need for TOC measurements was clearly demonstrated, and the first world-wide network of Dobson spectrophotometers was created. The spectrophotometer was developed by G.M.D. Dobson in the 1920s and 1930s and was fully refurbished in 1957 (Staehelin, Kerr, Evans, & Vanicek, Citation2003). In the 1980s the Brewer spectrophotometer (Kerr, McElroy, & Olafson, Citation1981) became commercially available. Even though the TOC retrieval from both instruments is based on the same principles, the Brewer spectrophotometer is designed for completely automated operation, allowing simultaneous measurements of the O3 column and SO2 column, which absorb strongly in the same spectral range as O3. Moreover, the Brewer is also capable of measuring UV radiation spectra.
Today, the official Brewer network consists of about 195 instruments installed in 44 different countries throughout the world (Kumharn, Rimmer, Smedley, Ying, & Webb, Citation2012). Brewer spectrophotometer TOC measurements are based on the differential optical absorption spectroscopy (DOAS) technique, which compares the difference between the extraterrestrial and ground intensities, measured at different wavelengths, with known, laboratory-based, ozone absorption cross-sections. On 1 January 1992, the World Meteorological Organization (WMO) adopted a standard ozone cross-section spectrum based on measurements provided by Bass and Paur (Citation1985; hereafter BP), replacing the earlier set of Vigroux (Vigroux Citation1953), following the recommendation of the International Ozone Commission of the International Association of Meteorology and Atmospheric Physics (IAMAP; Megie, Miller, & Bojkov, Citation1991). During the last few years there has been a debate in the scientific community (ACSO, Citation2009; WMO/GAW, Citation2009) about the need to replace the BP cross-sections in Brewer instruments with other high-resolution cross-sections in order to achieve harmonization with other ground-based (e.g., System d'Analyse par Observation Zenithale (SAOZ)) and satellite-based instruments. To examine this possibility the Absorption Cross-Sections of Ozone (ACSO) committee was established in spring 2009 as a joint ad hoc commission of the Scientific Advisory Group (SAG) of the Global Atmosphere Watch (GAW) of the WMO and the International Ozone Commission (IO3C) of the International Association of Meteorology and Atmospheric Sciences (IAMAS; http://igaco-o3.fmi.fi/ACSO/index.html). Because the ozone cross-sections of Malicet et al. (Citation1995; hereafter BDM) have a higher spectral resolution and are believed to have more reliable temperature dependence, many groups consider them more suitable for applications in satellite and some ground-based retrievals (see ACSO (Citation2009) and references therein). However, because the BDM cross-sections were not measured at temperatures below 218 K, extrapolation is required for ozone retrievals over regions with very low temperatures, such as the tropical tropopause. Irrespective of that fact, the ACSO (Citation2009) recommendation would have been to replace the BP cross-sections with the BDM cross-sections; however, in 2012 a new set of high spectral resolution ozone absorption cross-sections measured at 11 different temperatures from 193 K to 293 K at steps of 10 K was published (Gorshelev, Serdyuchenko, Weber, Chehade, & Burrows, Citation2013; Serdyuchenko, Gorshelev, Weber, Chehade, & Burrows, Citation2013), thus the committee postponed the final recommendation until the new data are evaluated by the ground-based and satellite-based instrument communities.
The temperature dependence of the ozone cross-sections is currently ignored in the standard Brewer ozone retrieval algorithm, producing a bias in the measured TOC. This level of dependency has also been reported by Petropavlovskikh et al. (Citation2011) in the retrieval of ozone profiles from Umkehr measurements. Moreover, the temperature dependence of the ozone absorption coefficient affects the aerosol optical depth retrieval from Brewer spectrophotometers (Cheymol & De Backer, Citation2003). In earlier studies the temperature sensitivity of the BP ozone absorption coefficient was estimated to be in the range of 0.001 to 0.11% per degree Celsius (Kerr, Citation2002; Kerr, Asbridge, & Evans, Citation1988; Scarnato, Staehelin, Peter, Grobner, & Stubi, Citation2009; Van Roozendael et al., Citation1998), depending strongly on the characteristics of each instrument (operating wavelengths, slit function shape, and width). During the Sodankylä Total Column Ozone Intercomparison (SAUNA; http://fmiarc.fmi.fi/SAUNA/) campaign Redondas, Evans, Stuebi, Köhler, and Weber (Citation2013) calculated the temperature sensitivity of the BDM ozone absorption coefficient for temperatures of −45°C to be −0.044% per degree Celsius, whereas Scarnato et al. (Citation2009) estimated the temperature sensitivity of three different Brewer spectrophotometers in Arosa, Switzerland, to be in the range of −0.131 to −0.128% per degree Celsius.
In the current study we investigate the sensitivity of the ozone absorption coefficient, calculated from three different ozone cross-section spectra, to temperature variations and the resulting bias of the retrieved TOC from the Brewer instrument located in Thessaloniki, Greece. Furthermore, we estimate the effect on the TOC by replacing the current standard ozone cross-section spectra used in Brewer spectrophotometers with the other two datasets. In the following, we first refer briefly to the ozone retrieval methodology and the temperature dependency of ozone cross-sections. In Section 3, we estimate the effect of the different cross-sections on the resulting ozone column as well as the resulting error; in Section 3c we present the different total ozone time series with and without the calculated temperature correction. A summary of the work, recommendations, and future outlook follow in Section 4.
2 Data and methodology
a Ozone Retrieval with the Brewer Spectrophotometer
A single-monochromator Brewer MKII (serial number #005, hereafter B005) has been operating at the Laboratory of Atmospheric Physics (LAP), University of Thessaloniki, Greece (40.5°N, 22.9°E), since March 1982. B005 was the first commercial Brewer instrument to be deployed worldwide (Bais et al., Citation1989; C. Meleti, personal communication, 2012). During daytime it performs several direct scan (DS) measurements at five selected wavelengths, λi, (nominally: 306.3, 310, 313.5, 316.8, and 320 nm). The total ozone column, X, is then calculated using a relationship with linear combinations of differential absorption and scattering coefficients and spectral radiances, at the four longest wavelengths (λ2 to λ5) (Kerr et al., Citation1981):(1) where B1 represents the extraterrestrial constant, which is determined during the calibration of the instruments, μ stands for the relative optical air mass of the ozone layer, and MS9 is defined as
(2) The Ii in Eq. (2) are the measured intensities at the respective wavelengths, corrected for the dark count, dead time, and Rayleigh scattering; the weighting coefficients wi = (0, +1, −0.5, −2.2, +1.7) were selected to eliminate the effect of aerosol extinction and the absorption of SO2. The exact wavelengths of B005 differ slightly from the nominal ones, and they have been calculated as: λ2→5 = [310.04, 313.49, 316.81, 320.02]. Ideally, these differences in the actual wavelengths would require a change in the weighting coefficients mentioned above, which depend on the SO2 absorption cross-sections and the shape of the slit functions. When we recalculated the ozone weights, following the methodology described by Savastiouk and McElroy (Citation2005), with two different sets of SO2 absorption cross-sections (McGee & Burris, Citation1987; Vandaele, Simon, Guilmot, Carleer, & Colin, Citation1994) and two different representations of the slit functions (measured and trapezoid), significant differences were encountered between different combinations of SO2 cross-sections and slit functions. This implies that the calculation of the weighting coefficients is very sensitive to these factors; therefore, all the calculations presented here refer to the actual wavelength settings of B005 and the nominal weighting coefficients. The differential ozone absorption coefficient is Δα, derived from the BP ozone absorption coefficients ai for a fixed temperature of −45°C:
(3) In reality, the absorption coefficients depend on temperature; as temperature changes with altitude, the absorption of solar radiation by ozone also changes. Therefore, for an accurate retrieval of TOC the actual temperature at all altitudes must be taken into account. However, the methodology of TOC retrieval from ground measurements does not allow partitioning of the ozone absorption at different atmospheric levels. A way to cope with this is to assume an “effective” ozone absorption coefficient which is derived from temperature dependent absorption cross-sections taking into account the vertical profiles of ozone and temperature, detailed in Section 2b. The ozone cross-sections at a fixed temperature are used in the standard Brewer algorithm because the bulk of the ozone absorption occurs in the stratosphere, with an assumed constant temperature of −45°C, and because there was a lack of accurately measured cross-sections at different temperatures at the time of the software development (Savastiouk, Citation2005).
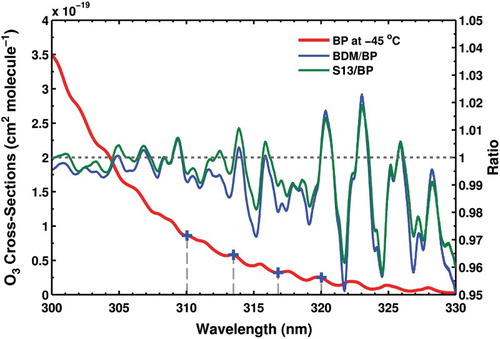
The ozone absorption cross-sections are usually measured in the laboratory at a few temperatures, and all other temperatures are derived by interpolation. Orphal (Citation2003) showed that the best temperature fit for the ozone cross-sections in the Huggins band is a quadratic polynomial. In our analysis we used the parameterization provided by ACSO (IGACO-O3, Citation2012) for the BP cross-sections. For the BDM spectra, a quadratic parameterization is derived from the cross-sections at four temperatures, 218, 228, 243, and 295 K (IGACO-O3, Citation2012), excluding the data at 273 K following the suggestion of Liu, Chance, Sioris, and Kurosu (Citation2007). Finally, the temperature parameterization provided by the Molecular Spectroscopy Laboratory at the Institute of Environmental Physics, University of Bremen (Citation2012), was used for the set of S13. The BP and BDM cross-sections are provided at a spectral resolution of 0.05 and 0.01 nm, respectively, and for air wavelengths, while the resolution of the S13 data is 0.01 nm but in vacuum wavelengths. Thus, the latter cross-sections were converted to air wavelengths, using the “vac2air” tool of the libRadtran radiative transfer package (Mayer & Kylling, Citation2005), and the BP cross-sections were interpolated to 0.01 nm wavelength steps, so that all sets are at the same spectral resolution in the 300–325 nm range. The interpolation of BP to a resolution of 0.01 nm has a negligible effect on the calculation of the differential ozone absorption coefficient. shows the BP cross-sections for a temperature of −45°C, as well as the ratio of BDM and S13 data to BP data at the same temperature. All ozone cross-sections have been convolved with the slit function of B005. In the relevant range for TOC retrieval, 310–320 nm, the ratios have the same spectral structure of up to about 5% peak-to-peak, which is outside the range of experimental uncertainty (Serdyuchenko et al., Citation2013) and is obviously introduced by the BP dataset. Savastiouk and McElroy (personal communication, 2010) estimated that a possible change from the BP to BDM ozone cross-section dataset would result in a reduction of approximately 3% in the retrieved TOC.
Fig. 1 The spectrum of the BP ozone absorption cross-sections at −45°C (left axis, red line). The ratio (right axis) of the S13 (green line) and BDM (blue line) cross-sections to the BP cross-sections at a temperature of −45°C. The blue crosses on the figure indicate the operating wavelengths of B005.
b Temperature Dependence of the Differential Ozone Absorption Coefficient
In order to investigate the effect of the temperature dependence of the differential ozone absorption coefficient Δα on the TOC calculation, we followed an approach similar to that of Komhyr, Mateer, and Hudson (Citation1993) for the estimation of the temperature dependence of the ozone absorption coefficients in Dobson spectrophotometers which was applied by Van Roozendael et al. (Citation1998) in both Dobson and Brewer spectrophotometers. To derive the coefficient Δα from Eq. (3) for different temperatures, first the effective absorption coefficient α(λ, Teff) was derived as a function of temperature (Orphal, Citation2003):(4) The wavelength-dependent coefficients of the quadratic c0–c2 are convolved with the four slit functions of the instruments, assuming a trapezoid shape, with full width at half maximum (FWHM) of 0.5325, 0.5470, 0.5380, and 0.5335 nm, respectively. Equation (4) is applied for an effective ozone temperature calculated as:
(5) where the air temperature (T) and ozone amount (O3) are functions of altitude (z).
The temperature vertical profiles used in Eq. (5) were derived from radiosondes launched from Thessaloniki airport (about 13 km from the location of B005) two to three times each day by the Hellenic National Meteorological Service, depending on the time of year. In our analysis we use temperature profiles recorded from 2000 to 2010 downloaded from the Atmospheric Soundings portal at the University of Wyoming (Citation2012). Because there are no simultaneous ozone profile measurements at Thessaloniki, we chose to use an extended version of the Labow, Logan, McPeters (LLM) ozone profile climatology (McPeters & Labow, Citation2012). This climatology is based on merged ozone profile data from 22 years (1988–2010) of ozone soundings with data from the Aura Microwave Limb Sounder (MLS) (2004–10) into monthly 10° latitude bands. It consists of 65 vertical layers at altitude intervals of 1 km. The main reasons for choosing the above ozone climatology are the high vertical resolution of the profiles and the fact that it has recently been updated up to 2010; hence, it includes the period of the current study. An extended version of this climatology is also used in the Total Ozone Mapping Spectrometer (TOMS) v8 algorithm (Lamsal, Weber, Labow, & Burrows, Citation2007).
The majority of the radiosonde balloons burst in the stratosphere between 23 and 32 km. In our analysis we used only those with data above 20 km, and we extrapolated the temperature profiles up to 50 km, using mid-latitude seasonal standard atmospheric profiles. The resolution of the ozone profile is limited to 1 km by the climatological profiles we used; therefore, the integration is carried out for layers of 1 km.
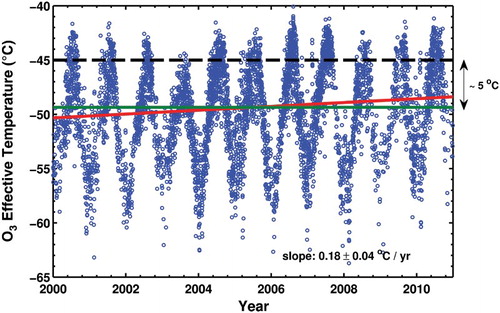
Finally, the differential ozone absorption coefficient at each effective temperature is calculated using:(6) The ozone effective temperature at Thessaloniki during the eleven-year period of this study derived from Eq. (5) using data from 4973 radiosondes are shown in . The temperature ranges from −40° to −63°C, with a mean value of −49.36°C and show an increasing tendency of 0.18 ± 0.04°C per year. A similar trend (0.16 ± 0.04°C per year) was found for the temperature data at 30 hPa, which suggests that the trend found for the effective temperature has not been influenced by other factors, such as the use of climatological ozone profiles or the extrapolation of the measured temperature profiles above the balloon burst height. As shown in , depending on the time of year, the effective temperature for the ozone absorption may be up to 15°C below the assumed temperature of −45°C. In addition, this variation shows a clear seasonal pattern that could have influenced the retrieved TOC.
Fig. 2 Calculated effective temperature for ozone absorption over Thessaloniki for the period 2000–10. The dashed black line indicates the −45°C temperature used in the standard Brewer ozone retrieval algorithm and the green line the mean temperature, −49.36°C, for the period. The red line shows the trend of the ozone effective temperature.
3 Results and discussion
a Temperature Sensitivity of the Differential Ozone Absorption Coefficient
To estimate the temperature sensitivity of the differential ozone absorption coefficient we calculated the first derivative of Eq. (6) for the entire range of the ozone effective temperatures over Thessaloniki and then we expressed it as a percentage at each effective temperature:(7) The percentage gradient for the BP spectra is shown in (blue line) and ranges from 0.089 to 0.125% per degree Celsius, exhibiting a negative temperature dependence (increasing with decreasing temperature) for the ozone effective temperature range over Thessaloniki. These estimates are similar to those reported by Van Roozendael et al. (Citation1998), which range from 0.11 to 0.15% per degree Celsius for a similar temperature range between −45° and −70°C. The value of the gradient at the effective temperature of −45°C, 0.0967% per degree Celsius, is comparable with other estimates summarized in Table 4 of Scarnato et al. (Citation2009), as well as with the value of 0.09% per degree Celsius calculated by Redondas et al. (Citation2013) (see also ). These differences are mainly a result of the different characteristics (slit function and operational wavelengths) of the instruments considered. Therefore, the calculations shown in this study are valid for B005 and should only be considered indicative for other Brewer instruments. Scarnato et al. (Citation2009) showed that the adoption of instrument-dependent weighting coefficients could significantly alter, or even cancel, the temperature dependence of the differential ozone absorption coefficient. However, as discussed in Section 2a, replacement of the weighting coefficients of a Brewer is not a straightforward procedure and involves significant uncertainties.
Fig. 3 Temperature sensitivity of the differential ozone absorption coefficient for B005 for the ozone effective temperature range over Thessaloniki derived for BP (blue), BDM (green), and S13 (red). The filled circles correspond to the gradient at −45°C calculated for each cross-section dataset.
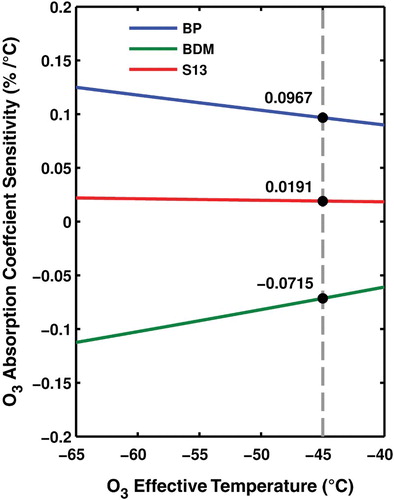
Table 1. Temperature dependence of the differential ozone absorption coefficient calculated for three different ozone cross-sections in different studies, using the nominal Brewer weighting coefficients.
In contrast, the gradient is positive for the BDM spectra (, green line), ranging from −0.1124 to −0.0609% per degree Celsius exhibiting a sensitivity to temperature of similar magnitude to the BP dataset, though of opposite sign. At −45°C the sensitivity is −0.0715% per degree Celsius, about 1.5 times lower than calculated by Scarnato et al. (Citation2009) and close to two times higher than in Redondas et al. (Citation2013). In the latter study the temperature dependence of the cross-sections was calculated from data at five temperatures, while in our study the calculation was carried out at only four. When we used data at five temperatures in our parameterization, the calculated gradient at −45°C was almost halved, resulting in a value similar to the one reported by Redondas et al. (Citation2013). Hence, it appears that the parameterization used to derive the cross-sections at any temperature is very sensitive to the number of data points considered, as also discussed in Scarnato et al. (Citation2009) for the BP cross-sections.
The gradient of the S13 data (, red line) has the same direction as the BP data, but the temperature dependence is much smaller, almost negligible, ranging from 0.0184 to 0.022% per degree Celsius (0.0191% per degree Celsius at −45°C). The observed differences in the magnitude and direction of the gradients are caused by the different spectral features presented by each set of cross-sections (). The parameterization of S13 is based on measurements at more temperatures (eleven points instead of six for BP and four for BDM). Hence, we expect that the temperature sensitivity derived from this dataset is closer to the actual temperature dependence of the differential ozone absorption coefficient for the wavelengths of the Brewer instruments. Moreover, it is closer to the revised value (−0.005% per degree Celsius) calculated by Kerr (Citation2002), using a new methodology that employs measurements of direct solar irradiance with a Brewer spectrophotometer at 45 wavelengths (group scan) which are analyzed with a modified DOAS technique for the retrieval of TOC, SO2, aerosol optical depth at 315 nm, and ozone effective temperature. The results of the current study for all three sets of cross-sections are summarized in together with the findings of the other studies discussed above.
b Error in TOC
The resultant error in TOC retrieval caused by the temperature dependence of the differential ozone absorption coefficient is expressed here as:(8) where the retrieved TOC for a standard temperature of −45°C is referred to as “nominal”, and “revised” is the TOC calculated using the differential absorption coefficient for the time-dependent ozone effective temperature. Combining Eqs (1) and (8) we obtain:
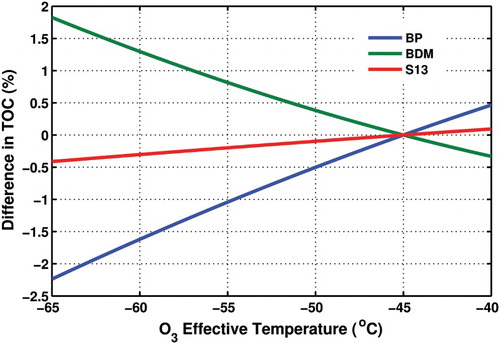
(9) For the range of ozone effective temperatures over Thessaloniki this error can be as high as 2% for the BP and BDM datasets (, blue and green lines, respectively), whereas for the S13 ozone cross-sections, the resultant error is smaller than 0.5% (, red line).
Fig. 4 Expected error in the TOC measured at Thessaloniki because of the deviation of the ozone effective temperature from −45°C.
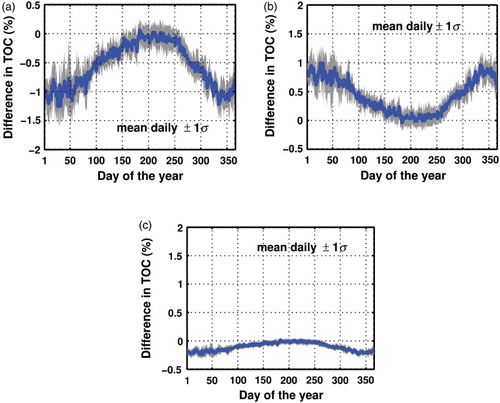
From Eq. (9) we calculated the TOC error for each day in the period 2000–10 with radiosonde data (). In we present the mean seasonal TOC error derived from the mean value for each day for the entire period. This annual cycle, for the case of BP spectra, has a maximum of about 1.2% in winter (a), which is ignored in Brewer ozone retrievals (Van Roozendael et al., Citation1998) and could lead to possible systematic drifts in comparisons between ground-based and satellite-based ozone retrievals. Scarnato et al. (Citation2009) showed that this annual cycle partly explains the systematic seasonal cycle in the difference between TOC measurements of Brewer and Dobson instruments which has already been documented at many mid-latitude sites (Vanicek, Citation2006). Interannual variations in the ozone effective temperature (e.g., resulting from stratospheric temperature trends) would lead to TOC errors with similar variations. Therefore, the TOC correction, ideally, should not rely on climatological values from a long-term temperature dataset, like those shown in , but on actual effective temperatures. The amplitude of the seasonal cycle of the TOC error for the BDM cross-sections is smaller than for the BP cross-sections, with a maximum of about 1% (b), while for S13 cross-sections the amplitude is negligible, on the order of 0.2% (c).
Fig. 5 Seasonal variation of the expected error in the TOC measured at Thessaloniki because of the deviation of the ozone effective temperature from −45°C for (a) BP, (b) BDM, and (c) S13. The blue line is the mean seasonal error for the period 2000–10, and the shaded envelope corresponds to ±1σ of the daily deviations. The absolute range of the y-axis is the same for all graphs, at 2.5%, in order to enable direct comparison of the TOC errors derived from the three sets of cross-sections.
c Post-Correction of TOC Measurements
Based on the temperature sensitivity of the absorption coefficient (blue curve in ), the TOC measurements at Thessaloniki for the period 2000–10 were post-corrected according to the ozone effective temperature for each day. The correction was only applied for the days with available radiosonde data allowing for the calculation of the ozone effective temperature and the corresponding differential ozone absorption coefficient. For the 11 years of this study, the days with both radiosonde and Brewer TOC measurements amounted to 2532 (i.e., approximately 63% of the total). The differences between the corrected data from the original series are shown in .
Fig. 6 Percentage difference between the original TOC series calculated using the BP spectra and the post-corrected for the temperature dependence of ozone cross-sections for the BP spectra. The red line shows a linear fit to the data.
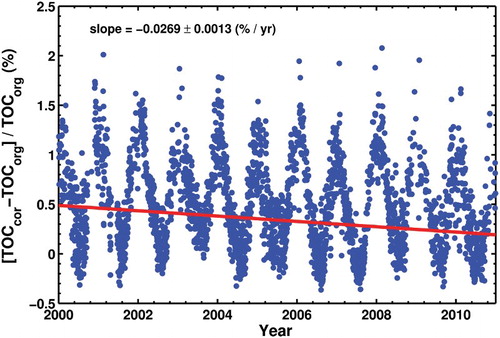
The new TOC values are higher by up to 1.5% in winter, while in summer the difference is less than −0.5%. However, a slightly negative trend of −0.0269 ± 0.0013% per year is introduced because of the positive temperature trend. The post-corrected TOC time series comprises more data from the summer months when the effective temperature is closer to −45°C and the differences from the original TOC are almost negligible. Therefore, the mean difference is slightly biased to smaller values, but assuming that the data availability is evenly distributed amongst the years, the derived trend should not be influenced significantly. Post correction of the entire TOC Thessaloniki dataset, which starts in 1982, would require backward updating of the radiosonde temperature profiles, a dataset that was not available for this study. The alternative would be the combined use of reanalysis data, such as the 40-year reanalysis dataset from the European Centre for Medium-range Weather Forecasts (ERA-40) (Uppala et al., Citation2005), and climatological profiles. The drawback of the latter would be the suppression of the effect from the stratospheric temperature trends that may have occurred during this period, but it might lead to more realistic TOC values.
To estimate the effect of a possible shift from using the BP spectra to using the BDM spectra, we calculated the differential ozone absorption coefficient using the BDM cross-sections, for the wavelengths used in the B005 ozone retrieval algorithm, and we multiplied the TOC values with a factor corresponding to the ratio of the BP differential ozone absorption coefficient to the BDM one. The same procedure was performed to estimate the TOC based on the S13 dataset. The TOC values using the BDM cross-sections are, on average, 3.05% lower than the nominal ones, whereas the TOC values are lower by 0.84% when using the S13 cross-sections.
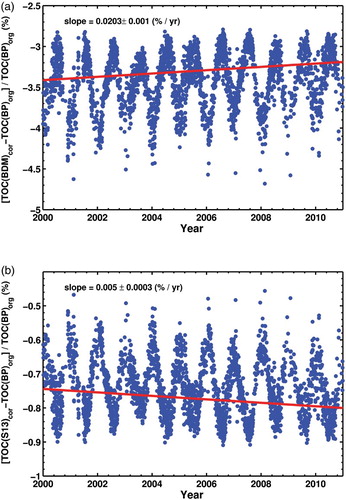
Furthermore, we corrected the new TOC datasets based on BDM and S13 cross-sections for the temperature dependence of these spectra, using the respective curves in . The percentage differences from the original TOC series are presented in . Replacing the BP with the BDM cross-sections would introduce a seasonal offset between −2.8 and −4.5% and a change in the trend of about 0.2% per decade in the TOC time series for Thessaloniki (a). Finally, a change from BP to S13 cross-sections would result in a seasonal offset from −0.9 to −0.5% and a very small change in the trend on the order of 0.05% per decade (b).
Fig. 7 Percentage difference between the original TOC series calculated using the BP spectra and the post-corrected series for the temperature dependence of ozone cross-sections for (a) BDM and (b) S13. Note the different scales of the y-axes in the two panels.
4 Conclusions
Monitoring of TOC has been performed since the 1950s using different ground-based instruments, such as the Brewer, the Dobson, and the SAOZ instruments and also, since the 1970s, using numerous satellite platforms. Different sets of ozone cross-sections are implemented in the TOC retrieval algorithms from these different instruments which makes it difficult to compare them. Furthermore, in the standard Brewer ozone retrieval algorithm, the temperature dependence of the ozone cross-sections is ignored, in contrast to the satellite and SAOZ instruments (see, for example, Hendrick et al., Citation2011). The selection of different cross-sections in the operational algorithms of different instruments, in combination with the differences in dealing with their temperature dependence, may lead to inconsistencies between the various instruments. Hence, the ACSO committee has an ongoing process to harmonize the ozone cross-sections from the various ground- and satellite-based instruments.
In this study, we examined the temperature sensitivity of the ozone absorption coefficients for the B005 instrument operating at Thessaloniki, Greece, arising from three different ozone cross-section spectra from Bass and Paur (Citation1985), Malicet et al. (Citation1995), and Serdyuchenko et al. (Citation2013). All cross-sections exhibit similar temperature behaviour, with their absolute value increasing with increasing temperature; however, their different spectral features result in a very different temperature effect on the differential ozone absorption coefficient for the B005 instrument (e.g., at −45°C the BP sensitivity is 0.0967% per degree Celsius while the BDM and S13 sensitivities are, respectively, −0.0715 and 0.0191% per degree Celsius. In general, for the wavelengths used in the Βrewer instruments, the new S13 dataset seems to have the smallest, almost negligible, temperature dependence. Replacing the BP cross-sections with the BDM cross-sections, for B005, would result in a reduction of the current, nominal TOC, by about 3.05%, while moving to the S13 cross-sections would cause a reduction in the TOC of less than 1% and minimize the necessity of applying corrections for the temperature profile variations.
To ascertain whether this reduction improves, and to what extent, the comparisons between ground-based and satellite-based TOC measurements at the station in Thessaloniki, an evaluation of the differences between the Brewer TOC based on different cross-sections and the TOCs derived from different satellite instruments is currently underway.
Acknowledgements
K. Fragkos would like to thank the Quadrennial Ozone Symposium Committee for financial support to enable his attendance at QOS 2012 to present his work. The authors acknowledge the Atmospheric Soundings portal of the University of Wyoming (http://weather.uwyo.edu/upperair/sounding.html) for providing the radionsonde data and the Total Ozone Mapping Spectrometer (TOMS) at the Goddard Space Flight Center (GSFC) of the NASA science team for the ML ozone climatology (ftp://toms.gsfc.nasa.gov/pub/ML_climatology/).
Funding
The study was partly supported by the European Space Agency's (ESA) Climate Change Initiative (CCI) programme for ozone.
References
- ACSO (Absorption Cross Sections of Ozone). (2009). Summary of the first ACSO plenum meeting, 11–13 May, Geneva. ACSO. Retrieved from http://igaco-o3.fmi.fi/ACSO/files/ACSO_ozone_theme_meeting_09_sum mary_report.pdf
- Bais, A. F., Kelessis, A., Ziomas, I. C., Zerefos, C. S., Amanatidis, G., & Tourpali, K. (1989). Six years of regular ozone observations with a Brewer spectrophotometer at Thessaloniki, Greece. In R. D. Bojkov & P. Fabian (Eds.), Proc. Quadrennial Ozone Symposium, Göttingen, Germany (pp. 713–716). Hampton, VA: A. Deepak.
- Bass, A. M., & Paur, R. J. (1985). The ultraviolet cross-sections of ozone: I. The measurements II. Results and temperature dependence, in atmospheric ozone. In C. Zerefos & A. Ghazi (Eds.), Proceedings of the Quadrennial Ozone Symposium, Halkidiki, Greece (pp. 606–616). Dordrecht: Reidel.
- CCSP (Climate Change Science Program). (2008). Trends in emissions of ozone-depleting substances, ozone layer recovery, and implications for ultraviolet radiation exposure. A report by the U.S. Climate Change Science Program and the Subcommittee on Global Change Research. A. R. Ravishankara, M. J. Kurylo, & C. A. Ennis (Eds.). Asheville, NC, USA: Department of Commerce, NOAA's National Climatic Data Center.
- Cheymol, A., & De Backer, H. (2003). Retrieval of the aerosol optical depth in the UV-B at Uccle from Brewer ozone measurements over a long time period 1984–2002. Journal of Geophysical Research, 108, 4800. doi: 10.1029/2003JD003758
- Gorshelev, V., Serdyuchenko, A., Weber, M., Chehade, W., & Burrows, J. P. (2013). High spectral resolution ozone absorption cross-sections – Part 1: Measurements, data analysis and comparison with previous measurements around 293 K. Atmospheric Measurement Techniques Discussions, 6, 6567–6611. doi: 10.5194/amtd-6-6567-2013
- Hendrick, F., Pommereau, J.-P., Goutail, F., Evans, R. D., Ionov, D., Pazmino, A., … Van Roozendael, M. (2011). NDACC/SAOZ UV-visible total ozone measurements: Improved retrieval and comparison with correlative ground-based and satellite observations. Atmospheric Chemistry and Physics, 11, 5975–5995. doi:10.5194/acp-11-5975-2011
- IGACO-O3 (Integrated Global Atmospheric Chemistry Observations-O3). (2012). Ozone cross sections [Data]. Retreived from http://igaco-o3.fmi.fi/ACSO/cross_sections.html
- Kerr, J. B. (2002). New methodology for deriving total ozone and other atmospheric variables from Brewer spectrophotometer direct sun spectra. Journal of Geophysical Research D: Atmospheres, 107(23). doi:10.1029/2001JD001227
- Kerr, J. B., Asbridge, I. A., & Evans, W. F. J. (1988). Intercomparison of total ozone measured by the Brewer and Dobson spectrophotometers at Toronto. Journal of Geophysical Research, 93(D9), 1129–1140. doi: 10.1029/JD093iD09p11129
- Kerr, J. B., McElroy, C. T., & Olafson, R. A. (1981). Measurements of total ozone with the Brewer spectrophotometer. In J. London (Ed.), Proc. Quadrennial Ozone Symposium, 1980. Boulder, CO: National Center for Atmospheric Research.
- Komhyr, W. D., Mateer, C. L., & Hudson, R. D. (1993). Effective Bass-Paur 1985 ozone absorption coefficients for use with Dobson ozone spectrophotometers. Journal of Geophysical Research, 98(D11), 20451–20465. doi: 10.1029/93JD00602
- Kumharn, W., Rimmer, J. S., Smedley, A. R. D., Ying, T. Y., & Webb, A. R. (2012). Aerosol optical depth and the global Brewer network: A study using U.K.- and Malaysia-based Brewer spectrophotometers. Journal of Atmospheric and Oceanic Technology, 29(6), 857–866. doi: 10.1175/JTECH-D-11-00029.1
- Lamsal, L. N., Weber, M., Labow, G., & Burrows, J. P. (2007). Influence of ozone and temperature climatology on the accuracy of satellite total ozone retrieval. Journal of Geophysical Research, 112, D02302. doi: 10.1029/2005JD006865
- Liu, X., Chance, K., Sioris, C. E., & Kurosu, T. P. (2007). Impact of using different ozone cross sections on ozone profile retrievals from Global Ozone Monitoring Experiment (GOME) ultraviolet measurements. Atmospheric Chemistry and Physics, 7, 3571–3578. doi: 10.5194/acp-7-3571-2007
- Malicet, J., Daumont, D., Charbonnier, C., Parisse, A., Chakir, A., & Brion, J. (1995). Ozone UV spectroscopy. II. Absorption cross-sections and temperature dependence. Journal of Atmospheric Chemistry, 21, 263–273. doi: 10.1007/BF00696758
- Mayer, B., & Kylling, A. (2005). Technical note: The libRadtran software package for radiative transfer calculations – description and examples of use. Atmospheric Chemistry and Physics, 5, 1855–1877. doi: 10.5194/acp-5-1855-2005
- McGee, T., & Burris, J. J. (1987). SO2 absorption cross sections in the near UV. Journal of Quantitative Spectroscopy & Radiative Transfer, 37, 165–182. doi: 10.1016/0022-4073(87)90020-3
- McPeters, R. D., & Labow, G. J. (2012). Climatology 2011: An MLS and sonde derived ozone climatology for satellite retrieval algorithms. Journal of Geophysical Research, 117, D10303. doi: 10.1029/2011JD017006
- Megie, G. J., Miller, A. J., & Bojkov, R. D. (1991). Recommendations for implementation of the I.16–24 PART I. Measurement of meteorological variables Bass-Paur ozone absorption coefficients. Ozone Commission of the International Association of Meteorology and Atmospheric Physics (IAMAP), Geneva.
- Orphal, J. (2003). A critical review of the absorption cross-sections of O3 and NO2 in the ultraviolet and visible. Journal of Photochemistry and Photobiology A: Chemistry, 157(2-3), 185–209. doi: 10.1016/S1010-6030(03)00061-3
- Petropavlovskikh, I., Evans, R., McConville, G., Oltmans, S., Quincy, D., Lantz, K., … Flynn, L. (2011). Sensitivity of Dobson and Brewer Umkehr ozone profile retrievals to ozone cross-sections and stray light effects. Journal of Atmospheric Measurement Techniques, 4, 1841–1853. doi:10.5194/amt-4-1841-2011
- Redondas, A., Evans, R., Stuebi, R., Köhler, U., & Weber, M. (2013). Evaluation of the use of five laboratory determined ozone absorption cross sections in Brewer and Dobson retrieval algorithms. Atmospheric Chemistry and Physics Discussions, 13, 22979–23021. doi: 10.5194/acpd-13-22979-2013
- Savastiouk, V. (2005). Improvements to the direct-sun ozone observations taken with the Brewer spectrophotometer. (Ph.D. Thesis). York University, Toronto.
- Savastiouk, V., & McElroy, C. T. (2005). Brewer spectrophotometer total ozone measurements made during the 1998 Middle Atmosphere Nitrogen Trend Assessment (MANTRA) Campaign. Atmosphere-Ocean, 43(4), 315–324. doi: 10.3137/ao.430403
- Scarnato, B., Staehelin, J., Peter, T., Grobner, J., & Stubi, R. (2009). Temperature and slant path effects in Dobson and Brewer total ozone measurements. Journal of Geophysical Research, 114, D24303. doi: 10.1029/2009JD012349
- Serdyuchenko, A., Gorshelev, V., Weber, M., Chehade, W., & Burrows, J. P. (2013). High spectral resolution ozone absorption cross-sections – Part 2: Temperature dependence. Atmospheric Measurement Techniques Discussions, 6, 6613–6643. doi: 10.5194/amtd-6-6613-2013
- Staehelin, J., Kerr, J., Evans, R., & Vanicek, K. (2003). Comparison of total ozone measurements of Dobson and Brewer spectrophotometers and recommended transfer functions. (WMO TD No. 1147). WMO. Retrieved from ftp://ftp.wmo.int/Documents/PublicWeb/arep/gaw/gaw149.pdf
- University of Bremen. (2012). O3 Spectra [Database]. Molecular Spectroscopy Laboratory of the Institute of the Environmental Physics. Retreived from http://www.iup.uni-bremen.de/gruppen/molspec/databases/referencespectra/o3spectra2011/index.html
- University of Wyoming. (2012). Department of Atmospheric Science: Weat-her [Data]. Retrieved from http://weather.uwyo.edu/upperair/sounding.html
- Uppala, S. M., KÅllberg, P. W., Simmons, A. J., Andrae, U., Bechtold, V. D. C., Fiorino, M., … Woollen, J. (2005). The ERA-40 re-analysis. Quarterly Journal of the Royal Meteorological Society, 131, 2961–3012. doi: 10.1256/qj.04.176
- Vandaele, A. C., Simon, P. C., Guilmot, J. M., Carleer, M., & Colin, R. (1994). SO2 absorption cross section measurement in the UV using a Fourier transform spectrometer. Journal of Geophysical Research, 99(D12), 25599–25605. doi: 10.1029/94JD02187
- Vanicek, K. (2006). Differences between ground Dobson, Brewer and satellite TOMS-8, GOME-WFDOAS total ozone observations at Hradec Kralove, Czech. Atmospheric Chemistry and Physics, 6, 5163–5171. doi: 10.5194/acp-6-5163-2006
- Van Roozendael, M., Peeters, P., Roscoe, H. K., De Backer, H., Jones, A. E., Bartlett, L., … Simon, P. C. (1998). Validation of ground-based visible measurements of total ozone by comparison with Dobson and Brewer spectrophotometers. Journal of Atmospheric Chemistry, 29(1), 55–83. doi: 10.1023/A:1005815902581
- Vigroux, E. (1953). Contribution a l'étude expérimentale de l' absorption de l' ozone. Annales de Physique, 8, 709–762.
- WMO (World Meteorological Organization). (2011). Scientific Assessment of Ozone Depletion: 2010. Global Ozone Research and Monitoring Project-Report No. 52, Geneva, Switzerland.
- WMO/GAW (World Meteorological Organization/Global Atmospheric Watch). (2009). Report of the 7th Meeting of the GAW/WMO Brewer Sub-Committee. Aosta, Italy. Retrieved from ftp://ftp.tor.ec.gc.ca/Sub-committee_Reports/2009/Brewer_Sub-Committee2009.pdf