
Abstract
The 2009–10 Arctic stratospheric winter, in comparison with other recent winters, is mainly characterized by a major Sudden Stratospheric Warming (SSW) in late January associated with planetary wavenumber 1. This event led to a large increase in the temperature of the polar stratosphere and to the reversal of the zonal wind. Unlike other major SSW events in recent winters, after the major SSW in January 2010 the westerlies and polar vortex did not recover to their pre-SSW strength until the springtime transition. As a result, the depletion of the ozone layer inside the polar vortex over the entire winter was relatively small over the past 20 years. The other distinguishing feature of the 2010 winter was the splitting of the stratospheric polar vortex into two lobes in December. The vortex splitting was accompanied by an increase in the temperature of the polar stratosphere and a weakening of the westerlies but with no reversal. The splitting occurred when, in addition to the high-pressure system over northeastern Eurasia and the northern Pacific Ocean, the tropospheric anticyclone over Europe amplified and extended to the lower stratosphere. Analysis of wave activity in the extratropical troposphere revealed that two Rossby wave trains propagated eastward to the North Atlantic several days prior to the vortex splitting. The first wave train propagated from the subtropics and mid-latitudes of the eastern Pacific Ocean over North America and the second one propagated from the northern Pacific Ocean. These wave trains contributed to an intensification of the tropospheric anticyclone over Europe and to the splitting of the stratospheric polar vortex.
Résumé
[Traduit par la redaction] L'hiver stratosphérique arctique 2009–2010, comparativement à d'autres hivers récents, est principalement caractérisé par un réchauffement stratosphérique soudain (RSS) majeur tard en janvier, associé au nombre d'ondes planétaires 1. Cet événement a mené à une forte augmentation de la température de la stratosphère polaire et au renversement du vent zonal. À la différence d'autres événements RSS majeurs dans les hivers récents, après celui de janvier 2010, les vents dominants d'ouest et le tourbillon polaire n'ont regagné leur force d'avant le RSS qu’à la transition du printemps. Il en a résulté que l'appauvrissement de la couche d'ozone à l'intérieur du tourbillon polaire durant tout l'hiver a été relativement faible au cours des 20 dernières années. L'autre caractéristique distinctive de l'hiver 2010 a été la séparation du tourbillon stratosphérique polaire en deux lobes en décembre. La séparation du tourbillon s'est accompagnée d'une augmentation de la température de la stratosphère polaire et d'un affaiblissement des vents dominants d'ouest mais sans renversement. La séparation s'est produite quand, en plus du système de haute pression au-dessus du nord-est de l'Eurasie et du Pacifique Nord, l'anticyclone troposphérique au-dessus de l'Europe s'est amplifié et s'est étendu jusque dans la basse stratosphère. L'analyse de l'activité des ondes dans la troposphère extratropicale a révélé que deux trains d'ondes de Rossby se sont propagés vers l'est jusqu’à l'Atlantique Nord plusieurs jours avant la séparation du tourbillon. Le premier train d'ondes s'est propagé des latitudes subtropicales et moyennes de l'est du Pacifique jusqu'au-dessus de l'Amérique du Nord et le second s'est propagé à partir du Pacifique Nord. Ces trains d'ondes ont contribué à l'intensification de l'anticyclone troposphérique au-dessus de l'Europe et à la séparation du tourbillon stratosphérique polaire.
1 Introduction
Recent Arctic winters in the stratosphere have been characterized by large interannual variability. A winter with a stable and cold stratospheric polar vortex surrounded by strong westerlies that are observed till the final warming in spring could be followed or preceded by a winter with zonal wind and temperature oscillations, a more disturbed stratospheric polar vortex, and higher planetary wave activity that leads to major Sudden Stratospheric Warming (SSW) events accompanied by a weakening zonal wind, a reversal of the westerlies to easterlies, and temperature increases in the polar stratosphere of tens of degrees in several days.
The temperature of the polar lower stratosphere is a key factor in the generation of polar stratospheric clouds (PSCs) where chemical reactions that destroy the ozone layer occur. Cold stratospheric winters lead to extensive ozone destruction, whereas relatively warm winters result in a smaller ozone loss.
In addition to the influence of cold winters on the ozone layer, there is evidence that the variability in the Arctic polar stratosphere can influence the dynamics of the troposphere and winter weather conditions of the northern extratropics (e.g., Jeong, Kim, Ho, Chen, & Lim, Citation2006; Kolstad, Breiteig, & Scaife, Citation2010). Simulations using climate models with nudging in the Arctic stratosphere (including polar vortex variability) show an improvement in the simulation of both the Arctic Oscillation (AO) and North Atlantic Oscillation (NAO), with positive impacts on the interannual variability of winter surface air temperature and precipitation (Douville, Citation2009).
The boreal winter of 2009–10 is an example of a warm winter in the stratosphere while the the winter of 2010–11 was characterized by very low temperatures in the polar stratosphere over the entire winter season resulting in extensive destruction of the ozone layer, comparable to the ozone destruction in Antarctica. This very cold stratospheric winter with record high ozone loss was observed in the Arctic for the first time over the entire observation period. Therefore, many studies were devoted to the investigation of dynamical and chemical processes in the polar stratosphere during this winter (e.g., Manney et al., Citation2011; Sinnhuber et al., Citation2011).
The Arctic winter of 2009–10 was very different from the winter of 2010–11. First, a major SSW associated with a very strong wavenumber 1 started on 25 January that led to a large increase in the temperature of the polar stratosphere and to a reversal of the zonal wind. Unlike major SSW events in recent winters, after the major SSW in January 2010 the polar stratosphere westerlies did not revert to their pre-warming magnitude until the springtime transition; there were several zonal wind reversals from late January to April but the westerlies did not exceed 10 m s−1. The stratospheric polar vortex also did not recover to its pre-warming strength after the major SSW. As a result of these changes in the dynamics of the polar stratosphere, the chemical loss of ozone over the entire winter of 2009–10 was relatively small over the past 20 years.
Note that the dynamical processes in the stratosphere in the boreal winter of 2009–10 were also studied to determine if there was a possible relationship between its variability and the record cold winter conditions observed over many areas in the northern hemisphere, specifically in December 2009. In particular, Wang and Chen (Citation2010) mentioned that the lowest observed negative value of the AO index for the past 31 years occurred in December 2009 and suggested that the downward propagation of stratospheric anomalies associated with a weak stratospheric polar vortex could influence the troposphere and contribute to the observed cold weather conditions. Cohen, Foster, Barlow, Saito, and Jones (Citation2010) discussed whether the anomalies in the Eurasian snow cover and the conditions in the lower atmospheric during autumn caused by a troposphere–stratosphere interaction were associated with the record low values of the AO. Using twentieth century reanalysis data for the 1891–2006 period, Ouzeau, Cattiaux, Douville, Ribes, and Saint-Martin (Citation2011) found that only the winter of 1939–40 was dynamically analogous to the winter of 2009–10 with more than 80 days of negative NAO indices. They also mentioned that an improved representation of the lower stratosphere would be necessary to reproduce not only the seasonal mean negative NAO signal but also its intraseasonal distribution and the corresponding increased probability of cold waves over northern Europe including during the winter of 2009–10. Cattiaux et al. (Citation2010) discussed the possibility that the regional cold events during the winter of 2009–10 were mitigated by global climate change. Stroeve et al. (Citation2011) showed that the response of Arctic sea ice to the extreme negative phase of the AO in the winter of 2009–10 was observed until summer. Some aspects of the Arctic stratosphere during this winter were analyzed also using results of the international field experiment RECONCILE (Dörnbrack et al., Citation2011).
Besides cold weather conditions, a record negative phase of the AO, and a major SSW, the other interesting feature of the 2009–10 winter that attracted less attention was the splitting of the stratospheric polar vortex, observed over about a week in December.
We know that the spatial structure and dynamics of polar vortices play a dominant role in the circulation of the stratosphere in the winter and spring and strongly influence the distribution of trace gases including ozone (e.g., Waugh & Polvani, Citation2010). Also, the variability of polar vortices is an important component of dynamical coupling between the stratosphere and troposphere.
The splitting of the polar vortex into two lobes is one of the well-known examples of its possible deformation. The weakening of the westerlies and an increase in the temperature of the polar lower stratosphere are associated with the splitting of the polar vortex; this results in a decrease in the number of PSCs, a reduction in the activation of ozone-depleting substances, and a lessening of the destruction of the ozone layer during late winter and spring. On the other hand, an elongation of the polar vortex with a shift of its edge and the lobes of the vortex toward lower latitudes after the vortex splits results in the exposure of the air in the vortex to sunlight at smaller solar zenith angles, which can lead to an increase in the rate of ozone destruction.
The splitting of the polar vortex in early or mid-winter can affect the vortex variability in late winter and early spring. With weakened westerlies and higher temperatures, a less stable and colder polar vortex is more vulnerable to bursts of planetary wave activity propagating from the troposphere to the stratosphere and thus to SSWs.
Usually the splitting of the stratospheric polar vortex in mid-winter is associated with major SSW events. An analysis of observations shows that major SSW events are found to occur with a frequency of six events per decade, and of these only one-quarter are wavenumber 2 major SSWs (i.e., splitting) events (Bancalá, Krüger, & Giorgetta, Citation2012).
Splitting of the polar vortex is caused by the intensification of two anticyclones in the lower to middle stratosphere or by an increase in amplitude of planetary wavenumber 2. The observed split in the middle of December 2009 led to an increase in temperature and a weakened zonal wind but not a wind reversal. Therefore, this event can be characterized as a wavenumber 2 type minor SSW.
Extratropical Rossby wave trains propagate in the troposphere over thousands of kilometres, predominately in an eastward direction and can contribute to the enhancement of anticyclones and to the resulting increase in upward planetary wave activity during major SSW events. This was demonstrated for the polar vortex split in Antarctica in September 2002, in the Arctic in January 2003 (e.g., Nishii & Nakamura, Citation2004; Peters, Vargin, Gabriel, Tsvetkova, & Yushkov, Citation2010; Peters, Vargin, & Körnich, Citation2007) and in January 2009 (Harada et al., Citation2010).
The present study aims to analyze the main features of stratospheric dynamics in the boreal winter of 2009–10 and investigate possible tropospheric forcing that could contribute to the splitting of the stratospheric polar vortex in December 2009.
The paper is organized in the following manner. Section 2 describes the data used and the methods of analysis. The results obtained are presented in Section 3, and the summary is given in Section 4.
2 Data and methods of analysis
Daily global reanalysis data from the National Centers for Environmental Predication (NCEP) of geopotential height, temperature, zonal and meridional wind, specific humidity, vertical velocity (omega), and interpolated National Oceanic and Atmospheric Administration (NOAA) outgoing longwave radiation (OLR) daily data were used in the analysis.
Wave activity in the extratropical troposphere and stratosphere was studied using calculated three-day means of the three-dimensional Plumb fluxes (Plumb, Citation1985), amplitudes of dominant planetary waves with wavenumbers 1–3 in geopotential height, and time-longitudinal (Hövmoller) diagrams of daily squared meridional velocity in the upper troposphere averaged over the selected latitudinal band.
To discover areas of deep convection near the location where tropospheric Rossby wave trains could be generated, the OLR anomalies were calculated as a difference from corresponding climatological means for 1971 to 2001.
These methods of wave activity analysis in the troposphere correspond to those used by Peters et al. (Citation2007, Citation2010).
Additionally, daily potential vorticity data from the European Centre for Medium-range Weather Forecasts (ECMWF) reanalysis project (ERA) Interim were used to illustrate the variability of the stratospheric polar vortex during the time it splits.
This study focuses on the winter of 2009–10 with only limited comparisons with the winter of 2010–11 presented.
3 Results
a Arctic Stratosphere in Winter 2009–10 and 2010–11
The Arctic winters of 2009–10 and 2010–11 are examples of the large interannual variability in the dynamics of an extratropical winter stratosphere. shows the evolution of the daily zonal temperature of the polar region in the lower stratosphere (70 hPa) from December 2009 to April 2010 and for 2010 to 2011.
Fig. 1 Evolution of daily zonal mean temperature (K) at 70 hPa averaged over 80°–90°N for December 2009 to April 2010 (red), 2010 to 2011 (blue), and the climatological means for the period 1968 to 1996 (green).
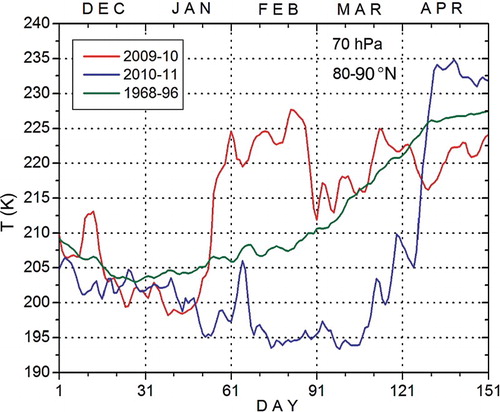
The temperature of the lower stratosphere at the polar cap in December of both years was similar except for the period from about 5 to 15 December when the 2009 temperature was approximately 10 K warmer. The temperature of the lower stratosphere was comparable to but slightly lower than the climatological mean until the middle of January. From approximately 20 January 2010 the temperature increased by about 20 K and remained above the climatological mean by 15–20 K until the end of February when it decreased to near-climatological values remaining slightly higher than climatological values in March.
In contrast, after the middle of January 2011 the temperature of the polar lower stratosphere remained 10 to 20 K below the climatological mean until the beginning of April except for the short period at the beginning of February 2011 when it increased by about 10 K. The temperature started to increase at the end of March but only at the beginning of April after a large rapid increase—about 30 K over four days—did the temperature exceed the climatological mean.
As mentioned in the introduction, the cold temperatures extended from the middle of January to the beginning of April 2011 and led to the creation of a large number of PSCs inside the polar vortex and to a record destruction of the ozone layer.
b Zonal Mean of Meridional Heat Flux, Temperature, and Zonal Wind
Meridional heat flux (HF), , calculated in the lower stratosphere at 100 hPa and averaged over mid- to high latitudes is often used as a measure of planetary wave activity propagating upward from the troposphere. shows the daily mean temperatures of the lower stratosphere at 70 hPa in the polar region averaged over 80°–90°N, the HF at 100 hPa averaged over 50°–70°N, and the mean zonal wind in the middle stratosphere at 10 hPa averaged over 60°–70°N from 1 December 2009 to 30 March 2010.
Fig. 2 Evolution of the daily zonal mean temperature (K) at 70 hPa averaged over 80°–90°N (blue, right axis), the mean zonal wind (m s−1) at 10 hPa averaged over 60°–70°N (green), and the zonal meridional heat flux (K m s−1) at 100 hPa averaged over 50°–70°N (magenta) from December 2009 to March 2010 (left axis).
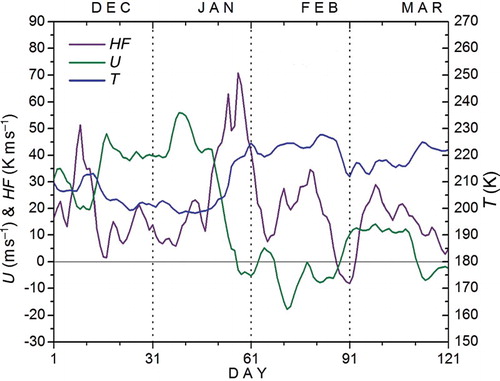
The burst of HF in the lower stratosphere around 10 December corresponds to a decrease in zonal wind and an increase in temperature. The other two HF maxima, at the end of December and in the middle of January, did not lead to significant changes in zonal wind or increased temperature in the lower to middle stratosphere. Subsequently, a very strong burst of HF was observed at the end of January corresponding to the major SSW leading to a change in the zonal wind from about 40 m s−1 to about −5 m s−1 and a temperature increase of about 20 K. The zonal wind did not recover after the major SSW; its values were in the range of −20 m s−1 to 5 m s−1 in February and did not exceed 10 m s−1 in March. The temperature of the polar lower stratosphere remained in the range of 220–230 K.
The other strong increases in HF were observed in the middle of February and the beginning of March. These events did not change the zonal wind or temperature significantly and these parameters at mid- to high latitudes did not recover to their pre-major SSW values.
During the polar vortex split the other accepted definition of a major SSW—the difference in zonal temperature at 10 hPa between 60°N and 90°N—decreased from 22–23 K to 17–18 K on 5–7 December but remained positive (not shown). There were no similar changes in this difference until the major SSW in late January when the sign of the difference changed. Afterwards, in February–March, the difference showed only weak variations in the range of 4 to −2 K.
c Amplitudes of Planetary Waves
Interaction of planetary waves with the zonal mean flow is a major driver of winter stratospheric dynamics including major SSW events and weaker stratospheric wave-mean flow oscillations which occur during the winter (Holton & Mass, Citation1976). To analyze the variability of planetary wave activity in the upper troposphere and middle stratosphere over the northern extratropics during the 2009–10 winter, the daily amplitudes of the dominant wavenumbers were calculated. and show the evolution of the amplitudes of wavenumbers 1 to 3 averaged over the latitudinal band 40°–75°N in the middle stratosphere (30 hPa) and in the upper troposphere (300 hPa) from 1 December 2009 to 30 April 2010. The selected latitudinal band 40°–75°N corresponds to a region of high planetary wave activity.
Fig. 3 Evolution of the daily amplitudes of the planetary waves with wavenumber k = 1, 2, and 3 (blue, red, and green lines, respectively), in geopotential height (m) averaged over the latitudinal band 40°–75°N at (a) 30 hPa and (b) 300 hPa from 1 December 2009 to 30 April 2010.
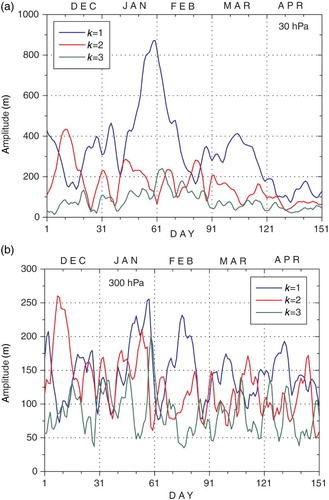
The splitting of the polar vortex in December was preceded by enhanced wavenumber 2 activity in the upper troposphere–middle stratosphere with the maximum occurring around 10 December. A strong anticorrelation between wavenumbers 1 and 2 was observed during this period and later, most clearly at the end of December and January and around 20 February.
Planetary wavenumber 1 increased strongly from the upper troposphere to the middle stratosphere and reached its maximum in late January when the major SSW occurred. The amplitude of wavenumber 1 became two to three times higher than that of wavenumber 2 in the stratosphere, whereas the amplitudes of both wavenumbers were comparable in the upper troposphere. Amplification of wavenumber 2 also occurred in the upper troposphere at the beginning and the end of both February and March. After the major SSW, wavenumber 1 was dominant in the middle stratosphere.
d Splitting of the Stratospheric Polar Vortex
The spatial structure of the polar vortex prior to and during the splitting of the polar vortex is presented in using stereographic projections of potential vorticity—a useful quantity for analyzing polar vortices. Because our study focuses on the lower stratosphere, the potential vorticity (PV) on isentropic level 530 K (approximately 30 hPa) is plotted.
Fig. 4 Stereographic projections of potential vorticity (10−5 K m2 kg−1 s−1) at isentropic level 530 K (approximately 30 hPa) on (a) 7 December, (b) 10 December, (c) 14 December, and (d) 18 December 2009. The contour interval is 1×10⁻⁵ K m2 kg−1 s−1; shading indicates potential vorticity larger than 4×10⁻⁵ K m2 kg−1 s−1. The southern edge of the projection is 12°N.
The stratospheric vortex had a nearly circular shape that shifted towards the eastern hemisphere in early December (not shown). On 7 December the polar vortex became elongated with its western hemisphere edge was located over northern North America and its eastern hemisphere edge was located over northern Russia ().
Three days later the shape of the vortex changed and two centres formed. The location of the vortex did not change but the portion of the vortex over North America became larger (). Two lobes of the vortex, with the lobe over North America being slightly larger, are clearly observed during the following several days (). The location of the lobes is in agreement with the results of composite analyses of the splitting of Arctic polar vortices during SSW events using ECMWF reanalysis (ERA-40) data for the period 1957 to 2002 (Matthewman, Esler, Charlton-Perez, & Polvani, Citation2009) where these lobes were identified as Siberian and Canadian “daughter” vortices. Note that in December 2009 both vortices were comparable in magnitude in the lower stratosphere (at 530 K), and there was no splitting in the middle stratosphere (at 850 K) although two centres formed. Merging of the vortex lobes began on 16 December and two days later the polar vortex had returned to a nearly circular shape centred over the North Pole ().
As shown in , the splitting event was accompanied by an increase in the amplitude of wavenumber 2 that was caused by amplification of a tropospheric anticyclone over the northeastern Atlantic and a high pressure system over the northern Pacific.
The splitting of the polar vortex in December 2009 was mentioned by Kuttippurath and Nikulin (Citation2012), who performed an analysis of a major SSW in January 2010 and compared it with other recent warm winters in the stratosphere.
After the major SSW, the weakened and elongated polar vortex split into two lobes in the lower stratosphere on 12 February, the smaller lobe having higher PV over northern Canada and another lobe two to three times larger in area but smaller in magnitude over northern Eurasia. The polar vortices merged on 1–2 March. This splitting of the polar vortex was also observed in the middle stratosphere.
e Rossby Wave Trains
It has been well established that Rossby wave trains (RWTs) are observed in the upper troposphere in the extratropics of both hemispheres (Chang, Citation2001; Chang and Yu, Citation1999a, Citation1999b). Energy can be transferred from the zonal flow to meteorological eddies by RWTs. The mean lifecycle of RWTs is about nine days; over this time RWTs can propagate, predominately in an eastward direction, and transfer energy over hundreds or thousands of kilometres with a group velocity of 20–30 m s−1. The propagation of RWTs depends on the structure of the zonal wind jets in the upper troposphere.
It is known that RWTs can contribute to the generation and reinforcement of blocking highs (Shutts, Citation1983). Nishii and Nakamura (Citation2004) and Peters et al. (Citation2007) showed that RWTs could have contributed to the splitting of the polar vortex in September 2002 when an unprecedented major SSW occurred in Antarctica. The relationship between RWTs and the splitting of the polar vortex in the Arctic in January 2003 was shown by Peters et al. (Citation2010). RWTs could have contributed to the generation and reinforcement of the record long-lived blocking high over eastern Europe and the western part of Russia in the summer of 2010 (Vargin, Lukyanov, & Ganshin, Citation2012).
The generation of RWTs can be observed from the middle to the upper troposphere near areas of deep convection characterized by enhanced cloudiness (e.g., Sardeshmukh & Hoskins, Citation1988). It can be determined from the OLR climatological mean that these are regions of negative anomalies.
To identify RWTs in the upper troposphere over the northern extratropics, the time-longitude diagrams of daily squared meridional velocity at 200 hPa averaged over 30°–50°N and 60°–80°N from late November to the end of December 2009 were employed (). These diagrams reveal the areas where and the periods when the propagation of RWTs begin and end and can be used to estimate how the wave energy propagates; the red arrow over the maxima of wave disturbances shows the propagation direction of the group velocity.
It follows from that the dominant RWTs were observed at the end of November and at the beginning and at the end of December. The first RWT was observed from 26 November to 1–2 December and propagated eastward from North America over the North Atlantic to eastern Europe. The second RWT appeared on 1 December near 150°W and propagated over the eastern Pacific and North America to 40°–50°W over six to seven days. The third RWT started on 22–23 December near 130°–150°W, propagated over the eastern Pacific, North America, and the Atlantic Ocean arriving over eastern Europe near 30°E at the end of December.
Fig. 5 Time-longitude diagram of daily squared meridional velocity (m2 s−2) averaged over (a) 30°–50°N and (b) 70°–80°N at 200 hPa from 26 November to 31 December 2009. The red arrows indicate the direction of the group velocity of the Rossby wave train before the vortex splits. Contours are 200, 300, 400, 500, 600 m2 s−2 and at 300 m2 s−2 intervals thereafter.
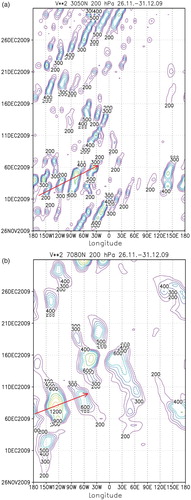
The fourth RWT that started over the northern Pacific on 5–6 December and propagated over northern Canada reaching the northeastern Atlantic on 7–9 December was detected at high latitudes (). Namely, the second and fourth RWTs (as will be shown later) may have contributed to the amplification of the anticyclone over the northeastern Atlantic and Europe that occurred during the splitting of the polar vortex.
The propagation of RWTs in January 2010 was also analyzed. Several dominant RWTs were found (not shown). The first RWT was observed on 4–8 January 2010 starting over the western Atlantic (60°–50°W) and reaching eastern Europe (40°–50°E). Wave disturbances observed between 13 and 19 January presumably consisted of two RWTs: one propagating from the central Pacific to western North America (180°–90°W) on 13–16 January and the other propagating from the central Atlantic to western Siberia (30°W–90°E) on 14–19 January.
The RWT that appeared on 20 January near the dateline (180°) propagated over the northeastern Pacific and North America reaching the prime meridian in four to five days when the major SSW occurred. Although this RWT passed over the North Atlantic, there was no amplification of the tropospheric anticyclone in this region and the major SSW corresponded to wavenumber 1 with shifting of the polar vortex off the pole.
f Possible Sources of RWT Generation
It has been shown that areas of deep convection can be linked to the generation of RWTs (Sardeshmukh & Hoskins, Citation1988). These regions are characterized by enhanced cloudiness and flow diversions in the upper troposphere and can be detected as negative anomalies in the OLR from its climatological mean.
shows negative OLR anomalies derived from OLR daily data for the period and areas near the formation of RWTs and averaged over three-day periods; 26–28 November and 29 November–1 December. Strong negative OLR anomalies were observed on 26–28 November (). The dominant area extended from the western equatorial region of the Pacific to the northwest reaching 25°–30°N. The other area of OLR anomaly extended from the same equatorial region of the Pacific to the northeastern Pacific (25°–30°N, 140°–130°W). Although these anomalies extended from the same region, the western anomaly is significantly weaker than the eastern one. There were two other smaller negative OLR anomalies in the northeastern and eastern equatorial Pacific.
Fig. 6 Latitude-longitude cross-sections of negative OLR anomalies (W m−2) from the corresponding climatological mean averaged over (a) 26 to 28 November and (b) 29 November to 1 December.
In the following days the OLR anomalies extending from the equatorial Pacific intensified (). The first anomaly extended northeastward to 30°–40°N, 170°W with a maximum near 20°N, 140°E. The second OLR anomaly that extended from the equatorial region of the Pacific northeastward also intensified and expanded slightly. Note that the generation of the RWT before the vortex splitting was observed around 1 December at nearby middle latitudes 150°W () where an amplification of the second OLR anomaly occurred on 29 November–1 December.
The weakening of negative OLR anomalies over the northern extratropics of the Pacific was observed on 2–4 December (not shown). In particular, the northeastern parts of the anomalies that extended northeastward from the equatorial Pacific disappeared.
The negative OLR anomalies that expanded from the western tropical Pacific may have been caused by positive sea surface temperature anomalies and/or by “narrow” transport of moist air masses from the tropics (the so-called “atmospheric river;” Neiman et al., Citation2008). The enhanced cloudiness over the tropical Pacific in December, presumably related to El Niño, started in summer 2009 and persisted until spring 2010.
An analysis of specific humidity data also revealed areas of enhanced moisture in the troposphere (not shown) that are consistent with the areas of negative OLR anomalies shown in . With the use of vertical velocity (omega) data, it was established that ascending motions (negative values) were observed over the regions of RWT generation shown as negative OLR anomalies (). This follows from observed negative anomalies of the vertical velocity at 300 hPa from its climatological mean (not shown).
g Plumb Fluxes
To investigate the propagation of RWTs in the troposphere over the northern extratropics at the beginning of December, the three-dimensional Plumb fluxes (Plumb, Citation1985) were calculated over the entire range of heights up to the middle stratosphere (10 hPa) for three-day periods. Plumb fluxes are often called extended Eliassen-Palm (EP) fluxes because the zonal average of Plumb fluxes is equal to the EP flux.
The horizontal components of the Plumb fluxes and deviations of geopotential height from the zonal mean at 300 hPa are presented in . From 1 to 3 December the dominant region of eastward propagation of wave activity in the western hemisphere was observed over the northeastern Pacific (). From 3 to 5 December clear features of RWT propagation from the northeastern Pacific over North America are observed.
Fig. 7 Stereographic projections of horizontal components (Fx, Fy) of Plumb fluxes (m2 s−2) (indicated by arrows) and the deviation of geopotential height G* (m) (contours, interval 100) from zonal mean at 300 hPa averaged over (a) 1–3, (b) 3–5, (c) 5–7, and (d) 7–9 December 2013. The southern edge of the projection is 20°N. The scale of the fluxes is indicated by the arrow below each plot (m2 s−2).
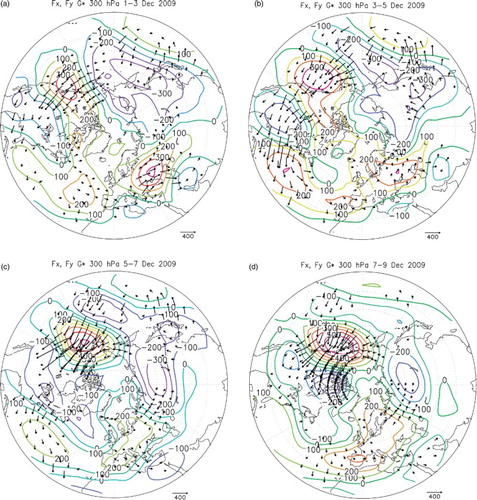
This RWT propagated further eastward and reached the anticyclone located over the northern mid-latitudes of the Atlantic Ocean (). On 5–7 and 7–9 December another RWT was observed at high latitudes. This RWT propagated eastward from northeastern Eurasia–North Pacific over the north of North America and further over Greenland towards the northeastern Atlantic where the northwestern edge of the other anticyclone occurred ( and ). This tropospheric anticyclone amplified from 7 to 9 December extending up to the lower stratosphere, and this led to the splitting of the stratospheric vortex.
At middle latitudes on 5–7 and 7–9 December, in contrast to 3–5 December, strong eastward wave propagation was only observed over the northeastern Pacific and western Canada, and weaker propagation was observed over the Atlantic middle latitudes.
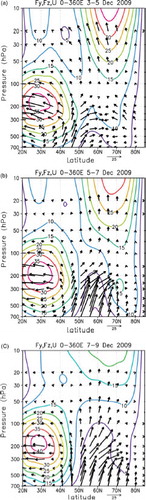
The longitudinal evolution of RWT propagation before and during the vortex splitting was analyzed using the height-longitude diagrams of Plumb fluxes and the deviation in geopotential height (). Because of the fast development of the splitting and the latitudinal extension of anticyclones over the northern Atlantic the three-day averages are shown for two latitudinal bands: 30°–50°N and 50°–70°N.
Fig. 8 Height-longitude cross-sections of the vertical and longitudinal components (Fx, Fz) of the Plumb fluxes (m2 s−2) and the deviation of geopotential height G* from the zonal mean (m) averaged over the latitudinal band 30°–50°N (left column) and 50°–70°N (right column) on 3–5 December (a) and (b), 5–7 December (c) and (d), and 7–9 December (e) and (f) 2009. The vertical component of wave activity flux is multiplied by a factor of 100. The scale of the fluxes is indicated by the arrow below each plot (m2 s−2).
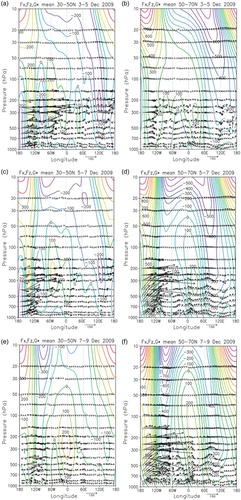
From 3 to 5 December () the polar vortex was located over the North Atlantic and northern Eurasia as part of a well-developed wavenumber 1 structure. An accompanying ridge penetrated downward over the west coast of North America (near 120°W) and showed a weak westward phase shift with altitude. Enhanced eastward wave activity fluxes (WAF) in the troposphere are clearly seen over North America and the western Atlantic (60°–120°W). Further east, the upward propagation of WAF was observed at the western edge of the anticyclone over the eastern Atlantic (). Comparable propagation of wave activity in the troposphere over 50°–70°N during these days was not observed ().
In the troposphere, one anticyclone was observed over eastern Europe in both latitudinal bands and another anticyclone, with a double structure, was observed in the middle latitudes over the North Atlantic.
From 5 to 7 December propagation of WAFs weakened slightly over the middle latitudes of the western hemisphere whereas it increased over high latitudes ( and ). In comparison with 3–5 December, the tropospheric anticyclone over Europe in the latitudinal band 50°–70°N intensified, accompanied by the appearance of the first features of the splitting of the polar vortex in the lower stratosphere.
By 7–9 December the increased eastward propagation of WAF in the troposphere over the middle latitudes of the western hemisphere had disappeared. The anticyclone over the northern Atlantic shifted eastward to the prime meridian and intensified. The splitting of the polar vortex could be observed; two areas of negative geopotential height anomalies extended from the troposphere to the middle stratosphere (). Over high latitudes the spatial structure of the two vortices extending up to the middle stratosphere is also clearly seen (). This splitting of the polar vortex, caused by intensification of the anticyclone, extended from the troposphere to the lower stratosphere over Europe.
Following from , the strongest upward propagation of wave activity was observed prior to and during the splitting of the polar vortex over the northeastern Pacific and western Canada. also shows the barotropic structure of the splitting of the polar vortex which agrees with Waugh and Polvani (Citation2010) who pointed out that it is a common feature of such events.
In the following we focus the analysis of the latitudinal structure of wave activity prior to and during splitting of the polar vortex. An increase in the upward and poleward propagation of WAF during the splitting is shown on height-latitude diagrams where both the zonal means of Plumb fluxes and the zonal wind are plotted ().
Fig. 9 Height-latitude cross-sections of the vertical and latitudinal components (Fy, Fz) of the mean zonal Plumb fluxes (m2 s−2) and mean zonal wind U (ms−1) on (a) 3–5 December, (b) 5–7 December, and (c) 7–9 December 2009. The scale of the fluxes is indicated by the arrow below each plot (m2 s−2).
In the days before the vortex splitting, 3–5 December, wave activity in the troposphere propagated upward over middle latitudes and moved equatorward rather than poleward (). The stratospheric polar night jet exceeded 35 m s−1 in the middle stratosphere.
On 5–7 December, upward and poleward propagation of WAF in the troposphere increased () causing a deceleration of the zonal wind in the stratosphere. At the same time, a secondary jet with a maximum of about 15 m s−1 appeared in the middle troposphere near 70°N. Note that an increase in WAF was observed mainly over 50°–70°N while a decrease was observed over lower latitudes.
On 7–9 December when the splitting began, a further increase in upward and poleward WAF in the troposphere and in the lower stratosphere was observed (). This enhanced wave activity propagation contributed to further weakening of the polar night jet—to about 20 m s−1 in the middle stratosphere. At the same time the subtropical jet strengthened slightly.
An increase in the zonal mean WAF over high latitudes from 5 to 9 December ( and ) mirrors the increase in upward and eastward propagation of wave activity from two regions: stronger propagation from the northeastern Pacific and western Canada and weaker propagation from the northeastern Atlantic and Europe ( and ) and corresponds to an increase in wavenumber 2 observed during the splitting of the polar vortex in the upper troposphere and middle stratosphere ().
4 Summary
The extratropical stratosphere of recent boreal winters exhibits a large interannual variability. Particularly the very cold winter of 2010–11, with record destruction of the ozone layer in the polar lower stratosphere (comparable to ozone destruction in Antarctica) following the winter of 2009–10 with major SSW anomalies of wavenumber 1 type in late January that led to a weakening and reversal of the zonal wind and to a large increase in the temperature of the polar stratosphere. The temperature remained higher than the climatological mean and the westerlies did not recover until the spring transition. As a result, the total chemical ozone loss inside the polar vortex was relatively small over the entire winter of 2009–10: about 58 Dobson Units (DU; 1 DU = 0.01 mm at standard temperature and pressure and is equivalent to 2.69 × 10²⁰ molecules per square metre), much lower than the highest value which was almost 150 DU in the winter of 2010–11 (estimated using the method described by Tsvetkova, Yushkov, Lukyanov, Dorohov, & Nakane (Citation2007)).
The present study, employing NCEP reanalysis data, investigates another interesting feature of the dynamics of the Arctic stratosphere in the 2009–10 winter: the splitting of the stratospheric polar vortex into two lobes observed prior to the major SSW. The splitting event started on 8 December when, in addition to the high pressure system over northeastern Eurasia and the northern Pacific, the tropospheric anticyclone over the northeastern Atlantic and Europe intensified and upward planetary wave activity propagation into the stratosphere was enhanced. The lobes of the vortex merged in 10 days.
Usually, the splitting of the polar vortex in the Arctic occurs when two stratospheric anticyclones over mid- to high latitudes intensify and elongate the shape of the polar vortex which then splits into two lobes. Several days later a weaker lobe can disappear or the two lobes of the vortex can merge. The splitting corresponds to an increase in planetary wavenumber 2 in the stratosphere.
We know that RWTs propagate eastward over the extratropics in the upper troposphere and can transfer energy from the zonal flow to meteorological eddies and particularly to tropospheric anticyclones. The RWTs can contribute to the intensification of anticyclones that leads to the splitting of the polar vortex as shown earlier for the major SSW in Antarctica in September 2002 and in the Arctic in January 2003 and 2009.
In this study we have shown that two RWTs propagated eastward several days before the vortex split in December 2009. The first RWT propagated from the mid-latitudes of the central and eastern Pacific, over North America and then to the North Atlantic; the second RWT propagated from the northern Pacific to the North Atlantic. These RWTs could contribute to the intensification of the tropospheric anticyclone over the northeastern Atlantic and Europe and to the subsequent splitting of the stratospheric polar vortex. It was found that the generation of the first RWT occurred near areas of deep convection over the central and northeastern Pacific. These areas, characterized by increased cloudiness, were detected as negative OLR anomalies.
An analysis of planetary wave activity showed that the vortex splitting event was preceded by increased wavenumber 2 activity in the lower stratosphere and was accompanied by an increase in the propagation of wave activity from the troposphere to the stratosphere and poleward.
It is important to note that the RWTs at the beginning of December 2009 presumably could not be the sole cause of the splitting of the polar vortex. For instance, several RWTs propagated from the eastern Pacific to the northern Atlantic in December 2010 to January 2011; however, the polar vortex remained stable and very cold until the final warming in April. Therefore, in addition to the contribution of RWTs to the maintenance of anticyclones, other processes, including the wave–zonal flow interaction and oscillation in the zonal wind in the upper stratosphere, as well as the non-linear self-interaction of wavenumber 1 could also contribute to an increase in wavenumber 2 (Pogoreltsev, Citation2001) and could also play an important role in the vortex splitting. The Quasi-Biennial Oscillation (QBO) in the equatorial lower stratosphere in December 2009–January 2010 was in an eastern phase, which is more favourable for the development of an SSW than the western phase. However the splitting of the polar vortex also occurred in the winters with a western phase of the QBO, for instance in January 2009 (Ayarzagüena, Langematz, & Serrano, Citation2011). Therefore, it is expected that the QBO was not a dominant process but its influence on the dynamics of the extratropical stratosphere, including the oscillation in the zonal wind as mentioned above, cannot be ruled out.
Results obtained suggest that the contribution of the RWTs was important to the intensification of the tropospheric anticyclone over Europe that led to the splitting of the stratospheric polar vortex in December 2009.
Could this vortex splitting contribute to the occurrence of the major SSW in late January 2010 and to the warm period that followed in the Arctic stratosphere, which in turn resulted in a modest reduction in the ozone layer over the entire winter? If yes, what is the mechanism? These questions remain open, and further modelling experiments are needed to answer them and to confirm the results obtained in the present study.
Acknowledgements
This work was funded by the Russian Foundation for Basic Research under grant 13-05-01007-a. The author was supported by the German Science Foundation (DFG) under grant PE474/7 during a three-month stay at the Leibniz Institute of Atmospheric Physics, Kühlungsborn, Germany.
NCEP reanalysis and interpolated OLR data were provided by the NOAA Climate Diagnostics Center, Boulder, Colorado, USA. ECMWF ERA-Interim PV data were obtained from the ECMWF data server. The author is very grateful for the helpful and constructive comments from two anonymous reviewers and the editor.
Related Research Data
References
- Ayarzagüena, B., Langematz, U., & Serrano, E. (2011). Tropospheric forcing of the stratosphere: A comparative study of the two different major stratospheric warmings in 2009 and 2010. Journal of Geophysical Research, 116, D18114. doi: 10.1029/2010JD015023
- Bancalá, S., Krüger, K., & Giorgetta, M. (2012). The preconditioning of major sudden stratospheric warmings. Journal of Geophysical Research, 117, D04101. doi: 10.1029/2011JD016769
- Cattiaux, J., Vautard, R., Cassou, C., Yiou, P., Masson-Delmotte, V., & Codron, F. (2010). Winter 2010 in Europe: A cold extreme in a warming climate. Geophysical Research Letters, 37, L20704. doi: 10.1029/2010GL044613
- Chang, E. (2001). The structure of baroclinic wave packets. Journal of the Atmospheric Sciences, 58, 1694–1713. doi: 10.1175/1520-0469(2001)058<1694:TSOBWP>2.0.CO;2
- Chang, E., & Yu, D. (1999a). Characteristics of wave packets in the upper troposphere. Part I: Northern hemisphere winter. Journal of the Atmospheric Sciences, 56, 1708–1728. doi: 10.1175/1520-0469(1999)056<1708:COWPIT>2.0.CO;2
- Chang, E., & Yu, D. (1999b). Characteristics of wave packets in the upper troposphere. Part II: Seasonal and hemispheric variations. Journal of the Atmospheric Sciences, 56, 1729–1747. doi: 10.1175/1520-0469(1999)056<1729:COWPIT>2.0.CO;2
- Cohen, J., Foster, J., Barlow, M., Saito, K., & Jones, J. (2010). Winter 2009–2010: A case study of an extreme Arctic Oscillation event. Geophysical Research Letters, 37, L17707. doi:10.1029/2010GL044256
- Dörnbrack, A., Pitts, M., Poole, L., Orsolini, Y., Nishii, K., & Nakamura, H. (2011). The 2009–2010 Arctic stratospheric winter – general evolution, mountain waves and predictability of an operational weather forecast model. Atmospheric Chemistry and Physics Discussions, 11, 32535–32582. doi: 10.5194/acpd-11-32535-2011
- Douville, H. (2009). Stratospheric polar vortex influence on northern hemisphere winter climate variability. Geophysical Research Letters, 36, L18703. doi: 10.1029/2009GL039334
- Harada, Y., Goto, A., Hasegawa, H., Fujikawa, N., Naoe, H., & Hirooka, T. (2010). A major stratospheric sudden warming event in January 2009. Journal of the Atmospheric Sciences, 67(6), 2052–2069. doi: 10.1175/2009JAS3320.1
- Holton, J., & Mass, C. (1976). Stratospheric vacillation cycles. Journal of the Atmospheric Sciences, 33, 2218–2225. doi: 10.1175/1520-0469(1976)033<2218:SVC>2.0.CO;2
- Jeong, J.-H., Kim, B-M., Ho, C.-H., Chen, D., & Lim, G.-H. (2006). Stratospheric origin of cold surge occurrence in East Asia. Geophysical Research Letters, 33, L14710. doi: 10.1029/2006GL026607
- Kolstad, E., Breiteig, T., & Scaife, A. (2010). The association between stratospheric weak polar vortex events and cold air outbreaks in the northern hemisphere. Quarterly Journal of the Royal Meteorological Society, 136, 886–893. doi: 10.1002/qj.620
- Kuttippurath, J., & Nikulin, G. (2012). The sudden stratospheric warming of the Arctic winter 2009/2010: Comparison to other recent warm winters. Atmospheric Chemistry and Physics Discussions, 12, 7243–7271. doi: 10.5194/acpd-12-7243-2012
- Manney, G., Santee, M., Rex, M., Livesey, N., Pitts, M., Veefkind, P., … Zinoviev, N. (2011). Unprecedented Arctic ozone loss in 2011. Nature, 478. doi: 10.1038/nature10556
- Matthewman, N., Esler, J., Charlton-Perez, A., & Polvani, L. (2009). A new look at stratospheric sudden warmings. Part III: Polar vortex evolution and vertical structure. Journal of Climate, 22, 1566–1585. doi: 10.1175/2008JCLI2365.1
- Neiman, P., Ralph, F., Wick, G., Kuo, Y.-H., Wee, T.-K., Ma, Z., … Dettinger, M. (2008). Diagnosis of an intense atmospheric river impacting the Pacific Northwest: Storm summary and offshore vertical structure observed with COSMIC satellite retrievals. Monthly Weather Review, 136, 4398–4420. doi: 10.1175/2008MWR2550.1
- Nishii, K., & Nakamura, H. (2004). Tropospheric influence on Antarctic ozone hole split 2002. Geophysical Research Letters, 31, L16103. doi: 10.1029/2004GL019532
- Ouzeau, G., Cattiaux, J., Douville, H., Ribes, A., & Saint-Martin, D. (2011). European cold winter 2009–2010: How unusual in the instrumental record and how reproducible in the ARPEGE-Climat model? Geophysical Research Letters, 38, L11706. doi: 10.1029/2011GL047667
- Peters, D., Vargin, P., Gabriel, A., Tsvetkova, N., & Yushkov, V. (2010). Tropospheric forcing of the boreal polar vortex splitting in January 2003. Annales Geophysicae, 28, 2133–2148. doi: 10.5194/angeo-28-2133-2010
- Peters, D., Vargin, P., & Körnich, H. (2007). A study of the zonally asymmetric tropospheric forcing of the austral vortex splitting during September 2002. Tellus, 59A, 384–394. doi: 10.1111/j.1600-0870.2007.00228.x
- Plumb, R. A. (1985). On the three-dimensional propagation of stationary waves. Journal of the Atmospheric Sciences, 42, 217–229. doi: 10.1175/1520-0469(1985)042<0217:OTTDPO>2.0.CO;2
- Pogoreltsev, A. (2001). Numerical simulation of secondary planetary waves arising from the nonlinear interaction of the normal atmospheric modes. Physics and Chemistry of the Earth, Part C, 26, 395–403.
- Sardeshmukh, P., & Hoskins, B. (1988). The generation of global rotational flow by steady idealized tropical divergence. Journal of the Atmospheric Sciences, 45, 1228–1250. doi: 10.1175/1520-0469(1988)045<1228:TGOGRF>2.0.CO;2
- Shutts, G. (1983). The propagation of eddies in diffluent jetstreams: Eddy vorticity forcing of “blocking” flow field. Quarterly Journal of the Royal Meteorological Society, 109, 737–761.
- Sinnhuber, B., Stiller, G., Ruhnke, R., von Clarmann, T., Kellmann, S., & Aschmann, J. (2011). Arctic winter 2010/2011 at the brink of an ozone hole. Geophysical Research Letters, 38, L24814. doi: 10.1029/2011GL049784
- Stroeve, J., Maslanik, J., Serreze, M., Rigor, I., Meier, W., & Fowler, C. (2011). Sea ice response to an extreme negative phase of the Arctic Oscillation during winter 2009/2010. Geophysical Research Letters, 38(2). doi: 10.1029/2010GL045662
- Tsvetkova, N., Yushkov, V., Lukyanov, A., Dorohov, V., & Nakane, X. (2007). Record chemical ozone loss in Arctic during winter 2004/2005. Izvestia, Atmospheric and Oceanic Physics, 43(5), 643–650.
- Vargin, P., Lukyanov, A., & Ganshin, A. (2012). Investigation of dynamic processes in the period of formation and development of the blocking anticyclone over European Russia in summer 2010. Izvestiya, Atmospheric and Oceanic Physics, 48(5), 476–495. doi: 10.1134/S0001433812050106
- Wang, L., & Chen, W. (2010). Downward Arctic Oscillation signal associated with moderate weak stratospheric polar vortex and the cold December 2009. Geophysical Research Letters, 37, L09707. doi:10.1029/2010GL042659
- Waugh, D., & Polvani, L. (2010). Stratospheric polar vortices. In L. M. Polvani, A. H. Sobel, & D. W. Waugh (Eds.), The stratosphere: Dynamics, transport, and chemistry. Geophysical Monograph Series (pp. 43–57, Vol. 190). Washington, DC: AGU.