
Abstract
A hypothesis has been formulated on the basis of experimental data presented in this article. According to the hypothesis, occurrence of the spring surface ozone maximum at mid-latitudes results from a delay in snow-cover melt. The data were collected at ozone stations in Minsk (Belarus) and Preila (Lithuania). Because the measurements of surface ozone concentration are quite different, despite the close proximity of the stations, a conclusion can be drawn about the significant influence of meteorological parameters on measurements. In addition to a rather subjective and poorly defined parameter—time of snow melt—the difference between the average March temperature and a climatological mean may be treated as a criterion for the presence or absence of the spring ozone maximum.
Résumé
[Traduit par la rédaction] Nous avons formulé une hypothèse fondée sur des données expérimentales présentées dans cet article. Selon cette hypothèse, l’éventuelle présence du maximum d'ozone en surface au printemps dans les latitudes moyennes dépend d'un délai dans la fonte de la couverture de neige. Les données ont été recueillies aux stations de surveillance de l'ozone de Minsk (Bélarus) et de Preila (Lituanie). Étant donné que les mesures de concentration d'ozone en surface sont très différentes malgré la proximité des stations, on peut conclure que les paramètres météorologiques ont une importante influence sur les mesures. En plus d'un paramètre plutôt subjectif et mal défini — le moment de la fonte de la neige —, la différence entre la température moyenne en mars et la moyenne climatologique peut être considérée comme un critère de la présence ou de l'absence du maximum d'ozone au printemps.
1 Introduction
At mid-latitudes in the northern hemisphere, the seasonal variation in surface ozone is characterized by a spring maximum which occurs in the March to May period. In particular, a similar maximum is quite often observed in Belarus and Lithuania (Balatsko, Dziomin, Krasouski, Liudchik, & Pakatashkin, Citation2010). Despite numerous publications (see reviews of Monks (Citation2000) and Vingarzan (Citation2004)), there is no general agreement concerning the mechanism behind the spring maximum.
Researchers usually indicate that one or more of the following factors are significant in the formation of the spring maximum: 1) intensification of vertical motion in the atmosphere because of increasing solar radiation (Lin et al., Citation2012a; Tarasova, Brenninkmeijer, Jöckel, Zvyagintsev, & Kuznetsov, Citation2007; Zvyagintsev, Kakadzhanova, Kruchenitskii, & Tarasova, Citation2008); 2) intensification of photochemical reactions in the surface layer (Kim & Lee, Citation2010; Zhu et al., Citation2004); 3) accumulation of ozone precursors during the winter and strong generation of isoprene and terpenes in spring (Beine et al., Citation1997; Herring, Jaffe, Beine, Madronich, & Blake, Citation1997); and/or 4) horizontal transfer of ozone and its precursors initiated by seasonal modifications to the atmospheric dynamics (Diem, Citation2004; Li et al., Citation2002; Lin et al., Citation2012b; Tanimoto et al., Citation2005; Tarasova et al., Citation2007; Zhu et al., Citation2004). All these mechanisms can contribute to increased surface ozone concentration in spring. However, their role most likely varies in different regions and at different observation sites.
Generally, surface ozone is balanced not only by the rate of its exchange within the planetary boundary layer, the rate of atomic oxygen production in photochemical reactions involving ozone precursors, and the rate of ozone destruction in reactions with active atmospheric components, but also by the deposition rate onto the underlying surface. Only a few researchers have considered the deposition rate (Stjernberg et al., Citation2012), despite experimental evidence of a significant reduction in the ozone destruction rate over a snow-covered surface compared with an underlying snow-free surface (Bocquet, Helmig, Van Dam, & Fairall, Citation2011; Colbeck & Harrison, Citation1985; Helmig, Ganzeveld, Butler, & Oltmans, Citation2007, Helmig et al., Citation2009; Wesely & Hicks, Citation2000).
Nine years of measurements from Belarus and Lithuania have revealed a relationship between the timing of the spring ozone maximum and the timing of the snow-cover melt. The earlier the spring melt the lower the probability of a spring maximum in ozone concentration. This relation is simply explained if one considers a sharp increase in the rate of ozone deposition when the underlying surface has no snow.
2 Experimental data
Regular measurements of surface ozone concentration have been conducted in Minsk since 2004 at the National Ozone Monitoring Research and Education Centre (NOMREC) ozone station (53° 50′N, 27° 28′E, 200 m above sea level) of Belarus State University. In order to maintain continuous and accurate monitoring, an open path optical absorption measurement is made using a TrIO-1 ozone analyzer (Balatsko et al., Citation2010). The NOMREC station is located in a southwest suburb of Minsk. With prevailing westerly winds, the influence of city air pollution sources is insignificant. About 40% of the territory of Belarus is forested. The area around the city is used primarily for agriculture.
A TEI-49C certified ozone analyzer is also operational at the station. Its measurements are used periodically (twice a month) to verify the quality of the hourly measurements made by the TrIO-1 analyzer. The TEI-49C instrument undergoes annual calibration against the transfer standard—an ozone analyzer O341M Environment, S.A. No. 1298 at the A. M. Obuchov Institute of Atmospheric Physics (Moscow, Russian Federation). The transfer standard is, in turn, calibrated against the primary standard—a Standard Reference Photometer (SRP) in accordance with the procedure described in Klausen, Zellweger, Buchmann, and Hofer (Citation2003).
Most measurements at the NOMREC station are taken at noon local time (approximately 1000 utc) five days per week. Average monthly values are also based on these data. The analysis shows that data measured at noon local time are well correlated with the average daily data; the correlation coefficient is approximately 0.9.
In Lithuania, monitoring of surface ozone started in 1980 at the Preila background monitoring station (55° 20′N, 21° 00′E, 5 m above sea level, several hundred kilometres from Minsk). The Preila station is located on the Curonian Spit, which separates the Curonian Lagoon from the Baltic Sea (Girgzdiene & Girgzdys, Citation2003, Citation2004; Girgzdiene, Bycenkiene, & Girgzdys, Citation2007). The width of the spit varies from 1.3 km to 3.5 km, and its length is approximately 100 km. The width at the station site is 2 km. The hills in the area are approximately 30 m in height and are naturally forested. Except for sandy dunes, the spit surface is mainly covered by coniferous woods, artificial plantations of dwarf pines, and bush. There are no intensive sources of anthropogenic pollution of the atmosphere, soil, or water close to the observation site. Because of the prevailing westerly winds, the nearest industrial centres, Klaipeda 40 km to the north and Kaliningrad 90 km to the south, are located far enough from the sampling sites that the influence of air pollution sources from these cities is insignificant.
The station activities comply with the requirements defined by the European Monitoring and Evaluation Program (EMEP), which is a cooperative program for monitoring and evaluating long-range transmission of air pollutants in Europe. An ozone analyzer, model O341M, employs the photometric measurement approach in which air enters an optical cell and the amount of ozone is determined by measuring the attenuation of ultraviolet light by ozone. The analyzer is calibrated every year against the primary standard SRP 17 at the Czech Hydrometeorological Institute in Prague.
a Daily Data
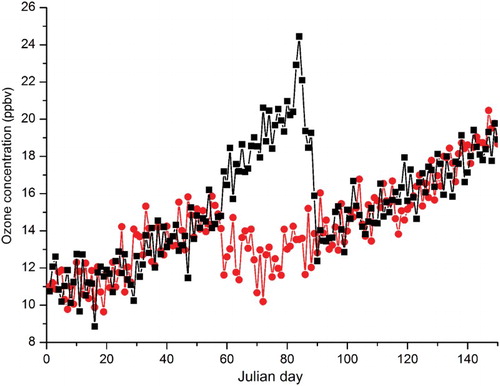
Despite some differences in daily results, ozone data from the NOMREC station are generally well correlated with the data from the Preila station (). The validity of the abnormally high ozone concentration recorded at the beginning of April and the very low concentrations in May for Minsk was confirmed by parallel measurements taken by the TrIO-1 and TEI-49C devices (Balatsko et al., Citation2010). The divergences can be explained by the analysis of the backward trajectories of air mass transport to the stations at Minsk and Preila () (NOAA, Citation2010). In particular, similar ozone concentrations on 1 March 2008 correspond to the situation when both stations were under the influence of the same air mass (a). From 1 to 4 April 2008, the increased ozone concentration at Minsk is evident when compared with the Preila data. This indicates that very different air masses arrived at the two observation sites (b).
Fig. 1 Examples of 2008 surface ozone concentrations measured at noon local time at Minsk and Preila (reproduced from Balatsko et al., Citation2010).
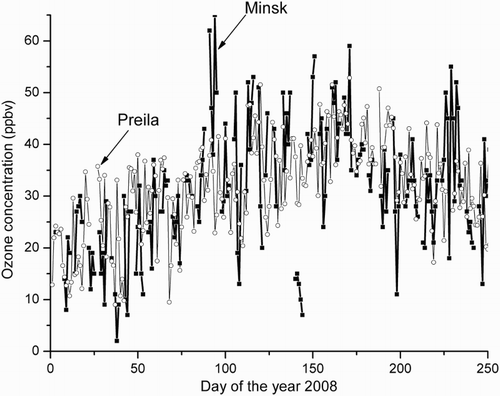
Fig. 2 Examples of backward trajectories of air mass transport to Minsk and Preila during episodes of (a) similar, (b) increased, and (c) decreased ozone concentration in Minsk compared with Preila (from NOAA Air Resources Laboratory (NOAA, Citation2010)).
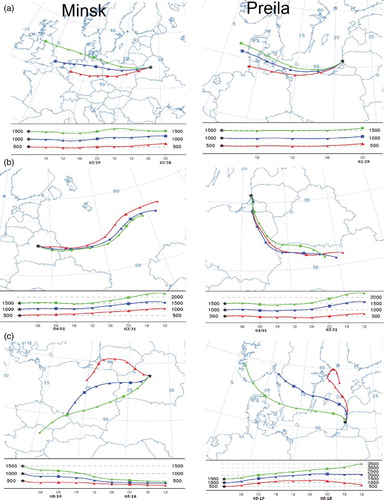
A more interesting situation was observed from 19 to 23 May 2008, when ozone concentrations at Minsk turned out to be significantly lower than those at Preila. Firstly, the air mass trajectories to the two observation sites were very different. Secondly, at both sites, the movement of the air mass at different heights within the bounds of the planetary boundary layer were significantly different. However, the main cause of the decrease in ozone at Minsk compared with Preila was ascending air motion, which is shown by the considerable divergence of the air parcel trajectories as a function of height as they approach the observation site (c).
A comparative analysis of diurnal measurements for both stations () shows the daily amplitude of ozone at Minsk to be somewhat larger than at Preila. This can be explained by the proximity of the Preila station to the Baltic Sea and, consequently, the milder climate of the region, leading to a smaller diurnal temperature range.
Fig. 3 Comparison of diurnal surface ozone concentration at the end of July 2008 for Minsk and Preila (reproduced from Balatsko et al., Citation2010).
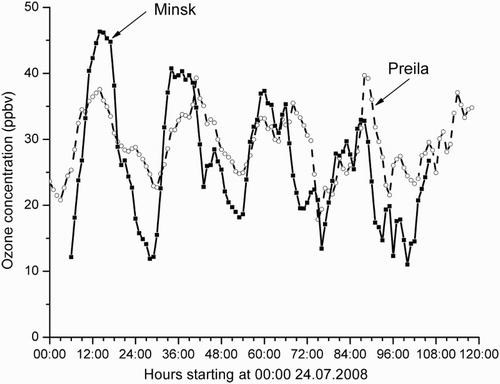
Short-term surface ozone variation at Minsk and Preila are not always well correlated. Most often the differences are generated by local climate features within the same air mass and local emissions of pollutants.
b Monthly Averaged Data
The variability of diurnal surface ozone is of great interest because of its sensitivity to a variety of meteorological factors and the chemical composition of the atmosphere. This sensitivity appears to be rather large and complicated, presenting a challenge in determining the contribution of every source of variability to the resulting ozone concentration.
Quite often data averaged over a long time interval (exceeding the duration of the synoptic period) prove to be more suitable for discovering links between atmospheric phenomena. In particular, monthly average ozone concentration data appear to be more informative than daily data for analyzing seasonal ozone changes to reveal specific seasonal variations for different years.
a shows that all the local differences between the two stations are smoothed out in the monthly average data leaving an annual cycle that is very similar for both stations. Differences larger than 10 ppbv appear only during a few months of the entire period.
Fig. 4 (a) Monthly average concentrations of surface ozone at noon local time for Minsk and Preila and (b) deviation of the monthly average temperatures from normal.
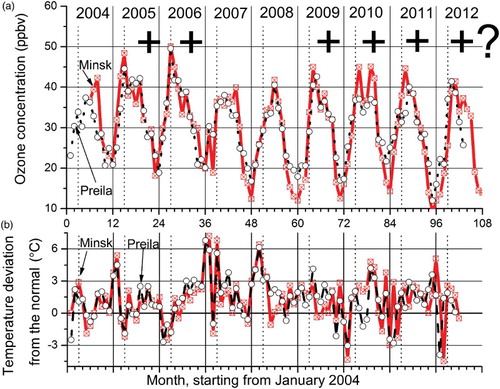
In a, annual seasonal peaks (spring and summer) are visible; in autumn and winter ozone concentration is minimal. However, a strong spring maximum does not occur every year.
c Spring Ozone Maximum and Temperature
In b, the deviations of the monthly average temperature from the climatological mean for Minsk and similar deviations for Preila (all meteorological data are taken from the Klaipeda meteorological station, which is the nearest to Preila) are presented for 2004–12. The link between the temperature deviation from normal and the absence or presence of the spring surface ozone maximum (a) are obvious for both observation sites. In particular, a spring maximum is observed in most years for the Minsk region, provided that the positive deviation of the average March temperature from the normal is less than 3°C. A similar pattern is typical for the Preila station.
Significant positive temperature anomalies in March were observed in 2004, 2007, and 2008 (b). In these years, the spring ozone maximum did not occur (a). On the contrary, in 2005, 2006, and 2009 to 2012, the monthly average temperatures at both sites were around normal and a strong spring surface ozone maximum was observed. It is difficult to analyze the relationship between temperature fluctuations and ozone concentration in the winter when the concentration of ozone is very low and errors in measurement can be quite significant.
From a it is evident that the time of occurrence of the spring ozone maximum varies from year to year and can fall within any of the spring months. This indicates the possible existence of other factors that influence the timing and amplitude of the spring ozone maximum.
Thus, one can state that the appearance of the spring ozone maximum is directly linked to the monthly average temperature in March; the maximum appears when the monthly average temperature is low and does not occur when the average temperature is high. Nevertheless, the physical nature of the link is not clear because it is not yet clear what mechanism directly affects the timing of the spring ozone maximum.
3 Basic assumptions
The following two assumptions will be used as a starting point for further analysis. In spring, the concentration of surface ozone should increase because of 1) intensification of the vertical mixing in the atmosphere and 2) intensification of the photochemical reactions leading to ozone generation in polluted surface layers of the atmosphere (for details, see Kleinman, Citation2005). Both processes are a result of increased solar radiation reaching the surface of the earth. However, the equilibrium concentration of surface ozone depends not only on the rate of its flow and generation at the earth's surface but on the depletion rate as well. Depletion at ground level is believed to be a significant process for ozone removal. Because of its high reactivity, ozone can be effectively destroyed by a variety of substances, and this certainly affects the equilibrium concentration near the surface. Consequently, even within the same air mass, different concentrations of surface ozone will be observed over various underlying surfaces.
A sharp decrease in the ozone deposition rate over snow cover is thought to result in the spring ozone maximum. If snow vanishes somewhat late, after the ozone concentration has reached a sufficiently high value, an increase in the deposition rate forms a dip in the curve of increasing surface ozone concentration. However, attention is often paid to the preceding ozone peak rather than the dip itself. This is called the “surface ozone spring maximum,” ignoring the fact that its creation, to a large extent, is the result of an increase in the ozone deposition rate. If snow melt occurs earlier at lower average ozone concentrations, the effect is difficult to detect because of measurement errors and natural ozone fluctuations; neither a noticeable dip nor a preceding peak is seen in the plot of increasing spring ozone concentration. In , an approximate simulation of both situations is presented.
Fig. 5 Simulation of the formation of the spring ozone maximum resulting from the change in ozone deposition rate. The black line refers to a late snow melt, the red one to an early snow melt.
4 Discussion and conclusions
The similarity of the seasonal changes in surface ozone concentration at Minsk and Preila (a) as well as their mutual dependence on temperature (for the spring maximum, b) means that during the 2004–12 period both stations were, for the most part, affected by the same tropospheric ozone field (determined by the dimensions and transport of tropospheric air masses), and only such local factors as meteorological parameters and the possible emission of air pollutants “modulated” this field in different ways, resulting in somewhat variable daytime concentrations and the daily variation in ozone concentration at the two sites. Rare cases of large differences in ozone concentration were caused by different air masses arriving at the sites. These differences disappear naturally after averaging over a time interval exceeding the duration of synoptic phenomena (a few days or more) typical for the region. As a consequence, monthly average surface ozone concentrations for both stations are closely related.
The link between the spring ozone maximum and the average temperature is of special interest. On the basis of observations from both stations, the dependence of the spring ozone maximum on the March average temperature can be derived; the maximum occurs when the temperature is rather low and does not occur when the temperature increases. However, it is difficult to provide a physical interpretation of such a dependence, because the usual assumption is that an increase in temperature leads to an increase in surface ozone concentration.
The foregoing suggests a need to consider other factors that may influence the concentration of surface ozone, specifically the efficiency of ozone deposition to the underlying surface. Snow cover is known to reduce the rate of ozone decay. The timing of snow cover melt must correlate relatively well with the monthly average temperature although such a correlation is not universal. At the same time, the presence or absence of snow should strongly influence ozone concentration, and the physical mechanism of this influence has been well substantiated. Indeed, the seasonal variation of ozone at Minsk and Preila is closely related to time of snow melt for the entire period of observations (see ). In particular, the presence of snow cover until the end of March unambiguously indicates the presence of a spring ozone maximum. If the snow melts earlier (say, in the middle of March), the maximum will not be detected. The delay in snow melt is caused by lower monthly average temperatures. This explains the link between the occurrence of the spring maximum and a low value for the positive deviation of March average temperatures from the climatological normal (March being the month when the snow cover usually disappears).
Table 1. Correlation of the timing of snow-cover melt at Minsk and Preila with the appearance or absence of the spring ozone maximum in 2004–12.
It should also be noted that the time of snow melt over a sufficiently large region is a somewhat approximate parameter for various reasons, some of which are undoubtedly subjective. Also, one should bear in mind that various other factors influence ozone concentration in spring. This may explain some inconsistencies in Table 1. For example, in 2005 and 2006, the timing of snow melt in Minsk is estimated to occur at the beginning of April, meanwhile the spring ozone maximum was observed in March.
Special attention needs to be paid to the year 2012. In Preila, the snow melted very early. In Minsk, the snow cover vanished twice, once at the end of the third week of March; there was further snowfall in late March that remained until 8 April. Nevertheless, the spring ozone maximum was observed at Preila in April and at Minsk in May. Seemingly, this is the first time when the proposed hypothesis proved to be incorrect (i.e., a spring maximum occurred despite the early disappearance of snow in Preila), Although the average March temperature in Preila was fairly low.
These arguments allow a conclusion to be drawn on the nature of the surface ozone spring maximum in the region. Surface ozone concentration is determined (at least, in spring) by the interaction of two principal processes: the intensity of vertical mixing in the troposphere and the presence or absence of snow cover. For the most part, both factors are controlled by a single variable—air temperature near the ground. The intensity of the mixing increases when the temperature rises resulting in increased ozone concentration near the ground. At the same time, the snow cover disappears when the temperature increases which, in turn, expedites the rate of ozone destruction at the earth's surface, hence, decreasing the ozone concentration. Thus, it is the second factor that is the main determinant of the presence or absence of a spring ozone maximum. The later snow melts, the more pronounced the spring ozone maximum will be, and the later in spring it will occur. After the snow cover disappears, the efficiency of ozone deposition slowly changes with time, and increased vertical mixing caused by solar heating becomes the mechanism for forming the summer ozone maximum.
Perhaps the timing of the snow melt is not the only cause of the spring ozone maximum, but the data presented here indicate the need to account for a sharp change in the ozone deposition rate after the snow melts when interpreting the behaviour of surface ozone at mid-latitudes.
Acknowledgements
The authors would like to thank the staff and head of the climate department of the Belarus State Hydrometeorological Centre, H.V. Komarovskaya, for personally submitting the meteorological data and assisting in their analysis. The authors also express deep gratitude to both the reviewers and the editor for their detailed comments and remarks.
References
- Balatsko, L., Dziomin, V., Krasouski, A., Liudchik, A., & Pakatashkin, V. (2010). Multi-wave differential optical absorption spectroscopy surface ozone measurement with open path meters. In Milind Kr. Sharma (Eds.), Advances in measurement systems (Ch. 22, pp. 538–560). Retrieved from http://www.intechopen.com/books/howtoreference/advances-in-measurement-systems/multi-wave-differential-optical-absorption-spectroscopy-surface-ozone-measurement-with-open-path-met
- Beine, H. J., Jaffe, D. A., Herring, J. A., Kelley, J. A., Krognes, T., & Stordal, F. (1997). High-latitude springtime photochemistry. Part I: NOx, PAN and ozone relationships. Journal of Atmospheric Chemistry, 27, 127–153. doi: 10.1023/A:1005869900567
- Bocquet, F., Helmig, D., Van Dam, B. A., & Fairall, C. W. (2011). Evaluation of the flux gradient technique for measurement of ozone surface fluxes over snowpack at Summit, Greenland. Atmospheric Measurement Techniques, 4, 2305–2321. doi: 10.5194/amt-4-2305-2011
- Colbeck, I., & Harrison, R. M. (1985). Dry deposition of ozone: Some measurements of deposition velocity and of vertical profiles to 100 meters. Atmospheric Environment, 19, 1807–1818. doi: 10.1016/0004-6981(85)90007-1
- Diem, J. E. (2004). Explanations for the spring peak in ground-level ozone in the southwestern United States. Physical Geography, 25, 105–129. doi: 10.2747/0272-3646.25.2.105
- Girgzdiene, R., Bycenkiene, S., & Girgzdys, A. (2007). Variations and trends of AOT40 and ozone in the rural areas of Lithuania. Environmental Monitoring and Assessment, 127, 327–335. doi: 10.1007/s10661-006-9283-9
- Girgzdiene, R., & Girgzdys, A. (2003). Variations of the seasonal ozone cycles in the Preila station over the 1980–2001 period. Environmental and Chemical Physics, 25, 11–15.
- Girgzdiene, R., & Girgzdys, A. (2004). Analysis of the ozone trend in Lithuania during 1982–2002. In Proceedings of Quadrennial Ozone Symposium (pp. 874–875). 1–8 June 2004. Kos, Greece.
- Helmig, D., Cohen, L. D., Bocquet, F., Oltmans, S., Grachev, A., & Neff, W. (2009). Spring and summertime diurnal surface ozone fluxes over the polar snow at Summit, Greenland. Geophysical Research Letters, 36, L08809. doi: 10.1029/2008GL036549
- Helmig, D., Ganzeveld, L., Butler, T., & Oltmans, S. J. (2007). The role of ozone atmosphere-snow gas exchange on polar boundary-layer tropospheric ozone – a review and sensitivity analysis. Atmospheric Chemistry and Physics, 7, 15–30. doi: 10.5194/acp-7-15-2007
- Herring, J. A., Jaffe, D. A., Beine, H. J., Madronich, S. & Blake, D. R. (1997). High-latitude springtime photochemistry. Part II: Sensitivity studies of ozone production. Journal of Atmospheric Chemistry, 27, 155–178. doi: 10.1023/A:1005822017405
- Kim, J. H., & Lee, H. (2010). What causes the springtime tropospheric ozone maximum over northeast Asia? Advances in Atmospheric Sciences, 27, 543–551. doi: 10.1007/s00376-009-9098-z
- Klausen, J., Zellweger, Ch., Buchmann, B., & Hofer, P. (2003). Uncertainty and bias of surface ozone measurements at selected Global Atmosphere Watch sites. Journal of Geophysical Research, 108(D19), 4622. doi: 10.1029/2003JD003710
- Kleinman, L. I. (2005). The dependence of tropospheric ozone production rate on ozone precursors. Atmospheric Environment, 39, 575–586. doi: 10.1016/j.atmosenv.2004.08.047
- Li, Q., Jacob, D. J., Fairlie, T. D., Liu, H., Martin, R. V., & Yantosca, R. M. (2002). Stratospheric versus pollution influences on ozone at Bermuda: Reconciling past analyses. Journal of Geophysical Research, 107(D22), 4611. doi: 10.1029/2002JD002138
- Lin, M., Fiore, A. M., Cooper, O. R., Horowitz, L. W., Langford, A. O., Levy, H., … Senff, C. J. (2012a). Springtime high surface ozone events over the western United States: Quantifying the role of stratospheric intrusions. Journal of Geophysical Research, 117, D00V22. doi:10.1029/2012JD018151
- Lin, M., Fiore, A. M., Horowitz, L. W., Cooper, O. R., Naik, V., Holloway, J., … & Wyman, B. (2012b). Transport of Asian ozone pollution into surface air over the western United States in spring. Journal of Geophysical Research, 117, D00V07. doi:10.1029/2011JD016961
- Monks, P. S. (2000). A review of the observations and origins of the spring ozone maximum. Atmospheric Environment, 34, 3545–3561. doi: 10.1016/S1352-2310(00)00129-1
- NOAA (National Oceanic and Atmospheric Administration). (2010). HYSPLIT data. Air Resources Laboratory. Retrieved from http://www.arl.noaa.gov/ready/
- Stjernberg, A.-C. E., Skorokhod, A., Paris, J. D., Elansky, N., Nédélec, P., & Stohl, A. (2012). Low concentrations of near-surface ozone in Siberia. Tellus B2012, 64, 11607. doi:10.3402/tellusb.v64i0.11607
- Tanimoto, H., Sawa, Y., Matsueda, H., Uno, I., Ohara, T., Yamaji, K., … Yonemura, S. (2005). Significant latitudinal gradient in the surface ozone spring maximum over East Asia. Geophysical Research Letters, 32, L21805. doi: 10.1029/2005GL023514
- Tarasova, O. A., Brenninkmeijer, C. A. M., Jöckel, P., Zvyagintsev, A. M., & Kuznetsov, G. I. (2007). A climatology of surface ozone in the extra tropics: Cluster analysis of observations and model results. Atmospheric Chemistry and Physics, 7, 6099–6117. Retrieved from http://link.springer.com/article/10.1023%2FA%3A1005869900567 doi: 10.5194/acp-7-6099-2007
- Vingarzan, R. (2004). A review of surface ozone background levels and trends. Atmospheric Environment, 38, 3431–3442. doi: 10.1016/j.atmosenv.2004.03.030
- Wesely, M. L., & Hicks, B. B. (2000). A review of the current status of knowledge on dry deposition. Atmospheric Environment, 34, 2261–2282. doi: 10.1016/S1352-2310(99)00467-7
- Zhu, B., Akimoto, H., Wang, Z., Sudo, K., Tang, J., & Uno, I. (2004). Why does surface ozone peak in summertime at Waliguan? Geophysical Research Letters, 31, L17104. doi: 10.1029/2004GL020609
- Zvyagintsev, A. M., Kakadzhanova, G., Kruchenitskii, G. M., & Tarasova, O. A. (2008). Periodic variability of surface ozone concentration over western and central Europe from observational data. Russian Meteorology and Hydrology, 33, 159–166. doi: 10.3103/S1068373908030047