
Abstract
Sea surface winds from the Oceansat-2 scatterometer (OSCAT) are important inputs to Numerical Weather Prediction (NWP) models. The Indian Space Research Organization (ISRO) recently updated the OSCAT retrieval algorithm in order to generate better products. An attempt has been made in this study to evaluate the updated OSCAT winds using buoy observations and the 6-hour short-term forecasts from the T574L64 model from the National Centre for Medium Range Weather Forecasting (NCMRWF) during the 2011 monsoon. The results of the OSCAT evaluation are also compared with those from the Advanced Scatterometer (ASCAT) on-board the Meteorological Operational Satellite-A (MetOp-A) which were evaluated in the same way. The root mean square differences (RMSDs) for wind speed and direction, are within 2 m s−1 and 20° for both scatterometers. The RMSDs for OSCAT are slightly higher than those for ASCAT, and this difference may be attributed in part to the difference in frequency and resolution of the scatterometer payloads. The bias and standard deviation for ASCAT winds are also lower than those for OSCAT winds with respect to the model short-range forecast, and this can be attributed to the regular assimilation of ASCAT winds in the model.
Résumé
[Traduit par la rédaction] Les vents à la surface de la mer fournis par le diffusiomètre Oceansat-2 (OSCAT) sont des données d'entrée importantes dans les modèles de prévision numérique du temps. L’Indian Space Research Organization (ISRO) a récemment mis à jour l'algorithme d'extraction de l'OSCAT dans le but d'obtenir de meilleurs produits. Nous avons essayé dans cette étude d’évaluer les vents fournis par le nouvel algorithme de l'OSCAT en nous servant des observations par bouées et des prévisions à court terme de 6 heures du modèle T574L64 du National Centre for Medium Range Weather Forecasting (NCMRWF) durant la mousson de 2011. Nous comparons aussi les résultats de l’évaluation des vents OSCAT avec les vents fournis par le diffusiomètre de pointe (ASCAT) du Satellite météorologique opérationnel A (MetOp-A) qui ont été évalués de la même façon. Les écarts-types pour la vitesse et la direction du vent sont en deçà de 2 m s−1 et 20° pour les deux diffusiomètres. Les écarts-types pour l'OSCAT sont légèrement plus grands que pour l'ASCAT et cette différence peut en partie s'expliquer par la différence dans la fréquence et la résolution des charges utiles en diffusiomètre. Le biais et l’écart-type des vents ASCAT sont aussi plus faibles que ceux des vents OSCAT calculés par rapport à la prévision à court terme du modèle et cette différence peut être attribuable à l'assimilation régulière des vents ASCAT dans le modèle.
Keywords:
1 Introduction
Remotely sensed observations from scatterometers on-board polar orbiting satellites supply routine data with better resolution and coverage than conventional measurements from ships and buoys. Earth observation satellites provide crucial data on ocean surface winds over the data-sparse Indian Ocean and enable accurate analyses of monsoon flow, particularly the monitoring of cyclones.
There have been several scatterometer missions. These include the Seasat-A Satellite Scatterometer (SASS) launched in 1978; the European Remote Sensing (ERS) Active Microwave Instruments (AMI) ERS-1 and ERS-2 launched, respectively, in 1991 and 1995; the National Aeronautics and Space Administration (NASA) Scatterometer (NSCAT) on-board the Advanced Earth Observation System-I (ADEOS-I) satellite of the National Space Development Agency (NASDA) of Japan launched in 1996; the NASA sea winds scatterometer on-board the Quick Scatterometer (QuikSCAT) launched in 1999; the Advanced Scatterometer (ASCAT) on-board the Meteorological Operational Satellite-A (MetOp-A) launched in 2006 by the European Space Agency (ESA); and the Oceansat-2 scatterometer (OSCAT) launched in 2009 by the Indian Space Research Organization (ISRO). Scatterometers do not measure the marine surface wind directly but measure the electromagnetic radiation signal backscattered from the sea surface and the radar cross-section of the ocean surface. A geophysical model function (GMF) provides the radar cross-section as a function of the equivalent neutral wind vector at the 10 m anemometer height, incidence angle, relative azimuth angle, radar frequency, and polarization (Hersbach, Stoffelen, & De Haan, Citation2007; Wentz & Smith, Citation1999). Numerical inversion of the GMF yields the scatterometer wind measurements (Stoffelen & Portabella, Citation2006). Therefore, the quality of the retrieved winds needs to be assessed. Numerous validation studies have been carried out by comparing the scatterometer winds with in situ buoy winds. These include evaluations for SASS (Jones et al., Citation1982), ERS/AMI (Ebuchi, Graber, & Vakkayil, Citation1996; Graber, Ebuchi, & Vakkayil, Citation1996), ADEOS NSCAT (Dickinson, Kelly, Caruso, & McPhaden, Citation2001; Masuko et al., Citation2000), QuikSCAT/seawinds (Deb, Bhowmick, Kumar, & Sarkar, Citation2009; Ebuchi, Graber, & Caruso, Citation2002; Goswami & Rajagopal, Citation2003; Satheesan, Sarkar, Parekh, Ramesh Kumar, & Kuroda, Citation2007), and ASCAT/MetOp-A (Verhoef & Stoffelen, Citation2013).
As to the frequency of the scatterometers, ESA uses the C-band (approximately 5 GHz), whereas NASA prefers the Ku-band (approximately 14 GHz). A higher frequency is more sensitive to shorter surface waves. The Ku-band is more sensitive to wind variation at low speeds but is subject to more atmospheric effects and rain contamination (Portabella & Stoffelen, Citation2001). For more than two decades, there have been calls for multi-frequency scatterometers that are sensitive to various parts of the ocean surface wave spectrum and, hence, may mitigate the shortcomings of both the C-band and Ku-band scatterometers (Huang, Parsons, Long, & Bliven, Citation1984). OSCAT is a Ku-band scatterometer, whereas ASCAT is a C-band scatterometer. The Oceansat-2 satellite has been yawed by 20° as a compromise for the three instruments on-board (the Ocean Colour Monitor (OCM), OSCAT, and the Radio Occultation Sounder for Atmospheric Studies (ROSA)), so that OSCAT retrievals can be performed. The swaths of OSCAT and ASCAT are 1400 km and 550 km, respectively, both giving global ocean coverage with a revisit time of two days.
The validation results of Singh, Kumar, and Pal (Citation2011) and Sudha and Prasada Rao (Citation2013) showed that the error in OSCAT-derived wind direction with respect to buoy data is higher than the mission goal of 20°. The OSCAT Level-2B (L2B) wind data (version 1.3, released in December 2011), reprocessed by ISRO, are available through the National Remote Sensing Centre (NRSC; www.nrsc.gov.in). In the new algorithm, a more efficient approach, known as the normalized standard deviation (NSD) of the derived wind speed, has been developed to derive ranked wind vector solutions from scatterometer measurements (Gohil, Sarkar, & Agarwal, Citation2008). The directional ambiguities are removed by making use of advanced median filters (Gohil, Sharma, Sikhakoli, & Sarkar, Citation2010). Chakraborty, Kumar, and Stoffelen (Citation2013) reported that the error standard deviations of this new OSCAT L2B data and buoy winds are quite similar. In this study, we assess the performance of OSCAT L2B data with respect to buoy observations and short-term model forecasts and compare this performance with that of ASCAT winds during the 2011 monsoon. The present study differs from previous studies in two ways. The validation is confined to the monsoon period and is carried out over three different latitudinal bands instead of globally: the northern band (20°–90°N), the tropics (20°N–20°S), and the southern band (20°–90°S). A short overview of the OSCAT and ASCAT scatterometers is given in Section 2. The data and methodology are described in Section 3. The results are presented in Section 4, followed by conclusions in Section 5.
2 An overview of OSCAT and ASCAT scatterometers
The Oceansat-2 satellite with OSCAT on-board was launched by ISRO on 23 September 2009 using the PSLV-C14 carrier rocket. Oceansat-2 is in a sun synchronous circular orbit with a period of about 99.31 minutes at an inclination of 98.28° and at a height of 720 km. OSCAT is an active microwave device designed and developed at ISRO. It determines ocean surface wind vectors through the estimation of radar backscatter. The scatterometer has a 1 m parabolic dish antenna and a dual feed assembly to generate two pencil beams that scan at the rate of 20.5 rpm to cover the entire swath. The Ku-band pencil beam operates at 13.515 GHz, providing a ground resolution cell of 50 × 50 km. It consists of a parabolic dish antenna, 1 m in diameter, that is offset-mounted with a cant angle of 46° with respect to the earth viewing axis. The antenna is continuously rotated at 20.5 rpm using a scan mechanism with the scan axis along the positive yaw axis. By using two offset feeds at the focal plane of the antenna, two beams are generated that scan the ground surface conically. The backscatter power of each beam from the ocean surface is measured and used to derive the wind vector. The inner and outer beams have incidence angles of 48.9° and 57.6° with the ground, respectively. OSCAT covers a continuous swath of 1400 km with the inner beam and 1840 km with the outer beam. The inner and outer beams are configured in horizontal and vertical polarizations, respectively, for both transmit and receive modes.
The ASCAT was launched on 19 October 2006 by the European Organisation for the Exploitation of Meteorological Satellites (EUMETSAT) on-board the MetOp satellite. The scientific and technical documentation related to ASCAT-derived products can be found at http://www.knmi.nl/scatterometer/publications/. The MetOp satellite is in a circular orbit with a period of approximately 101 minutes, at an inclination of 98.59° and at a height of 800 km. ASCAT has two swaths 550 km wide, located on each side of the satellite track, separated by 700 km. It operates at 5.3 GHz (C-band). Its fore-beam and aft-beam antennae point at 45° and 135° on each side of the satellite track. The mid-beam antenna points at 90°. The ASCAT beams measure normalized radar cross-sections with vertical polarization (σ0), a technique that describes the ratio of the effective echoing area per unit area illuminated. The fore- and aft-beams provide backscatter coefficient measurements at incidence angles varying from 34° to 64°. The mid-beams provide σ 0 measurements at incidence angles varying from 25° to 53°. Backscatter coefficients are provided for two spatial resolutions, 25 km and 12.5 km, over the global ocean.
3 Data and methodology
Winds from OSCAT and ASCAT during the southwest monsoon of 2011 (June to September), along with buoy winds and the T574L64 model 6-hour forecast from the National Centre for Medium Range Weather Forecasting (NCMRWF) are used in this study. The ASCAT winds from the National Oceanic and Atmospheric Administration/National Environmental Satellite, Data, and Information Service (NOAA/NESDIS) are routinely downloaded at NCMRWF. The details of ASCAT data processing and products are discussed in Figa et al. (Citation2002).
Because the scatterometer winds are at 10 m, the moored buoy winds, normally reported at 3 m, are converted to 10 m height using the logarithmic profile method (Peixoto & Oort, Citation1992). Denoting the wind speeds at 3 m and 10 m as Ws(3 m) and Ws(10 m), respectively, thenwhere Z = 10 m, Z
ref = 3 m, and Z
0 = 1.52 × 10⁻⁴ m. The limitation of this method is that atmospheric stability is not taken into account.
Mears, Smith, and Wentz (Citation2001) applied both the logarithmic profile method and the method of Liu and Tang (Citation1996) to buoy data in a comparison of Special Sensor Microwave/Imager (SSM/I) winds with buoy winds. The Liu and Tang method evaluates atmospheric stability in the computation of wind speed at a standard height. This method requires measurements of humidity, sea surface temperature, and atmospheric temperature. The buoy data received at NCMRWF through the Global Telecommunication System (GTS) does not report temperature and humidity on a regular basis. The logarithmic profile method only requires wind speed at the reference height, not the stability parameters.
The scatterometer winds are collocated with the buoy winds only if they are spatially within a box of 0.5° × 0.5° and temporally within 30 minutes. Each buoy observation is considered only once when matched to a scatterometer measurement within a temporal resolution of 30 minutes. Statistical parameters, such as mean wind speed, speed bias, root mean square difference (RMSD), and the number of collocated winds are estimated separately for OSCAT and ASCAT. The RMSD is calculated using the following equation:where ob is the scatterometer wind speed (or direction), bg is the buoy wind speed (or direction), and N is the number of collated (NC) scatterometer winds.
The OSCAT and ASCAT winds are also compared with the 6-hour forecasts from the NCMRWF T574L64 model. Scatterometer winds with a direction difference greater than 90° with respect to the model forecast are not considered for the collocation (Stoffelen & Anderson, Citation1997). Monthly mean vector plots and speed bias density plots for OSCAT and ASCAT winds with respect to model forecasts are generated.
4 Results and discussion
a Validation of Scatterometer Winds using Buoy Winds
The scatterometer winds from OSCAT and ASCAT are compared with in situ buoy winds during the 2011 monsoon. shows the buoy locations. shows the statistical parameters calculated to compare OSCAT and ASCAT wind speeds with buoy wind speeds. These parameters are calculated separately over the northern band (north of the tropics) and over the tropics. Though the buoy observations south of the tropics are also received at NCMRWF, most of the time they do not include wind fields. In , mean ws (scat) and mean ws (buoy) are the monthly mean scatterometer wind speeds and buoy wind speeds, respectively, and NC is the number of collocated scatterometer winds. Both OSCAT and ASCAT produce lower monthly mean wind speeds than the buoy winds over the northern band and the tropics; however, the magnitude of the slower bias is smaller for ASCAT winds.
Fig. 1 Buoy locations.
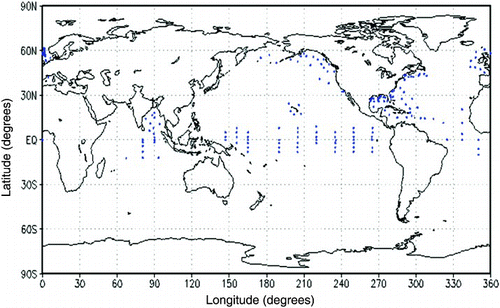
Table 1. Statistical parameters for OSCAT and ASCAT wind speeds during the 2011 monsoon over the northern band and the tropics (ws (scat) is the monthly mean scatterometer wind speed; ws (buoy) is the monthly mean buoy wind speed; and NC is the number of collocated scatterometer winds).
Over the northern band, the RMSD for ASCAT winds ranges from 1.25 to 1.87 m s−1 and for OSCAT ranges from 1.93 to 2.13 m s−1. Over the tropics, the RMSD is smaller compared with the northern band for both OSCAT and ASCAT. Over the tropics, the RMSD of ASCAT winds is approximately 1.0 m s−1, which is smaller than the 1.54–1.74 m s−1 range for OSCAT winds. ISRO L2B wind data quality is reasonable (Stoffelen & Verhoeff, Citation2011), but the standard deviations of the wind component with respect to model winds from the European Centre for Medium-range Weather Forecasts (ECMWF) and in situ buoy winds are higher than 2 m s−1, exceeding the error limit specification set by the EUMETSAT Ocean and Sea Ice Satellite Application Facility (OSI SAF). Mathew, Chakraborty, Sarkar, and Kumar (Citation2012) compared five years of QuikSCAT wind data (2005–09) and one year of OSCAT (2010) wind data with winds speeds estimated from altimeters on-board the Jason satellite. They revealed that the bias and standard deviation for OSCAT winds are marginally higher than those for QuikSCAT with respect to Jason altimeter data. They proposed that OSCAT observations could be used to fill the gap caused by the non-availability of QuikSCAT. The number of collocated scatterometer and buoy wind measurements is higher for OSCAT over both the northern band and the tropics. This can be attributed to the wider coverage of OSCAT (swath approximately 1400 km) compared with ASCAT (swath approximately 550 km). For both OSCAT and ASCAT, the number of collocated wind measurements is larger over the northern band than over the tropics.
shows the statistical parameters calculated for OSCAT and ASCAT wind directions and buoy wind directions. In , mean wd (scat) and mean wd (buoy) are the monthly mean scatterometer wind directions and buoy wind directions, respectively, and NC is the number of collocated scatterometer winds. The wind directions observed from the buoy platforms are more westerly than those from scatterometers, especially over the northern band. Similar to wind speed, the wind direction bias is smaller for ASCAT than for OSCAT. The RMSDs for wind direction are also smaller for ASCAT. Similar to the RMSDs for wind speed, the RMSDs for wind direction for both scatterometers are smaller over the tropics than over the northern band.
Table 2. Statistical parameters for OSCAT and ASCAT wind directions during the 2011 monsoon over the northern band and the tropics (wd (scat) is the monthly mean scatterometer wind direction; wd (buoy) is the monthly mean buoy wind direction; and NC is the number of collocated scatterometer winds).
Chakraborty et al. (Citation2013) reported that the error standard deviations for both components of the OSCAT winds, are identical to those for the ECMWF analysis and 87 global buoys. Singh et al. ( Citation2011) also compared OSCAT winds with buoy winds for July 2010 and reported that the RMSDs for wind speed and direction are 2 m s−1 and 35°, respectively. Sudha and Prasada Rao (Citation2013) compared OSCAT winds with buoy observations over the Indian Ocean and Pacific Ocean and reported that wind speed accuracies are within the mission requirement (2 m s−1) but the wind direction errors are higher than the mission requirement (20°). The present study shows that both wind speed and direction accuracy are within the mission goal.
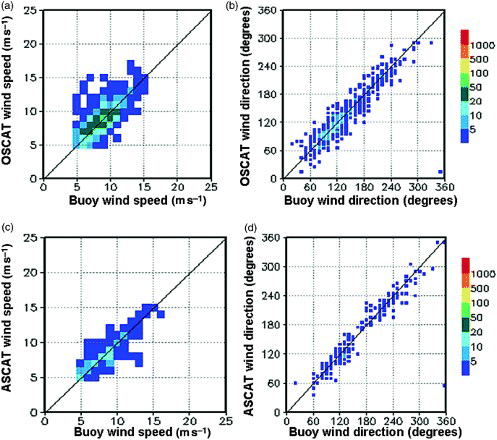
and depict the density plots for wind speed and direction from OSCAT and ASCAT against collocated buoy observations for July 2011 over the northern band and the tropics, respectively. and are the density plots for OSCAT and ASCAT wind speed against buoy wind speed over the northern band and and are the corresponding OSCAT and ASCAT wind directions over the same region. Figures , , , and are similar to those in but over the tropics. The wind speeds are grouped in 1 m s−1 bins, whereas the wind directions are grouped in 5° bins. For both regions, the wind speeds from both scatterometers match the buoy wind speeds. Over the tropics, the number of collocated points having wind speeds above 15 m s−1 is smaller than over the northern band.
Fig. 2 Density plot for scatterometer winds with respect to buoy winds: (a) OSCAT wind speed, (b) OSCAT wind direction, (c) ASCAT wind speed, and (d) ASCAT wind direction for July 2011 over the northern band (the colour bar indicates the number of collocated scatterometer winds).
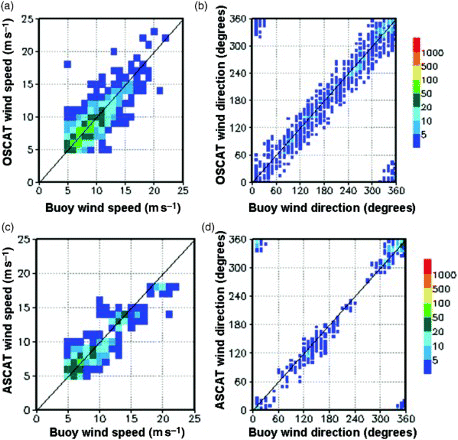
Fig. 3 As in , but over the tropics.
b Validation of Scatterometer Winds using NCMRWF T574L64 Model Forecast
The statistics computed by collocating scatterometer winds with buoy winds may not represent the error globally because of poor spatial and temporal sampling and uneven distribution of buoys. We now compare OSCAT and ASCAT winds with the 6-hour forecast of 10 m winds from the T574L64 model from NCMRWF. NCMRWF regularly assimilates ASCAT winds in each six-hourly assimilation cycle but did not assimilate the OSCAT winds during the study period. At the time of each comparison (e.g., 0000 utc), the 6-hour forecast winds for the previous cycle (starting at 1800 utc of the previous day) are compared with the scatterometer winds for the current time. Although the ASCAT winds for the current time were not assimilated at the time of comparison, the model forecast may still tend to have a bias towards this product because of the regular assimilation of this product. Monthly mean vector plots and density plots for scatterometer winds from OSCAT and ASCAT over three latitudinal bands (i.e., northern, tropics, and southern) are generated for the 2011 monsoon. In the vector plots, the mean vector difference and the number of collocated winds are shown. For the near polar sun synchronous orbiting satellite, the time average differences between the satellite and models may be indicative of diurnal wind variations that depend on the direction of the satellite overpass.
1 Vector Plots
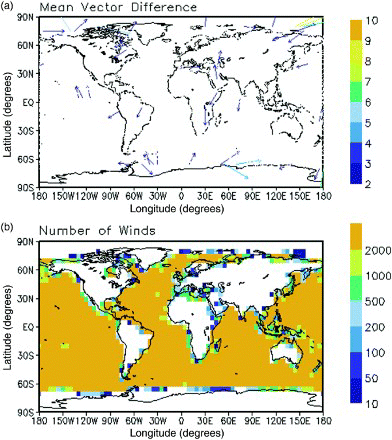
and show the mean vector differences along with the number of collocated winds for OSCAT and ASCAT winds, respectively, for July 2011. The mean vector difference is the monthly mean difference between the scatterometer winds and the corresponding 10 m winds from the 6-hour model forecast. Vector differences with magnitudes less than 2 m s−1 and greater than 10 m s−1 are not plotted. All grid points where the number of scatterometer winds per month is less than 10 are also omitted. In and , the colour bar represents the magnitude of the mean vector difference, and in and the colour bar represents the number of collocated scatterometer winds. As seen from and , the mean vector difference for OSCAT is slightly higher than for ASCAT. The mean vector difference for ASCAT winds is less than 2 m s−1 globally, except for several points over the polar region in the northern hemisphere, whereas that for OSCAT winds is greater than 2 m s−1 over large areas. The OSCAT winds have larger errors over the low level jet and cross-equatorial flow regions, which are the two important lower atmospheric wind patterns during monsoon. (The cross-equatorial flow in the Indian Ocean is a meridional overturning circulation consisting of the northward flow of southern-hemisphere thermocline water, upwelling in the northern hemisphere, and a return flow of surface water.) The ASCAT winds have considerably smaller errors in these regions. This may be due to the different scatterometer frequencies. The Ku-band scatterometer is subject to more atmospheric effects and rain contamination (Portabella & Stoffelen, Citation2001). Even after applying the rain quality flag, OSCAT winds have large errors in the monsoon regions. Another reason for the large errors in OSCAT winds could be the regular assimilation of ASCAT winds into the NCMRWF model. Similar results were obtained for other months during the 2011 monsoon. The number of collocated scatterometer winds is higher for ASCAT (b) than for OSCAT (b) because of the difference in their resolutions.
Fig. 4 Vector plot of OSCAT winds: (a) mean vector difference (the colour bar indicates the magnitude of the vector difference and (b) number of collocations (the colour bar indicates the number of collocated scatterometer winds) for July 2011.
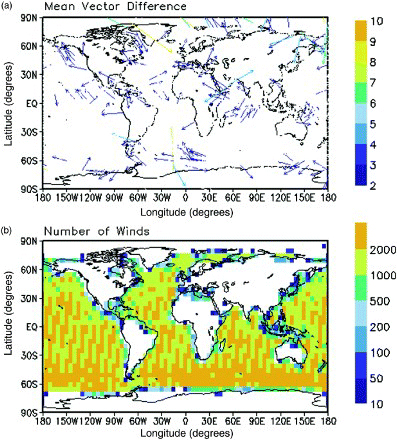
Fig. 5 As in , but for ASCAT winds.
2 Density plots
and show density plots for OSCAT and ASCAT wind speeds for July 2011. Each plot has three panels: one for the northern band, one for the tropics, and one for the southern band. Scatterometer winds with magnitudes above 25 m s−1 and below 2.5 m s−1 are not considered for the collocation and calculation of bias and standard deviation. The range of medium winds (5–15 m s−1) constitutes the major wind data population and has a similar spread for OSCAT and ASCAT. The OSCAT density plots depict an off-diagonal asymmetry (). This may be a result of the Ku-band scatterometer of OSCAT being more prone to rain contamination. The monsoon season is an atmospherically active period when both synoptic and local circulation phenomena are conducive to producing more atmospheric effects, such as local convection.
Fig. 6 Density plot for OSCAT winds with respect to model background winds over (a) the northern band (20°–90°N), (b) the tropics (20°N–20°S), and (c) the southern band (20°–90°S) for July 2011 (the colour bar indicates the number of collocated scatterometer winds).
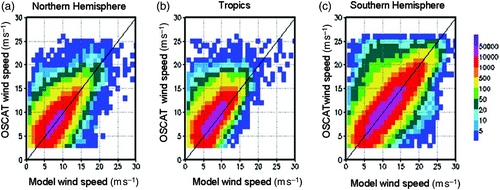
Fig. 7 As in , but for ASCAT winds.
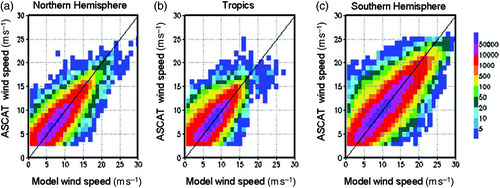
The bias and standard deviation of OSCAT and ASCAT winds with respect to the model forecast over the northern band, the tropics, and the southern band are tabulated in . It can be seen that both scatterometer winds perform better over the tropics than over the other two latitudinal bands. For the northern band, the standard deviations of the wind speed (direction) are approximately 2.2 m s−1 (15°) and approximately 1.5 m s−1 (12°) for OSCAT and ASCAT, respectively, and the standard deviations of the wind components (zonal and meridional) are approximately 3 m s−1 and approximately 1.8 m s−1 for OSCAT and ASCAT, respectively. For the tropics, the standard deviations of wind speed (direction) are approximately 1.8 m s−1 (7°) and 1.3 m s−1 (6.5°) for OSCAT and ASCAT, respectively, and the standard deviations for the wind components (zonal and meridional) are approximately 2.5 m s−1 and approximately 1.5 m s−1 for OSCAT and ASCAT, respectively. For the southern band, the standard deviations of wind speed (direction) are approximately 2 m s−1 (14°) and approximately 1.8 m s−1 (13°) for OSCAT and ASCAT, respectively. The standard deviations for the zonal (meridional) wind components are approximately 3 m s−1 (approximately 2.2 m s−1) for both OSCAT and ASCAT.
Table 3. Statistical parameters of wind speed, wind direction, zonal wind, and meridional wind for OSCAT and ASCAT with respect to NCMRWF model 6 h forecast during the 2011 monsoon over the northern latitudinal band.
Table 4. As in but over the tropics.
Table 5. As in , but over the southern latitudinal band.
The standard deviations of wind direction over the tropics are almost half those over the other two latitudinal bands. Sathiyamoorthy, Sikhakolli, Gohil, and Pal (Citation2012) carried out a preliminary validation of OSCAT surface winds with ECMWF reanalysis surface winds from June to August 2010 and reported that the quality of the OSCAT winds meet mission specifications. Singh et al. (Citation2011) also showed that the RMSDs of the speed and direction of OSCAT winds with respect to reanalyses from the National Centers for Environmental Prediction (NCEP) are 2.1 m s−1 and 26°, respectively. The present study shows that the error values with respect to model forecasts are also within mission specifications, particularly over the tropics.
3 Triple collocation
Simultaneous (triple) collocation of OSCAT, ASCAT, and model forecast data permit a more robust evaluation of errors in the three estimates of the true winds (Stoffelen, Citation1998). Because the OSCAT and ASCAT satellite passes complement each other, only a limited number of collocations of OSCAT and ASCAT within a limited spatial (0.5°) and temporal (approximately 1 hour) resolution occur. Because the number of triple-collocated points is so few in June and July, the analysis is carried out only for August and September 2011. lists the speed bias, RMSD, and number of collocated points resulting from the triple collocation of OSCAT, ASCAT, and model winds. With respect to the model 6-hour forecast, the RMSDs for ASCAT winds are smaller (3.3–3.8 m s−1) than that for OSCAT winds (5.1–5.4 m s−1). The RMSDs between OSCAT and ASCAT are 4.6 to 4.8 m s−1. The lower value of the RMSDs for ASCAT with respect to the 6-hour forecast may be caused by the regular assimilation of ASCAT winds into the NCMRWF T574L64 model.
Table 6. Statistical parameters for triple collocations of OSCAT, ASCAT, and modelled 6 h forecast winds. NC is the number of triple-collocated point.
5 Conclusions
Validation of OSCAT winds using in situ buoy observations and NCMRWF T574 L64 model 6-hour forecasts is carried out for the 2011 monsoon. The same analysis is repeated for ASCAT winds in order to assess the quality of the former in terms of other scatterometer winds. Comparison of scatterometer winds with buoy winds shows that the RMSDs for OSCAT winds are slightly higher than those for ASCAT winds but are within the mission goal (2 m s−1 and 20°). The difference in the performance of the two scatterometers may be partly attributed to differences in instrument frequency and resolution. Comparison with 6-hour forecasts also shows that the ASCAT winds are slightly more accurate than OSCAT winds. The range of the medium winds (5–15 m s−1) that constitute the major wind data population has a similar spread in the scatterplots for both OSCAT and ASCAT. The RMSDs for OSCAT winds with respect to the ASCAT winds is approximately 4.5 m s−1. Validation shows that the scatterometer winds are more accurate over the tropics than over either the northern or southern bands.
Acknowledgements
The authors acknowledge the support rendered by the Director, NCMRWF during this work. The authors also extend their thanks to scientists from ISRO for making the OSCAT data available to NCMRWF through the NRSC and EUMETCAST link and to NESDIS for making the ASCAT data available. The authors are grateful to the anonymous reviewers and editor for their constructive comments and suggestions, which helped to improve the paper.
References
- Chakraborty, A., Kumar, R., & Stoffelen, A. (2013). Validation of ocean surface winds from the OCEANSAT-2 scatterometer using triple collocation. Remote Sensing Letters, 4(1), 85–94. doi:10.1080/2150704X.2012.693967 doi: 10.1080/2150704X.2012.693967
- Deb, S. K., Bhowmick, S. A., Kumar, R., & Sarkar, A. (2009). Inter-comparison of numerical model generated surface winds with QuikSCAT winds over Indian Ocean. Marine Geodesy, 32(4), 391–408. doi: 10.1080/01490410903297865
- Dickinson, S., Kelly, K. A., Caruso, M. J., & McPhaden, M. J. (2001). Comparisons between the TAO buoy and NASA scatterometer wind vectors. Journal of Atmospheric and Oceanic Technology, 18, 799–806. doi: 10.1175/1520-0426(2001)018<0799:CBTTBA>2.0.CO;2
- Ebuchi, N., Graber, H. C., & Caruso, M. J. (2002). Evaluation of wind vectors observed by QuikSCAT/sea winds using ocean buoy data. Journal of Atmospheric and Oceanic Technology, 19, 2049–2062. doi: 10.1175/1520-0426(2002)019<2049:EOWVOB>2.0.CO;2
- Ebuchi, N., Graber, H. C., & Vakkayil, R. 1996. Evaluation of ERS-1 scatterometer winds with wind and wave ocean buoy observations. Tech. Rep. CAOS. Tohoku University CAOS 96–1.
- Figa, J., Wilson, J. J. W., Attema, E., Gelsthorpe, R., Drinkwater, M. R., & Stoffelen, A. (2002). The Advanced Scatterometer (ASCAT) on the Meteorological Operational (MetOp) platform: A follow on for European wind scatterometers. Canadian Journal of Remote Sensing, 28(3), 404–412. doi: 10.5589/m02-035
- Gohil, B. S., Sarkar, A., & Agarwal, V. K. (2008). A new algorithm for wind vector retrieval from scatterometer. IEEE Transactions on Geoscience and Remote Sensing Letters, 5, 387–391. doi: 10.1109/LGRS.2008.917129
- Gohil, B. S., Sharma, P., Sikhakoli, R., & Sarkar, A. (2010). Directional Stability and Conservation of Scattering (DiSCS)-based directional-ambiguity removal algorithm for improving wind fields from scatterometer: A QuickSCAT example. IEEE Transactions on Geoscience and Remote Sensing Letters, 7, 592–595. doi: 10.1109/LGRS.2010.2042138
- Goswami, B. N., & Rajagopal, E. N. (2003). Indian Ocean surface winds from NCMRWF analysis as compared to QuikSCAT and moored buoy winds. Proceedings of the Indian Academy of Sciences-Earth and Planetary Sciences, 112, 61–77.
- Graber, H. C., Ebuchi, N., & Vakkayil, R. (1996). Evaluation of ERS-1 scatterometer winds with wind and wave ocean buoy observations. University of Miami, Tech. Rep. RSMAS 96–003.
- Hersbach, H., Stoffelen, A., & De Haan, S. (2007). An improved C-band scatterometer ocean geophysical model function: CMOD5. Journal of Geophysical Research, 112, C03006. doi:10.1029/2006JC003743. doi: 10.1029/2006JC003743
- Huang, N. E., Parsons, C. L., Long, S. R., & Bliven, L. F. (1984). A new type of overshoot phenomenon in wind wave development and its implications in remote sensing of the ocean. Journal of Geophysical Research, 89, 3679–3687. doi: 10.1029/JC089iC03p03679
- Jones, W. L., Schroeder, L. C., Boggs, D. H., Bracalante, E. M., Brown, R. A., Dome, G. J., …Wentz, F. J. (1982). The relationship between wind vector and normalized radar cross section used to derive SEASAT-A satellite scatterometer winds. Journal of Geophysical Research, 87, 3318–3336. doi: 10.1029/JC087iC05p03318
- Liu, W. T., & Tang, W. (1996). Equivalent neutral wind. JPL Pub. 96–17. Pasadena, US: Jet Propulsion Laboratory.
- Masuko, H., Arai, K., Ebuchi, N., Konda, M., Kubota, M., Kutsuwada, K., …Tahara, Y. (2000). Evaluation of vector winds observed by NSCAT in the seas around Japan. Journal of Oceanography, 56, 495–505. doi: 10.1023/A:1011192725800
- Mathew, T., Chakraborty, A., Sarkar, A., & Kumar, R. (2012). Comparison of oceanic winds measured by space-borne scatterometers and altimeters. Remote Sensing Letters, 3(8), 715–720. doi:10.1080/2150704X.2012.674226 doi: 10.1080/2150704X.2012.674226
- Mears, C., Smith, D., & Wentz, F. J. (2001). Comparison of SSM/I and buoy-measured wind speeds from 1987 to 1997. Journal of Geophysical Research, 106, 11719–11729. doi: 10.1029/1999JC000097
- Peixoto, J. P., & Oort, A. H. (1992). Physics of climate. Woodbury, NY: American Institute of Physics.
- Portabella, M., & Stoffelen, A. (2001). Rain detection and quality control of seawinds. Journal of Atmospheric and Oceanic Technology, 18(7), 1171–1183. doi: 10.1175/1520-0426(2001)018<1171:RDAQCO>2.0.CO;2
- Satheesan, K., Sarkar, A., Parekh, A., Ramesh Kumar, M. R., & Kuroda, Y. (2007). Comparison of wind data from QuikSCAT and buoys in the Indian Ocean. International Journal of Remote Sensing, 28, 2375–2382. doi: 10.1080/01431160701236803
- Sathiyamoorthy, V., Sikhakolli, R., Gohil, B. S., & Pal, P. K. (2012). Intra-seasonal variability in Oceansat-2 scatterometer sea-surface winds over the Indian summer monsoon region. Meteorology and Atmospheric Physics, 117(3-4), 145–152. doi:10.1007/s00703-012-0189-5 doi: 10.1007/s00703-012-0189-5
- Singh, R., Kumar, P., & Pal, P. K. (2011). Assimilation of Oceansat-2-scatterometer-derived surface winds in the weather research and forecasting model. IEEE Transactions on Geoscience and Remote Sensing, 50(4), 1015–1021. doi:10.1109/TGRS.2011.2164410 doi: 10.1109/TGRS.2011.2164410
- Stoffelen, A. (1998). Toward the true near-surface wind speed: Error modeling and calibration using triple collocation. Journal of Geophysical Research, 103, 7755–7766. doi: 10.1029/97JC03180
- Stoffelen, A., & Anderson, D. (1997). Scatterometer data interpretation: Derivation of the transfer function CMOD-4. Journal of Geophysical Research, 102(C3), 5767–5780. doi: 10.1029/96JC02860
- Stoffelen, A., & Portabella, M. (2006). On Bayesian scatterometer wind inversion. IEEE Transactions on Geoscience and Remote Sensing, 44(6), 1523–1533. doi: 10.1109/TGRS.2005.862502
- Stoffelen, A., & Verhoeff, A. (2011). Validation of Oceansat-2 scatterometer data. EUMETSAT Meteorological Satellite Conference, 5–9 September 2011, Oslo, Norway. Retrieved from http://www.eumetsat.int/Home/Main/AboutEUMETSAT/Publications/ConferenceandWorkshopProceedings/2011/groups/cps/documents/document/pdf_conf_p59_s5_06_stoffele_v.pdf
- Sudha, A. K., & Prasada Rao, C. V. K. (2013). Comparison of Oceansat-2 scatterometer winds with buoy observations over the Indian Ocean and the Pacific Ocean. Remote Sensing Letters, 4(2), 171–179. doi:10.1080/2150704X.2012.713140 doi: 10.1080/2150704X.2012.713140
- Verhoef, A., & Stoffelen, A. (2013). Validation of ASCAT 12.5-km winds, version 1.3 Document external project: 2013. SAF/OSI/CDOP/KNMI/TEC/RP/147, EUMETSAT, Royal Netherlands Meteorological Institute.
- Wentz, F. J., & Smith, D. K. (1999). A model function for ocean-normalized radar cross section at 14 GHz derived from NSCAT observations. Journal of Geophysical Research, 104(C5), 11499–11514. doi: 10.1029/98JC02148