
Abstract
In a sensitivity study, the influence of an observed stratospheric zonal ozone anomaly on the atmospheric circulation was investigated using the Fifth Generation European Centre Hamburg Model (ECHAM5) which is a general circulation model. The model was run from 1960 to 1999 (40 years) with a mean seasonal cycle of zonally symmetric ozone. In order to isolate the induced dynamical influence of the observed zonally asymmetric part of the three-dimensional stratospheric ozone, a second run was performed for the boreal extratropics using prescribed monthly means from the 40-year reanalysis dataset from the European Centre for Medium-range Weather Forecasts (ERA-40). The main findings are the interdecadal westward shift of the polar vortex at about 65°N and a significant increase in the number of stratospheric sudden warmings during the 1980–99 period. Under the action of zonally asymmetric ozone a decrease in the Arctic Oscillation was identified between the mid-1980s and the mid-1990s. The lag correlation between the mean Arctic Oscillation at the surface and the daily stratospheric northern annular mode increased in mid-winter. Furthermore, we examined the influence of the stratospheric zonal ozone anomaly on Rossby wave breaking in the upper troposphere and found a significant westward shift of poleward Rossby wave breaking events over western Europe in the winter. By this we show that the stratospheric zonal ozone anomaly has a strong influence on the tropospheric circulation as a result of enhanced dynamical coupling processes.
Résumé
[Traduit par la rédaction] Dans une étude de sensibilité, nous avons étudié l'influence d'une anomalie observée dans l'ozone stratosphérique zonal sur la circulation atmosphérique en nous servant du modèle de circulation générale ECHAM5 (Fifth Generation European Centre Hamburg Model). Le modèle a été exécuté de 1960 à 1999 (40 années) avec un cycle saisonnier moyen d'ozone zonalement symétrique. Afin d'isoler l'influence dynamique induite de la partie zonalement asymétrique observée de l'ozone stratosphérique tridimensionnel, nous avons exécuté une deuxième passe pour les extratropiques boréaux en prescrivant les moyennes mensuelles tirées de l'ensemble de données de réanalyse de 40 ans du Centre européen pour les prévisions météorologiques à moyen terme (ERA–40). Les principaux résultats sont le déplacement interdécennal vers l'ouest du tourbillon circumpolaire à environ 65°N et un accroissement marqué du nombre de réchauffements stratosphériques soudains au cours de la période 1980–1999. Sous l'effet de l'ozone zonalement asymétrique, nous avons identifié un affaiblissement de l'oscillation Arctique entre le milieu des années 1980 et le milieu des années 1990. La corrélation avec retard entre l'oscillation Arctique moyenne à la surface et le mode annulaire boréal stratosphérique journalier s'est accrue au milieu de l'hiver. De plus, nous avons examiné l'influence de l'anomalie d'ozone zonal stratosphérique sur le déferlement des ondes de Rossby dans la haute troposphère et nous avons trouvé un important déplacement vers l'ouest des événements de déferlement d'ondes de Rossby en direction du pôle au-dessus de l'ouest de l'Europe en hiver. Ainsi, nous montrons que l'anomalie d'ozone zonal stratosphérique a un effet marqué sur la circulation troposphérique en conséquence de processus de couplage dynamique renforcés.
1 Introduction
Large-scale ozone waves have been observed in the extratropical middle atmosphere in both hemispheres during winter. They are mainly caused by planetary wave transport. Their climatological and trend-like structures are described in many papers for the boreal hemisphere (e.g., Demirhan Bari, Gabriel, Körnich, & Peters, Citation2013; Hood & Zaff, Citation1995; Knudsen & Andersen, Citation2001; Niu, Frederic, Stein, & Tiao, Citation1992; Peters & Entzian, Citation1996, Citation1999; Peters, Gabriel, & Entzian, Citation2008), for the austral hemisphere (e.g., Canziani, Malanca, & Agosta, Citation2008; Grytsai, Evtushevsky, Agapitov, Klekociuk, & Milinevsky, Citation2007; Sato et al., Citation2009; Wirth, Citation1993), as well as for both the northern and southern hemispheres (e.g., Gabriel et al., Citation2011a).
In the stratosphere the local radiative forcing is mainly a function of the three-dimensional (3D) ozone field. Sassi, Boville, Kinnison, and Garcia (Citation2005) showed, for instance, that mean heating rates of zonal mean climatological ozone at altitudes where ozone is a dominant shortwave absorber overestimate the daily mean heating compared with zonally asymmetric ozone fields. Further, in January the monthly mean changes in solar heating because of the zonal asymmetry of ozone are of the order of 10% of the zonally symmetric ozone heating for the western and eastern hemispheres as estimated by Gabriel, Schmidt, and Peters (Citation2011). The influence of zonally asymmetric ozone on the longwave cooling is of the same order but refers to different altitudes and latitudes. Near the tropopause, even small radiative heating rates are able to change the radiation balance very efficiently (e.g., Forster & Shine, Citation1997; Ramanathan & Dickinson, Citation1979; Randel & Cobb, Citation1994). The influence of this radiative forcing near the tropopause on the large-scale circulation over several days or weeks is still unknown. Furthermore, Forster, Bodeker, Schofield, Solomon, and Thompson (Citation2007) discussed the important effect of ozone on temperature (cooling) in the tropical lower stratosphere and upper troposphere relative to the effect of CO2 on the temperature (cooling).
However, in the extratropics the relatively strong regional net heating change in the upper stratosphere due to zonally asymmetric ozone determines a planetary wave forcing in the stratosphere which may be responsible for the zonal ozone anomaly influence on the mesospheric or tropospheric circulation (e.g., Albers & Nathan, Citation2012; Gabriel, Höschel, Peters, Kirchner, & Graf, Citation2012). A series of different general circulation model (GCM) simulations shows that the zonal ozone anomalies, defined as deviations from the zonal mean (sometimes called “zonally asymmetric ozone” or “ozone waves”), have an important influence on the general circulation of the atmosphere.
Kirchner and Peters (Citation2003) performed experiments using the Fourth Generation European Centre Hamburg Model (ECHAM4), which was developed at the Max Planck Institute for Meteorology (MPIM) in Hamburg based on a European Centre for Medium-range Weather Forecasts (ECMWF) forecast model, including an additional boreal zonally asymmetric ozone wave pattern (their a). This changing pattern was recalculated from the trend structure of ozone during the Total Ozone Mapping Spectrometer (TOMS) period (1979–93). They used a T42L19 spectral version (for more details, see Roeckner et al., Citation1996) with a mean January 3D ozone distribution. The upper model layer was placed at 10 hPa and the model was driven by sea surface temperatures (SSTs) provided by the Atmospheric Model Intercomparison Project (AMIP). The authors showed that the zonal-asymmetric ozone change in the lower stratosphere has a significant influence on the circulation patterns in the troposphere over the North Atlantic–European region.
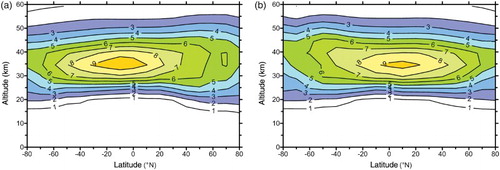
Fig. 1 Latitude-altitude cross-section of mean zonal mean ozone (mg kg−1) from the dataset of Fortuin and Kelder (Citation1998) for (a) January and (b) July, as part of the standard mean seasonal ozone cycle used in ECHAM5.
Sassi et al. (Citation2005) performed experiments with the NCAR-Whole-Atmosphere Community Climate Model (WACCM) model which includes a comprehensive middle atmosphere chemistry model. In the first simulation, ozone was fully interactive in the climate chemistry model (CCM). The zonal mean monthly averaged ozone climatology was constructed to determine the radiative heating rates in the second simulation. The comparison of both simulations showed that the zonal mean ozone climatology significantly affects the climate of the middle atmosphere.
Gabriel, Peters, Kirchner, and Graf (Citation2007) used the middle atmosphere T42L39 version of the the fifth-generation atmospheric general circulation model (ECHAM5) (called MAECHAM5, extended up to 0.01 hPa) for their sensitivity study of the influence of zonally asymmetric stratospheric ozone. The decadal means of zonal ozone anomalies were derived using 40-year reanalysis data from ECMWF (ERA-40; Dethof & Holm, Citation2004; Uppala et al., Citation2005) and were included as fixed ozone fields in the MAECHAM5. The authors found a strong decadal increase in wave-1 structure with amplitudes of 10% of zonal mean ozone caused by the ozone anomaly of the 1990s. The model calculations showed that the related radiation perturbations induced significant temperature changes (about ±4 K at 50 hPa and about ±8 K at 0.1 hPa). Furthermore, the zonal ozone anomaly induced a shift of upward- and eastward-directed stationary wave trains from the eastern to the western hemisphere. Gabriel et al. (Citation2012) extended this study to experiments with an interactively coupled ocean atmosphere model called Community Earth System Models (COSMOS) that includes the ECHAM5 middle atmosphere version (Roeckner et al., Citation2006) and an ocean model (Jungclaus et al., Citation2006). The spectral resolution is T31 with 90 levels from the surface up to about 80 km. The main finding is a shift of the tropospheric circulation towards the negative phase of the North Atlantic Oscillation (NAO), which is modified by additional interaction between the troposphere and the ocean. In particular, the zonal ozone anomaly induced significant changes in surface temperatures and precipitation.
Stratospheric sudden warming (SSW) is a well-known stratospheric phenomenon (e.g., Matsuno, Citation1971; Scherhag, Citation1952). Major SSW events are of particular interest because the zonal mean zonal wind reversal occurs at the same time as the polar warming. Gabriel et al. (Citation2012) found a possible increase in SSW events in the interactively coupled ocean–atmosphere experiments.
Crook, Gillett, and Keeley (Citation2008) investigated the sensitivity of the austral climate to zonal asymmetries in ozone when the waves have larger amplitudes in September during the appearance of the ozone hole. They used a high vertical resolution version of the Hadley Centre slab model (denoted HadSM3-L64, an atmospheric model coupled to a mixed-layer ocean and sea ice model) extending up to 0.01 hPa. A realistic 3D distribution of ozone was prescribed by using mean ozone fields derived from ERA-40 reanalysis data. The authors found a cooling of the stratosphere and upper troposphere comparable to that caused by ozone depletion itself. Furthermore, their results suggest that changes in the zonal asymmetry of ozone have had important impacts on the austral climate.
Experiments using CCMs comparable to those used by Sassi et al. (Citation2005) with WACCM have been performed by Gillett, Scinocca, Plummer, and Reader (Citation2009) with the Canadian Middle Atmosphere Model (CMAM) and by Waugh et al. (Citation2009) with the Goddard Earth Observation System (GEOS) CCM (Pawson et al., Citation2008). The ozone was transported by the wind fields of the model and changed by chemistry. In the control simulations zonal mean ozone was used, and only this zonal mean ozone field passed the radiative transfer scheme. Gillett et al. (Citation2009) found a robust stratospheric zonal-mean temperature and geopotential height response to zonal ozone anomalies similar to those found in previous studies for both hemispheres (Crook et al., Citation2008; Gabriel et al., Citation2007). Waugh et al. (Citation2009) performed multidecadal ozone simulations focused on the austral hemisphere. If only zonal mean ozone is used in the radiative transfer scheme, the Antarctic temperature trends for the 1960–2000 and 2000–50 periods are underestimated. The impacts of stratospheric changes on summertime trends in the southern annular mode (SAM) are also underestimated in this case.
The zonal ozone anomaly study by McCormack, Nathan, and Cordero (Citation2011) used the Navy Operational Global Atmospheric Prediction System-Advanced Level Physics and High Altitude (NOGAPS-ALPHA) GCM (Eckermann, Citation2009; McCormack, Coy, & Hoppel, Citation2009) simulations in the T79L68 spectral version extending from the surface up to approximately 90 km. The study focused on ensemble runs for the period from 1 December to 31 March. Their results agree with earlier studies showing that a warmer wintertime polar stratosphere was produced with zonally asymmetric ozone heating including a possible increase in the occurrence of SSW events. Albers and Nathan (Citation2012) analyzed these ensemble runs in more detail and revealed that changes in the planetary wave propagation in mid-winter are primarily responsible for these circulation changes.
It follows that various studies have shown that the stratospheric zonal ozone anomaly influences the tropospheric circulation. The pathway for the influence of the ozone anomaly on tropospheric circulation through induced stratospheric net heating due to the ozone anomaly was investigated by Albers and Nathan (Citation2012) and Gabriel et al. (Citation2012). Stratospheric planetary wave generation was identified as the primary source of stratospheric planetary wave generation by radiative forcing before the nonlinear interaction between wave and background flow or transient processes became part of the equation. A similar radiative forcing mechanism in the stratosphere has been identified during phases of solar maximum and solar minimum by Gabriel, Schmidt et al. (Citation2011), which confirmed the above-mentioned result.
In summary, all model setups for extracting the effect of the zonal ozone anomaly are similar: based on first, a comparison of a run with zonal mean ozone and a run with the additional use of zonally asymmetric ozone; and second, consideration of the middle atmosphere. This sensitivity study, and most of the other models, mentioned examined the role of quasi-stationary ozone planetary waves which are dominated by ultra-long waves larger than or equal to wave-4. The spectral model resolution used is of the order of T42, which means that about 40 waves are considered in the zonal Fourier transform. The grid resolution is about 2.8 degrees. For this type of model the quasi-stationary ozone wave resolution is sufficient. Note that CCMs include the 3D ozone field in which case a separation of the zonally asymmetric ozone effect is not possible.
Various studies revealed that the stratospheric zonal ozone anomaly influences the tropospheric circulation through a change in the coupling processes caused by planetary waves. This coupling could be measured by an examination of the evolution and variability of the northern annular mode (NAM) as shown by Baldwin and Dunkerton (Citation1999), in which the NAM at the surface defines the Arctic Oscillation (AO).
Furthermore, other studies used the stratospheric NAM as a predictor of the mean AO (e.g., Baldwin et al., Citation2003; Charlton, O'Neill, Stephenson, Lahoz, & Baldwin, Citation2003; Christiansen, Citation2005; Siegmund, Citation2005; Sigmond, Scinocca, Kharin, & Shepherd, Citation2013). These studies showed that the inclusion of the stratospheric NAM increases the skill of the daily forecast at lead times longer than approximately 10 days. The influence of the zonal ozone anomaly on the boreal intraseasonal and interannual NAM variability is still an open question. Furthermore, we do not know how the predictability of the AO using stratospheric NAM changes under the influence of zonally asymmetric ozone. Moreover, Baldwin and Dunkerton (Citation1999) showed that the difference between AO extremes in the troposphere is considerable. The climatology of geopotential height at 500 hPa after adding or subtracting two times the AO-regressed geopotential height field (their ) shows, for instance, over the North Atlantic–European region a stronger diffluent field in the extreme case of the positive AO phase. Moreover, there are some indications that the large-scale background flow determined by NAM variability influences the direction and intensity of Rossby wave breaking (RWB) in the upper troposphere of the extratropics especially over the North Atlantic–European region (e.g., Gabriel & Peters, Citation2008; Peters & Waugh, Citation1996; Woollings, Pinto, & Santos, Citation2011). The possible influence of zonally asymmetric ozone on RWB events is still an open question.
All these important questions highlight the need for a sensitivity study of the stratospheric zonal ozone anomaly in a manner similar to earlier studies but with the focus on the diagnosis of NAM and RWB. The aim of this study is to find answers to the above-mentioned questions and issues in the frame of sensitivity experiments using ECHAM5. The model was run from 1960 to 1999 (40 years) with a mean standard seasonal cycle of zonally symmetric ozone. In order to isolate the induced dynamical influence of the zonal ozone anomaly, a second run was performed with prescribed monthly means from ERA-40 reanalysis data for the boreal extratropics.
The paper is organized in the following way. The design of the experiments and the methods of diagnosis are described in Section 2. After examining the induced vortex shift and related changes in SSW events, the focus moves to the induced changes in the NAM structure and AO predictability. Furthermore, changes in the occurrence rate of poleward breaking Rossby waves over the North Atlantic–European region as part of the downward pathway of the zonal ozone anomaly influence are shown and discussed in Section 3. The summary and conclusions are given in Section 4.
2 Methodology
a Sensitivity Runs
The pathway for the influence of the zonal ozone anomaly on the atmospheric circulation through induced differential radiative forcing is investigated with the help of sensitivity runs using ECHAM5. Model specifications are described in detail by Roeckner et al. (Citation2006). Here the middle atmosphere model version with a T42 spectral resolution was used including 39 layers up to about 80 km. In each run the same ocean forcing was prescribed by the daily SSTs from 1960 to 1999. These daily values were interpolated from monthly mean SSTs which were provided by the AMIP project. A mean seasonal cycle of zonally symmetric ozone based on the 1980–1991 dataset from Fortuin and Kelder (Citation1998) is implemented in ECHAM5 as the standard seasonal ozone cycle. The model was run for the control experiment with zonal mean ozone (called O3ZMO) over 40 years. To isolate the zonal ozone anomaly effect a second run, called the anomaly run (or O3ZOA), was performed. In addition to the standard zonal mean ozone we used the prescribed year-to-year variability of the monthly mean fields of the zonal ozone anomaly determined from ERA-40 reanalysis data. In order to restrict the longitude-dependent ozone influence to middle and higher latitudinal effects, only zonal ozone anomalies in the boreal extratropics were included. This means that the zonal ozone anomaly was implemented north of 30°N between 500 hPa and 1 hPa.
In the zonal mean ozone fields, from the dataset of Fortuin and Kelder (Citation1998), are shown for January and July in order to illustrate the mean seasonal cycle used in the control run O3ZMO. The maximum ozone value (mass mixing ratio; about 9 mg kg−1) is found at an altitude of about 35 km in the subtropics with a shift to remain in the summer hemisphere. A slight upward tilt of the maxima exists from the summer to winter hemisphere caused by the diabatic circulation (e.g., Bartels, Peters, & Schmitz, Citation1998). In the winter hemisphere, a broader area of higher ozone values is found in the extratropical upper stratosphere with values of about 6 ± 2 mg kg−1 as a result of the planetary wave transport of ozone.
Furthermore, the interannual zonal ozone anomaly derived as monthly means from ERA-40 reanalysis data (Uppala et al., Citation2005) was implemented. The smoothed mean winter evolution of this ozone anomaly is shown in from 1960 to 1999.
Fig. 2 Hovmöller diagram of zonal ozone anomaly (mg kg−1) at 20 hPa derived from ERA-40 reanalysis data for 1960 to 1999. For winter (DJF), monthly mean ozone values are averaged latitudinally from 45° to 75°N. Variability shorter than three years is removed using low-pass filtering.
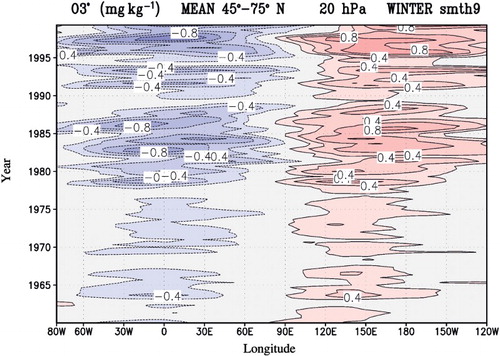
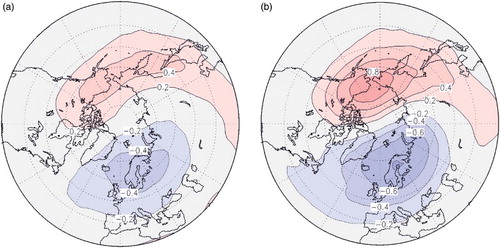
For ozone values plotted at the 20 hPa level, variability shorter than three years was filtered out before the ozone was averaged over the 45°–75°N latitudinal belt. Over the entire period from 1960 to 1999, a wave-1 structure dominated with a minimum over the North Atlantic–European region and a maximum over the Pacific Ocean region. An increase in the amplitude of the ozone wave is indicated where the values are twice as large as in the last two decades. Further, a strong multiyear fluctuation was identified. In , the mean horizontal winter structure is plotted at the 20 hPa level for the 1960–69 and 1990–99 periods. We found a weak phase shift with time in the ozone wave as well as an increase in the amplitude by a factor of about two (maximum of about 0.8 mg kg−1) as in . In comparison with the zonal mean ozone values () about 13% of the zonal variability at approximately 65°N is determined by the mean ozone waves. Similar results for the ozone waves from the ERA-40 dataset have been reported by Gabriel et al. (Citation2012) for January.
Fig. 3 Stereographic projection of mean zonal ozone anomaly (mg kg−1) at 20 hPa derived from ERA-40 reanalysis data for winter (DJF) averaged over (a) the 1960–69 period and (b) the 1990–99 period.
b Diagnostics
1 Vortex Shift and Stratospheric Sudden Warming
In winter, the polar vortex is highly variable (Karpetchko, Kyrö, & Knudsen, Citation2005). In order to examine the mean vortex shift induced by the zonal ozone anomaly reported by Gabriel et al. (Citation2007) we focus on the monthly mean geopotential height anomaly defined as the deviation from the zonal mean at 65°N. Furthermore, we calculated decadal means of January months for the O3ZOA and O3ZMO ECHAM5 experiments, as well as the difference. A two-sided Student's t-test is used to estimate significance (at the 95% confidence level; Taubenheim, Citation1969).
In the stratosphere the intraseasonal variability in winter is mainly caused by planetary waves. The SSW is a well-known stratospheric phenomenon. Major SSW events are of particular interest because a zonal mean zonal wind reversal occurs at the same time as the polar warming. According to the definition the wind reversal has to be observed at 60°N latitude and at the 10 hPa level. We apply a detection procedure from Charlton and Polvani (Citation2007) including a corrigendum by Charlton-Perez and Polvani (Citation2011). Using ERA-Interim reanalysis data from 1979 to 2011 (Dee et al., Citation2011) we found a mean SSW frequency of 0.72 events per year which compares well with the findings of Charlton and Polvani (Citation2007) of 0.6 events per year. Comparing the zonal winds from ECHAM5 with the reanalysis data (not shown) reveals a weaker polar vortex with higher variability in the winds from ECHAM5. Therefore, in this study we focus mainly on stronger major SSW events. We sharpened the Charlton and Polvani (Citation2007) criteria as follows: for the central day the zonal mean zonal wind should cross −3 m s−1 at 60°N at the 10 hPa level and should be at least 10 m s−1 before and after the event. With these additions we found 0.41 events per year using ERA-Interim data. The four-field tables (contingency table) statistical method was used to calculate the correlation of binary attributes (Taubenheim, Citation1969). We determined the number of winters with or without SSW events for both runs (O3ZMO and O3ZOA). A significance test based on the χ2 distribution is used which reveals that a significant dependence at the 94% confidence level is noted if the value of 3.61 is exceeded.
2 Northern Annular Mode and Predictability of the Arctic Oscillation
The negative NAM index is approximated by integrating the geopotential height anomalies over the polar cap north of 65°N (Cohen, Salstein, & Saito, Citation2002; Siegmund, Citation2005; Sigmond et al., Citation2013). Daily anomalies are derived as the deviations from the mean annual cycle from 1960 to 1999 (40 years). In order to obtain comparable values at different pressure levels, the anomalies at each level were normalized by the standard deviation of the total time series of the anomalies at that level. The interannual variability of geopotential height anomalies was determined by computing its 91-day average (low-pass filtering). This was done in order to separate interannual from intraseasonal NAM variability. The change in the variance of the low-pass filtered NAM between O3ZMO and O3ZOA is examined using the F-test (Taubenheim, Citation1969) for the 1980–99 period by using non-normalized anomalies of variance. For 19 degrees of freedom, variance rates larger than 1.822 (2.168) are significant from zero at the 90% (95%) confidence level.
As shown by Baldwin and Thompson (Citation2009), the daily NAM index based on empirical orthogonal functions (EOFs) showed very high correlations of 0.99 in the stratosphere and 0.96 in the troposphere with a negative NAM index based on an integration of the geopotential height (GH) anomalies over the polar cap north of 65°N (Cohen et al., Citation2002). This confirmed our approach.
Furthermore, we apply a mean AO-prediction procedure using daily NAM indices (Baldwin et al., Citation2003; Siegmund, Citation2005). The AO series is averaged over one month using a running mean. This mean AO, defined as the NAM at the 1000 hPa level, is the predictand and daily NAM indices define the predictors at different tropospheric and stratospheric levels. The lag-correlation between both is calculated after a time shift of 24 days. This 24-day shift of the mean AO (30-day average) results in a so-called lead time of 10 days. This means that deterministic time scales less than 10 days are not included in the calculation of the lag-correlation between the daily NAM and mean AO. For predictive skill, the percentage variance based on daily predictions is calculated. These daily variances are Gaussian weighted with a full width at half maximum (FWHM) of 60 days. The two-sided Student's t-test is applied in order to estimate the significance of the correlation coefficient. The time series contains 38 winter seasons. The correlation is significantly non-zero (95% level) if the amount is larger than 0.32. This represents an explained percentage variance larger than 10.2% (Taubenheim, Citation1969).
3 Rossby wave breaking
Rossby wave-breaking events were divided into four types as a function of the background wind shear (cyclonic or anticyclonic) and of the direction of the RWB (equatorward or poleward) (e.g., Esler & Haynes, Citation1999; Peters & Waugh, Citation1996). Woollings et al. (Citation2011) studied the anticyclonic equatorward RWB events over Iberia and found intensification during the positive AO phase. Peters and Waugh (Citation1996) also showed in idealized model experiments that the confluence or diffluence of the background flow determines the direction of the RWB. An objective method for quantifying the occurrence rate of RWB events has been established by Gabriel and Peters (Citation2008). The RWB can be identified by meridional overturning of Ertel's potential vorticity (EPV) on specific isentropes. A separation into poleward or equatorward breaking direction is too difficult based on EPV maps alone. The meridional wave flux component (northward or southward) for quasi-stationary Rossby waves indicates cyclonically or anticyclonically sheared RWB (Esler & Haynes, Citation1999). The magnitude of the meridional wave fluxes gives a reliable measure of the asymmetric types of RWB when the EPV diagnostics and the geometry of large-scale diffluent or confluent flow were taken into account. Further details of the procedure are described in Gabriel and Peters (Citation2008). Based on 45 winter periods of ERA-40 reanalysis data, the authors found two pronounced regions with anticyclonic poleward breaking, one over the eastern North Pacific–North America region and the second over the North Atlantic–European region.
This method was also successfully applied in the seasonal diagnosis of boreal RWB using ERA-40 reanalysis data (Schneidereit, personal communication, 2013) and of austral RWB events using reanalysis data from the National Centers for Environmental Prediction (NCEP; Ndarana & Waugh, Citation2011). Impact studies are beyond the scope of this study. This objective method with some changes in the flux integration is also applied to the O3ZMO and O3ZOA model experiments in order to quantify the influence of a zonal ozone anomaly on RWB.
3 Results
a Vortex Shift and Stratospheric Sudden Warming Events
In order to examine the mean polar vortex shift induced by the zonal ozone anomaly reported by Gabriel et al. (Citation2007) and others we focus on the monthly mean GH anomalies at 65°N. Decadal means of O3ZOA and O3ZMO and their difference are shown in for the 1980–99 period. The GH difference (a) indicates a planetary wave-1 disturbance, which is tilted westward with altitude and has a significant magnitude of about 200 m in the lower stratosphere and mesosphere.
Fig. 4 Altitude-longitude cross-section of (a) and (d) mean GH difference (DGH (m) = O3ZOA minus O3ZMO), (b) and (e) mean geopotential height (GH (m)) for O3ZMO, and (c) and (f) mean geopotential height (GH (m)) for O3ZOA at 65°N for January 1980–99 (top row) and for January 1960–79 (bottom row). Areas at the 95% significance level based on a Student's t-test are enclosed by green lines ((a) and (d) only).
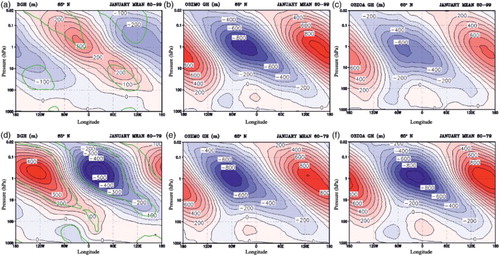
The positive anomaly reduces the polar vortex on its easterly side and the negative anomaly intensifies the polar vortex on its westerly side. Overall, the polar vortex is shifted to the west (by approximately 30 degrees) in the middle stratosphere and the amplitude of the quasi-stationary wave is reduced in the upper stratosphere as indicated in and because of the zonal ozone anomaly. In the lower stratosphere we found an intense cyclonic anomaly over the western North Atlantic and a weakening over eastern Europe. The agreement with the more idealized ozone wave experiments of Gabriel et al. (Citation2007) without any interannual variation in 3D ozone is qualitatively very good (not shown).
For the earlier 1960–79 period (Figs d to f) we also found a significant change in the planetary wave structure because of the zonal asymmetry of ozone. In the middle atmosphere the amplitude of the changed wave (d) increased by a factor of about 5/3 and the phase difference was of the order of about 90 degrees in comparison to the structure change of the planetary waves during the 1980–99 period (a). This results in an eastward shift of the polar vortex and a slight decrease in the GH anomaly inside the vortex ( and ). This means that because of the zonal asymmetry of ozone, the polar vortex was amplified on its easterly flank during the 1960–79 period. In January this behaviour reverses to the structure change during the 1989–99 period which was discussed above. Nevertheless, the impact of zonally asymmetric ozone on the planetary wave structure is strong during both periods. Note, the GH differences between both periods (1980–99 minus 1960–79) for the O3ZMO or O3ZOA runs (b minus e or c minus f) indicate the different influence of changing SST forcing on the quasi-stationary planetary wave structure.
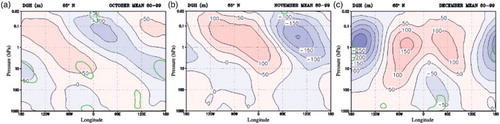
Furthermore, and a together show the seasonal cycle of the ozone-induced changes from October to January during the 1980–99 period where we determined that there were significant changes. In October and November, we first found GH changes in the quasi-stationary planetary wave induced by the zonal ozone anomaly in the middle atmosphere. This is due to an additional net radiative, zonally dependent heat forcing of the quasi-stationary ozone wave. We examined the monthly mean zonally asymmetric net heat source for planetary wave-1 and wave-2 and found values between 7 and 3 × 10⁻⁵ K d−1 at about 5 hPa (upper stratosphere) at a latitude of about 60°N. A linear planetary wave model study (Bügelmayer, Citation2011) showed that this additional heat source in the stratosphere changes the wave-1 amplitude on the order of 10% in comparison with a wave forced by surface processes. Furthermore, in November, with increasing zonal mean zonal winds in the stratosphere, the influence on the planetary wave structure is expected to be larger as evident from many sensitivity studies based on Charney and Drazin's (Citation1961) classic paper. In December, stronger GH changes are found in the troposphere and lower stratosphere that we interpreted to be a result of coupling processes by planetary waves (e.g., Albers & Nathan, Citation2012; Perlwitz & Harnik, Citation2004). Finally, in January (a) a significant westward displacement of the polar vortex is generated in the stratosphere depending on the different forcings and propagation conditions of planetary waves as described above.
Fig. 5 Altitude-longitude cross-section of mean geopotential height difference (DGH (m) = O3ZOA minus O3ZMO) at 65°N for (a) October, (b) November, and (c) December. Areas at the 95% significance level based on a Student's t-test are enclosed by green lines. These plots correspond to a for January.
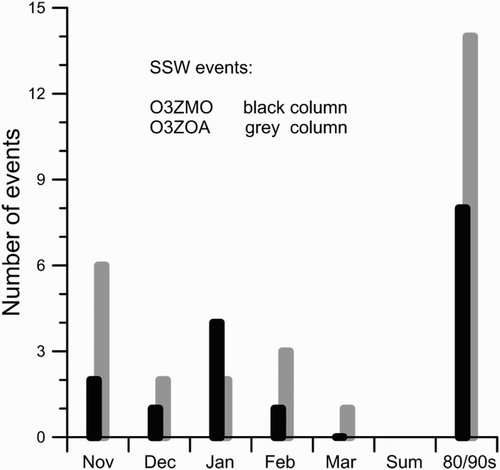
The number of major SSW events reflects the intraseasonal variability of planetary wave activity in winter. In an observational study, Charlton and Polvani (Citation2007) found a mean number of 12 SSW events for two decades. This mean number agrees well with those we derived for both model runs with and without the zonal ozone anomaly for the two decades (1980–99) (8 and 14 SSW events). The numbers of SSW events for each run are shown in . We found an increase of six events in the O3ZOA run which is significant based on the 2 × 2 contingency table. This is in agreement with McCormack et al. (Citation2011) and Gabriel et al. (Citation2012) showing higher variability and warming over the Arctic due to the zonal ozone anomaly. For January, we found a reduction in SSW events and an increase before and after midwinter. November shows the largest number of SSW events, in agreement with earlier ECHAM results examined in the multi-model study of Charlton et al. (Citation2007). This was expected because of the weak zonal mean zonal wind and larger mean heat fluxes from ECHAM5 in early winter compared with the NCEP/National Center for Atmospheric Research (NCAR) reanalysis climatology (Charlton et al., Citation2007). Furthermore, the largest increase in SSW events for the O3ZOA run is found in November indicating an enhanced vacillation process between background flow and planetary waves (Holton & Mass, Citation1976).
Fig. 6 Occurrence rate of major SSW events for experiments O3ZMO and O3ZOA during the 1980–99 period with stronger zonal ozone anomalies. The overall increase in SSW events (sum for the 1980s and 1990s) in run O3ZOA is significant at the 94% confidence level.
b NAM Structure and AO Predictability
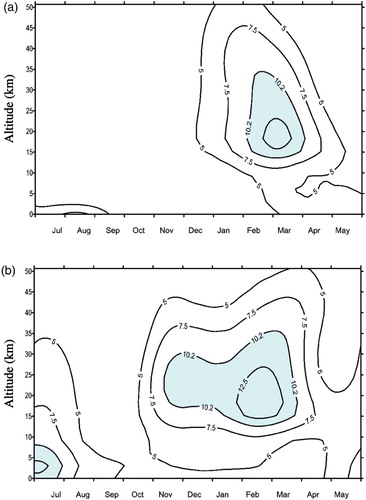
The O3ZOA run was forced by annual SST cycles and by the zonal ozone anomaly compared with the O3ZMO run that was driven only by SSTs. The mean seasonal cycle of NAM variance (low-pass filtered) for both experiments allows us to examine the spread, particularly during the 1980–99 period when the magnitude of the ozone wave was strongest. In both mean seasonal cycles of dispersion are plotted. Three main areas of significant change are revealed. During midwinter we found an increase in NAM variance in the upper stratosphere in the O3ZOA run. Further, a reduction in the entire stratosphere in spring and an increase in the troposphere in autumn have been identified. Because of the influence of the zonal ozone anomaly, better agreement with the mean seasonal cycle of the NAM variance for ERA-Interim reanalysis data (a) was found. Note that the same NAM calculation method described in Section 2 was used.
Fig. 7 Mean seasonal cycle of NAM variance (low-pass filtered; interannual variance) for runs (a) O3ZMO and (b) O3ZOA during the 1980–99 period. The thick and thin green lines in (b) enclose areas of variance change significant at the 90% and 95% confidence levels, respectively.
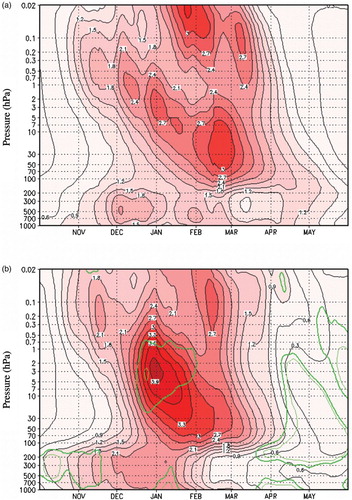
Fig. 8 NAM diagnosis for the ERA-Interim reanalysis dataset from 1979 to 2011. (a) Mean seasonal cycle of NAM variance (low-pass filtered; interannual variance). (b) Predictive skill as a percentage variance based on daily NAM values. The monthly mean AO was predicted with a lead time of 10 days, and a Gaussian weighting with an FWHM of 60 days was applied. The shaded area indicates a significant difference from zero at the 95% confidence level.
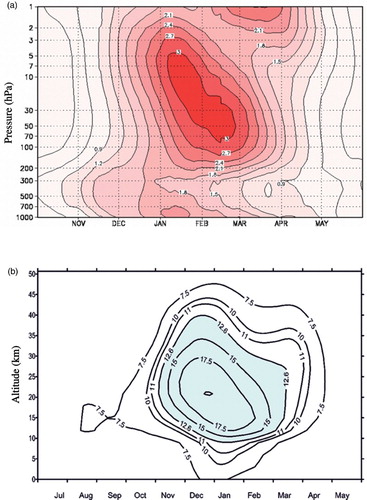
The predictive skill as a percentage variance of monthly mean AO using daily NAM time series is also presented for ERA-Interim data in b. In agreement with other studies (Baldwin et al., Citation2003; Siegmund, Citation2005), we found that in midwinter the middle/lower stratosphere has the largest values of predictive skill (approximately 20% variance) for a lead time of 10 days. There are some values in the troposphere that are smaller than those using ERA-40 reanalysis data (Siegmund, Citation2005) which may be explained by the different time periods used. For comparison, the predictive skills for both experiments, O3ZMO and O3ZOA, are presented in . For these types of sensitivity runs we also found a maximum percentage variance in the middle stratosphere.
Fig. 9 Predictive skill as a percentage variance based on daily NAM values of ECHAM5 runs (a) O3ZMO and (b) O3ZOA from 1960 to 1999. The monthly mean AO is predicted with a lead time of 10 days, and a Gaussian weighting with an FWHM of 60 days was applied. The shaded area indicates a significant difference from zero at the 95% confidence level.
The values (approximately 12.5%) are about half those calculated using ERA-Interim data. Because of the implementation of the zonal ozone anomaly a change was found which shows significant larger predictive skill in midwinter in the middle stratosphere for the O3ZOA run compared with the O3ZMO run. So the run with the zonal ozone anomaly (b) agrees better with that using ERA-Interim data (b). There are still discrepancies in the predictive skills, but a further study of these is beyond the scope of this study.
Furthermore, the investigation of the influence of the observed stratospheric zonal ozone anomaly on the evolution of the AO (or NAO) is very important as found in previous studies (e.g., Gabriel et al., Citation2007, Citation2012; Waugh et al., Citation2009). In the smoothed mean winter evolution of AO (further details can be found in Section 2b2) is shown for both experiments and ERA-Interim reanalysis data. For the 1960–79 period with weaker ozone waves, a similar evolution was found with a slight mean increase in O3ZOA. A strong mean decrease in the AO was identified during the last two decades followed by an increase. The minimum in the mid-1980s is in agreement with the AO evolution using ERA-Interim data as well as the continuing increase until the mid-1990s; the following decrease was in phase. A further quantity of interest is the AO-regressed GH structure at 1000 hPa (not shown). The difference between both regressed structures (O3ZOA minus O3ZMO) is shown in a revealing the structure of the AO weakening (). An increase in GH (about 15 m) was found over the Arctic region and Pacific Ocean and a weaker increase was found (about 5 m) over the western North Atlantic. The decrease in GH refers to regions over Asia, Africa, and western North America. The GH change is of the order of about −10 m. In order to study the possible changes in structure of the mean circulation induced by large positive or negative absolute values of the AO index we applied the method of Baldwin and Dunkerton (Citation1999) and calculated AO-regressed GH patterns at 1000 hPa (a). To determine extreme cases at the 300 hPa level, two times the regressed AO pattern at 300 hPa (not shown) was added to the mean field of the O3ZMO run (b) and subtracted from the mean field of the O3ZOA run (c).
Fig. 10 Mean winter AO evolution for experiments O3ZMO (blue line) and O3ZOA (red line) and for ERA-Interim reanalysis data (black line) smoothed with a 7-year running mean.
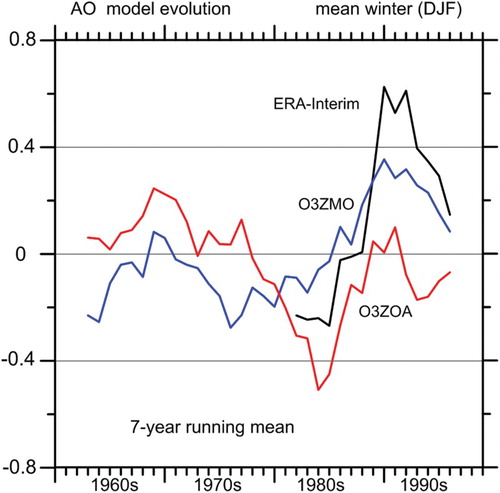
Fig. 11 (a) Stereographic projection of the difference between the regressed geopotential height with the time series of negative AO (GHD (m) = O3ZOA minus O3ZMO) at 1000 hPa showing the weakening of the AO pattern due to the zonal ozone anomaly. Reconstructed extreme GH (km) for (b) mean GH minus 2 times regressed AO for O3ZMO, and (c) for mean GH plus 2 times regressed AO for O3ZOA at 300 hPa showing more upper tropospheric diffluence over the North Atlantic–European region in Fig.11c.
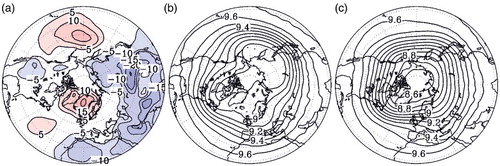
A comparison of both extreme GH fields in the upper troposphere (300 hPa) shows a stronger upper tropospheric diffluence over the North Atlantic–European region for the extreme positive phase of the AO. These GH field changes are in very good agreement with similar extreme AO-regressed results at 500 hPa in Baldwin and Dunkerton (Citation1999, their ). From these changes we expect the AO to influence the RWB process induced by the zonal ozone anomaly studied in the next subsection.
c Poleward Rossby Wave Breaking (P2-RWB)
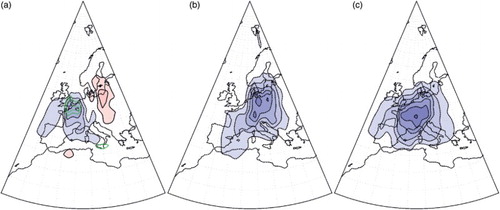
Four types of RWB are well known as mentioned in the introduction and defined by Peters and Waugh (Citation1996). We examined the influence of the stratospheric zonal ozone anomaly on only poleward RWB called type “P2” because they are more important for western Europe with an additional downstream development. Anticyclonic wind shear and northeastward tilted EPV-contours, including overturning in the upper troposphere, are characteristic of P2-RWB events (Peters & Waugh, Citation1996). In winter, P2-RWB events are more intense and have a strong influence on precipitation and upper jet streaks over the North Atlantic–European region (Schneidereit, personal communication, 2013). The objective method of RWB detection was described in Section 2b3. In the mean distribution of P2-RWB events is plotted for experiments O3ZMO (b) and O3ZOA (c) during winter (DJF) for the 1978–98 period. In the control experiment (O3ZMO, b) we found enhanced P2-RWB events over western Europe and over the eastern Pacific Ocean–North America region (not shown) in agreement with Gabriel and Peters (Citation2008). Furthermore, P2-RWB activity was identified over central North America and western Siberia (not shown). In the O3ZOA experiment the same regions are detected but at weaker intensities. The P2-RWB activities over North America and over Siberia are significantly reduced. The difference over Europe (O3ZOA minus O3ZMO, a) shows a shift and intensification on the western flank, which is significant over western Europe, and a decrease on the eastern flank. On average, the zonal ozone anomaly induced more poleward RWB events over the North Sea. There is a strong link to the enhanced diffluence region shown in c, which is expected from theoretical arguments (Esler & Haynes, Citation1999; Peters & Waugh, Citation1996) and diagnosis (Gabriel & Peters, Citation2008) that poleward RWB events occur more westwards.
Fig. 12 Mean distribution of poleward RWB events (called P2-RWB, m2 s−2 d−1) calculated for experiments (b) O3ZMO, (c) O3ZOA and (a) their difference for winter (DJF) from 1979 to 1998. The thick and thin green lines in (a) indicate a significant difference from zero at the 90% and 95% confidence levels, respectively, using a Student's t-test.
4 Summary and conclusions
In a sensitivity study, the influence of the stratospheric zonal ozone anomaly on the atmospheric circulation was investigated using ECHAM5 for model experiments. The model was first run from 1960 to 1999 (40 years) with a mean seasonal cycle of zonally symmetric ozone. In order to isolate the induced dynamical influence of the zonal ozone anomaly a second run was performed using prescribed monthly means of each year from ERA-40 reanalysis data in the boreal extratropics.
The main result was that the interdecadal westward shift of the polar vortex in the stratosphere was confirmed. Furthermore, this statement also holds in the case when the zonal ozone anomaly changes from year to year as observed. In the stratosphere we found hints that the vacillation process between background flow and planetary waves was modified by the zonal ozone anomaly. A significant increase in major SSW events was identified, in agreement with earlier investigations showing additional warming of the Arctic region because of these ozone waves. Furthermore, we could show that in the middle stratosphere the mean interannual variance of NAM increased significantly during the 1980–99 period as a function of the zonal ozone anomaly and found improved agreement with the NAM variance derived from ERA-Interim reanalysis data. Moreover, in the middle stratosphere the mean AO predictability based on daily NAM values with a lead time of 10 days, which is larger than the deterministic time scale, was significantly improved during midwinter. There still exists an underestimation of the predictive skill of the model runs in comparison to that based on ERA-Interim reanalysis data. The AO change induced by the zonal ozone anomaly shows a decrease in the AO patterns during the 1980–99 period with an increase in the geopotential height at 1000 hPa over the Arctic region. Furthermore, we examined the influence of the zonal ozone anomaly on RWB events in the upper troposphere and found a significant westward shift of poleward RWB events over western Europe in winter during the last two decades. In the case of an extreme AO negative phase the 300 hPa-regressed patterns show stronger diffluence over the North Atlantic–European region for the experiment with zonal ozone anomaly. From that and from theoretical arguments we expect that poleward RWB events are shifting westward.
This study confirms the results of earlier model studies that investigated the influence of stratospheric zonal ozone anomalies on atmospheric circulation. This study answers questions about NAM variability, AO predictability, and poleward RWB events as mentioned above. Further research is suggested to examine the influence of the zonal ozone anomaly on the seasonal NAM variability and the impact on tropospheric weather. The general conclusion we draw from this study is that the stratospheric zonal ozone anomaly has a strong influence on the tropospheric circulation particularly due to enhanced dynamical coupling processes at intraseasonal and interannual time scales. This should be taken into account in modelling studies of recent and future climates.
Acknowledgements
The authors thank ECMWF and Deutscher Wetterdienst for support and for providing the ERA-40 and ERA-Interim datasets. Thanks to Brigitte Wecke for data processing and help in plotting the figures. Further thanks to A. Gabriel and D. Mitchell for help in improving the manuscript. AS was funded by the Predictability ANd Dynamics Of Weather Systems in the Atlantic-European Sector (PANDOWAE) Deutsche Forschungsgemeinschaft (DFG) Research Group (www.pandowae.de) under DFG-Grant PE-474/7-1. The authors are grateful for the constructive comments from two anonymous reviewers.
Related Research Data
References
- Albers, J. R., & Nathan, T. R. (2012). Pathways for communicating the effects of stratospheric ozone to the polar vortex: Role of zonally asymmetric ozone. Journal of the Atmospheric Sciences, 69, 785–801. doi:10.1175/JAS-D-11-0126.1
- Baldwin, M. P., & Dunkerton, T. J. (1999). Propagation of the Arctic Oscillation from the stratosphere to the troposphere. Journal of Geophysical Research, 104, 30937–30946. doi: 10.1029/1999JD900445
- Baldwin, M. P., Stephenson, D. B., Thompson, D. W. J., Dunkerton, T. J., Charlton, A. J., & O'Neill, A. (2003). Stratospheric memory and skill of extended-range weather forecasts. Science, 301, 636–640. doi: 10.1126/science.1087143
- Baldwin, M. P., & Thompson, D. W. J. (2009). A critical comparison of stratosphere–troposphere coupling indices. Quarterly Journal of the Royal Meteorological Society, 135, 1661–1672. doi:10.1002/qj.479
- Bartels, J., Peters, D., & Schmitz, G. (1998). Climatological Ertel's potential vorticity flux and mean meridional circulation in the extratropical troposphere–lower stratosphere. Annales Geophysicae, 16, 250–265. doi:10.1007/s00585-998-0250-3
- Bügelmayer, M. (2011). Der Einfluss des längenabhängigen Ozons auf die winterliche Allgemeine Zirkulation in mittleren und hohen Breiten [Influence of longitude dependent ozone on the wintertime general circulation in mid and high latitudes]. Diplomarbeit, University of Vienna, Vienna.
- Canziani, P. O., Malanca, F. E., & Agosta, E. A. (2008). Ozone and upper troposphere/lower stratosphere variability and change at southern midlatitudes 1980–2000: Decadal variations. Journal of Geophysical Research, 113, D20101. doi:10.1029/2007JD009303
- Charlton, A. J., O'Neill, A., Stephenson, D. B., Lahoz, W. A., & Baldwin, M. P. (2003). Can knowledge of the state of the stratosphere be used to improve statistical forecasts of the troposphere? Quarterly Journal of the Royal Meteorological Society, 129, 3205–3224. doi:10.1256/qj.02.232
- Charlton, A. J., & Polvani, L. M. (2007). A new look at stratospheric sudden warmings. Part I: Climatology and modeling benchmarks. Journal of Climate, 20, 449–469. doi: 10.1175/JCLI3996.1
- Charlton, A. J., Polvani, L. M., Perlwitz, J., Sassi, F., Manzini, E., Shibata, K., … Rind, D. (2007). A new look at stratospheric sudden warmings. Part II: Evaluation of numerical model simulations. Journal of Climate, 20, 470–488. doi:10.1175/JCLI3994.1
- Charlton-Perez, A. J., & Polvani, L. M. (2011). Corrigendum. Journal of Climate, 24, 5951. doi:10.1175/JCLI-D-11-00348.1
- Charney, J. G., & Drazin, P. G. (1961). Propagation of planetary-scale disturbances from the lower to upper atmosphere. Journal of Geophysical Research, 66, 83–109. doi: 10.1029/JZ066i001p00083
- Christiansen, B. (2005). Downward propagation and statistical forecast of the near-surface weather. Journal of Geophysical Research, 110, D14104. doi:10.1029/2004JD005431
- Cohen, J., Salstein, D., & Saito, K. (2002). A dynamical framework to understand and predict the major northern hemisphere mode. Geophysical Research Letters, 29, 51-1–51-4. doi:10.1029/2001GL014117
- Crook, J. A., Gillett, N. P., & Keeley, S. P. E. (2008). Sensitivity of southern hemisphere climate to zonal asymmetry in ozone. Geophysical Research Letters, 35, L07806. doi:10.1029/2007GL032698
- Dee, D. P., Uppala, S. M., Simmons, A. J., Berrisford, P., Poli, P., Kobayashi, S., … Vitart, F. (2011). The ERA-Interim reanalysis: Configuration and performance of the data assimilation system. Quarterly Journal of the Royal Meteorological Society, 137, 553–597. doi:10.1002/qj.828
- Demirhan Bari, D., Gabriel, A., Körnich, H., & Peters, D. H. W. (2013). The effect of zonal asymmetries in the Brewer-Dobson circulation on ozone and water vapor distributions in the northern middle atmosphere. Journal of Geophysical Research: Atmospheres, 118, 3447–3466. doi:10.1029/2012JD017709
- Dethof, A., & Holm, E. (2004). Ozone assimilation in the ERA-40 reanalysis project. Quarterly Journal of the Royal Meteorological Society, 130, 2851–2872. doi:10.1256/qj.03.196
- Eckermann, S. (2009). Hybrid σ–p coordinate choices for a global model. Monthly Weather Review, 137, 224–245. doi:10.1175/2008MWR2537.1
- Esler, J. G., & Haynes, P. H. (1999). Baroclinic wave breaking and the internal variability of the tropospheric circulation. Journal of the Atmospheric Sciences, 56, 4014–4031. doi: 10.1175/1520-0469(1999)056<4014:BWBATI>2.0.CO;2
- Forster, P. M., Bodeker, G., Schofield, R., Solomon, S., & Thompson, D. (2007). Effects of ozone cooling in the tropical lower stratosphere and upper troposphere. Geophysical Research Letters, 34, L23813. doi:10.1029/2007GL031994
- Forster, P. M., & Shine, K. P. (1997). Radiative forcing and temperature trends from stratospheric ozone changes. Journal of Geophysical Research, 102, 10841–10855. doi: 10.1029/96JD03510
- Fortuin, F. P. F., & Kelder, H. (1998). An ozone climatology based on ozonesonde and satellite measurements. Journal of Geophysical Research, 103, 31709–31734. doi: 10.1029/1998JD200008
- Gabriel, A., Höschel, I., Peters, D. H. W., Kirchner, I., & Graf, H.-F. (2012). The influence of zonally asymmetric stratospheric ozone on the coupling of atmospheric layers. In F.-J. Lübken (Eds.), Climate And Weather of the Sun-Earth System (CAWSES): Highlights from a priority program (pp. 443–466). Dordrecht, Netherlands: Springer.
- Gabriel, A., Körnich, H., Lossow, S., Peters, D. H. W., Urban, J., & Murtagh, D. (2011a). Zonal asymmetries in middle atmospheric ozone and water vapour derived from Odin satellite data 2001–2010. Atmospheric Chemistry and Physics, 11, 9865–9885. doi:10.5194/acp-11-9865-2011
- Gabriel, A., & Peters, D. (2008). A diagnostic study of different types of Rossby wave breaking events in the northern extratropics. Journal of the Meteorological Society of Japan, 86, 613–631. doi: 10.2151/jmsj.86.613
- Gabriel, A., Peters, D., Kirchner, I., & Graf, H.-F. (2007). The effect of zonally asymmetric stratospheric ozone on large-scale dynamics and planetary wave propagation in the tropo-, strato- and mesosphere. Geophysical Research Letters, 34, L06807. doi:10.1029/2006GL028998
- Gabriel, A., Schmidt, H., & Peters, D. H. W. (2011). Effects of the 11-year solar cycle on middle atmospheric stationary wave patterns in temperature, ozone and water vapor. Journal of Geophysical Research, 116, D23301. doi:10.1029/2011JD015825
- Gillett, N. P., Scinocca, J. F., Plummer, D. A., & Reader, M. C. (2009). Sensitivity of climate to dynamically consistent zonal asymmetries in ozone. Geophysical Research Letters, 36, L10809. doi:10.1029/2009GL037246
- Grytsai, A. V., Evtushevsky, O. M., Agapitov, O. V., Klekociuk, A. R., & Milinevsky, G. P. (2007). Structure and long-term change in the zonal asymmetry in Antarctic total ozone during spring. Annales Geophysicae, 25, 361–374. doi:10.5194/angeo-25-361-2007
- Holton, J. R., & Mass, C. (1976). Stratospheric vacillation cycles. Journal of the Atmospheric Sciences, 33, 2218–2225. doi: 10.1175/1520-0469(1976)033<2218:SVC>2.0.CO;2
- Hood, L. L., & Zaff, D. A. (1995). Lower stratospheric stationary waves and the longitude dependence of ozone trends in winter. Journal of Geophysical Research, 100, 25791–25800. doi: 10.1029/95JD01943
- Jungclaus, J. H., Keenlyside, N., Botzet, M., Haak, H., Luo, J.-J., Latif, M., … Roeckner, E. (2006). Ocean circulation and tropical variability in the coupled model ECHAM5/MPI-OM. Journal of Climate - Special Section, 19, 3952–3971. doi: 10.1175/JCLI3827.1
- Karpetchko, A., Kyrö, E., & Knudsen, B. M. (2005). Arctic and Antarctic polar vortices 1957–2002 as seen from the ERA-40 reanalyses. Journal of Geophysical Research, 110, D21109. doi:10.1029/2005JD006113
- Kirchner, I., & Peters, D. (2003). Influence of upper troposphere/lower stratosphere ozone anomalies on the atmospheric dynamics over the North-Atlantic and European region during winter. Annales Geophysicae, 21, 2107–2118. doi: 10.5194/angeo-21-2107-2003
- Knudsen, B. M., & Andersen, S. B. (2001). Longitudinal variation of springtime ozone trends. Nature, 413, 699–700. doi: 10.1038/35099677
- Matsuno, T. (1971). A dynamical model of the stratospheric sudden warming. Journal of the Atmospheric Sciences, 28, 1479–1494. doi: 10.1175/1520-0469(1971)028<1479:ADMOTS>2.0.CO;2
- McCormack, J. P., Coy, L., & Hoppel, H. W. (2009). Evolution of the quasi-2 day wave during January 2006. Journal of Geophysical Research, 114, D20115. doi:10.1029/2009JD012239
- McCormack, J. P., Nathan, T. R., & Cordero, E. C. (2011). The effect of zonally asymmetric ozone heating on the northern hemisphere winter polar stratosphere. Geophysical Research Letters, 38, L03802. doi:10.1029/2010GL045937
- Ndarana, T., & Waugh, D. W. (2011). A climatology of Rossby wave breaking on the southern hemisphere tropopause. Journal of the Atmospheric Sciences, 68, 798–811. doi:10.1175/2010JAS3460.1
- Niu, X., Frederic, J. E., Stein, M. L., & Tiao, G. C. (1992). Trends in column ozone based on TOMS data: Dependence on month, latitude and longitude. Journal of Geophysical Research, 97(D13), 14661–14669. doi: 10.1029/92JD01392
- Pawson, S. R., Stolarski, S., Douglass, A. R., Newman, P. A., Nielsen, J. E., Frith, S. M. & Gupta, M. L. (2008). Goddard Earth Observing System chemistry-climate model simulations of stratospheric ozone-temperature coupling between 1950 and 2005. Journal of Geophysical Research, 113, D12103. doi:10.1029/2007JD009511
- Perlwitz, J., & Harnik, N. (2004). Downward coupling between the stratosphere and troposphere: The relative roles of wave and zonal mean processes. Journal of Climate, 17, 4902–4909. doi:10.1175/JCLI-3247.1
- Peters, D., & Entzian, G. (1996). January ozone anomaly over the North Atlantic–European region: Longitude-dependent decadal change in the total ozone during 1979–92. Meteorlogische Zeitschrift Neue Folge, 5, 42–44.
- Peters, D., & Entzian, G. (1999). Longitude-dependent decadal changes of total ozone in boreal winter months during 1979–92. Journal of Climate, 12, 1038–1048. doi: 10.1175/1520-0442(1999)012<1038:LDDCOT>2.0.CO;2
- Peters, D., Gabriel, G., & Entzian, G. (2008). Longitude-dependent decadal ozone changes and ozone trends in boreal winter months during 1960–2000. Annales Geophysicae, 26, 1275–1286. doi: 10.5194/angeo-26-1275-2008
- Peters, D., & Waugh, D. W. (1996). Influence of barotropic shear on the poleward advection of upper-tropospheric air. Journal of the Atmospheric Sciences, 53, 3013–3031. doi: 10.1175/1520-0469(1996)053<3013:IOBSOT>2.0.CO;2
- Ramanathan, V., & Dickinson, R. E. (1979). The role of stratospheric ozone in the zonal and seasonal radiative energy balance of the earth-troposphere system. Journal of the Atmospheric Sciences, 36, 1084–1104. doi: 10.1175/1520-0469(1979)036<1084:TROSOI>2.0.CO;2
- Randel, W. J., & Cobb, J. B. (1994). Coherent variations of monthly mean total ozone and lower stratospheric temperature. Journal of Geophysical Research, 99, 5433–5447. doi: 10.1029/93JD03454
- Roeckner, E., Arpe, K., Bengtsson, L., Christoph, M., Claussen, M., Dümenil, L., … Schulzweida, U. (1996). The atmospheric general circulation model ECHAM-4: Model description and simulation of present-day climate (MPI Rep., 218). Hamburg, Germany: Max-Planck-Inst. für Meteorol.
- Roeckner, E., Bäuml, G., Bonaventura, L., Brokopf, R., Esch, M., Giorgetta, M., … Tompkins, A. (2006). The atmospheric general circulation model ECHAM5. Part I. Model description (MPI Rep., 349). Hamburg, Germany: Max-Planck-Inst. für Meteorol.
- Sassi, F., Boville, D. A., Kinnison, D., & Garcia, R. R. (2005). The effects of interactive ozone chemistry on simulations of the middle atmosphere. Geophysical Research Letters, 32, L07811. doi:10.1029/2004GL022131
- Sato, K., Tomikawa, Y., Hashida, G., Yamanouchi, T., Nakajima, H., & Sugita, T. (2009). Longitudinally dependent ozone increase in the Antarctic polar vortex revealed by balloon and satellite observations. Journal of the Atmospheric Sciences, 66, 1807–1820. doi:10.1175/2008JAS2904.1
- Scherhag, R. (1952). Die explosionsartigen Stratosphärenerwärmungen des Spätwinters 1951/52 [The explosive stratospheric warmings in late winter 1951/52]. Berichte des Deutschen Wetterdienstes in der US-Zone [Reports of German Weather Service in the US zone], 6, Nr. 38, pp. 51–63.
- Siegmund, P. (2005). Stratospheric polar cap mean height and temperature as extended-range weather predictors. Monthly Weather Review, 133, 2436–2448. doi:10.1175/MWR2985.1
- Sigmond, M., Scinocca, J. F., Kharin, V. V., & Shepherd, T. G. (2013). Enhanced seasonal forecast skill following stratospheric sudden warmings. Nature Geoscience, 6, 98–102. doi:10.1038/NGEO1678
- Taubenheim, J. (1969). Statistische Auswertung geophysikalischer und meteorologischer Daten [Statistical analysis of geophysical and meteorological data]. Leipzig: Geest & Portig.
- Uppala, S. M., KÅllberg, P. W., Simmons, A. J., Andrae, U., Da Costa Bechtold, V., Fiorino, M., … Woollen, J. (2005). The ERA-40 re-analysis. Quarterly Journal of the Royal Meteorological Society, 131, 2961–3012. doi:10.1256/qj.04.176
- Waugh, D. W., Oman, L., Newman, P. A., Stolarski, R. S., Pawson, S., Nielsen, J. E., & Perlwitz, J. (2009). Effects of zonal asymmetries in stratospheric ozone on simulated southern hemisphere climate trends. Geophysical Research Letters, 36, L18701. doi:10.1029/2009GL040419
- Wirth, V. (1993). Quasi-stationary planetary waves in total ozone and their correlation with lower stratospheric temperature. Journal of Geophysical Research, 98, 8873–8882. doi: 10.1029/92JD02820
- Woollings, T., Pinto, J. G., & Santos, J. A. (2011). Dynamical evolution of North Atlantic ridges and poleward jet stream displacements. Journal of the Atmospheric Sciences, 68, 954–963. doi:10.1175/2011JAS3661.1