
ABSTRACT
Lake breezes are thermally direct circulations that form as a result of the differential heating of land and water and are important in modifying local climate and triggering convection; they have also been linked to tornadogenesis. Although lake breezes are generally well understood, studies of smaller lakes have been relatively scarce, and none have examined lake-breeze circulations in southern Manitoba even though they are seemingly apparent on weather radar. The objectives of this paper are to provide a radar-based analysis of lake-breeze frequency and characteristics in southern Manitoba, determine the detectability of lake-breeze fronts using the radar analysis with data collected in 2013, assess the types of lake-breeze circulations that occur, and examine the meteorological conditions in which they occur. Between 2008 and 2013, lake-breeze fronts were noted on 205 days using radar over the summer months, accounting for 37% of study days, with an average of 11–12 days with lake-breeze fronts each month. These findings agree fairly well with, and are only slightly less than, frequencies reported for Lake Michigan but are lower than the most recent findings for southern Ontario. In an effort to validate the results, a broad comparison between the radar analysis and a more complete analysis using satellite and surface stations is provided for 2013 demonstrating that radar is more useful for detecting lake breezes around Lake Manitoba than around Lake Winnipeg. Lake-breeze circulations originating on Lake Manitoba and the Shoal lakes were classified into three types. The distribution of types for the Shoal lakes was similar to previous findings by other authors with “moderate deformation” circulations being the most frequent. Finally, a brief meteorological analysis was completed for each month of this study. The results of the analysis were inconclusive with no single meteorological factor being consistently well correlated to higher or lower lake-breeze frequency.
Résumé
[Traduit par la rédaction] Les brises de lac sont des circulations thermiquement directes qui se forment sous l'effet du réchauffement différentiel de la terre et de l'eau et elles sont importantes car elles peuvent modifier le climat local et déclencher la convection; elles ont aussi été liées à la tornadogénèse. Bien que l'on comprenne généralement bien les brises de lacs, les études portant sur de petits lacs ont été plutôt rares et aucune ne s'est intéressé aux circulations de brises de lac dans le sud du Manitoba, même si elles semblent perceptibles sur un radar météorologique. Cet article a pour objectifs de fournir une analyse par radar de la fréquence et des caractéristiques des brises de lac dans le sud du Manitoba, de déterminer la détectabilité des fronts de brise de lac à l'aide de l'analyse radar avec des données recueillies en 2013, d’évaluer les types de circulations de brise de lac qui se produisent et d'examiner les conditions météorologiques dans lesquelles elles se produisent. Entre 2008 et 2013, des fronts de brise de lac ont été relevés 205 jours à l'aide d'un radar durant l’été, soit 37% des jours à l’étude, avec une moyenne de 11 à 12 jours avec front de brise de lac chaque mois. Ces résultats s'accordent assez bien (tout en étant légèrement moindres) avec les fréquences observées pour le lac Michigan mais sont plus faibles que les résultats les plus récents pour le sud de l'Ontario. Pour tenter de valider les résultats, nous fournissons une comparaison générale entre l'analyse radar et une analyse plus complète faisant appel aux satellites et aux stations de surface pour 2013, comparaison qui indique que le radar est plus utile pour détecter les brises de lac autour du lac Manitoba qu'autour du lac Winnipeg. Nous avons classé en trois types les circulations de brise de lac produites par le lac Manitoba et les lacs Shoal. La distribution des types pour les lacs Shoal était similaire aux résultats précédents obtenus par d'autres auteurs, avec les circulations de « déformation modérée » étant les plus fréquentes. Finalement, nous avons effectué une brève analyse météorologique pour chaque mois de cette étude. Les résultats de l'analyse n’étaient pas concluants, aucun facteur météorologique unique n’étant toujours bien corrélé avec une fréquence de brises de lac plus élevée ou plus faible.
1 Introduction
Sea and lake breezes play an important role in regulating the climate of nearshore communities and can act as triggers for convective storm systems (Alexander, Citation2012; King et al. Citation2003; Sills, Citation1998). Evidence from southern Ontario suggests that lake-breeze boundaries can play a significant role in tornadogenesis (King et al., Citation2003). A number of investigations have been conducted on sea and lake breezes particularly in the Great Lakes and Florida regions of North America (e.g. Estoque, Gross, & Lai, Citation1976; King et al., Citation2003; Laird, Kristovich, Liang, Arrit, & Labas, Citation2001; Lyons, Citation1972; Sills, Citation1998; Sills et al., Citation2011). Despite the knowledge gained from these studies, few investigations have been carried out in other regions for comparison. As pointed out by Segal, Leuthold, Arritt, Anderson, and Shen (Citation1997), given the large variety of lakes (in shape, size, and orientation), a thorough examination of a variety of lake types is required to provide a full understanding of lake breezes.
Lake breezes are a type of thermally induced mesoscale circulation, or nonclassical mesoscale circulation, driven by the microclimatic differences between the terrestrial surface and water (e.g. Oke, Citation1978; Pearce, Citation1955). Sensible heat flux is typically greater over land than water (mainly because land has a much smaller heat capacity), which results in the air over land heating and expanding more rapidly than over water during daylight hours. Because of this thermal heating over the land, pressure tends to fall at the surface as buoyant air rises aloft. As the terrestrial column of air expands, the air pressure aloft increases relative to the air pressure over the water at the same altitude. Air then flows towards lower pressure over the water in the upper altitudes then descends to the water surface, in turn creating higher pressure at the surface. This creates a pressure gradient from water towards land at the surface that completes the circulation cell. Sea and lake breezes are the manifestations of the low-level portion of this circulation cell that flows onshore during the daytime (Oke, Citation1978).
A number of studies use the lake-breeze front (LBF) as a means of identifying the passage of a lake breeze, which moves inland with time. The front marks the division between the warm and typically drier air over the land and the cooler moist air coming off the lake and is one of the easier features of a lake breeze to detect (Sills et al., Citation2011). The LBF passage is characterized by a sharp decrease in temperature, a sharp increase in dew point, and a rapid shift to onshore winds (Estoque et al., Citation1976; Sills et al., Citation2011). Klemp and Rotunno (Citation1983) have shown that similar thermal gradients can enhance horizontal vorticity through baroclinic vorticity generation and are, therefore, important for convective initiation and enhancement. One issue with LBF detection is that as the front moves inland and mixes with the surrounding air mass, the difference between the lake breeze and the surrounding environment becomes more subtle making the front harder to detect (Lyons, Citation1972; Sills et al., Citation2011).
The extent to which the LBF penetrates inland depends on various factors including the temperature gradient between the land and water, the background (synoptic-scale) boundary layer flow, the shape of the shoreline, and the land-surface characteristics such as land use and vegetation cover (e.g., Crosman & Horel, Citation2010; Hill, Fitzpatrick, Corbin, Lau, & Bhate, Citation2010). Lake breezes have been known to penetrate quite far inland, from a few kilometres to hundreds of kilometres, depending on the prevailing synoptic conditions and the strength of the temperature difference between water and land (e.g. Sills, Citation1998; Sills et al., Citation2011; Simpson, Citation1994). Frequency of lake-breeze occurrence varies depending on the detection criteria; however, Sills et al. (Citation2011) showed that lake breezes occurred about 90% of the time during the Border Air Quality and Meteorology Study (BAQS-Met) 2007 field campaign in southern Ontario, which is considerably higher than previous studies that reported frequencies of 30–50% for June, July, and August (JJA; Laird et al., Citation2001; Lyons, Citation1972).
With the majority of Manitoba's population situated within the influence of Lake Manitoba and Lake Winnipeg, LBFs are an important focus of research on convective initiation and interactions with existing storms. Having a better understanding of the frequency and characteristics of LBFs will provide meteorologists with more information to better forecast both general weather and severe weather events in southern Manitoba. Curry (Citation2012) conducted the first detailed study documenting lake breezes in Manitoba by using weather radar, satellite imagery, and available surface meteorological data during the warm season (JJA) between 2008 and 2011. This paper aims to expand on the results presented by Curry (Citation2012) by adding two additional years to the radar analysis of lake-breeze frequency and summarizing the findings presented in the initial study because it was not formally published.
Thus, the objectives of this paper are (i) to provide a radar-based analysis of lake-breeze frequency and characteristics in southern Manitoba, (ii) determine the performance or detectability of LBFs by radar analysis using data collected in 2013 relative to other datasets for LBF detection, (iii) assess the types of lake-breeze circulations that occur (e.g., Sills et al., Citation2011), and (iv) examine the meteorological conditions in which they occur. The paper begins by highlighting the study area and data used in Section 2; then presents the results for each objective in Section 3, followed by a discussion and summary (Section 4).
2 Data and methods
a Study Area
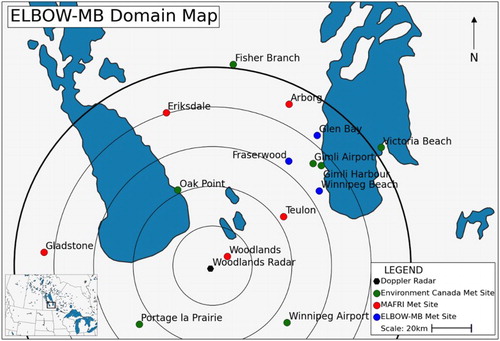
The study region within southern Manitoba, shown in , was defined to include the Environment Canada radar at Woodlands and any breezes that could be captured using this method of detection. The southern basins of Lake Winnipeg and Lake Manitoba and all the Shoal lakes were considered within the study region. Note, there are three Shoal lakes in Manitoba; Shoal lakes in this study refers to the group of East, West, and North Shoal lakes. Specifically, only the shores that are visible on the Woodlands Doppler radar, including the east, south, and west shores of Lake Manitoba, all shores of the Shoal lakes, and the west and south shores of Lake Winnipeg, were considered. includes range rings from the Woodlands radar site up to 120 km. The maximum detection range for the Woodlands radar in Doppler mode is 120 km; however, the beam height increases with distance from the radar, so the probability of detecting lake breezes is expected to decrease with range. At 120 km, the centre of the radar beam is approximately 2000 m above the ground, based on a standard vertical thermodynamic atmosphere.
Fig. 1 Map of study area. The Environment Canada stations are indicated in green; University of Manitoba stations are indicated in blue, and the MAFRI stations are indicated in red. The Environment Canada Doppler radar site at Woodlands (XWL) is indicated with a black dot, and rings indicate the distance from the radar in 20 km intervals with the outer ring indicating 120 km, the outer range of detection.
Two of the largest freshwater lakes in the world are located in southern Manitoba: Lake Winnipeg (11th largest) and Lake Manitoba (33rd largest). Combined, these lakes have an area of 29,318 km2 and 2773 km of shoreline. The lakes lie in the basin of Lake Agassiz, a glacial lake, with flat plains in the surrounding regions and minimal elevation changes. The waters are generally shallow, between 7 and 12 m deep. Lake Winnipeg has a narrow southern basin with an irregular shoreline, and Lake Manitoba has a wide southern basin with a rounded shoreline. The Shoal lakes are considerably smaller and consist of three small lakes ranging in diameter from 3 to 6 km. In recent years, flooding in the area has resulted in the Shoal lakes flooding overland and merging, resulting in one lake approximately 12 km in diameter. This is in stark contrast to the Great Lakes bordering southern Ontario, which are considerably deeper and colder, cover more surface area, and have longer shorelines. Water temperatures are available for Lake Winnipeg through an Environment Canada buoy; these range from 14°C in early June to 22°–26°C by July and August at the peak of summer heating. The average lake temperature for JJA is 19°C.
b Radar Data
Because of the number of years being analyzed, data availability, and spatial resolution of other datasets, the analysis presented primarily uses radar images to determine whether a lake breeze occurred by examining each image for the presence of an LBF. Further, given the limited data coverage for southern Manitoba, it is valuable to understand the effectiveness of Doppler radar when analyzing lake breezes in this region.
The LBFs appear on radar as clear air, fine line (weak reflectivity) returns, which form in the shape of the lake edge and move inland. In many cases, LBFs and sea-breeze fronts do not produce precipitation because the associated convection is too shallow (Bader et al., Citation1995). Given the absence of precipitation in the majority of cases in which these returns are seen, the cause of the fine line returns has been the subject of much debate and requires further research. There are two possible reasons that are often discussed as the cause for these returns: biological scatterers (birds and insects) and refractive index gradients (or Bragg scattering) (Martin & Shapiro, Citation2007). Clear-air returns occurred on almost all days examined, except when significant widespread precipitation was occurring within the region. In addition to any lake breezes that may have occurred, common other clear-air returns were horizontal convective rolls and outflow boundaries from thunderstorms.
A radar archive for 2008–2013 in 10-minute intervals was examined for each day during the study period of JJA. For earlier years, it was not feasible to access the radar data during the initial scope of this project. All radar images were processed using the Unified Radar Processor (URP) software, which is the software package used by Environment Canada for radar analysis (Patrick and McCarthy, personal communication, 2008). Each image was examined to first determine whether fine lines were present and second whether the source of the fine lines was a result of a lake breeze or another mesoscale process, such as a convective outflow. In those cases in which it was determined that the source of the radar returns was not other forcing mechanisms (such as convective outflow), an assumption was made based on the radar analysis that the fine line returns were either a result of a lake breeze or a representation of the associated LBF. On days when an LBF was believed to be present, URP was used to obtain (i) the value of the highest reflectivity value along the LBF, (ii) the maximum speed at which the LBF moved, and (iii) the furthest detected point travelled from the lakeshore. Each measurement was calculated individually for each shore and lake (i.e., the reflectivity, speed, and penetration distance of an LBF from the east, south, and west shores of Lake Manitoba, and the west and south shores of Lake Winnipeg). The measurements taken for each shore of the Shoal lakes, Lake Manitoba, and Lake Winnipeg were compared, and statistical tests were performed to determine if the values for the various shores were statistically similar. The analysis showed no statistically significant differences in the measurements between the shores of Lake Winnipeg and the Shoal lakes. Therefore, the results for those lakes are presented as the maximum value recorded for that particular lake. Lake Manitoba did exhibit significant differences in measurements between the three shores; therefore, each shore is presented separately. One potential reason for the significant differences in measurements among the three shores is that the western shore of Lake Manitoba is over 50 km from the radar (similar to the eastern shore of Lake Winnipeg) and, as a result, some LBFs may not appear on radar because they would not reach the beam height. Further, any LBFs that do originate from Lake Manitoba and penetrate westward would soon move out of Doppler radar range, influencing the results.
c Data Analysis for 2013
As part of the Effects of Lake Breezes on Weather in Manitoba (ELBOW-MB) 2013 field project (Hanesiak, Citation2013), data were collected for JJA from Environment Canada weather stations within the study area (shown in ), from three meteorological towers deployed for the field project, from Manitoba Agriculture, Food and Rural Initiatives (MAFRI) weather stations, and from satellite-based visible imagery. Because there were issues archiving the data initially, data were only available from 6 June to 31 August 2013, a total of 87 days.
Visible images from the GOES-13 satellite with coverage over southern Manitoba were archived for all days between 6 June and 31 August 2013. The spatial resolution of the images is 1.5 km, and they are available at 15-minute intervals. Because satellite-based visible images were used, this dataset only provides information during daylight hours, which is sufficient for lake-breeze occurrence because it is a daytime phenomenon.
Data were collected from a mesoscale network (mesonet) of surface weather stations within the study region and archived each hour for JJA 2013. In addition to the seven surface stations operated by Environment Canada within the study area, there are five surface stations operated by MAFRI. To supplement these data, the University of Manitoba deployed three meteorological towers near the west shore of Lake Winnipeg at Glenbay, Fraserwood, and Winnipeg Beach (). Measurement heights for each variable were not uniform across all stations. The Environment Canada and University of Manitoba stations recorded temperature, dew point, and wind speed and direction at the standard heights specified by the World Meteorological Organization, between 1.25 and 2 m for temperature and dew point, and 10 m for wind measurements. Many of the MAFRI stations collect temperature and dew point measurements at 1 m and winds at 3 m because these stations are used for agricultural applications. Because the wind measurements were not used in a quantitative analysis for this paper, it was not necessary to adjust for height discrepancies between stations. Note the hourly values from Environment Canada are reported as the current temperature, dew point, and wind direction for that hour, but the wind speed is reported as the 2-minute average prior to the hour of reporting. The University of Manitoba and MAFRI data were reported as hourly averages for each value. The MAFRI averages are based on 5-second averages for the previous hour, whereas the University of Manitoba data were based on the 1-minute averages for the previous hour. Because the data were not being used in a quantitative manner, no effort was made to adjust for these discrepancies.
Hourly values for temperature, dew point, wind speed, and wind direction were plotted using an Interactive Data Viewer (IDV). This allowed data to be viewed as a plot of surface stations, similar to the view available to meteorologists forecasting for the area. It is important to note, however, that at any given time, the mesonet stations available to meteorologists for analysis is generally limited to the Environment Canada stations; thus our analysis here may contain more detail than seen in an operational capacity.
To compare lake-breeze detection performance using multiple data sources rather than individual datasets, the LBF frequency analysis was done in two ways. First, each of the three datasets was analyzed independently to determine if an LBF was present on any given day for each lake. It was only possible to conduct this analysis for Lake Manitoba and Lake Winnipeg because the Shoal lakes are not well resolved on satellite images. Second, once the dataset was compiled for 2013 for each data source, the results from each dataset were combined to determine the likelihood of an LBF being present on any given day on each lake. It was not possible for this study to perform an “integrated analysis” with all three datasets being overlaid because the data were collected at different intervals and were collected as images rather than raw data values, making overlaying the data impossible. Therefore, the combined approach taken was to examine the notes for each day during the study period for each dataset and determine whether it was likely that an LBF was present. For example, if the analysis notes suggested that the mesonet indicated a wind shift and dew point increase that would be expected with an LBF passage, but radar indicated significant widespread precipitation, and satellite imagery indicated widespread cloud cover, the assumption would be made that no LBF was present. However, if, for example, the notes in the radar analysis indicated that fine line returns were present in the form expected of an LBF, while satellite images showed no cloud cover, and the mesonet analysis was inconclusive, the assumption would be made that an LBF was present. This analysis is similar to that presented by Sills et al. (Citation2011). We were then able to compare individual datasets and use the combined approach to determine the effectiveness of each dataset for LBF detection and any potential differences or biases.
d Meteorological and Climatological Data
The Environment Canada weather station at the Winnipeg James Richardson International Airport (CYWG) was selected as a representative general climatological station for the region, generally free from the influence of lake breezes, except under extreme circumstances. To provide context to the radar climatology, temperature, relative humidity, wind speed, and wind direction averages for each month and year were compared with the Environment Canada 30-year climatology to determine whether the year had abnormal conditions that may have influenced lake-breeze frequency or intensity for that year. Daily maximum temperatures were calculated first, then averaged for each month of the study period; all other values were hourly values averaged for the entire month. Additionally, data were collected from the Lake Winnipeg south basin buoy for lake surface temperature and lake air temperature. Again, daily maximum temperatures were calculated first for each variable then averaged for the study month. Because no climatological data for the buoy are readily available, the average given for comparison was calculated for each month over the six years of the study period.
3 Results
The following sub-sections provide the results for the frequency and characteristics of lake breezes in southern Manitoba, the performance of the radar analysis, the lake-breeze typing analysis, and the meteorological analysis for the study period.
a Radar Analysis of Lake Breezes
The main objective of the initial study presented by Curry (Citation2012) was to provide a radar analysis of lake-breeze frequency using radar images for 2008 to 2011. The initial analysis has since been updated and revised, with cases and statistics added for 2012 and 2013.
A total of 522 days were analyzed using URP for JJA from 2008 to 2013. An LBF was recorded somewhere within the study region on 205 study days. provides a summary of the frequencies of LBFs by lake, month, and year. The lowest number of LBFs was recorded for Lake Winnipeg, with 89 LBFs occurring between 2008 and 2013. There were 176 LBFs for Lake Manitoba and 102 LBFs for the Shoal lakes. The median number of days with LBFs present within the region in a year was 35, accounting for 37% of days in JJA. The lowest median frequency of days with LBFs was recorded in June with 11 days, while July and August both showed median values of 12 days. The median number of days with LBFs present for Lake Manitoba was 10 per month, while the Shoal lakes and Lake Winnipeg had a slightly lower median of 5 days. The median number of days when LBFs were noted on all lakes on a given day was just below 3 days. The highest frequency of days with an LBF present occurred in 2013, when LBFs were recorded on 48 days.
Table 1. Number of days with LBFs for 2008–2013 (JJA) and frequency of days per month (number of days with LBFs divided by total number of days in the month). Frequency is displayed individually for each lake (and shore in the case of Lake Manitoba). Also listed is the regional frequency for days when an LBF occurred on any lake or on all lakes.
The frequency of LBFs presented here was generally lower than in other studies, such as those of Lyons (Citation1972), Laird et al. (Citation2001), and Sills et al. (Citation2011). The results of Lyons (Citation1972) and Laird et al. (Citation2001) were presented by lakeshore for Lake Michigan, with values reported for the east shore, west shore, and both shores, allowing for reasonable comparisons between Lake Michigan and Lake Manitoba. Lyons’ results are reported for 1966 to 1968 while Laird et al. presented results for 1996 to 1997. The comparison is summarized in . In contrast, Sills et al. (Citation2011) presented frequencies for each lake in their study region individually, for any lake, and for all lakes for JJA of 2007.
Table 2. Median frequency of days with LBFs for Lake Michigan and Lake Manitoba reported by ELBOW-MB, Lyons (Citation1972), and Laird et al. (Citation2001) for Lake Manitoba and Lake Michigan for June, July, and August.
The frequencies in Lyons (Citation1972) study, which was one of the pioneering studies of lake breezes in the Great Lakes, showed the closest agreement with the frequencies reported here. The frequency of days with LBFs for JJA for the east shore of Lake Michigan was almost identical to the values for the east shore of Lake Manitoba, while the frequency for the west shore of Lake Michigan was much higher than for the west shore of Lake Manitoba. In contrast, Lyons’ analysis showed much higher frequencies for the east shore of Lake Michigan compared with Lake Winnipeg and more comparable frequencies for the west shore of each lake, respectively. Interestingly, the frequency of lake-breeze days for Lake Manitoba was more uniform for either side of the lake, while both Lyons and Laird et al. showed that lake breezes occurred on more days on the west and east sides respectively (). This may be a result of a difference in synoptic wind patterns between study years and study regions, as well as detection method limitations in each study.
Sills et al. (Citation2011) found much higher frequencies of days with lake breezes in southern Ontario than was recorded for southern Manitoba. The lowest frequency of lake breezes found in their study for any of the lakes examined (Lake Huron, Lake Erie, and Lake St. Clair) was 19 days for Lake Huron in August. In comparison, the highest number of lake-breeze days in one month for southern Manitoba for one lake was 15 days for Lake Manitoba (June 2008 and June 2013). When considering days when an LBF was present on any lake, the difference becomes even greater. Sills et al. (Citation2011) found lake breezes occurring somewhere in the region on 29 days of June, 30 days of July, and 22 days of August; in southern Manitoba, the median was 11, 12, and 12 days, respectively. The year with the highest frequency for southern Manitoba was 2013 with 16, 15, and 17 lake-breeze days for JJA, respectively. Sills et al. (Citation2011) also reported that lake breezes developed on all lakes for 26 days in June and July and 16 days in August. The maximum found for Manitoba was considerably less at 5, 7, and 4 days, respectively. The median for Manitoba was even lower, with only 2 days with LBFs developing on all lakes for June and 3 days for July and August. One reason the results are significantly different could be the difference in detection ability (e.g., southern Ontario having better radar coverage and more surface stations). Sills et al. (Citation2011) considered a variety of data sources for detecting lake breezes including radar, satellite-based visible imagery, and surface stations. In their discussion, they point out that the year studied was not significantly different meteorologically from the climatology for the region so their results are likely different because of detection ability.
1 Lake-breeze front characteristics
For each LBF that was identified, penetration distance and speed, as well as the highest reflectivity along the boundary were recorded. As noted earlier, there were significant differences between the measurements for LBFs off each shore of Lake Manitoba, whereas those differences did not exist for Lake Winnipeg or the Shoal lakes. As a result, for Lake Winnipeg and the Shoal lakes the maximum values are presented for each lake as a whole, but the Lake Manitoba results are presented by shore.
The furthest distance recorded for an LBF moving inland was for Lake Manitoba, with one front moving 112 km inland from the south shore. Lake Winnipeg also had high penetration distances, with a maximum of 109 km recorded. The median for LBFs from each lake, as shown in a, ranged from 8 km for the Shoal lakes to 35 km for Lake Winnipeg. The median LBF penetration distances for all shores of Lake Manitoba ranged from 16 to 19 km.
Fig. 2 Box and whisker plot providing (a) the distance (km) travelled by LBFs, (b) the speed of travel (m s−1), and (c) the highest reflectivity (dBZ), grouped by lake shore. The whiskers represent the most extreme data not considered outliers, the box the 25–75th percentile, and the red line the median for each distribution. The crosses indicate the outlying values of the dataset. A point is considered an outlier if the value is greater or less than 1.5 times the interquartile range.
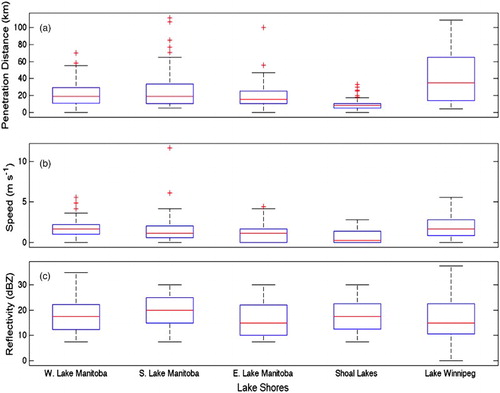
The penetration speed, shown in b, was quite consistent across all lakes, with median speeds ranging from 0 to 2 m s−1. The Shoal lakes were a notable exception, with the median speed of LBF penetration being only 0.3 m s−1. The fastest speed measured (11.7 m s−1) for a front was from south Lake Manitoba. The median and maximum reflectivities also showed similar ranges across all lakes, as shown in c. The median reflectivity recorded ranged from 15 dBZ (east Lake Manitoba), to 20 dBZ (west Lake Manitoba). The maximum reflectivity recorded for a front along each shore ranged from 30 to 37.5 dBZ.
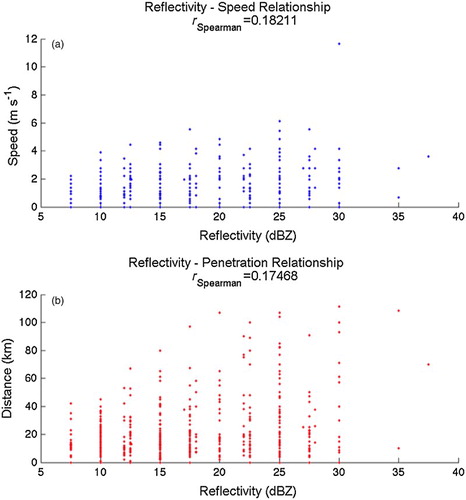
Further analysis was done to quantify the relationship between reflectivity and penetration speed and distance values for each case. The correlation between reflectivity and penetration speed for an LBF and between reflectivity and penetration distance for an LBF were calculated and plotted (a and 3b). The results indicated that there was a small, but significant (p value < 0.05) correlation between reflectivity and both speed and penetration, respectively; namely, LBFs with higher reflectivity values tended to have higher penetration speeds and distances. The relationship appears to be mainly limited by cases in which the speed and penetration distance of an LBF is hindered by a strong synoptic wind opposing the motion of the boundary. In these cases, the reflectivity may have been enhanced due to greater convergence and vertical motion at the LBF. Note that there are very few points on either a or 3b where high speed and penetration values are seen in conjunction with a low reflectivity value. This remains an area in which more research is required in order to understand more of the specifics of the relationships between reflectivity and speed and reflectivity and penetration.
Fig. 3 Scatterplots showing the correlation between (a) radar reflectivity (dBZ) and LBF penetration speed (m s−1) and (b) radar reflectivity (dBZ) and penetration distance (km). The Spearman correlation coefficient is listed for both plots and is considered significant with a p value less than 0.05.
Interestingly, previous work did not appear to examine the range of radar returns for LBFs nor did they examine the speed at which the breeze propagated from the lake. Therefore, it is not possible to compare the results of these findings to work done in the past. Harrison, Mecikalski, and Knupp (Citation2009) reported findings on convective outflow boundaries, which are very similar in appearance and structure in terms of radar analysis, and found that stronger (weaker) outflow boundaries were associated with higher (lower) reflectivity values. It was suggested that this was a result of stronger updrafts at the outflow's leading edge, resulting in higher insect concentrations aloft and an increase in Rayleigh scattering. The values presented for LBF penetration distance are comparable to results presented in previous work. While early studies surrounding the Great Lakes described penetration distances as fairly small, between 15 and 45 km on average (Lyons, Citation1972; Moroz, Citation1967), later studies in the region found median distances ranging from 45 to 75 km (Sills et al., Citation2011). Maximum distances were even higher, between 100 km and 215 km (Sills, Citation1998; Sills et al., Citation2011). In other regions of the world, sea-breeze studies have shown maximum penetration distances between 100 and 300 km (Simpson, Citation1994). The distance a breeze moves inland can be influenced by topography, synoptic-scale winds, and the strength of the circulation itself. Therefore, it is unsurprising that the results have varied so widely among studies. The fact that the values from this study were at the lower end of values from previous studies is to be expected, because the Manitoba lakes are generally warmer, smaller, and shallower than the Great Lakes and ocean basins.
b Radar Analysis Detectability
A recent study by Alexander (Citation2012) examined the accuracy of various datasets for detecting LBFs in southern Ontario, including radar, mesonet stations, satellite images, and a combination approach. They examined LBFs from Lake Huron and Lake Erie separately and compared various datasets and approaches to a “truth” dataset, or a set that was considered the most accurate representation of the LBF frequency for each lake. A similar approach was taken here to determine how well radar analysis detected LBFs in southern Manitoba. It was not possible for this study to create a truth set as detailed or accurate as Alexander's; therefore, our reference set is considered to be a combination approach using all three data sources, as outlined in Section 2c.
Of the 87 days analyzed for JJA 2013 using Doppler radar, LBFs were noted around Lake Manitoba on 39 days and around Lake Winnipeg on 21 days, for a frequency of 45% and 24% of study days, respectively. These numbers are slightly lower than those shown in because, as mentioned previously, the first five days of June were excluded from this analysis. In comparison, using satellite images, LBFs were noted to have occurred around Lake Manitoba on 42 days and on 37 days around Lake Winnipeg (48% and 43% frequency, respectively). Using the mesonet station data, a total of 36 days showed evidence for LBFs around Lake Manitoba and 39 days for Lake Winnipeg (41% and 45% frequency, respectively). The combined analysis dataset indicated LBFs on 48 days around Lake Manitoba and on 42 days around Lake Winnipeg, resulting in a frequency of 55% and 48%, respectively. Note that for all datasets, it is possible that LBFs may have been missed; thus this number may still be an underestimate of the frequency of LBFs for southern Manitoba. As would be expected, using a combination approach yielded the highest frequency of days with LBFs for both lakes.
A number of additional parameters were calculated for this analysis to determine the performance of the radar dataset compared with the performance of the combined dataset. A contingency table approach, similar to that used by Alexander (Citation2012), was used to determine how well the radar dataset agreed with the combined dataset. The first metric calculated was the probability of detection (POD) defined as
where a is the number of times both the individual dataset and the combined analysis indicated that an LBF was present, and c is the number of times when the combined analysis indicated that an LBF was present but the individual dataset did not. A perfect score would be 1 indicating that the radar analysis detected all cases of LBFs detected by the combined approach. The POD for the radar analysis for Lake Manitoba was 0.77 but only 0.50 for Lake Winnipeg. A second similar metric is the bias of the dataset, defined as
where a and c are defined as before, and b is the number of cases when the combined dataset indicated no LBF was present but the individual dataset indicated an LBF was present. If the number is greater than 1, this indicates that the radar detected more LBFs than the combined approach, while a number less than 1 indicates the radar analysis yielded fewer cases. The bias was 0.81 for Lake Manitoba and 0.50 for Lake Winnipeg. This indicates that the radar analysis is better suited to capturing LBFs occurring around Lake Manitoba than those occurring around Lake Winnipeg but will potentially miss cases for both lakes. The false alarm ratio (FAR) was also calculated, defined as
where a and b are defined as before, representing the number of cases when the radar analysis suggested the presence of an LBF but the combined analysis did not. The FAR for the radar analysis was very low for both lakes, zero for Lake Winnipeg, and 0.05 for Lake Manitoba. Thus, although radar analysis may miss a number of LBFs, particularly around Lake Winnipeg, the majority of cases are likely true LBFs as opposed to other sources of fine line returns.
In comparison, Alexander's (Citation2012) analysis yielded a POD score for radar between 0.20 and 0.46 for Lake Huron and between 0.20 and 0.37 for Lake Erie depending on the time of day being analyzed. Similarly, the bias for the Lake Huron radar analysis was 0.30 to 0.47 and 0.19 to 0.37 for Lake Erie, which is again much lower than the values reported here for southern Manitoba lakes. This may be a result of a more accurate truth set being used in Alexander's study, as well as the location of the Doppler radar site in relation to the lake shores being studied. The FAR agreed with those presented here; however, the Lake Huron radar analysis showed a false alarm ratio of 0.03 to 0.13 and zero for Lake Erie.
As a reference, similar statistics were calculated for the satellite dataset and the mesonet dataset. The satellite dataset had the highest POD rate for Lake Manitoba (0.83) while the mesonet had the highest for Lake Winnipeg (0.86). The satellite dataset appears to be the closest measure to the combined approach, with a bias of 0.88 for both Lake Winnipeg and Lake Manitoba. The mesonet dataset performed best when considering Lake Winnipeg, with a bias of 0.93, which is the best performance of any dataset. The highest FAR recorded was for the mesonet analysis, with a rate of 0.14 for Lake Manitoba.
These results suggest that although radar is an effective tool for detecting LBFs around Lake Manitoba, it is quite ineffective for detecting LBFs around Lake Winnipeg. In contrast, using mesonet stations in southern Manitoba is most effective around Lake Winnipeg, but around Lake Manitoba it may overestimate the number of LBFs present. Satellite images are generally best overall at detecting the presence of LBFs in southern Manitoba. These results are close to those expected given the locations of the data collected for each dataset. Although it is possible to view the entire study region on satellite, radar coverage does not extend over the entirety of the lakes and is more effective within a limited range. The mesonet station network in southern Manitoba is relatively sparse, with more stations located on either side of Lake Winnipeg and more near the lake shore making LBFs easier to detect, particularly if they do not track far inland. Around Lake Manitoba, there is only one shore station, located on the east shore of the lake. This can make it more difficult to determine when a true lake-breeze circulation is developing around Lake Manitoba as opposed to synoptic flow influence, particularly when the wind is from the west.
With this information, we can then extend these results to the broader dataset collected for this study to provide an estimate of how many LBFs could be occurring. For example, referring to the values in , the radar analysis yielded an average LBF frequency for Lake Manitoba of 30 days per season (JJA). If we apply the POD score for radar (0.77), we could expect approximately 1.23 times more days with LBFs, or 37 days on average. For Lake Winnipeg, with a radar POD score of only 0.5, we could potentially expect double the number of days with LBFs to occur, from 15 days per season to 30. Looking at individual years, this could mean some years may have seen as many as 53 days with LBFs on Lake Manitoba (2013, if the first five days of June are included) and as high as 50 days for Lake Winnipeg (2012 and 2013). This is of course a generalization, subject to error, but does provide an estimate of the potential LBF frequency in Manitoba.
This analysis provides a general sense of the degree to which radar analysis may have underestimated LBF frequency. This has important implications for the forecasting community in southern Manitoba and reinforces the need to approach nowcasting from a variety of data sources and to avoid relying too heavily on one data source, such as radar or mesonet stations. Additionally, an integrative approach to the datasets, which allows the user to examine all the data available (radar reflectivity, cloud cover, and surface observations), would yield the most accurate analysis. For cases in which not all data are available, radar would be an appropriate means for detecting boundaries around Lake Manitoba but would potentially miss an LBF present around Lake Winnipeg. An example of such a scenario for which this may be a consideration would be a day when meteorological conditions are such that significant high cloud is present on satellite imagery obscuring the lake, or no cloud is present, thus limiting the utility of satellite imagery for detecting an LBF.
c Lake-Breeze Circulation Typing
Further to the results presented by Curry (Citation2012), the lake breezes in southern Manitoba were reanalyzed and classified by circulation type. The typing was only completed for Lake Manitoba and the Shoal lakes. It was not possible to classify the lake-breeze circulations on Lake Winnipeg because only the west and south shorelines were within reasonable radar detection range.
Sills et al. (Citation2011) present three types of lake-breeze circulations in their study: low deformation (LD), moderate deformation (MD), and high deformation (HD) circulations. Criteria similar to those used by Sills et al. (Citation2011) were used and adjusted to reflect the constraints of the study region and radar detection network. It is important to note that in the analysis completed by Sills et al. (Citation2011) a greater variety of data sources were used, including the 850 hPa winds and surface station data, allowing for a more accurate and complete analysis. For the purposes of this study, winds were estimated using Doppler radial velocity scans. For a complete description of the circulations, as well as a conceptual model, the authors would encourage the reader to refer to Sills et al. (Citation2011).
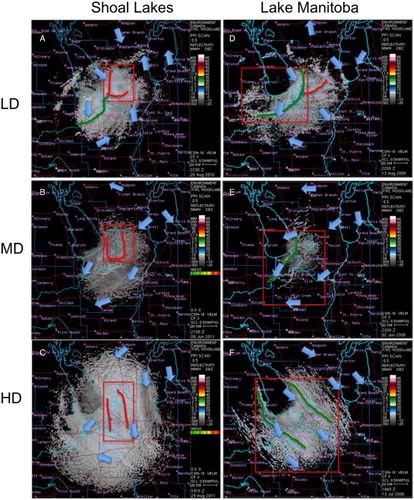
A lake breeze was categorized as LD circulation if an LBF was present on all possible sides of a lake parallel to the shore (as in the case of the Shoal lakes), or if a boundary was present on the downwind side of the lake when not all lake edges were in the radar detection zone (as in the case of Lake Manitoba) or visible (a and 4d). This is most like a “classical” or typical lake-breeze event and requires light background winds (Lyons, Citation1972; Sills et al., Citation2011). A case was classified as an MD circulation if LBFs were visible on the upwind side of the lake but not on the downwind side of the lake (b and 4e). If fronts were visible parallel to the wind direction and lakeshore but not present on the shore perpendicular to the wind direction, then the case was classified as an HD circulation (c and 4f). Examples of each type are provided in for both Lake Manitoba and the Shoal lakes. This analysis is considered most accurate for the Shoal lakes because all boundaries of the lakes can be viewed using the Woodlands radar. For Lake Manitoba, the margin of error and potential overlap between case types is significantly higher because the northern shore of the lake is not within Doppler radar range.
Fig. 4 Doppler radar images showing (a) LD lake-breeze circulation, (b) MD circulation, and (c) HD circulation for the Shoal lakes, and for Lake Manitoba (d), (e), and (f) as in (a), (b), and (c). The red box highlights the area of focus, with LBFs from Lake Manitoba highlighted by a green line, and LBFs from the Shoal lakes highlighted in red. Arrows indicate wind direction at the nearest hour at various Environment Canada stations in the area. (Images courtesy of Environment Canada, reproduced by permission.)
All three types of lake-breeze circulations were detected in southern Manitoba. Interestingly, the distribution of types varied significantly between Lake Manitoba and the Shoal lakes, shown in . The most frequently occurring lake-breeze circulations for Lake Manitoba were HD, while this was the lowest frequency of occurrence for the Shoal lakes. The least frequent type for Lake Manitoba was the LD circulation or more classic breeze type, and the lowest for the Shoal lakes were the HD circulations. The Shoal lakes had the highest frequencies for MD types.
Fig. 5 Histogram showing the distribution of lake-breeze circulation types by lake, for LD, MD, and HD circulation types.
Comparing these results with the analysis by Sills et al. (Citation2011), the frequency distribution for the Shoal lakes agrees quite well with the frequency distribution in their study. In the case of their study, LD circulations accounted for 24% of breezes, MD circulations for 57% of breezes, and HD circulations for 19%. This compares reasonably well with the 38%, 45%, and 18% frequencies reported here for the Shoal lakes. One reason that the distribution is skewed for Lake Manitoba could be the orientation of the lake with regard to the radar and the lack of coverage towards the north end of the lake. For example, in a north wind, the LBFs may in fact be due to an MD lake-breeze circulation; however, the front at the north end of the circulation is not observed because of the radar range; thus the boundary would be misclassified as an HD lake-breeze circulation. Additionally, it is important to note that the primary factor in whether or not a circulation will be classified as LD, MD, or HD is the wind direction and speed relative to the thermal gradient. Therefore, any significant regional differences in wind regimes will influence the frequency of each circulation type within a region. As mentioned previously, the results were presented here for Lake Manitoba for no other reason than comparison and should not be considered as truly “accurate” due to the limitations mentioned.
d Meteorological and Climatological Conditions
To help provide context for the results presented, a meteorological analysis for the conditions for JJA from 2008 to 2013 was conducted and compared with the climatology for the region. The CYWG station was selected as representative of the region, partly for its location and distance from the lakes, as well as the quality and length of the climatological record for that station. A variety of variables were used, including mean and maximum temperature, days with rainfall, relative humidity (at 2000 utc), modal wind direction, average wind speed, maximum daily lake surface temperature, and maximum daily lake air temperature (). For the temperature, humidity, and wind values, daily averages (or maxima) were calculated first then averaged for the month in question.
Table 3. Climatology for James Richardson International Airport in Winnipeg and annual meteorological data for 2008–2013. Surface and air temperatures for the lake were measured by the Lake Winnipeg south basin buoy. Mean temperatures were calculated by averaging all temperatures in the given month. Maximum temperatures were calculated by averaging the daily maximum temperatures for each month. The LBF frequency is also provided for reference for each year, as well as the average, and is listed as the total number of days in a given month/year with an LBF present somewhere in the study area.
In general, months with higher than average rainfall days had lower than average LBF frequencies, but this was not always the case. For example, while the lowest LBF frequency of 5 days and 19 days of rainfall occurred in August 2010, the highest LBF frequency of any month occurred in August 2013 when the number of days with precipitation was above normal. Interestingly, we would expect that years with higher than normal differences in maximum daily temperatures between CWYG and the Lake Winnipeg buoy would result in higher than average LBF frequency, but again this was not always the case. For example, July 2010 and July 2013 had comparable average wind speeds, comparable number of days with precipitation, and comparable maximum differences between daily temperature and lake air temperature; however, July 2013 had almost double the LBF frequency. It was not possible to confidently isolate one variable that seemed to influence the LBF frequency in a given month or year. This remains an area of research requiring further study in order to determine the key determining meteorological factors for lake-breeze development in southern Manitoba.
4 Summary and future research
For the first time, findings from a preliminary study of lake breezes in southern Manitoba have been presented, providing a basis for future research in this region. With the majority of Manitoba's population situated within the influence of Lake Manitoba and Lake Winnipeg, lake breezes are an important area for convection initiation and interactions with pre-existing storms. Having a better understanding of the frequency and characteristics of lake breezes and associated LBFs will provide meteorologists with more information to better forecast both general weather and severe weather events in southern Manitoba. The main objectives of this study were to (i) provide a radar-based analysis of LBF frequency and characteristics in southern Manitoba, (ii) determine the detectability of LBFs by radar using data collected in 2013 relative to other datasets for LBF detection, (iii) assess the types of lake-breeze circulations that occur, and (iv) examine the meteorological conditions in which they occur.
A radar-based analysis of LBF frequency using data from the Environment Canada Doppler radar at Woodlands was presented; LBFs were recorded on 37% of the days studied between 2008 and 2013, during JJA. The median frequencies of LBFs were 11 in June, 12 in July, and 12 in August, which was shown to be significantly lower than results reported for other regions (i.e., Sills et al., Citation2011). The frequency of events for Lake Manitoba compared favourably with frequencies reported for Lake Michigan by Lyons (Citation1972) for the west shore and Laird et al. (Citation2001) for the east shore, though Lake Manitoba LBF frequencies were slightly lower.
Each event was studied in detail using the URP software to determine the penetration speed and distance and maximum reflectivity for each LBF. The median penetration distances ranged from 8 km (the Shoal lakes) to 35 km (Lake Winnipeg), with maximum distances of 112 km for the south shore of Lake Manitoba and 109 km for Lake Winnipeg. The median speed ranged from 0 to 2 m s−1, with a maximum speed of 11.7 m s−1. These values agree well with previous studies. The maximum radar reflectivity was also recorded for each boundary, and median values ranged from 15 to 17.5 dBZ for each lake. The maximum reflectivity recorded was 37.5 dBZ.
Using other data sources collected during the 2013 ELBOW-MB field project (Hanesiak, Citation2013), including satellite imagery and surface station data, we were able to create a combination dataset to assess the utility of the radar dataset for detecting LBFs. The radar analysis was most useful for detecting LBFs around Lake Manitoba when compared with a combination approach with a bias of 0.81, but was quite poor at detecting LBFs around Lake Winnipeg. Although only about 23% of days with LBFs were missed for Lake Manitoba, potentially 50% of days were missed for Lake Winnipeg. Further, a comparison of radar, satellite, and the mesonet surface data indicates that radar is an effective data source when looking for LBFs around Lake Manitoba, but using existing surface stations is more effective for determining whether an LBF is present around Lake Winnipeg. Satellite images are also an effective data source when examining LBF occurrence when boundary layer cloud is present, with a bias of 0.88. This has important implications for the forecasting community in southern Manitoba and reinforces the need to use a variety of data sources when nowcasting to avoid relying too heavily on one data source, such as radar or the surface network.
Lake breezes originating from Lake Manitoba and the Shoal lakes were classified into three circulation types, according to the types developed by Sills et al. (Citation2011): LD, MD, and HD circulations. The distribution of types for the Shoal lakes was found to be similar to the reported distribution by Sills et al. (Citation2011) with 45% of cases being classified as MD, 38% as LD, and 18% as HD circulations. In contrast, only 30% of Lake Manitoba cases were classified as MD circulations, with 18% being LD, and 52% being HD circulations. The overabundance of HD circulations is likely a result of the orientation of the lake to the radar and the limited data for the north shore of the lake.
A brief meteorological analysis was conducted using data from the CYWG meteorological station and Lake Winnipeg buoy data. The results of the analysis were inconclusive. It was not possible to isolate single variables in connection with higher or lower LBF frequency, with different variables seeming to be more influential some years than others. This remains an area of research requiring further study in order to better understand the key determining meteorological factors for lake-breeze development in southern Manitoba.
There are still areas that require further research and study to better understand lake breezes in southern Manitoba as well as globally. There have been few studies of lake breezes resulting from smaller sized lakes (< 50 km). Further research on a variety of lake sizes and shapes will enable a better understanding of the different driving forces behind lake-breeze circulations and help validate modelling studies such as those of Crosman and Horel (Citation2012). Further, Asefi-Najafabady, Knupp, Mecikalski, and Welch (Citation2012) point out that studies examining small lakes have done so using numerical models or point measurements. Studies, such as the one presented here, act to further validate the measurements already provided by previous studies and those from modelling studies. Further research focused on modelling lake-breeze behaviour in the region would provide a more detailed understanding of the limiting factors for lake-breeze development and a better understanding of the skill of models in predicting lake-breeze development, particularly with high-resolution models (< 1 km grid spacing). Crosman and Horel (Citation2012) suggest further simulations looking at the sensitivity of lake breezes to time of day and seasons, as well as looking further into vertical wind measurements at the LBF and return flow depth and speed.
The ELBOW-MB field project was conducted in July 2013 (Hanesiak, Citation2013). The project gathered a variety of data including Doppler radar, targeted radiosonde launches, mobile weather observations, multiple meteorological tower measurements, and lidar wind profiles to better understand lake-breeze characteristics. Results from this study will help build upon the results presented here and provide a more detailed understanding of the influence and structure of lake breezes in southern Manitoba.
Acknowledgements
The authors would like to thank the Natural Sciences and Engineering Research Council (NSERC) for support of this research through an NSERC Discovery Grant to Hanesiak and NSERC undergraduate and graduate funding to Curry. Logistical, in-kind, and equipment assistance from Environment Canada and RainyDay Internet (especially Jeff Klause) were greatly appreciated during ELBOW-MB. We would also like to thank Dave Patrick and Jason Knight for their assistance with radar data. Finally, we would like to extend our gratitude to the two anonymous reviewers for their insightful comments and feedback.
References
- Alexander, L. S. (2012). Mesoscale boundaries and storm development in southwestern Ontario during ELBOW 2001. PhD dissertation. York University, Toronto, Ontario, Canada.
- Asefi-Najafabady, S., Knupp, K., Mecikalski, J. R., & Welch, R. (2012). Radar observations of mesoscale circulations induced by a small lake under varying synoptic-scale flows. Journal of Geophysical Research, 177, 1–13.
- Bader, M. J., Forbes, G. S., Grant, J. R., Lilley, R. B. E., & Waters, A. J. (Eds). (1995). Images in weather forecasting: A practical guide for interpreting satellite and radar imagery. London: Cambridge University Press.
- Curry, M. (2012). Lake effects in southern Manitoba (Honours Thesis). University of Manitoba, Winnipeg, Manitoba, Canada.
- Crosman, E. T., & Horel, J. D. (2010). Sea and lake breezes: A review of numerical studies. Boundary Layer Meteorology, 137, 1–29. doi: 10.1007/s10546-010-9517-9
- Crosman, E. T., & Horel, J. D. (2012). Idealized large-eddy simulations of sea and lake breezes: Sensitivity to lake diameter, heat flux and stability. Boundary-Layer Meteorology, 144, 309–328. doi: 10.1007/s10546-012-9721-x
- Estoque, M. A., Gross, J., & Lai, H. W. (1976). A lake breeze over southern Lake Ontario. Monthly Weather Review, 104, 386–396. doi: 10.1175/1520-0493(1976)104<0386:ALBOSL>2.0.CO;2
- Hanesiak, J. M. (2013). Effects of Lake Breezes on Weather in Manitoba (ELBOW-MB): Field plan, Centre for Earth Observation Sciences (CEOS) technical document, CEOS-Tech-2013-1. University of Manitoba, Fort Gary Campus, Winnipeg, Manitoba, Canada.
- Harrison, S. J., Mecikalski, J. R., & Knupp, K. R. (2009). Analysis of outflow boundary collisions in north-central Alabama. Weather and Forecasting, 24, 1680–1690. doi: 10.1175/2009WAF2222268.1
- Hill, C. M., Fitzpatrick, P. J., Corbin, J. H., Lau, Y. H., & Bhate, S. K. (2010). Summertime precipitation regimes associated with the sea breeze and land breeze in southern Mississippi and eastern Louisiana. Weather and Forecasting, 25, 1755–1779. doi: 10.1175/2010WAF2222340.1
- King, P. W. S., Leduc, M. J., Sills, D. M. L., Donaldson, N. R., Hudak, D. R., Joe, P., & Murphy, P. B. (2003). Lake breezes in southern Ontario and their relation to tornado climatology. Weather and Forecasting, 18, 795–807. doi: 10.1175/1520-0434(2003)018<0795:LBISOA>2.0.CO;2
- Klemp, J. B., & Rotunno, R. (1983). A study of the tornado region within a supercell thunderstorm. Journal of the Atmospheric Sciences, 40, 359–377. doi: 10.1175/1520-0469(1983)040<0359:ASOTTR>2.0.CO;2
- Laird, N. F., Kristovich, D. A. R., Liang, X.-Z., Arrit, R. W., & Labas, K. (2001). Lake Michigan lake breezes: Climatology, local forcing, and synoptic environment. Journal of Applied Meteorology, 40, 409–424. doi: 10.1175/1520-0450(2001)040<0409:LMLBCL>2.0.CO;2
- Lyons, W. A. (1972). The climatology and prediction of the Chicago lake breeze. Journal of Applied Meteorology, 11, 1259–1270. doi: 10.1175/1520-0450(1972)011<1259:TCAPOT>2.0.CO;2
- Martin, W. J., & Shapiro, A. (2007). Discrimination of bird and insect radar echoes in clear air using high-resolution radars. Journal of Atmospheric and Oceanic Technology, 24(7), 1215–1230. doi: 10.1175/JTECH2038.1
- Moroz, W. (1967). A lake breeze on the eastern shore of Lake Michigan: Observations and model. Journal of the Atmospheric Sciences, 24, 337–355. doi: 10.1175/1520-0469(1967)024<0337:ALBOTE>2.0.CO;2
- Oke, T. R. (1978). Boundary layer climates (2nd ed.). London: Methuen & Co Ltd.
- Pearce, R. P. (1955). The calculation of a sea-breeze circulation in terms of the differential heating across the coastline. Quarterly Journal of the Royal Meteorology Society, 81, 351–381. doi: 10.1002/qj.49708134906
- Segal, M., Leuthold, M., Arritt, R. W., Anderson, C., & Shen, J. (1997). Small lake daytime breezes: Some observational and conceptual evaluations. Bulletin of the American Meteorological Society, 78, 1135–1147. doi: 10.1175/1520-0477(1997)078<1135:SLDBSO>2.0.CO;2
- Sills, D. M. L. 1998. Lake and land breezes in southwestern Ontario: Observations, analyses and numerical modeling (PhD dissertation). York University, Toronto, Ontario, Canada.
- Sills, D. M. L., Brook, J. R., Levy, I., Makar, P. A., Zhang, J., & Taylor, P. A. (2011). Lake breezes in the southern Great Lakes region and their influence during BAQS-Met 2007. Atmospheric Chemistry and Physics, 11, 7955–7973. doi: 10.5194/acp-11-7955-2011
- Simpson, J. E. (1994). Sea breeze and local wind. Cambridge: Cambridge University Press.