
ABSTRACT
In the field of climate change impact analysis, bidirectional changes in projections of future wind regimes varying among studies, locations, and models have been described in the literature, which is understandable from a global perspective. However, we should attempt to find evidence in the historical record to support these projections. This paper attempts to address this issue by analyzing historical wind gust observations for up to 57 years (1953–2009) over Canada. Two wind gust analysis techniques were used: the speed of daily wind gust events ≥50 km h−1 was compared with (1) the climatological daily temperature anomaly and (2) the climatological daily sea level air pressure anomaly. In addition, the frequency of daily wind gust events ≥90 km h−1 was compared with both daily temperature and pressure anomalies. The results indicate that during the past five decades gust wind speed over Canada increased significantly as the daily temperature anomaly increased and the daily pressure anomaly decreased. About 50–60% of daily wind gust events ≥90 km h−1 occurred with positive daily temperature anomalies and negative daily pressure anomalies. One major conclusion is that the methods used in and results derived from this study might be applied to climate change impact analysis to support projections of future wind regimes.
Résumé
[Traduit par la rédaction] Dans le domaine de l'analyse des répercussions du changement climatique, les changements bidirectionnels dans les projections des futurs régimes de vent, qui varient selon les études, les endroits et les modèles, ont été décrits dans la littérature, ce qui est compréhensible sur le plan mondial. Cependant, nous devrions essayer de trouver dans les données historiques des indices à l'appui de ces projections. La présente étude s'intéresse à cette question et analyse les observations passées de rafales de vent sur des périodes allant jusqu’à 57 ans (1953–2009) au Canada. Nous avons utilisé deux techniques d'analyse des rafales de vent : en comparant la vitesse des événements quotidiens de rafales de vent ≥50 km h−1 avec (1) l'anomalie climatologique quotidienne de température et (2) l'anomalie climatologique quotidienne de pression atmosphérique au niveau de la mer. De plus, nous avons comparé la fréquence des événements quotidiens de rafales ≥90 km h−1 avec les anomalies de température et de pression. Les résultats indiquent qu'au cours des cinq dernières décennies la vitesse des rafales de vent au Canada a augmenté considérablement pendant que l'anomalie quotidienne de température augmentait et que l'anomalie quotidienne de pression diminuait. Environ 50 à 60% des événements quotidiens de rafales de vent ≥90 km h−1 se sont produits avec des anomalies quotidiennes de température positives et des anomalies quotidiennes de pression négatives. Une conclusion importante qui en découle est que les méthodes utilisées et les résultats obtenus dans cette étude peuvent être appliqués à l'analyse des répercussions du changement climatique pour appuyer les projections de régimes de vent futurs.
1 Introduction
High wind speeds and wind gusts are a significant meteorological hazard worldwide and cause damage to property, infrastructure, agriculture, power lines, and trees, which has a considerable economic and social cost (Changnon, Citation2009; Dore, Citation2003; Lopes, Oliveira, Fragoso, Andrade, & Pedro, Citation2009; Pinto, Neuhaus, Leckebusch, Reyers, & Kerschgens, Citation2010). Wind gusts are one of the major loads affecting buildings and other infrastructure. Of all structures, the electrical power distribution and transmission line systems are probably among the most affected by extreme winds as a result of downed trees and poles (Changnon, Citation1980). When wind gusts exceed design parameters, damage to structures can increase significantly as a result of wind-induced loads on the structure. For safety and engineering design purposes, climate information on wind gusts is required to determine design wind loads for infrastructure building codes and standards. These design wind loads have an important role in preventing or limiting damage and in reducing the risk to human life from extreme winds. In addition, small changes in mean wind speed could produce much greater changes in wind energy output because the power generated is related to the cube of the wind speed as described by Betz's law (Betz, Citation1966).
Potential changes to future wind regimes resulting from a changing climate have also received much attention from the climate community. In the field of climate change impact analysis, bidirectional changes in projections of future wind regimes varying among studies, locations, and models, have been described in the literature, which is understandable. For example, a recent study (McInnes, Erwin, & Bathols, Citation2011) projected 10 m wind speeds due to anthropogenic climate change using an ensemble of 19 global climate models. The study concluded that at the end of this century wind speed is projected to increase over northern Europe, northern Africa, the South Pacific between 10° and 25°S, and the Southern Ocean and is projected to decrease over the equatorial oceanic regions, the Arabian Sea, the Aleutian Low in the North Pacific, and Greenland. The literature on projections of future wind regimes can generally be divided into two categories based on the sign of the projected changes. Some studies have investigated future wind regimes for specific locations and have projected an increase (positive sign) in events or speeds. For example, both dynamical and empirical downscaling methods were used to analyze changes in wind speeds at the end of this century; they indicated that the number of extreme wind speed events over northern Europe could be expected to increase (e.g., Beniston et al., Citation2007; Gregow, Ruosteenoja, Pimenoff, & Jylhä, Citation2011; Haugen & Iversen, Citation2008; Makkonen, Ruokolainen, Raisanen, & Tikanmaki, Citation2007; Pryor, Barthelmie, & Kjellström, Citation2005). Deepthi and Deo (Citation2010) investigated the possible impacts of climate change on design wind loads at locations off the coast of India using future global climate model (GCM) simulations and concluded that the increase in the 100-year wind return value was projected to range between 44 and 74%. More recent studies (Cheng, Li, Li, & Auld, Citation2012, Cheng, Lopes, Fu, & Huang, Citation2014) projected future wind gust events using statistically downscaled climate scenarios over Canada and concluded that the frequency of hourly wind gust events was expected to increase late this century. For example, across the study area the percentage increase in hourly wind gust events ≥70 km h−1 could be 20 to 30%. These projections of future wind gust events are supported by previous studies (e.g., Chang, Guo, & Xia, Citation2012; Lambert & Fyfe, Citation2006) that indicate a northward shift in mid-latitude storm tracks over Canada using the Intergovernmental Panel on Climate Change (IPCC) Fourth Assessment Report (AR4) diagnostic exercise and Phase 5 of the Coupled Model Intercomparison Project (CMIP5) simulations. These projections of increased mid-latitude storms were also confirmed by historical analysis over Canada using reanalysis data (Wang, Swail, & Zwiers, Citation2006) and observations (Wang, Wan, & Swail, Citation2006). Other studies have investigated future wind regimes for specific locations and have projected a decrease (negative sign) in events or speeds. For example, some studies (e.g., Jiang et al., Citation2010; Ren, Citation2010) used GCM output to analyze future wind speeds in China and concluded that wind speeds at the end of this century could be lower in most areas of China.
Furthermore, other studies have projected both increased and decreased wind speed regimes in the future. For example, Pryor, Schoof, and Barthelmie (Citation2005, Citation2006) used an empirical downscaling technique to generate probability distributions of wind speeds in northern Europe and concluded that the percentage changes in wind speeds in the 90th percentile late this century would be within a range from −15 to +15% of the current baseline. Najac, Boe·, and Terray (Citation2009) applied the statistical downscaling method to 14 GCMs to project the possible impacts of climate change on surface winds in France late this century. They found that, during the cold season, future mean wind speeds and the number of extreme wind events could decrease significantly over southeastern France and increase over northern France; during the warm season, the corresponding decreases could occur over all of France. Najac, Lac, and Terray (Citation2011) applied a statistical–dynamical downscaling method to project future wind speeds over France late this century and found that mean 10 m wind speeds could increase in the northwest and decrease in the southeast. Based on GCM simulations, Cradden, Harrison, and Chick (Citation2012) projected a future wind climate in the United Kingdom and concluded that wind speeds could increase in winter but decrease in summer. Goubanova et al. (Citation2011) used statistically downscaled GCM scenarios to assess the impact of climate change on the sea-surface wind over the Peru–Chile upwelling region and found that alongshore surface winds off central Chile could intensify significantly but those off central Peru could weaken during summer in warmer climates under 2 × CO2 and 4 × CO2 IPCC climate scenarios.
As the literature reviewed above shows, potential changes in future wind regimes varied by study, location, and model, which is understandable. However, there should be evidence in the historical record to support these projections although historical observations were used in the development of the statistical downscaling transfer functions. This paper attempts to analyze historical wind gust observations over Canada for up to 57 years (1953–2009) to address this issue. Two types of analyses are used: the speed of daily wind gust events ≥50 km h−1 were compared with (1) the climatological daily temperature anomaly and (2) the climatological daily sea level air pressure anomaly. Daily temperature and sea level air pressure anomalies are defined in this study as daily mean temperature and air pressure values subtracted from their daily climatological values for up to 57 years (1953–2009). To capture the signal of climate change impacts on wind regimes, it is more appropriate to use the relationship of gust wind speed to daily temperature and air pressure anomalies than time series trend analysis of gust wind speed (see Section 2 for more information). Using the daily temperature anomaly ensures a link with local convective windstorms, whereas using the daily air pressure anomaly provides a link to synoptic windstorms. It is hoped that this study will provide useful methods for finding evidence in the historical record to support the projections of future wind regimes.
This paper is organized as follows: the data and analysis techniques are described in Section 2; the results and a discussion of the study are presented in Section 3; and the conclusions are summarized in Section 4.
2 Data and analysis techniques
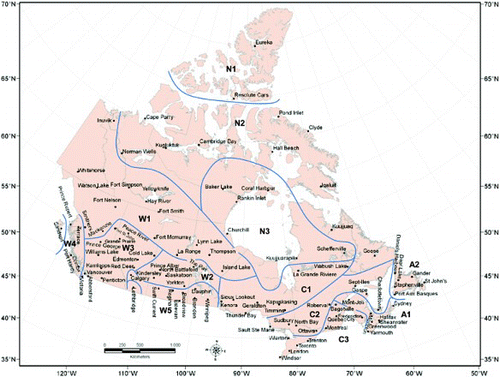
To evaluate climate change impacts on wind gust events in the historical record a number of weather variables (i.e., daily 10 m wind gusts, hourly air temperature, and sea level air pressure) for the 1953–2009 period are needed. Meteorological observations from 104 stations across Canada, as shown in , were used in the study. If the hourly air temperature and sea level air pressure data were missing for three consecutive hours or fewer, the missing data were replaced by interpolated data using a temporal linear method; if the data were missing for four or more consecutive hours that day was excluded from the analysis. Across the study area, missing data had to be replaced with interpolated data for 0.22% of the total hours; after interpolation, the dataset was 99.85% complete.
Fig. 1 Map of the study area including the locations of the selected stations and the wind gust regions over Canada.
To capture the signal of climate change impact on wind regimes, an appropriate method of analyzing wind data needs to be chosen in order to more effectively assess climate change impacts on wind extremes. Time series trend analysis is not an appropriate technique for this assessment because there is usually a chronological downward trend from early in the observational time period to later in the period. There are many reasons for these downward trends, such as changes in anemometer heights and types, instrument siting, and measurement averaging period (Cheng et al., Citation2012), as well as urbanization and other land-use changes (Li, Wang, Chu, & Tang, Citation2008). To assess climate change impacts on wind regimes, this study focuses on meteorological and climatological factors rather than these non-meteorological factors. As a result, an alternative technique for analyzing wind data is needed in order to capture only the information relevant to climate change.
Two approaches were taken to analyze wind gust: the speed of daily wind gust events ≥50 km h−1 versus (1) the climatological daily temperature anomaly and (2) the climatological daily sea level air pressure anomaly, in order to find evidence in the historical record to support projections of future wind regimes. Daily temperature and pressure anomalies were used to link climate change with two different scales of windstorm systems in Canada: localized convective windstorms, which generally occur in summer (JJA), and synoptic windstorms, which typically occur in winter (DJF). In addition to these two types of wind gust analyses, the frequency of daily wind gust events ≥90 km h−1 was analyzed with respect to both daily temperature and pressure anomalies. If these gust wind speed indicators increase as the daily temperature anomaly increases and/or as the daily pressure anomaly decreases in the historical record, then we can conclude that this is evidence to support projections of increased future wind regimes because future climate scenarios over Canada project that temperatures will increase and sea level pressure will decrease (Meehl et al., Citation2007).
To present the results over Canada more effectively, we use the wind gust regions classified in a previous study (Cheng et al., Citation2014). As indicated in that study (Cheng et al., Citation2014), the 36 variables produced from the historical monthly mean frequencies of daily wind gust events ≥50 km h−1, ≥60 km h−1, and ≥70 km h−1 were used as indicators to classify the 104 stations selected. The classification method uses the correlation matrix-based principal components analysis (PCA) and the average linkage clustering procedure. The PCA produced a four-component solution that explained 96% of the total variance within the dataset from the 36 wind gust variables. The average linkage clustering procedure was performed on the spatial four-component scores resulting in 13 wind gust regions for the study area (). Two individual stations, Lethbridge in southern Alberta and Sandspit on the eastern coast of British Columbia, with much stronger winds compared with adjacent stations, were isolated from the region within which they are located. From , it can be seen that across Canada strong wind gust events usually occur most frequently in Region A2; conversely, wind gust events occur least frequently in Region W1. In addition, wind gust events occur more frequently in Regions C3, W4, and W5 than in other regions. Refer to the study by Cheng et al. (Citation2014) for more information on the classification of wind gust stations and regional wind gust characteristics.
Table 1. Regional mean numbers of monthly total days with observed wind gust events.
To more effectively display the information from the stations within a wind gust region, 1°C intervals in daily temperature anomaly and 1 hPa intervals in daily air pressure anomaly were used. For each 1°C interval in the daily temperature anomaly and 1 hPa interval in the daily sea level air pressure anomaly, daily gust wind speed observations from all stations within a region were combined to calculate the regional average gust wind speed.
3 Results and discussion
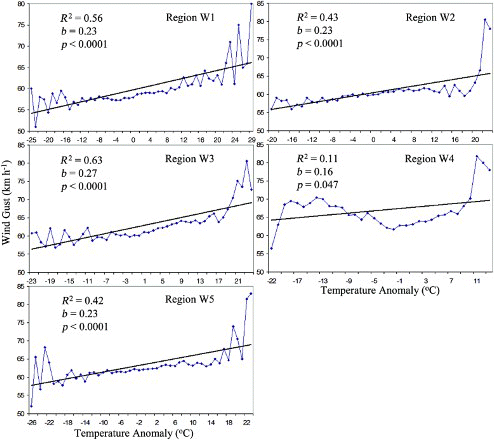
The results of the wind gust analyses of the speed of daily wind gust events ≥50 km h−1 with respect to the climatological daily temperature anomaly over the historical record across Canada are illustrated in and . It can be seen that the gust wind speed increases significantly as the daily temperature anomaly increases over the observation record for all regions across Canada. For every 1°C increase in the daily temperature anomaly, the speed of daily wind gust events ≥50 km h−1 increases by more than 0.2 km h−1 over most regions. The highest magnitude of the corresponding gust wind speed increase occurs in the northernmost region (Region N1)—0.64 km h−1 for every 1°C increase in daily temperature anomaly.
Fig. 2 Relationships between the speed of observed daily wind gust events ≥50 km h−1 and the observed climatological daily temperature anomaly during the period 1953–2009 (b is the slope of gust wind speed (km h−1) for each daily temperature anomaly increase of 1°C).
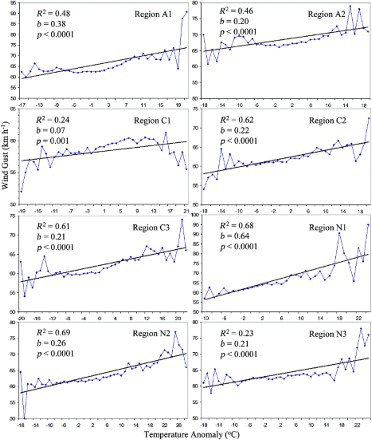
Fig. 3 As in , but for different regions.
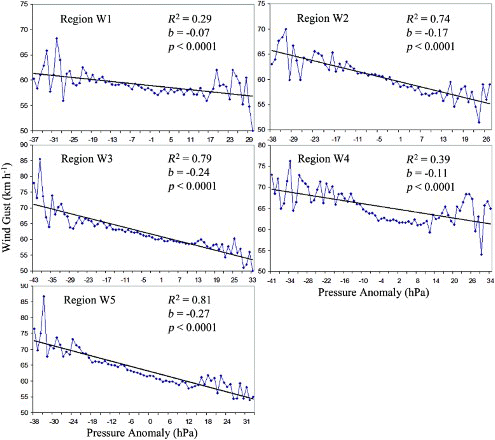
Similarly, the results of the wind gust analyses for the speed of daily wind gust events ≥50 km h−1 with respect to the daily sea level pressure anomaly over the observation record across Canada are illustrated in and . It is immediately apparent from and that the gust wind speed increases significantly as the daily pressure anomaly decreases over all regions of Canada. Over most of the regions, for every 1 hPa decrease in daily pressure anomaly, the speed of wind gust events ≥50 km h−1 increases by more than 0.2 km h−1. The highest magnitude of the corresponding gust wind speed increase occurs in Regions C3 and N3—over 0.4 km h−1 for every 1 hPa decrease in daily pressure anomaly.
Fig. 4 Relationships between the speed of observed daily wind gust events ≥50 km h−1 and the observed climatological daily pressure anomaly during the period 1953–2009 (b is the slope of gust wind speed (km h−1) for each daily pressure anomaly decrease of 1 hPa).
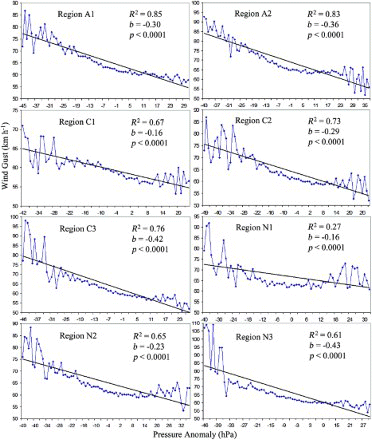
Fig. 5 As in , but for different regions.
To show more details for these wind gust analyses on a seasonal basis, the slopes of the corresponding changes in gust wind speed for each of the four seasons are presented in . The slopes of the seasonal gust wind speed (≥50 km h−1) with respect to the daily pressure anomaly are statistically significant for all regions and seasons except two. The corresponding slopes of the gust wind speed with respect to the daily temperature anomaly over all regions across Canada are statistically significant for autumn and winter. The corresponding slopes in spring are statistically significant for most of the regions and in summer for about half the regions.
Table 2. Slopes of the gust wind speed (≥50 km h−1) for each daily temperature anomaly increase of 1°C or for each daily pressure anomaly decrease of 1 hPa. (*, **, and *** indicate p-values of <0.05, <0.01, and <0.0001, respectively).
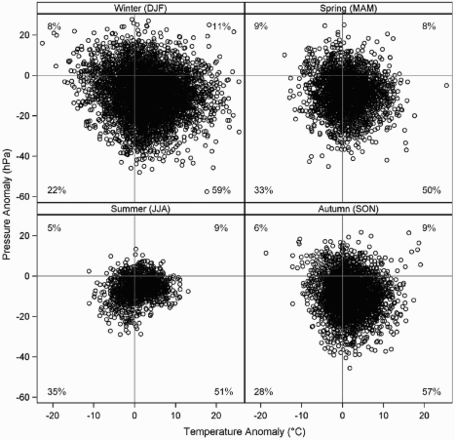
The relationships between the frequency of daily wind gust events ≥90 km h−1 and the daily temperature and pressure anomalies are illustrated in , merging all 104 stations studied. About 50 to 60% of the daily extreme wind gust events in all seasons occurred with a positive daily temperature anomaly and a negative daily pressure anomaly. Some of the events (22–35% in all seasons) are associated with a negative daily temperature anomaly and a negative daily pressure anomaly. Less than 10% (5–9% in all seasons) are related to a negative daily temperature anomaly and a positive daily pressure anomaly.
Fig. 6 Relationships between observed daily wind gust events ≥90 km h−1 and observed climatological daily temperature and daily pressure anomalies during the period 1953–2009 (merging all 104 stations over Canada studied).
The wind gust analysis results described above demonstrate that lower pressures and warmer temperatures, which can enhance the development of both synoptic and localized convective wind storm systems over Canada, favour wind gust events. Consequently, these results can be presented as evidence to support the projections of increased frequency and intensity of wind gust events in the future. From the GCM output, as reported in the 2007 IPCC report (Meehl et al., Citation2007), and from downscaled future climate data (Cheng et al., Citation2012, Citation2014), future temperatures could be higher than and future pressures could be lower than they are currently or were in the past over Canada. This suggests the possibility that the frequency and intensity of future wind gust events over Canada could be projected to increase as temperature warms and pressure lowers under a future changing climate; both synoptic and localized convective wind storm systems could occur more frequently in the study area (for detailed information on projections of wind gusts refer to Cheng et al. (Citation2014)).
The conclusion derived from this study demonstrating evidence to support future wind gust projections is confirmed by previous studies (e.g., Chang et al., Citation2012; Lambert & Fyfe, Citation2006). Lambert and Fyfe (Citation2006) indicated that the number of intense mid-latitude cyclones over Canada, projected by GCMs participating in the IPCC AR4 diagnostic exercise under the A2 and B1 scenarios, would increase by 2046–65 and again by 2081–2100. Chang et al. (Citation2012) pointed out that under CMIP5, multimodel ensemble projections revealed a northward shift of mid-latitude storm tracks over Canada. The projections of increased mid-latitude storms in the future are also supported by historical analysis over Canada using reanalysis data (Wang, Swail et al., Citation2006) and observations (Wang, Wan et al., Citation2006). Wang, Wan et al. (Citation2006) indicated that with surface temperature warming, evaporation rates would increase and thereby precipitation and release of latent heat would also increase, and both would contribute to the deepening of cyclones and strengthening of windstorms.
4 Conclusions
The overarching purpose of this study was to analyze observed wind gust data over the past five decades over all regions of Canada in an attempt to discover evidence in the historical record to support projections of future wind gusts. The results indicate that the speed of wind gusts increased significantly as the daily temperature anomaly increased and the daily pressure anomaly decreased. In addition, 50 to 60% of daily wind gust events ≥90 km h−1 occurred with positive daily temperature anomalies and negative daily pressure anomalies over the historical record. The main conclusion derived from this study is that these results provide evidence to support the projections of future increases in the frequency and intensity of wind gust events. As a result, we can conclude that the methods used in and results derived from this study could be applied to climate change impact analysis to support projections of future wind regimes.
Acknowledgements
The author would like to thank the three anonymous reviewers for providing detailed comments that significantly improved the original manuscript.
References
- Beniston, M., Stephenson, D. B., Christensen, O. B., Ferro, C. A. T., Frei, C., Goyette, S., … Woth, K. (2007). Future extreme events in European climate: An exploration of regional climate model projections. Climatic Change, 81(Issue 1 Supplement), 71–95. doi: 10.1007/s10584-006-9226-z
- Betz, A. (1966). Introduction to the theory of flow machines. Oxford: Pergamon Press.
- Chang, E. K. M., Guo, Y., & Xia, X. (2012). CMIP5 multimodel ensemble projection of storm track change under global warming. Journal of Geophysical Research, 117, D23118. doi: 10.1029/2012JD018578
- Changnon, S. A. Jr. (1980). Report of investigation 95: Climatology of high damaging winds in the Midwest. Champaign, IL: Illinois State Water Survey.
- Changnon, S. A. (2009). Temporal and spatial distributions of wind storm damages in the United States. Climatic Change, 94, 473–482. doi: 10.1007/s10584-008-9518-6
- Cheng, C. S., Li, G., Li, Q., & Auld, H. (2012). Possible impacts of climate change on wind gusts under downscaled future climate conditions over Ontario, Canada. Journal of Climate, 25, 3390–3408. doi: 10.1175/JCLI-D-11-00198.1
- Cheng, C. S., Lopes, E., Fu, C., & Huang, Z. (2014). Possible impacts of climate change on wind gusts under downscaled future climate conditions: Updated for Canada. Journal of Climate, 27, 1255–1270. doi: 10.1175/JCLI-D-13-00020.1
- Cradden, L. C., Harrison, G. P., & Chick, J. P. (2012). Will climate change impact on wind power development in the UK? Climatic Change, 115, 837–852. doi: 10.1007/s10584-012-0486-5
- Deepthi, R., & Deo, M. C. (2010). Effect of climate change on design wind at the Indian offshore locations. Ocean Engineering, 37, 1061–1069. doi: 10.1016/j.oceaneng.2010.04.001
- Dore, M. H. I. (2003). Forecasting the conditional probabilities of natural disasters in Canada as a guide for disaster preparedness. Natural Hazards, 28, 249–269. doi: 10.1023/A:1022978024522
- Goubanova, K., Echevin, V., Dewitte, B., Codron, F., Takahashi, K., Terray, P., & Vrac, M. (2011). Statistical downscaling of sea-surface wind over the Peru–Chile upwelling region: Diagnosing the impact of climate change from the IPSL-CM4 model. Climate Dynamics, 36, 1365–1378. doi: 10.1007/s00382-010-0824-0
- Gregow, H., Ruosteenoja, K., Pimenoff, N., & Jylhä, K. (2011). Changes in the mean and extreme geostrophic wind speeds in northern Europe until 2100 based on nine global climate models. International Journal of Climatology, 32, 1834–1846. doi: 10.1002/joc.2398
- Haugen, J. E., & Iversen, T. (2008). Response in extremes of daily precipitation and wind from a downscaled multi-model ensemble of anthropogenic global climate change scenarios. Tellus Series A-Dynamic Meteorology and Oceanography, 60, 411–426. doi: 10.1111/j.1600-0870.2008.00315.x
- Jiang, Y., Luo, Y., Zhao, Z., Shi, Y., Xu, Y., & Zhu, J. (2010). Projections of wind changes for 21st century in China by three regional climate models. Chinese Geographical Science, 20, 226–235. doi: 10.1007/s11769-010-0226-6
- Lambert, S. J., & Fyfe, J. C. (2006). Changes in winter cyclone frequencies and strengths simulated in enhanced greenhouse warming experiments: Results from the models participating in the IPCC diagnostic exercise. Climate Dynamics, 26, 713–728. doi: 10.1007/s00382-006-0110-3
- Li, Y., Wang, Y., Chu, H. Y., & Tang, J. P. (2008). The climate influence of anthropogenic land-use changes on near-surface wind energy potential in China. Chinese Science Bulletin, 53, 2859–2866. doi: 10.1007/s11434-008-0360-z
- Lopes, A., Oliveira, S., Fragoso, M., Andrade, J. A., & Pedro, P. (2009). Wind risk assessment in urban environments: The case of falling trees during windstorm events in Lisbon. In K. Strˇelcová, C. Mátyás, A. Kleidon, M. Lapin, F. Matejka, M. Blazˇenec, J. Škvarenina, & J. Holécy (Eds.), Bioclimatology and natural hazards (pp. 55–74). Springer.
- Makkonen, L., Ruokolainen, L., Raisanen, J., & Tikanmaki, M. (2007). Regional climate model estimates for changes in Nordic extreme events. Geophysica, 43, 19–42.
- McInnes, K. L., Erwin, T. A., & Bathols, J. M. (2011). Global climate model projected changes in 10 m wind speed and direction due to anthropogenic climate change. Atmospheric Science Letters, 12, 325–333. doi: 10.1002/asl.341
- Meehl, G. A., Stocker, T. F., Collins, W. D., Friedlingstein, P., Gaye, A. T., Gregory, J. M., … Zhao, Z. C. (2007). Global climate projections. In S. Solomon, D. Qin, M. Manning, Z. Chen, M. Marquis, K. B. Averyt, M. Tignor, & H. L. Miller (Eds.), Climate change 2007: The physical science basis. Contribution of Working Group I to the Fourth Assessment Report of the Intergovernmental Panel on Climate Change pp. 747–845. Cambridge, UK: Cambridge University Press.
- Najac, J., Boe·, J., & Terray, L. (2009). A multi-model ensemble approach for assessment of climate change impact on surface winds in France. Climate Dynamics, 32, 615–634. doi: 10.1007/s00382-008-0440-4
- Najac, J., Lac, C., & Terray, L. (2011). Impact of climate change on surface winds in France using a statistical-dynamical downscaling method with mesoscale modeling. International Journal of Climatology, 31, 415–430. doi: 10.1002/joc.2075
- Pinto, J. G., Neuhaus, C. P., Leckebusch, G. C., Reyers, M., & Kerschgens, M. (2010). Estimation of wind storm impacts over western Germany under future climate conditions using a statistical–dynamical downscaling approach. Tellus, 62A, 188–201. doi: 10.1111/j.1600-0870.2009.00424.x
- Pryor, S. C., Barthelmie, R. J., & Kjellström, E. (2005). Analyses of the potential climate change impact on wind energy resources in northern Europe using output from a regional climate model. Climate Dynamics, 25, 815–835. doi: 10.1007/s00382-005-0072-x
- Pryor, S. C., Schoof, J. T., & Barthelmie, R. J. (2005). Climate change impacts on wind speeds and wind energy density in northern Europe: Empirical downscaling of multiple AOGCMs. Climate Research, 29, 183–198. doi: 10.3354/cr029183
- Pryor, S. C., Schoof, J. T., & Barthelmie, R. J. (2006). Winds of change?: Projections of near-surface winds under climate change scenarios. Geophysical Research Letters, 33, L11702. doi:10.1029/2006GL026000
- Ren, D. (2010). Effects of global warming on wind energy availability. Journal of Renewable and Sustainable Energy, 2, 052301. doi:1941-7012/2010/2(5)/052301/5/
- Wang, X. L., Swail, V. R., & Zwiers, F. W. (2006). Climatology and changes of extratropical cyclone activity: Comparison of ERA-40 with NCEP–NCAR reanalysis for 1958–2001. Journal of Climate, 19, 3145–3166. doi: 10.1175/JCLI3781.1
- Wang, X. L., Wan, H., & Swail, V. R. (2006). Observed changes in cyclone activity in Canada and their relationships to major circulation regimes. Journal of Climate, 19, 896–915. doi: 10.1175/JCLI3664.1