
Abstract
This study analyzes changes in solar ultraviolet (UV) irradiances at 305 and 325 nm at selected sites located at high latitudes of both hemispheres. Site selection was restricted to the availability of the most complete UV spectroradiometric datasets of the past twenty years (1990–2011). The results show that over northern high latitudes, between 55° and 70°N, UV irradiances at 305 nm decreased significantly by 3.9% per decade, whereas UV irradiance at 325 nm remained stable with no significant long-term change. Over southern high latitudes (55°–70°S), UV irradiances did not show any significant long-term changes at either 305 or 325 nm. Changes in solar UV irradiances are discussed in the context of long-term ozone and other atmospheric parameters affecting UV variability at ground level.
Résumé
[Traduit par la rédaction] La présente étude analyse les changements dans les irradiances UV à 305 et 325 nm à des sites sélectionnés aux hautes latitudes des deux hémisphères. La sélection des sites s'est faite en fonction de la disponibilité des ensembles de données spectroradiométriques UV les plus complets au cours des 20 dernières années (1990–2011). Les résultats montrent que dans les hautes latitudes boréales, entre 55° et 70°N, l'irradiance UV à 305 nm a notablement diminué de 3,9% par décennie, alors que l'irradiance UV à 325 nm est restée stable, n'affichant aucun changement notable à long terme. Dans les hautes latitudes australes (55°–70°S), les irradiances UV n'ont affiché aucun changement notable à long terme, ni à 305 ni à 325 nm. Nous discutons des changements dans les irradiances UV solaires dans le contexte de l'ozone et d'autres paramètres atmosphériques à long terme ayant une influence sur la variabilité des UV au niveau du sol.
1 Introduction
The observed depletion of ozone over middle and high latitudes of both hemispheres in the 1980s and 1990s stimulated the need for long-term measurements of solar ultraviolet (UV) radiation in order to assess not only how ozone affects UV radiation at the surface but also the consequences of potential increases in UV radiation. Earlier analyses by Scotto, Cotton, Urback, Berger, and Fears (Citation1988) showed decreasing UV-B levels at a small number of sites, in contradiction to the expected increase due to ozone depletion. This was attributed to increases in absorbing tropospheric aerosols, ozone, and meteorological changes (Bruhl & Crutzen, Citation1989; Justus & Murphey, Citation1994). In addition to ozone, clouds and haze are also very important for controlling UV-B levels at the surface (Bais, Zerefos, Meleti, Ziomas, & Tourpali, Citation1993; Estupiραn, Raman, Crescenti, Streicher, & Barnard, Citation1996; Seckmeyer, Erb, & Albold, Citation1996). Other minor tropospheric constituents, such as sulphur dioxide (SO2) and nitrogen dioxide (NO2), also contribute to the variability of UV radiation in the atmosphere. UV radiation is attenuated by SO2 at UV-B wavelengths and most strongly by NO2 from 330 to 400 nm, with a smaller influence in the UV-B waveband (Douglass et al., Citation2011). Therefore, changes in any or all of these factors may reduce, cancel, or even reverse the expected UV-B increase due to the decline in ozone.
Blumthaler and Ambach (Citation1990) found that the erythemal dose increased at Jungfraujoch, a 3.6 km high mountain site in Switzerland, by about 1% per year in the 1980s. Increases in spectral UV irradiances were also reported in the 1990s from Brewer measurements at Toronto (Kerr & McElroy, Citation1993) and Thessaloniki under cloudless skies and at a constant zenith angle (Zerefos, Citation2002; Zerefos, Bais, Meleti, & Ziomas, Citation1995). In a study of the UV variability over the Netherlands, den Outer, Slaper, and Tax (Citation2005) reported that annual UV doses increased by about 5.5% per decade. The calculation of trends, however, depends strongly on the length of the records, which should be sufficiently long to derive significant results (Glandorf, Arola, Bais, & Seckmeyer, Citation2005; Lakkala, Kyrö, & Turunen, Citation2003).
More recently, den Outer et al. (Citation2010) reported the continuation, to 2006, of upward trends in UV radiation at the surface over Europe, two-thirds of which were attributed to cloudiness and aerosol optical depth changes and one-third to past ozone changes. Zerefos et al. (Citation2012) examined the long-term variability of UV solar irradiances at 305 and 325 nm at selected sites over northern mid-latitudes. They showed that over areas between 25° and 60°N, UV-B solar irradiances continued their positive trends through about 2005 after which they levelled off then seemed to reverse their upward trend. This was explained by considering the effects that the aerosol and ozone trends have on UV-B changes, since the observed trend in cloudiness was insignificant. It was found that the aerosol decline (brightening effect) offset the effects of the upward trend in ozone on UV-B from 1995 to about 2006. Since 2007, the continued upward trend in ozone dominated and overwhelmed the opposing trend imposed by the aerosol decline.
The objective of this study is to provide a general picture of the variability of UV irradiance at the surface during the past two decades (1990–2011) over northern and southern high latitudes. The analysis is based on spectral UV irradiance measurements at 305 and 325 nm at selected locations, limited by the availability of UV monitoring stations with datasets longer than 15 years.
In order to expand the work of Zerefos et al. (Citation2012) which referred to an analysis provided for stations at mid-latitudes, we provide results from various stations at high latitudes with long-term measurements of UV irradiance. The analysis was performed in order to determine whether the behaviour of solar UV at mid-latitudes over time could also be observed at high latitudes where the variability of aerosol and ozone effects are different. In order to address this question we have used, where possible due to data availability, a procedure similar to that of Zerefos et al. in order to analyze the variability of UV-B and UV-A solar irradiance through time, linking this with concurrent ozone, aerosol, and cloud fraction observations.
The paper is structured as follows. The data sources and methodology are described in Section 2. The time series of different factors (ozone, aerosols, and cloud fraction) affecting UV irradiance at high latitudes are presented in Section 3. Section 4 presents the long-term UV variability at high latitudes over the past two decades and compares the trends observed with those observed over mid-latitudes by Zerefos et al. (Citation2012). Finally, Section 5 summarizes the main results.
2 Data sources and methodology
Long-term UV spectroradiometric data from the 20-year period of study (1990–2011) were analyzed at seven sites listed in . These include four stations located at northern high latitudes between 55° and 70°N and three stations located at southern high latitudes (55°–70°S). Daily UV solar irradiances at 305 and 325 nm at Churchill, Manitoba, Canada, and Syowa in Antarctica were obtained from the World Ozone and Ultraviolet Radiation Data Centre (www.woudc.org). For the southern stations at Ushuaia, Argentina, and Palmer, Antarctica, as well as for the station at Barrow, Alaska, UV solar irradiances were downloaded from the National Science Foundation (NSF) Polar Programs UV Monitoring Network (http://uv.biospherical.com/). We used version 2 of the NSF network data which is more accurate than the version 0 data (http://uv.biospherical.com/Version2/Corrections.asp).
Table 1. Stations with long time series of accessible UV data analyzed in this study. Stations are listed from northern to southern high latitudes.
Measurements of solar horizontal irradiance at 305 nm and 3.25 nm (high and low ozone effect) are hereafter called UV-B and UV-A, respectively. Monthly means of UV irradiances at each station were calculated from daily UV solar irradiances. We followed the study by Zerefos et al. (Citation2012) and only calculated the monthly means when at least 14 daily summaries were available for each month. The majority of monthly averages were represented by at least 25 days (about 75%) and only a small percentage of monthly averages used fewer than 25 days. In most cases the missing days in a month were distributed approximately uniformly; therefore, the monthly means can be considered representative. The monthly UV irradiances at the stations under study were deseasonalized and averaged as follows. First, we deseasonalized the monthly mean data at each station by subtracting the long-term monthly mean pertaining to the same calendar month. Then we calculated averages over each geographical zone by averaging the deseasonalized data of the stations belonging to each geographical zone.
The uncertainties in UV irradiance measurements vary among different instrument types and stations, depending on the availability of resources for achieving accurate characterization of the instruments and for applying proper quality control procedures. Different studies have reported uncertainties between 5 and 7% for global or direct spectral irradiance measurements in the UV-B, which are dominated by uncertainty in the calibration standards (Bais et al., Citation2007 and references therein). Uncertainties in spectral measurements at sites at northern and southern high latitudes during winter when the solar zenith angle is low could have an effect on UV irradiance trends. In order to reduce possible errors in the trends due to measurement uncertainties in winter, UV anomalies at each station exceeding 3-sigma were removed from the deseasonalized UV time series. In addition, trends provided in this study are calculated starting two years after the Mt. Pinatubo eruption in order to further reduce uncertainties resulting from measurements conducted in the early stages of monitoring.
Daily ozone columns at the selected sites located at northern and southern high latitudes were retrieved from the Multi Sensor Reanalysis (MSR) of total ozone (van der A, Allaart, & Eskes, Citation2010) and from the Global Ozone Monitoring Experiment-2 (GOME-2). For the 1990–2008 period we used the MSR ozone data while for the 2009–2011 period GOME-2 satellite data were used. Both global ozone datasets are available from the Tropospheric Emission Monitoring Internet Service (TEMIS) at http://www.temis.nl/protocols/O3global.html. The MSR ozone dataset is a single coherent total ozone dataset created from data for 14 ozone columns measured by polar orbiting satellites during the last thirty years. The 14 total ozone satellite-derived datasets were collected from the following satellite-based instruments: the Total Ozone Mapping Spectrometer (TOMS), the Solar Backscatter Ultraviolet (SBUV) sensor, GOME, the SCanning Imaging Absorption spectroMeter for Atmospheric CHartographY (SCIAMACHY), the Ozone Monitoring Instrument (OMI), and GOME-2; these were used in the MSR. The MSR ozone data are available on a 1° × 1.5° grid for the period 1978–2008. The bias of the MSR analyses is less than 1% with a root-mean-square (RMS) standard deviation of about 2% compared with the corrected satellite-based observations that were used (van der A et al., Citation2010). The MSR data were not available after 2008; therefore, we decided to complement our ozone time series for the 2009–2011 period with data from GOME-2, which is one of the satellite-based instruments used in the MSR analyses.
Monthly mean total ozone values from satellite observations have been correlated with monthly mean total ozone values from ground-based observations. Unfortunately, ground-based measurements of total ozone were not available at Palmer station and the monthly time series included gaps at some stations, particularly Barrow. As such, the available datasets of total ozone were correlated at different time scales. At both short and longer time scales the ground-based total ozone data were highly correlated with the satellite-based observations at all stations (see Supplement figures). Given the statistically significant correlations between ground-based and satellite-based total ozone and because ground-based measurements were not available at all stations examined or included gaps for some high latitude stations, we decided to use satellite-based rather than ground-based observations. Comparisons between satellite-based and ground-based total ozone data for their common period of observations and an analysis of the differences resulting from the differing spatial representativeness of the datasets is provided in the Supplement to this study.
In addition to spectral UV solar irradiances and total ozone, the study includes the analysis of time series of aerosol optical depth (AOD) at 550 nm and the cloud fraction from satellite data for the period 1990–2011. In the case of AOD, two overlapping datasets were used: (1) for 1990–2006, the Global Aerosol Climatology Project (GACP; Mishchenko, Geogdzhayev, Rossow et al., Citation2007) and (2) for 2000–2011, the Terra AOD experiment from the MODerate-resolution Imaging Spectroradiometer (MODIS; Levy, Remer, Mattoo, Vermote, & Kaufman, Citation2007). Detailed comparisons of the GACP aerosol products with those from MODIS and from other datasets can be found in Geogdzhayev, Mishchenko, Liu, and Remer (Citation2004) and Mishchenko, Geogdzhayev, Cairns et al. (Citation2007). Zerefos et al. (Citation2012) calculated correlation coefficients between GACP and MODIS AOD data over Canada, Europe, and Japan for their common period (2000–2006) of observations. They found statistically significant correlations between the two datasets at the 99% confidence level. In this study we have analyzed zonally averaged AOD data at 550 nm over northern and southern high latitudes (55°–70°) as indicators to estimate the general aerosol variability at high latitudes. In the case of MODIS, we also include estimates of AOD variability around each of the ground-based monitoring stations listed in . MODIS AOD data near each high latitude station were taken at a spatial resolution of 1° × 1°. The correlation coefficients between the zonally averaged deseasonalized AOD from GACP and MODIS for the 2000–2006 period were found to be +0.4 for northern high latitudes (t-value = 3.42208, p-value = 0.00122, N = 54) and +0.1 for southern high latitudes (t-value = 0.35349, p-value = 0.72558, N = 42). We note that due to a lack of GACP AOD data around the high latitude stations under study, it was not possible to calculate correlation coefficients between GACP and MODIS AOD data at these stations.
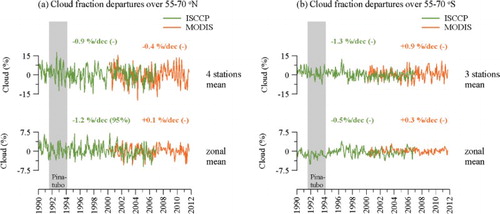
Similarly, cloud fraction data for 1990–2006 were taken from the National Aeronautics and Space Administration (NASA) International Satellite Cloud Climatology Project (ISCCP; Rossow & Schiffer, Citation1999), and for the period 2000–2011 the cloud fraction from the MODIS/Terra v5.1 dataset was used. We have analyzed zonally averaged cloud fraction data as indicators to estimate the general cloud variability over northern and southern high latitudes (55°–70°), respectively. In the case of cloud fraction, we have also included estimates of the variability in cloudiness around each of the ground-based monitoring stations listed in . MODIS cloud fraction data were taken at a spatial resolution of 1° × 1° around each monitoring station, and ISCCP cloud data were taken at a 2.5° × 2.5° resolution. The correlation coefficients between the two datasets over Canada, Europe, and Japan were found to be highly significant (Zerefos et al., Citation2012). In this study, the correlation coefficients between the deseasonalized monthly time series of cloud fraction from ISCCP and MODIS during their common period (2000–2006) of observations, were found to be statistically significant at the 95% confidence level (+0.3 for four stations located between 55° and 70°N, and +0.4 for three stations located between 55° and 70°S). The respective correlation coefficients for the zonal mean cloud fractions were on the order of +0.5 for northern high latitudes (t-value = 9.17688, p < 0.0001, N = 82) and +0.3 for southern high latitudes (t-value = 2.59538, p-value = 0.01131, N = 79). All parameters affecting UV variability (total ozone, AOD, and cloud fraction) have been deseasonalized and averaged in a similar manner to the UV datasets.
3 Time series of factors affecting UV
The long-term variability of deseasonalized departures from the average (in percent) of total ozone, AOD, and cloud fraction averaged over the northern and southern high-latitude stations studied are presented in , , and , respectively. The left panels refer to northern high latitudes and the right panels to southern high latitudes (55°–70°). Monthly means at each station were deseasonalized and averaged over each geographical zone as described in Section 2. Anomalies at each station exceeding ±3-sigma have been filtered out of the individual data series. The bottom panels in the figures show the long-term variability of the zonally averaged, deseasonalized anomalies of total ozone, AOD, and cloud fraction, respectively.
Fig. 1 Changes in total ozone over (a) 55°–70°N and (b) 55°–70°S. Long-term changes are given as a percentage per decade.
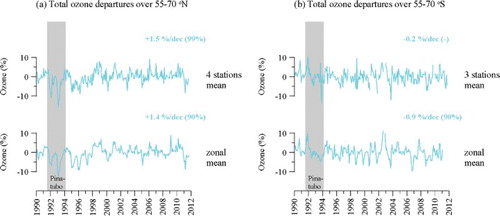
Fig. 2 Changes in AOD at 550 nm over (a) 55°–70°N and (b) 55°–70°S. For the overlapping period 2000–2006, the zonal mean AODs are 0.21 (GACP) and 0.14 (MODIS) for northern high latitudes; 0.20 (GACP) and 0.13 (MODIS) for southern high latitudes.
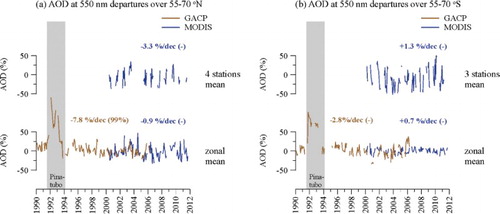
Fig. 3 Changes in cloud fraction over (a) 55°–70°N and (b) 55°–70°S. For the overlapping period 2000–2006, the stations mean cloud fractions are 0.65 (ISCCP) and 0.70 (MODIS) for northern high latitudes; 0.74 (ISCCP) and 0.79 (MODIS) for southern high latitudes.
We have calculated linear trends for the period 1994 to 2011, which is well after the Mt. Pinatubo eruption. All long-term changes were calculated after 1993 in order to exclude any effects of the Mt. Pinatubo eruption that resulted in low ozone column measurements between 1991 and 1993. Linear trends were derived from linear fits that were applied to the deseasonalized monthly mean data. These trends were evaluated for their statistical significance by applying the t-test in each trend estimate against the null hypothesis of no-trend for the appropriate number of degrees of freedom. The methodology for calculating the linear trends is similar to the method used by Zerefos et al. (Citation2012).
Between 1994 and 2011 the long-term variability of total ozone in northern high latitudes showed a significant positive trend, while the corresponding variability of AOD and cloud fraction showed no significant trends. The non-significant cloud trends over the stations being studied were consistent with the observed large-scale tendency seen in zonal mean cloud fraction over northern high latitudes. The respective MODIS AOD trends were also non-significant both around the stations and in the zonal mean. On the other hand, the observed upward trend in total ozone over the stations under study was significant at the 0.01 level, in agreement with the zonally averaged total ozone trend of +1.4% per decade. It was expected that the significant increase in total ozone in northern high latitudes would have affected the long-term variability of UV-B solar irradiances over the past two decades.
The picture at southern high latitudes is presented in the right panels of , , and . It appears that all atmospheric parameters, namely, total ozone, AOD, and cloud fraction averaged over the stations studied did not show any significant long-term trends throughout the entire period of record. These non-significant long-term trends were in agreement with the observed trends of zonally averaged deseasonalized total ozone, AOD, and cloud fraction over the majority of the southern high latitudes.
4 UV series at high latitudes
In this section we present the long-term changes in UV solar irradiances at 305 and 325 nm averaged over the northern and southern high-latitude stations under study (). The left panel of refers to northern high latitudes (55°–70°N) and the right panel to southern high latitudes (55°–70°S). Monthly means of UV irradiances at each station were calculated from at least 14 days of each month, and they were deseasonalized and averaged over each geographical zone as described in Section 2. The long-term changes in UV irradiance and total ozone are summarized in .
Fig. 4 Changes in UV irradiances at 305 and 325 nm averaged over (a) four stations located between 55° and 70°N and (b) three stations located between 55° and 70°S.
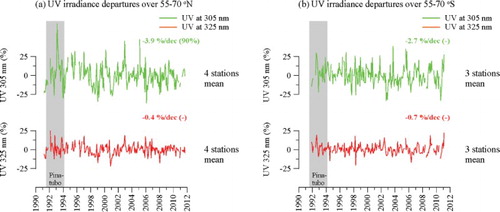
Table 2. Long-term changes in UV irradiance and total ozone (in percent per decade) averaged over four stations between 55° and 70°N and three stations between 55° and 70°S. Values in parentheses refer to the statistical significance of each trend. Dashes in parentheses indicate a confidence level less than 90%.
Between 1994 and 2011, UV irradiances at 305 nm averaged over the northern high-latitude stations decreased significantly by 3.9% per decade, whereas the corresponding UV irradiances at 325 nm did not show any significant long-term trends (−0.4% per decade). The picture at 325 nm, where ozone effects are minimized, is considered suitable for detecting changes due to other UV modulating factors such as aerosols and cloudiness (e.g., Fioletov & Evans, Citation1997; Kazadzis et al., Citation2005; Zerefos, Citation2002; Zerefos et al., Citation2012). Therefore, it can be assumed that most of the observed trend at 325 nm was caused by the combined effects of changes in aerosol and cloud fraction, since this wavelength is much less dependent on ozone variability. If we consider that the observed trend of –3.9% per decade at 305 nm is the result of the sum of the effects introduced by ozone, aerosols, and clouds, then a general estimate of the long-term trend at 305 nm, which can be attributed to the ozone increase, may be calculated by the difference in the observed trends at 305 and 325 nm (i.e., (−3.9% per decade) - (−0.4% per decade) = −3.5% per decade); this is in agreement with the observed upward trend in total ozone (+1.5% per decade). Since neither aerosols nor cloudiness showed significant trends, we did not expect to find a significant trend in the 325 nm solar irradiance. Indeed, the observed change in the UV-A wavelength was found to be small, on the order of −0.4% per decade. Consequently, it can be speculated that the observed negative long-term trend in the UV-B wavelength over the past 20 years could be attributed to the observed positive long-term trend in total ozone because UV radiation at 325 nm, AOD, and cloudiness remained stable with no significant long-term trends during that period.
These results are supported by the long-term variability of the difference in 305 and 325 nm wavelengths (not shown) which is almost unaffected by changes in aerosol and cloud fraction and depends mostly on changes in ozone (Zerefos et al., Citation2012). This irradiance difference is calculated from the difference in deseasonalized UV irradiances measured at two wavelengths, where ozone absorbs strongly at only one of those wavelengths. We have adopted this difference to isolate the influence of variations in ozone amount. For northern high latitudes, we estimate that the anti-correlation between total ozone and the [305–325] nm irradiance difference is highly significant (–0.75); therefore, the observed changes in the differences between 305 and 325 nm support the observed ozone changes. Although the estimated UV irradiance trends are generally small, it should be noted that even small changes in UV-B solar irradiances could be significant for human health, especially during the summer months.
The use of the difference in the observed trend at 305 nm and the trend at 325 nm to estimate the long-term trend at 305 nm due to the increase in ozone may be subject to uncertainties. Apart from the standard errors in the calculation of the trends, uncertainties that follow such types of assumptions may be related to the different effects of atmospheric constituents on UV irradiance. Our [305–325] nm irradiance difference indicator for ozone changes assumes that air quality factors such as aerosols have similar effects at both 305 and 325 nm (Zerefos, Citation2002) and that the attenuation by clouds has only a weak wavelength dependence between 305 and 325 nm. Indeed, clouds act to reduce UV-B radiation more or less uniformly across the spectrum except where cloud cover is very heavy (Tarasick et al., Citation2003). The effects of other parameters such as SO2 and surface albedo (ice and snow cover) are also assumed to be wavelength independent in the 305–325 nm wavelength interval; therefore, all these assumptions may introduce some uncertainties in the use of irradiance difference as an indicator of ozone changes. Nevertheless, the various effects are small compared with the wavelength dependence of the ozone absorption cross-section in the UV-B waveband, which decreases by two orders of magnitude as wavelength increases from 295 to 330 nm (Molina & Molina, Citation1986).
With respect to southern high latitudes, climatology, anomalies, and changes in total ozone and UV radiation have been examined in a number of studies dating back to 1994 (Bais et al., Citation2007; Bernhard, Booth, & Ehramjian, Citation2005, Citation2010; Diaz, Deferrari, Nelson, & Camilión, Citation2004; Diaz et al., Citation2006; Frederick et al., Citation1994). Those studies analyzed UV data for shorter periods of record. Here, we have extended the data to the end of 2010 and analyzed trends for the period two years after the Mt. Pinatubo eruption to reduce uncertainties resulting from measurements conducted during the early stages of monitoring. We find that neither UV-B nor UV-A solar irradiance wavelengths showed any significant long-term trends in the 1994–2011 period. We note that all other atmospheric parameters that were examined with respect to their relation with the long-term trends in UV irradiances (ozone, AOD, and cloud fraction) did not show any significant long-term trends throughout the entire period of record. The observed variability in the difference between 305 and 325 nm wavelengths was also consistent with the observed variability in total ozone at both short and longer time scales (r = −0.67, confidence level >99.9%). However, it should be noted that the period for our trend analyses (16 years) is still considered short for reliable trend detection (Weatherhead et al., Citation1998), and our results should be treated with caution given that the significance of the calculated changes is affected by the uncertainties of the measurements, which may range between 5 and 10%, depending on the site and the period (Bais et al., Citation2007).
Before closing this section we will provide some discussion on UV variability over each station separately. shows the long-term changes in UV irradiances and total ozone at each station examined. Stations are sorted from northern to southern high latitudes. For comparison with the northern high latitudes, we also describe results for the northern mid-latitudes as evidenced in the study by Zerefos et al. (Citation2012). For the geographical regions of Canada, Europe, and Japan, Zerefos et al. (Citation2012) showed positive trends in UV irradiance at the UV-B wavelength, which were not in agreement with the observed positive trends in total ozone. At 325 nm, a wavelength that is unaffected by ozone, significant positive trends were found in all geographical regions. The long-term variability of the difference between the 305 and the 325 nm spectral solar irradiances was consistent with the observed long-term variability of total ozone. The paradox of observing positive trends in UV irradiance at 305 nm while total ozone was increasing was attributed to the significant decline in AOD over northern mid-latitudes (Zerefos et al., Citation2012).
Table 3. Long-term changes and their standard errors (in percent per decade) of deseasonalized monthly mean UV irradiances at 305 and 325 nm and of their differences [305 nm–325 nm] at different stations. The last column shows the respective trends in satellite-derived total ozone.
In contrast to northern mid-latitudes, stations at northern high latitudes showed negative trends at 305 nm except Churchill which showed a non-significant small positive trend. The UV-B irradiance trends at Barrow and Sodankylä for the 1994–2011 period were estimated to be −6.9% and −8.7% per decade, respectively. These negative trends were consistent with the observed positive trends in total ozone (). According to this finding it could be speculated that the observed UV-B irradiance trends in the northern high latitudes were not masked by long-term aerosol trends as was shown by Zerefos et al. (Citation2012) for northern mid-latitudes. Over southern high latitudes, significant UV changes were found only at Palmer station in agreement with the results of Bais et al. (Citation2007). However, when averaging the values for the three stations to obtain a general picture of UV variability for southern high latitudes from the long-term measurements, it appears that the results are not statistically significant which is consistent with the respective findings for total ozone, AOD, and cloud fraction.
Previous studies analyzing UV variability over northern high latitudes were inconclusive with respect to long-term trends due to the limited availability of long-term UV data. Lakkala et al. (Citation2003) analyzed measurements of spectral UV irradiance at Sodankylä, Finland from 1990 to 2001. No statistically significant changes in any month were found over the 12-year period, possibly due to the relatively short period of analysis coupled with the high natural interannual variability of UV irradiance (Weatherhead et al., Citation2005). Spectroradiometer measurements at Barrow, Alaska, which commenced in January 2001, did not show statistically significant changes in UV irradiance for the period 1991 to 2001 (Booth, Bernhard, Ehramjian, Quang, & Lynch, Citation2001) for reasons similar to those for Sodankylä (Weatherhead et al., Citation2005). Trends in surface UV-B irradiance in Canada for the 1989–2000 period were analyzed by Tarasick et al. (Citation2003) from ground-based (Brewer) observations. Unfortunately, ground-based UV spectral instruments were not able to detect significant trends in average irradiation at that time, primarily because of the short time series of measurements. However, trends at Toronto and Saskatoon, the two sites with the longest records of spectrally resolved measurements of UV-B irradiance at that time (11 years), were all non-significant, in large part because total ozone did not change much during that period (Tarasick et al., Citation2003).
5 Conclusions
We have analyzed the long-term variability of solar UV irradiances over northern and southern high latitudes at selected stations possessing long series of spectral UV data during the 1990–2011 period. The general picture of surface UV irradiance variability in the past two decades at the regions studied can be summarized as follows:
Over northern high latitudes (55°–70°N), UV irradiance at 305 nm decreased significantly over the past twenty years, by about 3.9% per decade, in agreement with a statistically significant upward trend in satellite-derived total ozone of about 1.5% per decade. UV solar irradiance at 325 nm, AOD, and cloud fraction remained stable with no significant long-term trends.
Over northern mid-latitudes (35°–55°N), an earlier study by Zerefos et al. (Citation2012) provided evidence of an upward trend in UV-B and UV-A solar irradiance, followed by an upward trend in total ozone, a significant decline in AOD, and a non-significant trend in cloud fraction. It was shown that the observed positive change in UV-B irradiance could not be explained solely by the observed change in ozone and a large part of the observed positive UV trends was attributed to the decreasing aerosol trends since cloudiness had no significant trends. Our results for northern high latitudes, which cover the same time period as the Zerefos et al. (Citation2012) study indicate that the long-term variability of UV-B solar irradiance over the past two decades was affected by total ozone trends and not by aerosol trends as was seen for northern mid-latitudes.
Over southern high latitudes (55°–70°S), UV-B, ozone, UV-A, AOD, and cloud fraction did not show any significant long-term trends throughout the entire period of record. It should be noted, however, that the period of our trend analyses (16 years) is still considered short for reliable trend detection (Weatherhead et al., Citation1998) and that our results are within the uncertainties of the measurements of the spectral radiometers which may range between 5 and 10% in the UV-B part of the spectrum (Bais et al., Citation2007).
Supplement to Ozone and Spectroradiometric UV Changes in the Past 20 Years Over High Latitudes
Download PDF (253.3 KB)Acknowledgements
This study was conducted under the auspices of the 2012 Quadrennial Ozone Symposium. We acknowledge the individual agencies and scientists responsible for the ground-based UV measurements at Churchill and Syowa, which were retrieved from the World Ozone and Ultraviolet Radiation Data Centre of the World Meteorological Organization. The UV data for Ushuaia, Palmer, and Barrow were provided by the NSF UV Monitoring Network, operated by Biospherical Instruments Inc. under contract to the United States NSF's Office of Polar Programs via Raytheon Polar Services Company. We acknowledge the MODIS mission scientists and associated NASA personnel for the production of the data used in this research effort. The NASA/GACP AOD data were obtained from http://gacp.giss.nasa.gov/. The NASA/ISCCP cloud fraction data were obtained from http://isccp.giss.nasa.gov/. The MODIS/Terra AOD and cloud fraction data were obtained from http://gdata1.sci.gsfc.nasa.gov/daac-bin/G3/gui.cgi?instance_id=MODIS_MONTHLY_L3. S.K. would like to acknowledge ACI-UV (FP7-PEOPLE-2009-RG Marie Curie European Reintegration Grant, PERG05-GA-2009-247492).
Related Research Data
References
- van der A, R. J., Allaart, M. A. F., & Eskes, H. J. (2010). Multi sensor reanalysis of total ozone. Atmospheric Chemistry and Physics, 10, 11277–11294. doi:10.5194/acp-10-11277-2010
- Bais, A. F., Lubin, D. (Lead Authors), Arola, A., Bernhard, G., Blumthaler, M., Chubarova, N., … Zerefos, C. S. (2007). Surface ultraviolet radiation: Past, present, and future. In Scientific Assessment of Ozone Depletion: 2006, Chapter 7, Global Ozone Research and Monitoring Project (Report No. 50). Geneva, Switzerland: World Meteorological Organization.
- Bais, A. F., Zerefos, C. S., Meleti, C., Ziomas, I. C., & Tourpali, K. (1993). Spectral measurements of solar UVB radiation and its relations to total ozone, SO2, and clouds. Journal of Geophysical Research, 98(D3), 5199–5204.
- Bernhard, G., Booth, C. R., & Ehramjian, J. C. (2005). UV climatology at Palmer Station, Antarctica, based on version 2 NSF network data. In G. Bernhard, J. R. Slusser, J. R. Herman, & W. Gao (Eds.), Ultraviolet ground- and space-based measurements, models, and effects V (pp. 588607-1–588607-12). Proc. SPIE Int. Soc. Opt. Eng., Vol. 5886. doi:10.1117/12.614172
- Bernhard, G., Booth, C. R., & Ehramjian, J. C. (2010). Climatology of ultraviolet radiation at high latitudes derived from measurements of the National Science Foundation's ultraviolet spectral irradiance monitoring network. In W. Gao, D. L. Schmoldt, & J. R. Slusser (Eds.), UV radiation in global climate change: Measurements, modeling and effects on ecosystems (Chapter 3, pp. 48–72). Springer-Verlag, Berlin Heidelberg and Tsinghua University Press, Beijing.
- Blumthaler, M., & Ambach, W. (1990). Indication of increasing solar ultraviolet-B radiation flux in alpine regions. Science, 248, 206–208.
- Booth, C. R., Bernhard, G., Ehramjian, J. C., Quang, V. V., & Lynch, S. A. (2001). NSF polar programs UV spectroradiometer network 1999–2000 operations report. San Diego: Biospherical Instruments.
- Bruhl, C., & Crutzen, P. J. (1989). On the disproportionate role of tropospheric ozone as a filter against solar UV-B radiation. Geophysical Research Letters, 16(7), 703–706.
- Diaz, S., Camilión, C., Deferrari, G., Fuenzalida, H., Armstrong, R., Booth, C., … Vernet, M. (2006). Ozone and UV radiation over southern South America: Climatology and anomalies. Photochemistry and Photobiology, 82, 834–843. doi:10.1562/2005-09-26-RA-697
- Diaz, S. B., Deferrari, G., Nelson, D., & Camilión, M. C. (2004). Climatologies of ozone and UV-B irradiances over Antarctica in the last decades. Gayana 68(2) supl. t.I. Proc., 157–160. http://dx.doi.org/10.4067/S0717-65382004000200029
- Douglass, A., Fioletov, V. (Coordinating Lead Authors), Godin-Beekmann, S., Müller, R., Stolarski, R. S., Webb, A., … Vigouroux, C. (2011). Stratospheric ozone and surface ultraviolet radiation. In Scientific assessment of ozone depletion: 2010, Global Ozone Research and Monitoring Project (Report No. 52, Chapter 2). Geneva, Switzerland: World Meteorological Organization.
- Estupiραn, J. G., Raman, S., Crescenti, G. H., Streicher, J. J., & Barnard, W. F. (1996). The effects of clouds and haze on UV-B radiation. Journal of Geophysical Research, 101(D11), 16807–16816.
- Fioletov, V. E., & Evans, W. F. J. (1997). The influence of ozone and other factors on surface radiation. In D. I. Wardle, J. B. Kerr, C. T. McElroy, & D. R. Francis (Eds.), Ozone science: A Canadian perspective on the changing ozone layer (pp. 73–90). Toronto: Environment Canada, University of Toronto Press.
- Frederick, J. E., Diaz, S. B., Smolskaia, I., Esposito, W., Lucas, T., & Booth, C. R. (1994). Ultraviolet solar radiation in the high latitudes of South America. Photochemistry and Photobiology, 60(4), 356–362.
- Geogdzhayev, I. V., Mishchenko, M. I., Liu, L., & Remer, L. (2004). Global two-channel AVHRR aerosol climatology: Effects of stratospheric aerosols and preliminary comparisons with MODIS and MISR retrievals. Journal of Quantitative Spectroscopy & Radiative Transfer, 88, 47–59. doi:10.1016/j.jqsrt.2004.03.024
- Glandorf, M., Arola, A., Bais, A., & Seckmeyer, G. (2005). Possibilities to detect trends in spectral UV irradiance. Theoretical and Applied Climatology, 81, 33–44.
- Justus, C. G., & Murphey, B. B. (1994). Temporal trends in surface irradiance at ultraviolet wavelengths. Journal of Geophysical Research, 99(D1), 1389–1394.
- Kazadzis, S., Bais, A., Kouremeti, N., Gerasopoulos, E., Garane, K., Blumthaler, M., … Cede, A. (2005). Direct spectral measurements with a Brewer spectroradiometer: Absolute calibration and aerosol optical depth retrieval. Applied Optics, 44(9), 1681–1690.
- Kerr, J. B., & McElroy, C. T. (1993). Large upward trend of ultraviolet-B radiation linked to ozone depletion. Science, 262, 1032–1034.
- Lakkala, K., Kyrö, E., & Turunen, T. (2003). Spectral UV measurements at Sodankylä during 1990–2001. Journal of Geophysical Research, 108(D19), 4621. doi:10.1029/2002JD003300
- Levy, R. C., Remer, L. A., Mattoo, S., Vermote, E. F., & Kaufman, Y. J. (2007). Second-generation operational algorithm: Retrieval of aerosol properties over land from inversion of Moderate Resolution Imaging Spectroradiometer spectral reflectance. Journal of Geophysical Research, 112, D13211. doi:10.1029/2006JD007811
- Mishchenko, M. I., Geogdzhayev, I. V., Cairns, B., Carlson, B. E., Chowdhary, J., Lacis, A. A., … Travis, L. D. (2007). Past, present, and future of global aerosol climatologies derived from satellite observations: A perspective. Journal of Quantitative Spectroscopy & Radiative Transfer, 106, 325–347. doi:10.1016/j.jqsrt.2007.01.007
- Mishchenko, M. I., Geogdzhayev, I. V., Rossow, W. B., Cairns, B., Carlson, B. E., Lacis, A. A., … Travis, L. D. (2007). Long-term satellite record reveals likely recent aerosol trend. Science, 315, 1543. doi:10.1126/science.1136709
- Molina, T. J., & Molina, M. J. (1986). Absolute absorption cross sections of ozone in the 185- to 350-nm wavelength range. Journal of Geophysical Research, 91, 14501–14508.
- den Outer, P. N., Slaper, H., Kaurola, J., Lindfors, A., Kazantzidis, A., Bais, A. F., … Josefsson, W. (2010). Reconstructing of erythemal ultraviolet radiation levels in Europe for the past 4 decades. Journal of Geophysical Research, 115, D10102. doi:10.1029/2009JD012827
- den Outer, P. N., Slaper, H., & Tax, R. B. (2005). UV radiation in the Netherlands: Assessing long-term variability and trends in relation to ozone and clouds. Journal of Geophysical Research, 110, D02203. doi:10.1029/2004JD004824
- Rossow, W. B., & Schiffer, R. A. (1999). Advances in understanding clouds from ISCCP. Bulletin of the American Meteorological Society, 80, 2261–2287.
- Scotto, J., Cotton, G., Urback, F., Berger, D., & Fears, T. (1988). Biologically effective ultraviolet radiation: Surface measurements in the United States 1974–1985. Science, 239, 762–764.
- Seckmeyer, G., Erb, R., & Albold, A. (1996). Transmittance of a cloud is wavelength-dependent in the UV-range. Geophysical Research Letters, 23(20), 2753–2755.
- Tarasick, D. W., Fioletov, V. E., Wardle, D. I., Kerr, J. B., McArthur, L. J. B., & McLinden, C. A. (2003). Climatology and trends of surface UV radiation. Atmosphere-Ocean, 41(2), 121–138.
- Weatherhead, B., Tanskanen, A., Stevermer, A. (Lead Authors), Andersen, S. B., Arola, A., Austin, J., … Tarasick, D. (2005). Ozone and ultraviolet radiation. In Arctic Climate Impact Assessment (ACIA) (Chapter 5, pp. 151–182). Cambridge University Press. Retrieved from http://www.acia.uaf.edu
- Weatherhead, E. C., Reinsel, G. C., Tiao, G. C., Meng, X.-L., Choi, D., Cheang, W.-K., … Frederick, J. E. (1998). Factors affecting the detection of trends: Statistical considerations and applications to environmental data. Journal of Geophysical Research, 103(D14), 17149–17161.
- Zerefos, C. S. (2002). Long-term ozone and UV variations at Thessaloniki, Greece. Physics and Chemistry of the Earth, 27, 455–460.
- Zerefos, C. S., Bais, A. F., Meleti, C., & Ziomas, I. C. (1995). A note on the recent increase of solar UV-B radiation over northern middle latitudes. Geophysical Research Letters, 22(10), 1245–1248.
- Zerefos, C. S., Tourpali, K., Eleftheratos, K., Kazadzis, S., Meleti, C., Feister, U., … Heikkilä, A. (2012). Evidence of a possible turning point in solar UV-B over Canada, Europe and Japan. Atmospheric Chemistry and Physics, 12, 2469–2477.