
Abstract
Oceanic fronts are often associated with enhanced biological activity. Depending on their generation mechanism, they are often linked to specific geographical areas. Here we use 25 years of high-resolution satellite sea surface temperature (SST) daily images to generate maps of SST fronts over Canadian coastal waters. Results show that fronts are ubiquitous features, but some fronts are more persistent than others. We confirmed the location of previously known major fronts, but some new persistent frontal areas were also detected as a result of the use of high-resolution (1.1 km) data and a methodology adapted to detect smaller-scale frontal features. Results also show that some of the frontal areas are associated with enhanced phytoplankton biomass or higher trophic level organisms (whales and birds) confirming the ecological importance of this physical process.
Résumé
Les fronts océaniques sont souvent liés à une activité biologique accrue. Ils sont souvent associés à une aire géographique spécifique qui dépend du mécanisme qui les génèrent. Nous avons utilisé 25 années d'images journalières de températures de surface de la mer (TSM) à haute résolution spatiale afin de générer de cartes de fronts de TSM pour les eaux côtières canadiennes. Les résultats montrent que des fronts sont visibles partout mais que certains d'entre eux sont persistants dans le temps. Nous avons confirmé la position des fronts déjà connus mais de nouvelles zones ont aussi été détectées résultant de l'utilisation de données à haute résolution (1.1 km) et d'une méthodologie adaptée à la détection de fronts à plus petite échelle spatiale. Les résultats ont aussi montré que certains fronts sont associés à une biomasse phytoplanctonique plus élevée ou à la présence d'organismes de niveaux trophiques supérieurs (baleines, oiseaux), confirmant l'importance écologique de ce processus physique.
1 Introduction
An oceanic thermal front is a region of enhanced sea surface temperature (SST) gradients. They are often linked to gradients of other physical, chemical, or biological properties such as salinity, nutrients, plankton, suspended sediments. Their spatial and temporal scales vary over many orders of magnitude, ranging from small river plumes (a few metres and a lifetime of a few days) to western boundary currents such as the Gulf Stream (hundreds of kilometres and coherent in time for thousands of years). Because ocean fronts often constitute exceptional biological habitats, they are considered a key feature in physical oceanography (Belkin, Cornillon, & Sherman, Citation2009; Sherman, Citation1990, Citation2005).
Past studies mostly focused on the description of large-scale oceanic fronts associated with major currents (e.g., Belkin et al., Citation2009; Bisagni, Kim, & Chaudhuri, Citation2009; Legeckis, Brown, & Chang, Citation2002). Only a few studies have focused on specific coastal ecosystems (e.g., Belkin, Cornillon, & Ullman, Citation2001; Nieto, Demarcq, & McClatchie, Citation2012; Wall et al., Citation2008). Many physical processes, such as geostrophic currents, estuarine buoyancy currents, upwellings, water mass convergence zones, or marginal ice zones, can generate fronts in the coastal ocean. Depending on the generation mechanisms, fronts are often closely related to bathymetric features (shelves, capes, canyons, banks, shoals, etc.). The generation mechanisms also determine whether the front is associated with surface nutrient supply and enhanced primary productivity. For example, fronts delimiting divergence zones (such as tidal mixing or upwelling) from the surrounding waters generally mark high primary productivity areas. On the other hand, fronts associated with current convergence or with temperature gradients caused by river plumes or ice melting, may not be associated with high nutrient supply.
Surrounded by three oceans, Canada has the longest coastline in the world and oceans have a major role in the Canadian economy generating more than $1 billion in revenue. However, such a large body of water is difficult to monitor in detail using conventional in situ observations. Moreover, the remoteness and the harsh ice and meteorological conditions that prevail in most of the northern basins make observational datasets in these areas very scarce. Although a few studies have looked at frontal structures in Canadian waters from satellite data (e.g., Jardine, Thomson, Foreman, & Leblond, Citation1993; Lavoie, Bonn, Dubois, & El-Sabh, Citation1985; Mavor & Bisagni, Citation2001; Perry, Dilke, & Parsons, Citation1983; Ullman & Cornillon, Citation1999), these are generally limited to small areas. Using 25 years of remotely sensed SST data, the aim of this study is to provide an overview of frontal features in Canadian coastal waters. Whenever possible, known associations between front location, generation mechanism, and biological features are also indicated.
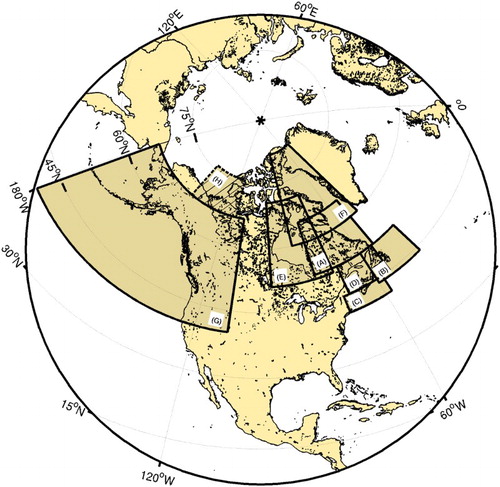
This study is, therefore, an atlas for front location that scientists can refer to in preparation for (or as a complement to) field studies. This work may also help in mapping sensitive biological habitats in a changing environment, such as the work recently realized by the World Wildlife Fund (Christie & Sommerkorn, Citation2012). Seven regions come under the scope of this study: Hudson Strait and the Labrador Shelf, the Newfoundland Shelf, Scotian Shelf, and Gulf of Maine area, the Gulf of St. Lawrence, Hudson Bay and Foxe Basin, Baffin Bay, and the Northeast Pacific Ocean (). For ease of locating information, each of these regions is presented and discussed separately in Sections 3a to 3g. These regions are mostly in Canadian waters, but some regions naturally close to Canada will also be described. The Beaufort Sea (hatched area in ) is not discussed here because the region is under investigation in another ongoing and independent study on thermal fronts.
Fig. 1 Global map of the areas studied: (A) Hudson Strait and the Labrador Shelf (52°–65°N, 79°–54°W), (B) Newfoundland Shelf (44°–52°N, 60°–44°W), (C) the Scotian Shelf and the Gulf of Maine (41°–45°N, 72°–58°W), (D) the Gulf of St. Lawrence (45°–52°N, 70°–55°W), (E) Hudson Bay and Foxe Basin (51°–71°N, 96°–72°W), (F) Baffin Bay (60°–82°N, 85°–50°W), (G) the Northeast Pacific Ocean (40°–67°N, 180°–110°W). (H)The Beaufort Sea (67°–76°N, 145°–115°W) is not within the scope of the present study because the region is under investigation in a separate study.
2 Methodology and datasets
Mean daily maps of SST were obtained from the Maurice Lamontagne Remote Sensing Laboratory for the period 1986–2010. These maps were generated using Advanced Very High Resolution Radiometer (AVHRR) data. These daily SST maps are composites of multiple satellite passes over Canadian waters with a spatial resolution of 1.1 km. Before the composite is created, each image undergoes a thorough series of tests to eliminate clouds and ice. These tests are based on pixel albedo in the two visible channels and temperature in the three thermal channels. Tests are also made on the spatial uniformity of albedo and temperature over a 3 × 3 pixel box. These flagged data are then compared with ice coverage maps generated by the National Snow and Ice Data Center (NSIDC) to detect abnormal pixels that may not have been detected by the cloud screening. Any SST pixel corresponding to a non-zero ice coverage region according to NSIDC is flagged as ice covered. A final test is done to further eliminate abnormal values that may not have been detected by cloud/ice screening. This is done by first applying a temporal homogeneity filter that compares SST with all other measurements made during a 15-day window centred on the image time. Then, a daily climatological filter is used to eliminate outliers above three standard deviations from the 25-year average. The use of a climatological filter has been shown to greatly improve the quality of SST retrievals for mid-latitude data leading to a mean bias of −0.19°C (Pettigrew, Larouche, & Gilbert, Citation2011).
Regions of interest for this study () were extracted from the daily national composites and processed for front detection. Before processing images with the front detection algorithm, land was masked using the National Oceanic and Atmospheric Administration's (NOAA) Global Self-consistent, Hierarchical, High-resolution Geography (GSHHG) database (Wessel & Smith, Citation1996) so that only water pixels were processed. When more than 85% of the water pixels of a daily image are flagged as cloud, ice, or an invalid pixel, the image is discarded and so not used in further analysis. Because the goal was to study coastal fronts, we used the variable window single-image edge-detection (VW-SIED) algorithm (Diehl, Budd, Ullman, & Cayula, Citation2002). This algorithm is an improvement over SIED (Cayula & Cornillon, Citation1992) that uses a fixed overlapping window size for edge detection. The advantage of VW-SIED is that the variable window size offers better detection of smaller scale fronts (Kahru, Di Lorenzo, Manzano-Sarabia, & Mitchell, Citation2012) and is thus better suited to the study of coastal regions. The algorithm exploits the idea that for a frontal region, SST pixel values over a specific window should follow a bi-modal distribution (many warm and cold pixels with a few pixels in the temperature transition range). Fronts generally correspond to this transition zone called the edge. To detect fronts, each daily SST image is split into overlapping windows of variable size for which SST distributions are calculated and edges flagged. The VW-SIED algorithm optimizes window size using semi-variance statistics, and the overlap is always half the size of neighbouring windows. When all of the image is processed, individually detected edges that may be disconnected are linked to each other with a contour-following algorithm (see Cayula & Cornillon, Citation1992). After VW-SIED algorithm processing, our dataset corresponds to daily images indicating front/no front pixels with flagged pixels corresponding to ice or cloud. After front detection, statistics are calculated using all available images (number of days × 25 years) to generate a frontal frequency index for each pixel defined as:(1)
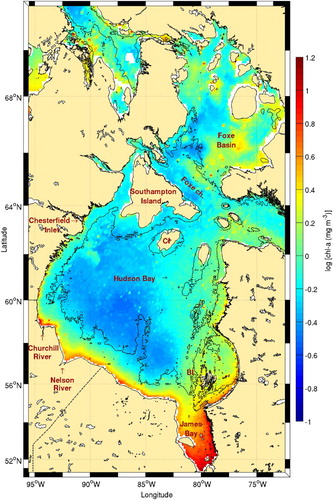
Maps of phytoplankton biomass revealed by chlorophyll (chl-a) concentration are also presented in this study. This information was obtained through the Giovanni web portal (http://disc.sci.gsfc.nasa.gov/giovanni) that provides an interactive tool to extract satellite-derived chl-a. We used that tool to estimate a climatology of chl-a using the global time series from the Sea-Viewing Wide Field-of-View Sensor (SeaWIFS) (1998–2010). Unless otherwise stated, information about bird colony locations was gathered from the Important Bird Areas in Canada (www.ibacanada.ca) and from the Canadian Wildlife Service (Citation2012). Finally, bathymetric features were obtained from the 30 arc-second intervals of the General Bathymetric Chart of the Oceans (GEBCO_08 Grid, version 20100927, http://www.gebco.net).
3 Observations and discussion
a Hudson Strait and Labrador Shelf
Hudson Strait, including Ungava Bay (), is a region under the influence of freshwater runoff from Hudson Bay and the high salinity waters of the Labrador Sea (Drinkwater, Citation1986). This region is known for strong tidal currents and high elevation due to near-resonant frequency that enters the strait from the Labrador Sea. Oceanic fronts are thus likely to occur in this region as a result of water mass interaction and tidal mixing. Since the pioneering work of Griffiths, Pingree, and Sinclair (Citation1981) who mapped tidal fronts from a numerical study of the Simpson-Hunter parameter (Simpson & Hunter, Citation1974), very little field work (e.g., Drinkwater & Jones, Citation1987; Taggart et al., Citation1989) has been conducted to confirm the existence of these fronts.
Fig. 2 Mean frontal frequency (1986–2010) for Hudson Strait, Ungava Bay, and the northern Labrador Shelf. Isobaths at 50, 200, and 1000 m are shown. The locations of Cape Dorset (CD), Salisbury (SI), Nottingham (NI), Big (BI), Resolution (RI), and Akpatok (AI) islands, and Seven Islands Bay (SIB) are shown. The red line near Akpatok Island corresponds to the cross-front transect described in Taggart, Drinkwater, Frank, McRuer, and Larouche (Citation1989).
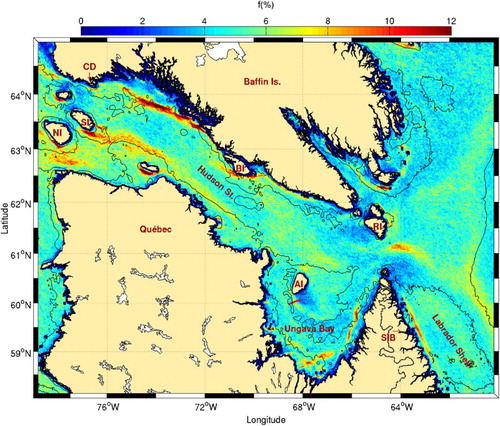
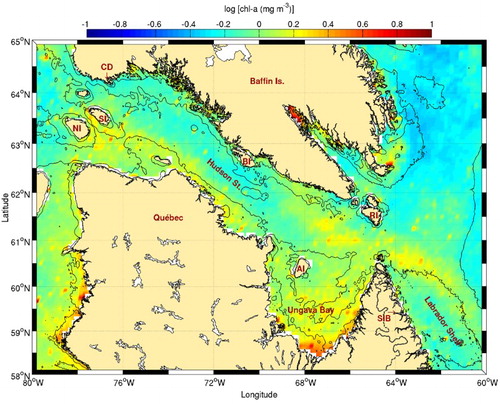
Some of the locations where high frontal frequencies are observed corroborate predictions of Griffiths et al. (Citation1981) in western Hudson Strait (; frontal activity near Nottingham, Salisbury, and Charles islands). These areas are known biological hotspots where higher phytoplankton biomass is observed () and where large bird colonies are found. Besides these areas, our analysis also shows other regions with high frontal frequencies. One of the most important frontal region detected spans about 350 km on the southern shore of Baffin Island, from west of Big Island to near Cape Dorset. Its existence is likely not linked to tidal mixing because the Simpson-Hunter parameter indicates a stratified region (Drinkwater & Jones, Citation1987; Griffiths et al., Citation1981). Because it follows the 200 m isobath, it may be the result of the cold Baffin Island current that enters the strait from the east and flows along the south edge of Baffin Island (Drinkwater, Citation1986; Straneo & Saucier, Citation2008). Another front is visible on the opposite side of the strait, again following the 200 m isobath, and may correspond to the northern edge of the Hudson Bay outflow. Field observations of Hudson Strait inflow and outflow along a transect offshore of Big Island revealed that these are trapped within a distance of about 40 km from each coast (Straneo & Saucier, Citation2008). This distance roughly corresponds to the width of the sloping topography between the coast and a little offshore of the 200 m isobath. Although the frontal region along Baffin Island does not appear to be linked to increased chl-a concentration, the region along the Quebec coast does (). This may result from the different nature of both currents. While the inflow current on the north side of the channel is mostly barotropic and weakly stratified, the outflow is strongly baroclinic, with maximum velocity in approximately the upper 100 m (Straneo & Saucier, Citation2008). The latter also carries nutrient-enriched water as the result of strong tidal mixing that occurs in the strait (Drinkwater & Harding, Citation2001).
Fig. 3 Chl-a concentration climatology (1998–2010) for Hudson Strait, Ungava Bay, and the northern Labrador Shelf. The 50, 200, and 1000 m isobaths are shown. See for acronyms.
At the eastern entrance to the strait, the most active tidal mixing area is located off the southern tip of Resolution Island. Our results show that fronts are more frequent a little southeast of the island tip. Advection may be responsible for the displacement of the surface signature of these fronts in the direction of the outflow, since the study of Griffiths et al. (Citation1981) does not take into account the stabilizing effect of runoff into their tidal mixing model (Drinkwater & Jones, Citation1987; Garrett, Keeley, & Greenberg, Citation1978; Sutcliffe, Loucks, Drinkwater, & Coote, Citation1983). The entire region of eastern Hudson Strait is characterized by higher chl-a concentration with no obvious relation to the presence of that front.
In Ungava Bay, our analysis showed that the more frequent fronts are located along the southern and eastern coasts. The presence of rivers emptying large amounts of freshwater into this area (approximately , seen as high chl-a concentrations on ) is probably responsible for the generation of the observed fronts. One of the fronts predicted by Griffiths et al. (Citation1981) in Ungava Bay has already been confirmed by direct sampling (Taggart et al., Citation1989; red line in ). Our study shows that this front is likely small and less frequent compared with the other fronts present in Ungava Bay. Despite this, it is of high biological significance as indicated by the presence of a large thick-billed mure colony on Akpatok Island.
Along the Labrador Shelf, a straight and sharp front appears close to the coast southeast of the mouth of Hudson Strait. This front is likely the transition between coastal waters and Labrador Shelf waters that flow on the shelf after their formation in eastern Hudson Strait. The latter is a nutrient-rich mixture formed from Hudson Bay freshwater outflow, Baffin Island Current, and West Greenland Current waters (Drinkwater & Harding, Citation2001; Dunbar, Citation1951; Sutcliffe et al., Citation1983). Despite its persistence, this front does not appear to be directly linked to high chl-a. The region of the northern Labrador shelf is, however, reputed to sustain high primary production throughout the summer (Drinkwater & Harding, Citation2001), and a bird colony can be found at Seven Island Bay, close to that area.
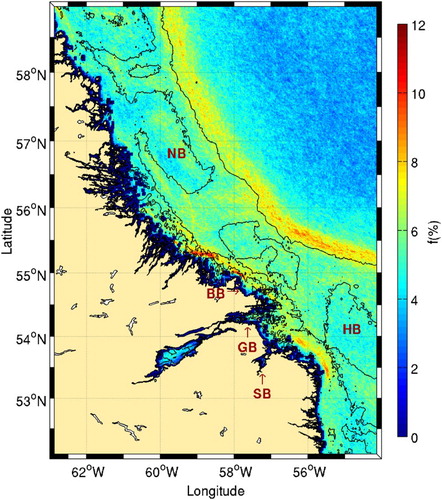
Further south, the most frequent frontal activity on the inner shelf occurs near the mouth of Byron, Groswater, and Sandwich bays (). The presence of these fronts might be related to the inshore branch of the Labrador Current that flows shoreward of Hamilton and Nain banks and recirculates around them (Chapman & Beardsley, Citation1989; Colbourne, DeYoung, Narayanan, & Helbig, Citation1997; Wu, Tang, & Hannah, Citation2012). This likely causes a transition in temperature properties between the current and the coastal waters coming from the many fjords and bays in this area. Many important bird areas are located in this vicinity.
Fig. 4 Mean frontal frequency (1986–2010) for the southern Labrador Shelf. The 50, 200, and 1000 m isobaths are shown. Locations of Nain (NB) and Hamilton (HB) banks and Byron (BB), Groswater (GB) and Sandwich (SB) bays are shown.
At the shelf break, a persistent front is present offshore of the 1000 m isobath ( and ). This front was briefly identified by Belkin et al. (Citation2009) using 9 km pixel resolution and is associated with the main branch of the Labrador Current. The high frequency of this front is a signature of the stability of the Labrador Current. The separation between this front and the inner branch of the Labrador Current described above consists of more complex flow patterns over the several banks in this area (Drinkwater & Harding, Citation2001; Fissel & Lemon, Citation1991).
b Newfoundland Shelf
Offshore circulation on the northern Newfoundland Shelf is a continuation of that on the Labrador Shelf resulting in a large occurrence of fronts along the 200 m isobath. Inshore, high frontal probability is found on the north shore of Newfoundland (), off the Northern Peninsula near the Strait of Belle Isle. This front likely marks the limit between inner Labrador Current (LC) inflow into the Strait of Belle Isle and the outflow from the Gulf of St. Lawrence. Other locations with high frontal probabilities are located off different bays (Notre Dame, Bonavista, Trinity, and Conception). Those are probably the result of onshore excursions of the inner branch of the cold LC flowing close to shore, contrasting with warmer coastal waters in these bays during ice-free months. This area is characterized by relatively high chl-a concentration near the shore () and the presence of large colonies of eiders, common mures, storm petrels, and spawning sites of capelin (Davoren, Citation2007).
Fig. 5 Mean frontal frequency (1986–2010) for the Newfoundland Shelf. The 100 and 1000 m isobaths are shown. Locations of the Strait of Belle Isle, the Northern and Avalon peninsulas, the Gulf of St. Lawrence, Laurentian, Avalon, and Halibut channels, St. Pierre Bank, Grand and Green (GB) banks, Saint-Pierre et Miquelon islands (SPM) along with Notre Dame (NDB), Bonavista (BB), Trinity (TB), and Conception (CB) bays are shown.
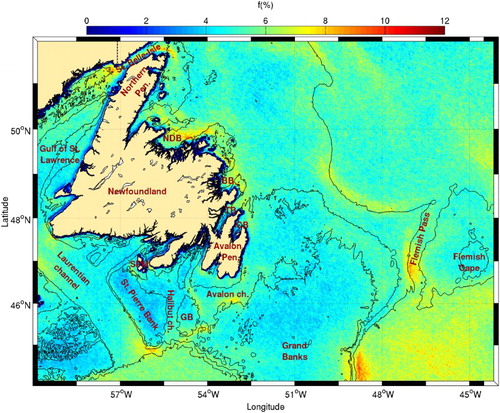
Fig. 6 Chl-a concentration climatology (1998–2010) for the inner Newfoundland Shelf. The 100 and 1000 m isobaths are shown. See for acronyms.
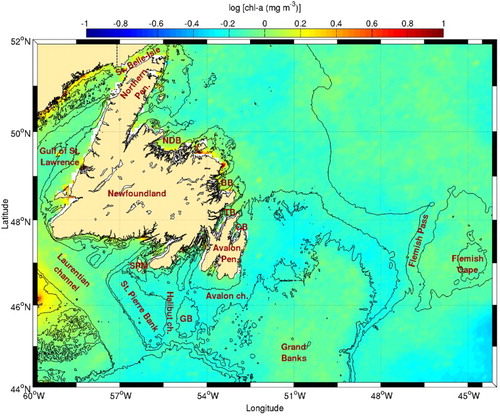
On the southern shore of Newfoundland there is a very high frequency of fronts (∼8%) on the eastern side of the mouth of Laurentian Channel (). A recent numerical study (Wu et al., Citation2012) reports that the LC extension that flows around the Avalon Peninsula also splits in two branches, one flowing west following the southern coast of Newfoundland and the other, not previously reported in literature, flowing south into Halibut Channel to the mouth of the Laurentian Channel. The large number of fronts detected in this area may be a result of the confluence of LC water flowing through Halibut Channel with the LC flowing along the Grand Banks towards the west and the outflow from the Gulf of St. Lawrence. Despite the large number of fronts, this area does not appear to be characterized by a large concentration of chl-a ().
Other high frontal probabilities are found south and west of Green Bank and on the southern side of the Avalon Channel. These can also be the result of local small-scale circulation not well established in the literature. Fronts with lower probabilities are also found in shallower areas close to the shore, south of the Avalon Peninsula and southwest of Saint-Pierre et Miquelon islands. The very low frontal probability over St. Pierre Bank and the Grand Banks may indicate high tidal mixing over these shallower areas. This important mixing can contribute to the enhancement of the surface temperature contrast between the banks and the surrounding areas.
Another area where a large occurrence of fronts has been detected is along the continental shelf from east of the Grand Banks to Flemish Cap. This is an area of intense current convergence between the North Atlantic Current (NAC) and the LC generating the observed fronts (a complete description of the frontal zone near Flemish Cap can be found in Stein (Citation2007)). Strong frontal activity is also present in the southern part of Flemish Pass, possibly because part of the Gulf Stream/NAC sometimes enters the pass from the south and meets the LC (e.g., Gil, Sánchez, Cerviño, & Garabana, Citation2004). These areas of frontal activity are all characterized by higher chl-a contents than the oceanic region ().
c Scotian Shelf and Gulf of Maine area
Many areas with high frontal probabilities are located along the southwest tip of Nova Scotia, Grand Manan Island, and the upper reaches of the Bay of Fundy (), confirming previous observations that also showed these fronts to have a strong seasonal variability (Ullman & Cornillon, Citation1999). In this area, Garrett et al. (Citation1978) and Loder and Greenberg (Citation1986) highlighted regions where tidal mixing is sufficiently strong to sustain well-mixed water even in summer when the heat flux from the atmosphere is high. These regions all have nearby high frontal probabilities in the transition zone between the well-mixed (usually low probabilities) and stratified areas. In addition to tidal mixing, Tee, Smith, and Lefaivre (Citation1993) suggested that topographic upwelling can also generate fronts at the southwest tip of Nova Scotia, off Cape Sable. All regions mentioned above are reputed to be fish feeding and spawning areas (Sinclair & Iles, Citation1985). High frontal probabilities are also observed around Browns and Georges banks, known for their enhanced tidal mixing and upwelling (e.g., Hannah, Shore, Loder, & Naimie, Citation2001; Mavor & Bisagni, Citation2001; Tee et al., Citation1993). This is consistent with the higher chl-a concentrations observed in these regions where tidal mixing occurs (). Another high frontal probability area is located at the mouth of the Northeast Channel. These fronts are not associated with higher chl-a concentrations and are likely due to convergent water masses, where the southwestward flow along the shelf edge enters the channel and meets the northwestward moving slope water (Hannah et al., Citation2001).
Fig. 7 Mean frontal frequency (1986–2010) for the Scotian Shelf, Gulf of Maine, and Bay of Fundy. The 50, 100, 200, and 1000 m isobaths are shown. Location of the Northeast Channel, Cape Canso (CC), Cape Sable (CS), the Gully, Sable (SI), and Grand Manan (GMI) islands, Lehave (LB) and Emerald (EB) basins, and Browns (BB) and Georges (GB) banks are shown.
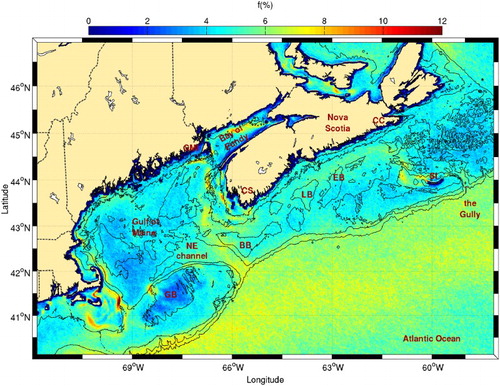
Fig. 8 Chl-a concentration climatology (1998–2010) for the Scotian Shelf and the Gulf of Maine. The 50, 100, 200, and 1000 m isobaths are shown. See for acronyms.
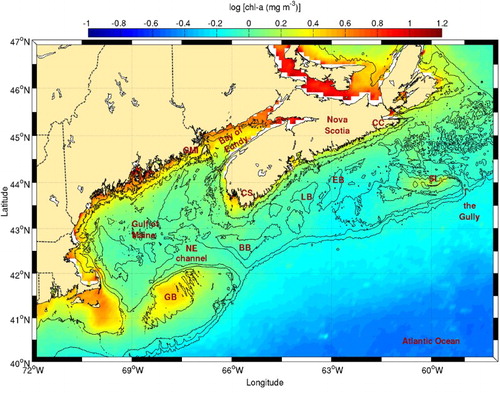
On the Scotian Shelf, the highest frontal probability occurs around Sable Island bank, probably as a result of tidal mixing combined with the anticyclonic gyre that exists around the bank (Hannah et al., Citation2001). Although less frequent, another frontal area corresponds to the location of the inner shelf current, shoreward of Lahave and Emerald basins. This feature appears to be connected to the Sable Island Bank frontal region. This observation supports the presence of a cross-shelf current off Cape Canso that was recently detected in a numerical study by Wu et al. (Citation2012). Finally, some frontal activity is also visible in the Gully, possibly because of the northward excursion of the slope current in this gap on the shelf break (Hannah et al., Citation2001). Of all these areas, only the fronts near the southwest tip of Nova Scotia, at the Sable Island Bank and along the cross-shelf front appear associated with higher chl-a content (). This suggests that these fronts are related to tidal mixing while the others (e.g., the Gully and off Cape Canso) are related to current convergence.
d Gulf of St. Lawrence
For convenience and in line with many regional studies (e.g., Bugden, Citation1981; Cyr, Bourgault, & Galbraith, Citation2011; Galbraith, Citation2006; Gilbert & Pettigrew, Citation1997), the Lower St. Lawrence Estuary (LSLE) is considered here to be part of the Gulf of St. Lawrence. Fronts and mesoscale dynamics are reputed to be frequent features in the gulf as a result of high buoyancy input from several rivers, combined with the importance of Coriolis effects in this large system (Ingram & El-Sabh, Citation1990; Koutitonsky & Bugden, Citation1991). Such processes are thought to greatly influence biological production and development and the behaviour of species at different life stages (e.g., Demers, Legendre, & Therriault, Citation1986; Le Fouest, Zakardjian, & Saucier, Citation2005; Legendre & Demers, Citation1984; Legendre, Demers, Therriault, & Boudreau, Citation1985). Meso-scale thermal fronts are also thought to be good proxies for food availability for whales and thus closely related to their dynamical habitat (Doniol-Valcroze, Berteaux, Larouche, & Sears, Citation2007).
The highest probabilities of frontal structures in the Gulf of St. Lawrence () appear in regions with a low Simpson-Hunter parameter (i.e., where tidal mixing is likely at work; Lu, Thompson, & Wright, Citation2001, see their ). These regions include the Strait of Belle Isle, western area of Détroit de Jacques Cartier, the northeastern tip of Nova Scotia, the mouth of Chaleur Bay, several spots in Northumberland Strait and, to a lesser extent, both tips of Îles de la Madeleine. High frontal activity is also present along the north shore of the Gulf of St. Lawrence and on the south shore of Anticosti Island. For these locations, fronts are likely the result of frequent upwelling due to dominant northwestern winds (Lacroix, Citation1987). The region of high frontal probability at the southern entrance to the Strait of Belle Isle is probably the result of the convergence between LC water entering the Gulf of St. Lawrence from this strait and the West Newfoundland Current (recently identified in Bourgault, Cyr, Dumont, & Carter, Citation2014) that flows along the western coast of Newfoundland.
Fig. 9 Mean frontal frequency (1986–2010) for the Gulf of St. Lawrence. The 50 and 300 m isobaths are shown.
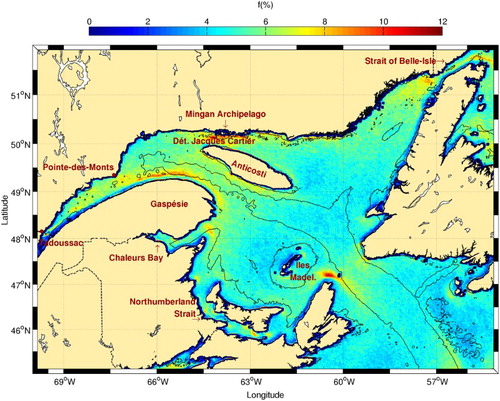
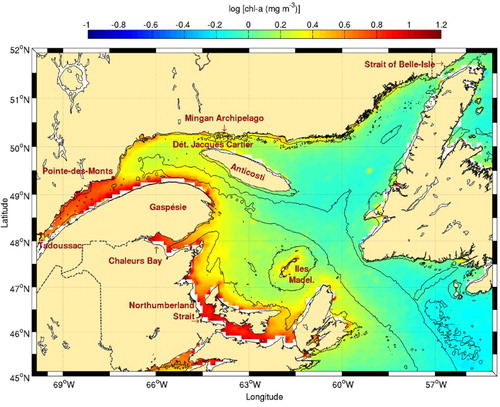
Fig. 10 Chl-a concentration climatology (1998–2010) for the Gulf of St. Lawrence. The 50 and 300 m isobaths are shown.
Another prominent frontal structure visible in corresponds to the separation between the Gaspé Current, that flows on the northern tip of Gaspésie peninsula, and the Anticosti Gyre, a cyclonic cell located north of the peninsula and west of Anticosti Island. Frontal activity is also visible in the transition zone between the LSLE and the Gulf of St. Lawrence near Pointe-des-Monts, where a southward flow separates both sub-regions and participates in channel-wide anticyclonic eddies that evolve on a synoptic time scale (Koutitonsky & Bugden, Citation1991; Larouche, Koutitonsky, Chanut, & El-Sabh, Citation1987). Relatively high frontal probabilities are seen throughout the St. Lawrence estuary region. These result from large-scale internal circulation features including cross-estuary currents and gyres (El-Sabh, Citation1979; Ingram & El-Sabh, Citation1990; Larouche et al., Citation1987) and freshwater plumes extending from the estuary's north shore rivers.
Finally, although not shown in Lu et al. (Citation2001), the front present at the head of the Laurentian Channel near Tadoussac is due to active tidal mixing that occurs on a sill that marks the upstream limit of the LSLE. The relatively cold water that results from this enhanced vertical mixing is a well-known feature of the St. Lawrence (e.g., Gratton, Mertz, & Gagné, Citation1988; Ingram, Citation1976, Citation1979, Citation1983). A “cold anomaly,” as it was referred to in Gratton et al. (Citation1988), can also emanate from this sill and travel up to 100 km on the south shore of the LSLE, but the sporadic nature of such a phenomenon makes it hard to detect from our 25-year time-series. In winter (not shown here) the head of the Laurentian Channel is sometimes referred to as the Tadoussac polynya because its water rarely freezes during the cold season as a result of upwelling water above the freezing point.
Some of the frontal features presented above are associated with higher chl-a concentrations (). This is the case for Îles de la Madeleine, the northeastern tip of Nova Scotia, and to a lesser extent Jacques-Cartier Strait and the southern Anticosti coast. Jacques-Cartier Strait is known to support a community of marine mammals (Doniol-Valcroze et al., Citation2007; Kingsley & Reeves, Citation1998) and is located close to the Mingan Islands archipelago known to host a wide variety of marine birds. Data for chl-a in the estuary, including the Gaspé current, extension are unreliable because of the high content of dissolved matter in this estuary (Nieke et al., Citation1997). In Northumberland Strait, chl-a data are contaminated by high concentrations of suspended matter (Ollerhead, Citation2005).
e Hudson Bay and Foxe Basin
Early thoughts from pioneering work on the Hudson Bay system (Hachey, Citation1931; Huntsman, Citation1932; Vladykov, Citation1933) suggested that the biological production of the region was generally low, driven in part by the short ice-free season and the highly stratified surface water (see also Bajkov, Citation1975). More recent work, however, suggests that the production is heterogeneous rather than weak, with higher phytoplankton and chl-a concentrations near the coasts and in Hudson Strait (e.g., Ferland, Gosselin, & Starr, Citation2011; Harvey, Therriault, & Simard, Citation1997, Citation2001; Lapoussière et al., Citation2013; Roff & Legendre, Citation1986). Small-scale mixing processes, such as tidal mixing, upwelling, and river plumes, may thus contribute significantly to the primary production of Hudson Bay. These mixing processes are often accompanied by thermal front signatures.
The frequency of fronts in the Hudson Bay system is presented in . The highest activity is nearly always in the proximity of topographic features, with very low frontal probability in the central part of the bay where the water column is deeper than 100 m. Belkin et al. (Citation2009) only detected four major fronts in Hudson Bay: in northern Hudson Bay, east of the Belcher Islands, in southern James Bay, and in southwest Hudson Bay (see Fig. 63 in their supplementary material). Our results confirm the presence of these fronts, but the use of higher resolution SST imagery better highlights the complexity of the frontal patterns.
Fig. 11 Mean frontal frequency (1986–2010) for Hudson Bay. The 100 m isobath is shown. Belcher and Coat islands are identified with the acronyms BI and CI, respectively.
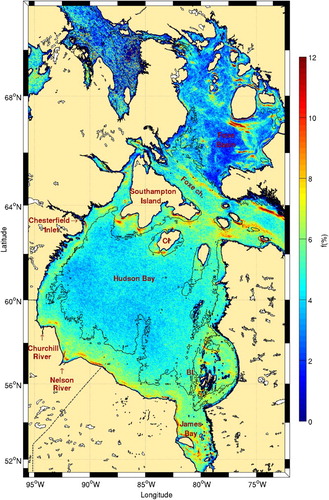
Tidal amplitudes are small in the centre of the bay, increasing to 1.25 m on the western shore. The southeastern portion of the bay is also characterized by small tidal amplitudes (<0.25 m; Prinsenberg & Freeman, Citation1986). Tidal mixing is thus expected mostly along the western coasts. The position of tidal mixing fronts predicted by Griffiths et al. (Citation1981) and verified by Drinkwater and Jones (Citation1987) generally agree with our observations for the southern tips of Southampton and Coats islands and for the southern part of Hudson Bay and James Bay.
The frontal pattern around the Belcher Islands () allows us to hypothesize that vertical mixing is also important in this area. This is supported by the recent study of Galbraith and Larouche (Citation2011) showing that this area has the second coldest surface water in the Hudson Bay system. Since no fronts were predicted by Griffiths et al. (Citation1981) near these islands because the tidal amplitude is lower than elsewhere on the coast (an amphidromic point is present north of the islands), it is not clear whether this colder water is the result of tidal or wind mixing.
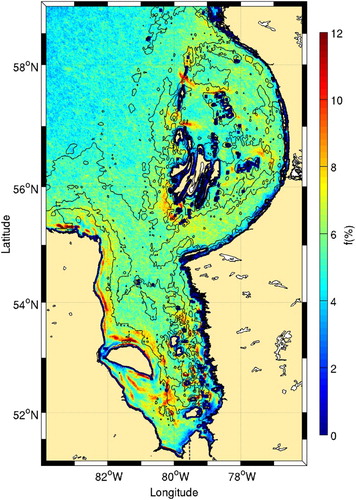
Fig. 12 Details of Belcher Islands and James Bay from . The 25, 50, and 100 m isobaths are shown.
The Belcher Islands region and its surroundings have been reported to have some of the highest biological activity in the Hudson Bay system (Anderson & Roff, Citation1980; Anderson, Roff, & Gerrath, Citation1981; Harvey et al., Citation1997; Roff & Legendre, Citation1986). Indeed, higher chl-a levels around the Belcher Islands are consistent with the location of high frontal frequencies (). Many of these frontal areas are also associated with the presence of marine birds.
Fig. 13 Chl-a concentration climatology (1998–2010) for Hudson Bay. The 100 m isobath is shown. The Belcher and Coat islands are identified with the acronyms BI and CI, respectively.
James Bay also has high frontal probabilities. In contrast to the Belcher Islands, James Bay, is the warmest part of Hudson Bay, on average (Galbraith & Larouche, Citation2011). Together with tidal mixing, river runoff can also explain the high frontal frequency observed in James Bay. Contamination by dissolved matter prevents accurate measurement of chl-a in James Bay.
The long front present onshore of the 100 m isobath in western Hudson Bay (, south of Chesterfield Inlet) may have a different origin than tidal mixing because the front is detached from the coast. Galbraith and Larouche (Citation2011) reported this onshore region to be colder than the offshore region, creating a persistent thermal front. They hypothesized that this is at least partly due to the advection of cold water from northeastern Hudson Bay. What resembles a plume from Chesterfield Inlet also creates a very persistent front that is entrained by the general cyclonic circulation of Hudson Bay. Besides water advection from the north, wind-driven upwelling may also be responsible for the increased presence of fronts along the western coast because winds often blow from the southwest. The fact that there is almost no increase in chl-a along that coast indicates that either the upwelling process is not sufficiently intense or that the water brought to the surface is low in nutrient content (). Fronts observed along the southern coast of Hudson Bay are associated with freshwater plumes from the Churchill and Nelson rivers with fresh water lying along the coast as it moves cyclonically towards the east.
West of Hudson Strait, a long front stretches along the 100 m isobath and marks the division between the shallow Foxe Basin and the deeper Foxe Channel. In Foxe Basin (), persistent fronts coexist with regions of very low frontal probabilities (deep blue patch northeast of Foxe Peninsula). Front positions north of Prince Charles Island generally agree with the study of Griffiths et al. (Citation1981). Although no fronts were predicted by these authors between this island and Foxe Peninsula, our observations show that the strongest fronts in Foxe Basin are located in this area, over a submarine canyon of depth >50 m. This large front corresponds to a region of westward current intensification that is part of a cyclonic cell spaning most of southern Foxe Basin (Defossez, Saucier, Myers, Caya, & Dumais, Citation2012, their ). The discrepancy between observed and predicted front locations found by Griffiths et al. (Citation1981) may also come from the poor bathymetry used by these authors.
Fig. 14 Details of Foxe Basin from . The 25, 50, and 100 m isobaths are shown.
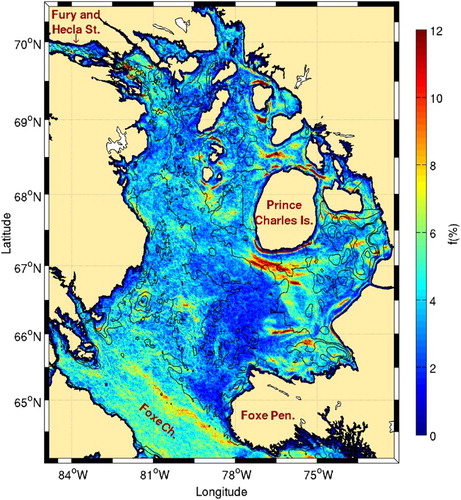
Foxe Basin, except in the northwest, is generally thought to have a well-mixed water column and very low biological activity because no nutrient-rich deep water is available to replenish the surface layer (Sibert et al., Citation2011; Smith et al., Citation1985). In the northwest, higher biological production is sustained by nutrient-rich water that flows through Fury and Hecla Strait. The numerous and persistent fronts in the eastern part of the basin probably originate from tidal mixing as indicated by the near-freezing surface water observed in that area during the warmest week of the year (Galbraith & Larouche, Citation2011). Satellite chl-a data shows a large patch of higher phytoplankton biomass located in southeastern Foxe Basin () in the area where there is an increased frontal presence. This indicates that nutrient replenishment is possible, probably through the presence of the deeper canyons. The discrepancy with numerical model results (Sibert et al., Citation2011), which show almost no phytoplankton biomass in that area, probably results from insufficient spatial resolution of the model (10 km). Considering the relatively low phytoplankton biomass generally observed in Foxe Basin, this area may well be a local biological hot spot as indicated by the large colonies of marine birds on Prince Charles Island and the adjacent coast of Baffin Island. This area is also known to be important for various marine mammals.
f Baffin Bay
Baffin Bay is a large abyssal plain connected to the Arctic Ocean through Smith, Jones, and Lancaster sounds and to the Atlantic Ocean through Davis Strait. Very few studies discuss the presence of fronts in Baffin Bay. Its remoteness and the presence of ice for most of the year are factors explaining this lack of information. Muench (Citation1990) discussed the presence of fronts east and west of Greenland, but the study was limited to the Labrador Sea, without entering Baffin Bay. He noted, however, the importance of fronts for vertical and horizontal fluxes of dissolved material such as nutrients. He also noted that frontal systems in polar seas often coincide with the marginal ice zone.
shows the frequency of fronts for Baffin Bay. The area with the highest frontal frequency is located in Melville Bay. This front was identified by Belkin et al. (Citation2009) but without indication of its much higher frontal probability compared with the rest of the western Greenland large marine ecosystem (see in their supplementary material). According to Belkin et al. (Citation2009), the Melville Bay front is part of the Mid-Shelf Front (MSF) running along the west Greenland coast. Our results show that the MSF is not well detected by the variable-window approach, probably as a consequence of its small surface temperature gradients. Only some areas closer to the coast near topographic features, such as islands and fjords, show higher frontal probabilities. A succession of calving glaciers along more than 400 km of the coastline in this area (e.g., Van As, Citation2011) may modify water properties and partly explain the frontal characteristics observed near the coast. This area along the west Greenland coast is characterized by relatively high chl-a concentrations up to 74°N ().
Fig. 15 Mean frontal frequency (1986–2010), for Baffin Bay. The 500 and 1000 m isobaths are shown. The locations of the Carey Islands (CI), Nares and Davis straits, and Smith (SS), Jones (JS), and Lancaster (LS) sounds are shown.
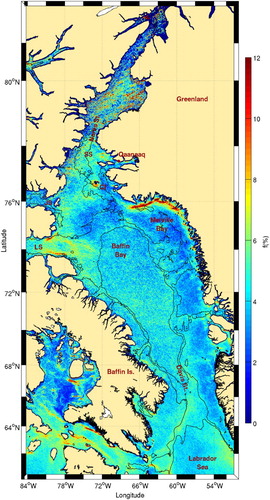
Fig. 16 Chl-a concentration climatology (1998–2010) for Baffin Bay. The 500 and 1000 m isobaths are shown. See for acronyms.
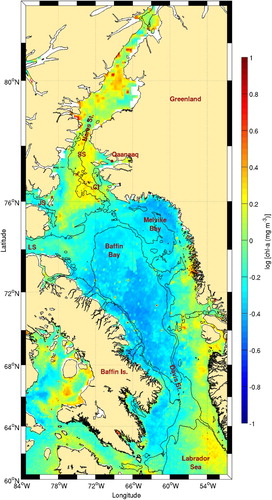
Quite surprisingly, even though Melville Bay has been a well-known area for whales to concentrate since the mid-nineteenth century, it does not have high chl-a concentrations. This indicates that the Melville Bay fronts do not generate nutrient replenishment of the surface layer. It is probable that the nature of these fronts is more related to surface density gradients generated by the many glaciers in the area than to upwelling processes. Very few oceanographic measurements were made in this area, but there are some indications that surface coastal waters of Melville Bay are fresher than further offshore, generating an important baroclinic density front that also has a surface temperature signature (Lobb, Weaver, Carmack, & Ingram, Citation2003; Valeur, Hansen, Hansen, Rasmussen, & Thingvad, Citation1996).
Further offshore, there is a higher frontal frequency located above the 1000 m isobath, corresponding to the West Greenland Current Front (WGCF; Belkin et al., Citation2009). Some onshore excursions that coincide with the presence of cross-shelf channels are also observed. On the western side of Baffin Bay, the highest frontal frequencies are located at the mouth of Lancaster Sound. High frontal probabilities are found on both sides of the sound above the 500 m isobath. Direct observations (current meters) and tracked icebergs and drifters (de Lange Boom, Macneill, & Buckley, Citation1982; Fissel, Lemon, & Birch, Citation1982; Marko, Birch, & Wilson, Citation1982) have shown that the southward Arctic flow from Smith and Jones sounds makes significant excursions into eastern Lancaster Sound. The frontal structure of this current has already been observed in conductivity-temperature-depth transects (Fissel et al., Citation1982). Numerical simulations suggest that the inflow (mostly a barotropic advection of salty waters from the Baffin Current) enters the sound from its northern side and recirculates cyclonically in the eastern part before exiting on the southern side, where the outflow (strongly baroclinic with maximum current velocity over the upper 100 m) also carries fresher runoff from the sound (Wang, Myers, Hu, & Bush, Citation2012).
The high frontal probabilities observed off the mouth of Lancaster Sound do not have a clear generation mechanism. Very few measurements are available from that area, but the study of Fissel et al. (Citation1982) indicates that the area is characterized by small and variable currents. This is confirmed by results from numerical experiments (Wang et al., Citation2012). This area is, however, associated with higher levels of chl-a () suggesting the presence of a sustained phytoplankton biomass possibly through a nutrient-regeneration mechanism. The entire area near the entrance to Lancaster Sound is also known as a hot spot for marine birds (Wong, Gjerdrum, Morgan, & Mallory, Citation2014) and marine mammals (Davis & Koski, Citation1980; Davis, Richardson, Johnson, & Renaud, Citation1978).
Along the 1000 m isobath on the west side of the Baffin Bay, the front that could be expected because of the presence of the southward flowing Baffin Island Current (Tang et al., Citation2004; Wu et al., Citation2012) is not clearly visible until it passes Davis Strait. At this point, the current intensifies and meets the northernmost extension of the West Greenland Current, generating a long front, extending from Davis Strait to the mouth of Hudson Strait, above the 500 m isobath (Wu et al., Citation2012). The area where the two currents meet has been identified as a high primary production region (Tremblay et al., Citation2012).
Northern Baffin Bay is the host of the North Water (NOW) polynya, one of the largest and most biologically productive polynyas in the world (see Barber, Marsden, Minnett, Ingram, & Fortier, Citation2001; Deming, Fortier, & Fukuchi, Citation2002, and articles therein for an exhaustive study of the polynya). Ingram, Bâcle, Barber, Gratton, and Melling (Citation2002) defined the spatial extent of the polynya from Smith Sound, where constriction of ice in Nares Strait is responsible for the opening of the polynya (e.g., Dumont, Gratton, & Arbetter, Citation2009; Melling, Gratton, & Ingram, Citation2001) to 76°N, an arbitrary limit. The entire polynya area is characterized by high satellite-derived chl-a concentrations confirming the in situ measurements carried out during the NOW polynya project (Mei et al., Citation2002). Within the NOW polynya, some areas of high frontal probability were found near the Carey Islands, seaward of Jones Sound and southeast of Smith Sound near Qaanaaq. A very large colony of marine birds is located on Coburg Island at the entrance to Jones Sound.
g Northeast Pacific Ocean
Frontal probabilities for the northeast Pacific are presented in . An extensive study of thermal fronts in the Pacific Ocean and its marginal seas has already been published by Belkin and Cornillon (Citation2003). Major large-scale features highlighted in our study have thus already been described. To avoid redundancy, we will limit ourselves to new features found in our dataset that resulted from the higher resolution (1.1 km versus 9.28 km) and different algorithm (VW-SIED) used.
Fig. 17 Mean frontal frequency (1986–2010) for the northeastern Pacific Ocean. The 1000 m isobath (shelf break) is shown. Here, the states of Washington (WA), Oregon (OR), and California (CA) are also shown.
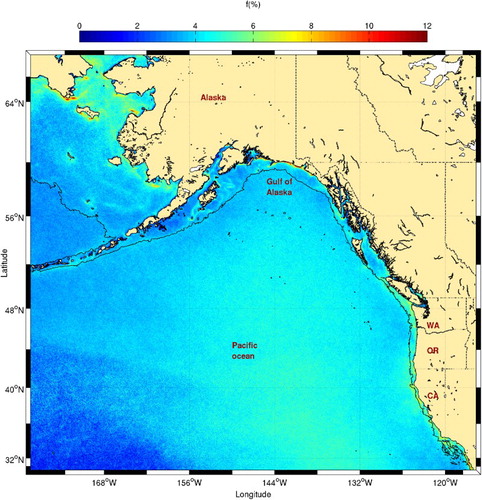
Possibly the most striking difference between our study and the Belkin and Cornillon (Citation2003) study is the relative absence of a distinct front for most of the open water (i.e., far from the coast; ). This difference illustrates how the spatial resolution and the algorithm used in our study affect front detection by selecting fronts where SST gradients are stronger and at a smaller scale.
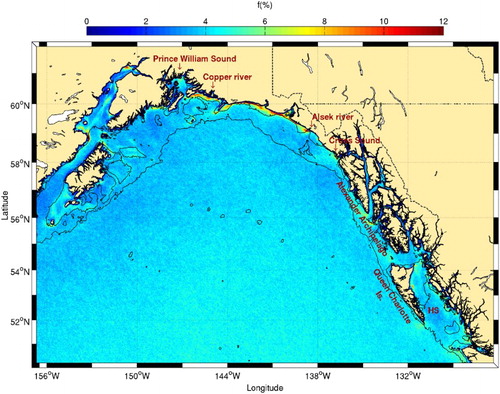
presents frontal probabilities for the Gulf of Alaska. A major oceanographic circulation feature of the Gulf of Alaska is the Alaska Current (see Reed and Shumacher (Citation1986) for an extensive review of the physical oceanography of the Gulf of Alaska). It is a wide current (∼400 km) that flows along the western Alaska coast from Queen Charlotte Islands to the head of the Gulf of Alaska (the northernmost part of the gulf). Although Belkin and Cornillon (Citation2003) found that the Self-Slope Front (SSF) is associated with this current, this front is not clearly visible in our 25-year high-resolution dataset (). It is possible that the meandering, seasonal evolution and the presence of eddies (Belkin & Cornillon, Citation2003; Crawford, Brickley, Peterson, & Thomas, Citation2005; Ueno et al., Citation2009; Whitney, Crawford, & Harrison, Citation2005) scatters the signal at 1.1 km resolution. The highest frontal probabilities are found in the northern Gulf of Alaska, between Cross and Prince William sounds and are more or less constrained between the coast and the 100 m isobath. Coastal runoff from the Copper and Alsek rivers and the presence of inlets, bays, and nearby glaciers and land-based ice fields may be partly responsible for these high frontal probabilities.
Fig. 18 Details of the Gulf of Alaska from . The 100 and 1000 m isobaths are shown. Hecate Strait is identified with the acronym HS.
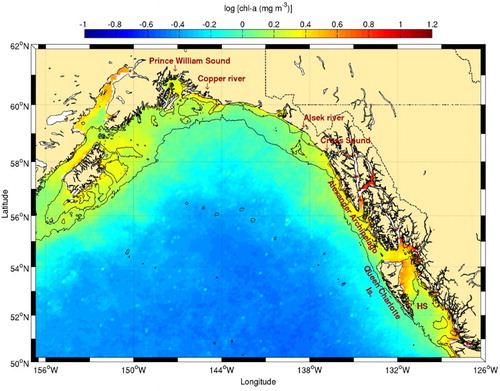
Climatological chl-a data show higher concentrations along the coast (), consistent with a previous study (Brickley & Thomas, Citation2004). There are, however, strong seasonal changes in chl-a that are not captured in this climatology because the reduction in downwelling-favourable winds in summer generally lowers the SST and increases chl-a concentrations along the coast (Waite & Mueter, Citation2013). Both SST and chl-a variables have been found to be related, although high chl-a concentration measurements may also be influenced by high turbidity and freshwater in this area (Stabeno et al., Citation2004). Except along its western coast, the strong chl-a concentrations observed within the Alexander Archipelago are not associated with higher frontal probabilities. Further south, in Hecate Strait, high frontal probabilities are found along the northern Queen Charlotte Islands, consistent with those predicted by the Simpson-Hunter stratification parameter in this area (Perry et al., Citation1983). Tidal mixing over the shallow regions of the strait is the likely generation mechanism responsible for these fronts that are linked to high chl-a (), nutrient, and plankton concentrations (Perry et al., Citation1983). Humpback whales are also present in this area (Dalla Rosa, Ford, & Trites, Citation2012).
Fig. 19 Chl-a concentration climatology (1998–2010) for the Gulf of Alaska. The 100 and 1000 m isobaths are shown. Hecate Strait is identified with the acronym HS.
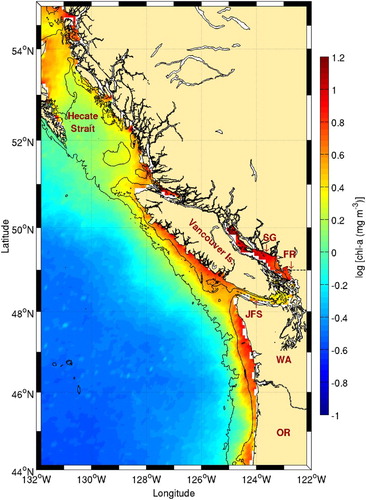
High frontal probabilities are also observed west of Vancouver Island (). These are probably driven by seasonal wind-driven upwelling (Freeland & Denman, Citation1982) and are associated with very high chl-a concentrations (). The highest frontal probabilities near Vancouver Island are, however, found at the entrance to Juan de Fuca Strait and in the Strait of Georgia. The former is the location of a seasonal eddy (Freeland & Denman, Citation1982) leading to cold surface waters. Strong tidal mixing in the strait also leads to enhanced nutrients in the surface layer. This area is known for the presence of birds, fish, and whales (Dalla Rosa et al., Citation2012; Healey, Thomson, & Morris, Citation1990; Vermeer, Butler, & Morgan, Citation1992), and a strong association was found between many seabird species and temperature gradients in the coastal zone along a transect extending off Juan de Fuca Strait (O'Hara, Morgan, & Sydeman, Citation2006). In the Strait of Georgia, the high frontal probability observed likely results from the strong freshwater outflow from the Fraser River (). The presence of large amounts of dissolved and suspended matter in that area makes comparison with climatological chl-a maps difficult. The high frontal probability observed along the Washington coast results from the presence of the California Current System. The coastal upwelling typical of southward flowing eastern boundary currents produces a strong thermal contrast between warm offshore and cold inshore waters creating a permanent front. This is a well-known oceanographic feature previously discussed in Belkin (Citation2002).
Fig. 20 Details of Vancouver Island and its surroundings from . The 100 and 1000 m isobaths are shown. The locations of Hecate Strait, the Strait of Georgia (SG), the Fraser River (FR), and Juan de Fuca Strait (JFS) are shown along with the states of Washington (WA) and Oregon (OR).

Fig. 21 Chl-a concentration climatology (1998–2010) around Vancouver Island. The 100 and 1000 m isobaths are shown. See for acronyms.
4 Conclusions
Using 25 years of satellite data, the results of this study show the location of fronts in Canadian coastal waters. Many of these fronts were detected for the first time because of the use of increased spatial resolution imagery combined with a variable window-size detection algorithm. The results show that many fronts are associated with increased biological activity (chl-a concentration). However, some very prominent fronts showed no signature on chl-a concentration images. This shows that the front-generation mechanism is important in determining the role of fronts on ecosystems. Because fronts generated by processes such as upwelling and tidal mixing inject nutrients in the surface layer, they may be more efficient than density-driven fronts in sustaining primary production and the upper trophic levels of the marine food chain.
The aim of this study was to provide a reference document which can be consulted in preparation for physical and biochemical studies in Canadian coastal waters, or to interpret results of previous campaigns using a broader perspective. Results of this study can also be used for validating numerical modelling studies. For example, many fronts described in this paper likely correspond to currents (e.g., in Halibut Channel and off Cape Canso) or gyres (e.g., in Foxe Basin) that were only identified in numerical results.
Finally, the datasets used in this study are enormous and can still be exploited. In particular, the 25-year time series can be used to study the temporal evolution of fronts in the context of environmental changes. Also, the daily images of fronts allow tracking of their seasonal evolution. These studies could be carried out on a broad scale (e.g., Canadian waters) or in specific subregions.
Acknowledgements
This work was made possible by a grant from the Canadian Space Agency and is a contribution to the scientific program of Québec-Océan and Fisheries and Oceans Canada. Thanks to Alexandre Livernoche, Jonathan Graveline, Guillaume Desbiens, Julien Laliberté, and Audrey Patry-Quintin for their help with data processing. We also acknowledge the helpful comments from Dr. Igor M. Belkin and an anonymous reviewer.
References
- Anderson, J. T., & Roff, J. C. (1980). Seston ecology of the surface waters of Hudson Bay. Canadian Journal of Fisheries and Aquatic Sciences, 37, 2242–2253. doi: 10.1139/f80-269
- Anderson, J. T., Roff, J. C., & Gerrath, T. (1981). The diatoms and dinoflagellates of Hudson Bay. Canadian Journal of Botany, 59, 1793–1810. doi: 10.1139/b81-240
- Bajkov, A. (1975). Is Hudson Bay a Desert Sea? Report 75–15, Manitoba Mines, Resources, Environmental Management, Research Branch.
- Barber, D., Marsden, R., Minnett, P., Ingram, R. G., & Fortier, L. (2001). Physical processes within the North Water (NOW) polynya. Atmosphere-Ocean, 39(3), 163–166. doi: 10.1080/07055900.2001.9649673
- Belkin, I. M. (2002). New challenge: Ocean fronts. Journal of Marine Systems, 37(2002), 1–2. doi: 10.1016/S0924-7963(02)00191-4
- Belkin, I. M., & Cornillon, P. (2003). SST fronts of the Pacific coastal and marginal seas. Pacific Oceanography, 1(2), 90–113.
- Belkin, I. M., Cornillon, P., & Ullman, D. (2001). Ocean fronts around Alaska from satellite SST data. In American Meteorological Society 7th Conference on the Polar Meteorology and Oceanography, Hyannis, MA, USA.
- Belkin, I. M., Cornillon, P. C., & Sherman, K. (2009). Fronts in large marine ecosystems. Progress in Oceanography, 81(1–4), 223–236. doi: 10.1016/j.pocean.2009.04.015
- Bisagni, J. J., Kim, H. S., & Chaudhuri, A. (2009). Interannual variability of the shelf-slope front position between 75° and 50°W. Journal of Marine Systems, 78(3), 337–350. doi: 10.1016/j.jmarsys.2008.11.020
- Bourgault, D., Cyr, F., Dumont, D., & Carter, A. (2014). Numerical simulations of the spread of floating passive tracer released at the Old Harry prospect. Environmental Research Letters, 9, 054001. doi:10.1088/1748–9326/9/5/054001
- Brickley, P. J., & Thomas, A. C. (2004). Satellite-measured seasonal and inter-annual chlorophyll variability in the Northeast Pacific and coastal Gulf of Alaska. Deep Sea Research Part II: Topical Studies in Oceanography, 51(1–3), 229–245. doi: 10.1016/j.dsr2.2003.06.003
- Bugden, G. L. (1981). Salt and heat budgets for the Gulf of St. Lawrence. Canadian Journal of Fisheries and Aquatic Sciences, 38(9), 1153–1167. doi: 10.1139/f81-155
- Canadian Wildlife Service. (2012). Important areas for birds in Nunavut, Environment Canada, Report CW66–302/2.
- Cayula, J. F., & Cornillon, P. C. (1992). Edge detection algorithm for SST images. Journal of Atmospheric and Oceanic Technology, 9, 67–80. doi: 10.1175/1520-0426(1992)009<0067:EDAFSI>2.0.CO;2
- Chapman, D. C., & Beardsley, R. C. (1989). On the origin of shelf water in the Middle Atlantic Bight. Journal of Physical Oceanography, 19(3), 384–391. doi: 10.1175/1520-0485(1989)019<0384:OTOOSW>2.0.CO;2
- Christie, P., & Sommerkorn, M. (2012). RACER: Rapid assessment of circum-arctic ecosystem resilience, 2nd ed. Ottawa, Canada: WWF Global Arctic Programme.
- Colbourne, E., DeYoung, B., Narayanan, S., & Helbig, J. (1997). Comparison of hydrography and circulation on the Newfoundland Shelf during 1990–1993 with the long-term mean. Canadian Journal of Fisheries and Aquatic Sciences, 54(S1), 68–80.
- Crawford, W. R., Brickley, P. J., Peterson, T. D., & Thomas, A. C. (2005). Impact of Haida Eddies on chlorophyll distribution in the eastern Gulf of Alaska. Deep Sea Research Part II: Topical Studies in Oceanography, 52(7–8), 975–989. doi: 10.1016/j.dsr2.2005.02.011
- Cyr, F., Bourgault, D., & Galbraith, P. S. (2011). Interior versus boundary mixing of a cold intermediate layer. Journal of Geophysical Research, 116(C12029), doi:10.1029/2011JC007359
- Dalla Rosa, L., Ford, J. K., & Trites, A. W. (2012). Distribution and relative abundance of humpback whales in relation to environmental variables in coastal British Columbia and adjacent waters. Continental Shelf Research, 36, 89–104. doi: 10.1016/j.csr.2012.01.017
- Davis, R. A., & Koski, W. R. (1980). Recent observations of the bowhead whale in the eastern Canadian High Arctic. In G. Donovan (Ed.), Thirtieth report of the International Whaling Commission (pp. 439–444). Cambridge: The International Whaling Commission.
- Davis, R. A., Richardson, J., Johnson, S. R., & Renaud, W. E. (1978). Status of the Lancaster Sound narwhal population in 1976. In Twenty-eighth report of the International Whaling Commission (pp. 205–215). Cambridge: The International Whaling Commission.
- Davoren, G. K. (2007). Effects of gill-net fishing on marine birds in a biological hotspot in the northwest Atlantic. Conservation Biology: The Journal of the Society for Conservation Biology, 21(4), 1032–1045. doi: 10.1111/j.1523-1739.2007.00694.x
- Defossez, M., Saucier, F. J., Myers, P., Caya, D., & Dumais, J. F. (2012). Comparing winter and summer simulated estuarine circulations in Foxe Basin, Canada. Atmosphere-Ocean, 50(3), 386–401. doi: 10.1080/07055900.2012.693256
- Demers, S., Legendre, L., & Therriault, J. C. (1986). Phytoplankton responses to vertical tidal mixing. In J. Bowman, M. Yentsch, & W. T. Peterson (Eds.), Tidal mixing and plankton dynamics (pp. 1–40). Berlin Heidelberg: Springer-Verlag.
- Deming, J. W., Fortier, L., & Fukuchi, M. (2002). The international North Water polynya study (NOW): A brief overview. Deep Sea Research Part II: Topical Studies in Oceanography, 49, 4887–4892. doi: 10.1016/S0967-0645(02)00168-6
- Diehl, S. F., Budd, J. W., Ullman, D., & Cayula, J. F. (2002). Geographic window sizes applied to remote sensing sea surface temperature front detection. Journal of Atmospheric and Oceanic Technology, 19, 1105–1113. doi: 10.1175/1520-0426(2002)019<1105:GWSATR>2.0.CO;2
- Doniol-Valcroze, T., Berteaux, D., Larouche, P., & Sears, R. (2007). Influence of thermal fronts on habitat selection by four rorqual whale species in the Gulf of St. Lawrence. Marine Ecology Progress Series, 335, 207–216. doi: 10.3354/meps335207
- Drinkwater, K. F. (1986). Physical oceanography of Hudson Strait and Ungava Bay. In I. P. Martini (Ed.), Canadian inland seas (vol. 44, chap. 13, pp. 237–264). New York: Elsevier.
- Drinkwater, K. F., & Harding, G. (2001). Effects of the Hudson Strait outflow on the biology of the Labrador Shelf. Canadian Journal of Fisheries and Aquatic Sciences, 58(1), 171–184. doi: 10.1139/f00-210
- Drinkwater, K. F., & Jones, E. (1987). Density stratification, nutrient and chlorophyll distributions in the Hudson Strait region during summer and their relation to tidal mixing. Continental Shelf Research, 7(6), 599–607. doi: 10.1016/0278-4343(87)90025-2
- Dumont, D., Gratton, Y., & Arbetter, T. E. (2009). Modeling the dynamics of the North Water polynya ice bridge. Journal of Physical Oceanography, 39(6), 1448–1461. doi: 10.1175/2008JPO3965.1
- Dunbar, M. J. (1951). Eastern Arctic waters, Tech. Rep. Bulletin No. 88, Fisheries Research Board of Canada, Ottawa.
- El-Sabh, M. I. (1979). The Lower St. Lawrence Estuary as a physical oceanographic system. Le Naturaliste Canadien, 106, 55–73.
- Ferland, J., Gosselin, M., & Starr, M. (2011). Environmental control of summer primary production in the Hudson Bay system: The role of stratification. Journal of Marine Systems, 88(3), 385–400. doi: 10.1016/j.jmarsys.2011.03.015
- Fissel, D. B., Lemon, D. D., & Birch, J. R. (1982). Major features of the summer near-surface circulation of western Baffin Bay, 1978 and 1979. Arctic, 35(1), 180–200.
- Fissel, D. B., & Lemon, D. O. (1991). Analysis of physical oceanographic data from the Labrador Shelf, Summer 1980. Canadian Contractor Report of Hydrography and Ocean Sciences, Vol. 39.
- Freeland, H., & Denman, K. L. (1982). A topographically controlled upwelling centre off southern Vancouver Island. Journal of Marine Research, 40(4), 1069–1093.
- Galbraith, P. S. (2006). Winter water masses in the Gulf of St. Lawrence. Journal of Geophysical Research, 111(C6), doi:10.1029/2005JC003159
- Galbraith, P. S., & Larouche, P. (2011). Sea-surface temperature in Hudson Bay and Hudson Strait in relation to air temperature and ice cover breakup. 1985–2009. Journal of Marine Systems, 87(1), 66–78. doi: 10.1016/j.jmarsys.2011.03.002
- Garrett, C. J. R., Keeley, J. R., & Greenberg, D. A. (1978). Tidal mixing versus thermal stratification in the Bay of Fundy and Gulf of Maine. Atmosphere-Ocean, 16(4), 403–423. doi: 10.1080/07055900.1978.9649046
- Gil, J., Sánchez, R., Cerviño, S., & Garabana, D. (2004). Geostrophic circulation and heat flux across the Flemish Cap, 1988–2000. Journal of Northwest Atlantic Fishery Science, 34, 63–83. doi: 10.2960/J.v34.m510
- Gilbert, D., & Pettigrew, B. (1997). Interannual variability (1948–1994) of the CIL core temperature in the Gulf of St. Lawrence. Canadian Journal of Fisheries and Aquatic Sciences, 54(S1), 57–67.
- Gratton, Y., Mertz, G., & Gagné, J. A. (1988). Satellite observations of tidal upwelling and mixing in the St. Lawrence Estuary. Journal of Geophysical Research, 93(C6), 6947–6954. doi: 10.1029/JC093iC06p06947
- Griffiths, D., Pingree, R., & Sinclair, M. (1981). Summer tidal fronts in the near-Arctic regions of Foxe Basin and Hudson Bay. Deep Sea Research Part A. Oceanographic Research Papers, 28(8), 865–873. doi: 10.1016/S0198-0149(81)80006-4
- Hachey, H. B. (1931). Biological and oceanographic conditions in Hudson Bay 6. The general hydrography and hydrodynamics of the waters of the Hudson Bay region. Contributions to Canadian Biology and Fisheries, 7(1), 91–118. doi: 10.1139/f32-009
- Hannah, C., Shore, J. A., Loder, J. W., & Naimie, C. E. (2001). Seasonal circulation on the western and central Scotian Shelf. Journal of Physical Oceanography, 31(2), 591–615. doi: 10.1175/1520-0485(2001)031<0591:SCOTWA>2.0.CO;2
- Harvey, M., Therriault, J. C., & Simard, N. (1997). Late-summer distribution of phytoplankton in relation to water mass characteristics in Hudson Bay and Hudson Strait (Canada). Canadian Journal of Fisheries and Aquatic Sciences, 54(8), 1937–1952. doi: 10.1139/f97-099
- Harvey, M., Therriault, J. C., & Simard, N. (2001). Hydrodynamic control of late summer species composition and abundance of zooplankton in Hudson Bay and Hudson Strait (Canada). Journal of Plankton Research, 23(5), 481–496. doi: 10.1093/plankt/23.5.481
- Healey, M. C., Thomson, R. E., & Morris, J. F. T. (1990). Distribution of commercial troll fishing vessels off southwest Vancouver Island in relation to fishing success and oceanic water properties and circulation. Canadian Journal of Fisheries and Aquatic Sciences, 47(10), 1846–1864. doi: 10.1139/f90-210
- Huntsman, A. G. (1932). Biological and oceanographic conditions in Hudson Bay 1. Hudson Bay and the determination of fisheries. Contributions to Canadian Biology and Fisheries, 6(1), 455–462. doi: 10.1139/f31-022
- Ingram, R. G. (1976). Characteristics of a tide-induced estuarine front. Journal of Geophysical Research, 81(12), 1951–1959. doi: 10.1029/JC081i012p01951
- Ingram, R. G. (1979). Water mass modification in the St. Lawrence Estuary. Le Naturaliste Canadien, 106, 45–54.
- Ingram, R. G. (1983). Vertical mixing at the head of the Laurentian Channel. Estuarine, Coastal and Shelf Science, 16(3), 333–338. doi: 10.1016/0272-7714(83)90150-6
- Ingram, R. G., Bâcle, J., Barber, D. G., Gratton, Y., & Melling, H. (2002). An overview of physical processes in the North Water. Deep Sea Research Part II: Topical Studies in Oceanography, 49(22–23), 4893–4906. doi: 10.1016/S0967-0645(02)00169-8
- Ingram, R. G., & El-Sabh, M. I. (1990). Fronts and mesoscale features in the St. Lawrence Estuary. In M. I. El Sabh & N. Silverberg (Eds.), Oceanography of a large-scale estuarine system: The St. Lawrence (pp. 71–93). New York: Springer-Verlag.
- Jardine, I. D., Thomson, K. A., Foreman, M. G., & Leblond, P. H. (1993). Remote sensing of coastal sea-surface features off northern British Columbia. Remote Sensing of Environment, 45, 73–84. doi: 10.1016/0034-4257(93)90083-A
- Kahru, M., Di Lorenzo, E., Manzano-Sarabia, M., & Mitchell, B. G. (2012). Spatial and temporal statistics of sea surface temperature and chlorophyll fronts in the California Current. Journal of Plankton Research, 34(9), 749–760. doi: 10.1093/plankt/fbs010
- Kingsley, M., & Reeves, R. (1998). Aerial surveys of cetaceans in the Gulf of St. Lawrence in 1995 and 1996. Canadian Journal of Zoology, 76(8), 1529–1550. doi: 10.1139/z98-054
- Koutitonsky, V. G., & Bugden, G. L. (1991). The physical oceanography of the Gulf of St. Lawrence: A review with emphasis on the synoptic variability of the motion. In J. C. Therriault (Ed.), The Gulf of St. Lawrence: Small ocean or big estuary? (vol. 113, pp. 57–90). Canadian Special Publication of Fisheries and Aquatic Sciences.
- Lacroix, J. (1987). Étude descriptive de la variabilité spatio-temporelle des phénomènes physiques de surface de l'estuaire maritime et la partie nord-ouest du golfe du St. Laurent à l'aide d'images thermiques du satellite NOAA-7, Master's thesis, Université du Québec à Rimouski.
- de Lange Boom, B. R., Macneill, M. R., & Buckley, J. R. (1982). Iceberg motion in Lancaster Sound and Northwest Baffin Bay, summer 1978. Arctic, 35(1), 219–233. doi: 10.14430/arctic2321
- Lapoussière, A., Michel, C., Gosselin, M., Poulin, M., Martin, J., & Tremblay, J. E. (2013). Primary production and sinking export during fall in the Hudson Bay system, Canada. Continental Shelf Research, 52, 62–72. doi: 10.1016/j.csr.2012.10.013
- Larouche, P., Koutitonsky, V. G., Chanut, J. P., & El-Sabh, M. I. (1987). Lateral stratification and dynamic balance at the Matane transect in the Lower Saint Lawrence Estuary. Estuarine, Coastal and Shelf Science, 24, 859–871. doi: 10.1016/0272-7714(87)90157-0
- Lavoie, A., Bonn, F., Dubois, J. M. M., & El-Sabh, M. I. (1985). Structure thermique et variabilité du courant de surface de l'estuaire maritime du Saint-Laurent à l'aide d'images du satellite HCMM. Canadian Journal of Remote Sensing, 11, 70–84. doi: 10.1080/07038992.1985.10855079
- Le Fouest, V., Zakardjian, B. A., & Saucier, F. J. (2005). Seasonal versus synoptic variability in planktonic production in a high-latitude marginal sea: The Gulf of St. Lawrence (Canada). Journal of Geophysical Research, 110(C9), doi:10.1029/2004JC002423
- Legeckis, R., Brown, C. W., & Chang, P. S. (2002). Geostationary satellites reveal motions of ocean surface fronts. Journal of Marine Systems, 37(1–3), 3–15. doi: 10.1016/S0924-7963(02)00192-6
- Legendre, L., & Demers, S. (1984). Towards dynamic biological oceanography and limnology. Canadian Journal of Fisheries and Aquatic Sciences, 41, 2–19. doi: 10.1139/f84-001
- Legendre, L., Demers, S., Therriault, J. C., & Boudreau, C. A. (1985). Tidal variations in the photosynthesis of estuarine phytoplankton isolated in a tank. Marine Biology, 88, 301–309. doi: 10.1007/BF00392591
- Lobb, J., Weaver, A. J., Carmack, E. C., & Ingram, R. G. (2003). Structure and mixing across an Arctic/Atlantic front in northern Baffin Bay. Geophysical Research Letters, 30, 1833. doi:10.1029/2003GL017755
- Loder, J. W., & Greenberg, D. A. (1986). Predicted positions of tidal fronts in the Gulf of Maine region. Continental Shelf Research, 6(3), 397–414. doi: 10.1016/0278-4343(86)90080-4
- Lu, Y., Thompson, K. R., & Wright, D. G. (2001). Tidal currents and mixing in the Gulf of St. Lawrence: An application of the incremental approach to data assimilation. Canadian Journal of Fisheries and Aquatic Sciences, 58(4), 723–735.
- Marko, J. R., Birch, J. R., & Wilson, M. A. (1982). A study of long-term satellite-tracked iceberg drifts in Baffin Bay and Davis Strait. Arctic, 35(1), 234–240. doi: 10.14430/arctic2322
- Mavor, T. P., & Bisagni, J. J. (2001). Seasonal variability of sea-surface temperature fronts on Georges Bank. Deep Sea Research Part II: Topical Studies in Oceanography, 48, 215–243. doi: 10.1016/S0967-0645(00)00120-X
- Mei, Z. P., Legendre, L., Gratton, Y., Tremblay, J. E., LeBlanc, B., Mundy, C., … von Quillfeldt, C. (2002). Physical control of spring–summer phytoplankton dynamics in the North Water, April–July 1998. Deep Sea Research Part II: Topical Studies in Oceanography, 49(22–23), 4959–4982. doi: 10.1016/S0967-0645(02)00173-X
- Melling, H., Gratton, Y., & Ingram, R. G. (2001). Ocean circulation within the North Water polynya of Baffin Bay. Atmosphere-Ocean, 39(3), 301–325. doi: 10.1080/07055900.2001.9649683
- Muench, R. D. (1990). Mesoscale phenomena in the polar ocean. In W. O. Smith Jr. (Ed.), Polar oceanography part A: Physical science (pp. 223–285). San Diego, CA: Academic Press.
- Nieke, B., Reuter, R., Heuermann, R., Wang, H., Babin, M., & Therriault, J. C. (1997). Light absorption and fluorescence properties of chromophoric dissolved organic matter (CDOM), in the St. Lawrence Estuary (Case 2 waters). Continental Shelf Research, 17(3), 235–252. doi: 10.1016/S0278-4343(96)00034-9
- Nieto, K., Demarcq, H., & McClatchie, S. (2012). Mesoscale frontal structures in the Canary Upwelling System: New front and filament detection algorithms applied to spatial and temporal patterns. Remote Sensing of Environment, 123, 339–346. doi: 10.1016/j.rse.2012.03.028
- O'Hara, P., Morgan, K., & Sydeman, W. (2006). Primary producer and seabird associations with AVHRR-derived sea surface temperatures and gradients in the southeastern Gulf of Alaska. Deep Sea Research Part II: Topical Studies in Oceanography, 53(3–4), 359–369. doi: 10.1016/j.dsr2.2006.01.011
- Ollerhead, J. (2005). Measurements of inorganic suspended sediment concentration in the Northumberland Strait in October of 2005, Technical report, Mount Allison University, Sackville, Canada.
- Perry, R. I., Dilke, B. R., & Parsons, T. R. (1983). Tidal mixing and summer plankton distributions in Hecate Strait, British Columbia. Canadian Journal of Fisheries and Aquatic Sciences, 40, 871–887. doi: 10.1139/f83-114
- Pettigrew, B., Larouche, P., & Gilbert, D. (2011). Validation des images composites des température de surface produites au laboratoire de télédétection de l'institut Maurice-Lamontagne. Rapport technique canadien sur l'hydrographie et les sciences océaniques, Vol. 270.
- Prinsenberg, S. J., & Freeman, N. G. (1986). Tidal heights and currents in Hudson Bay and James Bay. In I. P. Martini (Ed.), Canadian inland seas (vol. 44, pp. 205–216). New York: Elsevier, Elsevier Oceanography Series.
- Reed, R. K., & Shumacher, J. D. (1986). Physical oceanography. In D. W. Hood & S. T. Zimmerman (Eds.), The Gulf of Alaska, Physical environment and biological resources ( chap. 3, pp. 57–75). U.S. Dept. of Commerce, National Oceanic and Atmospheric Administration, National Ocean Service, Office of Oceanography and Marine Assessment, Ocean Assessments Division, Alaska Office.
- Roff, J. C., & Legendre, L. (1986). Physico-chemical and biological oceanography of Hudson Bay. In I. P. Martini (Ed.), Canadian inland seas (vol. 44, pp. 265–292). New York: Elsevier, Elsevier Oceanography Series.
- Sherman, K. (1990). Productivity, perturbations, and options for biomass yields in large marine ecosystems. In K. Sherman, L. M. Alexander, & B. D. Gold (Eds.), Large marine ecosystems: Patterns, processes and yields (pp. 206–219). Washington, D.C.: American Association for the Advancement of Science.
- Sherman, K. (2005). The large marine ecosystem approach for assessment and management of ocean coastal waters. In T. Hennessey & J. Sutinen (Eds.), Sustaining the large marine ecosystems: The human dimension (pp. 3–16). Amsterdam: Elsevier.
- Sibert, V., Zakardjian, B., Gosselin, M., Starr, M., Senneville, S., & LeClainche, Y. (2011). 3D bio-physical model of the sympagic and planktonic productions in the Hudson Bay system. Journal of Marine Systems, 88(3), 401–422. doi: 10.1016/j.jmarsys.2011.03.014
- Simpson, J. H., & Hunter, J. R. (1974). Fronts in the Irish Sea. Nature, 250, 404–406. doi: 10.1038/250404a0
- Sinclair, M., & Iles, T. D. (1985). Atlantic herring (Clupea harengus) distributions in the Gulf of Maine – Scotian Shelf area in relation to oceanographic features. Canadian Journal of Fisheries and Aquatic Sciences, 42, 880–887. doi: 10.1139/f85-112
- Smith, J. C., Platt, T., Li, W. K. W., Horne, E. P. W., Harrison, W. G., Rao, D. V. S., & Irwin, B. D. (1985). Arctic marine photoautotrophic picoplankton. Marine Ecology Progress Series, 20, 207–220. doi: 10.3354/meps020207
- Stabeno, P., Bond, N., Hermann, A., Kachel, N., Mordy, C., & Overland, J. (2004). Meteorology and oceanography of the northern Gulf of Alaska. Continental Shelf Research, 24(7–8), 859–897. doi: 10.1016/j.csr.2004.02.007
- Stein, M. (2007). Oceanography of the Flemish Cap and adjacent waters. Journal of Northwest Atlantic Fishery Science, 37(February), 135–146. doi: 10.2960/J.v37.m652
- Straneo, F., & Saucier, F. (2008). The outflow from Hudson Strait and its contribution to the Labrador Current. Deep Sea Research Part I: Oceanographic Research Papers, 55(8), 926–946. doi: 10.1016/j.dsr.2008.03.012
- Sutcliffe, W. H., Loucks, R. H., Drinkwater, K. F., & Coote, A. R. (1983). Nutrient flux onto the Labrador Shelf from Hudson Strait and its biological consequences. Canadian Journal of Fisheries and Aquatic Sciences, 40, 1692–1701. doi: 10.1139/f83-196
- Taggart, C. T., Drinkwater, K. F., Frank, K. T., McRuer, J., & Larouche, P. (1989). Larval fish, zooplankton community structure, and physical dynamics at a tidal front. Rapports et Proces-verbaux des Réunions. Conseil International pour l’Éxploration de la Mer, 191, 184–194.
- Tang, C. C., Ross, C. K., Yao, T., Petrie, B., DeTracey, B. M., & Dunlap, E. (2004). The circulation, water masses and sea-ice of Baffin Bay. Progress in Oceanography, 63(4), 183–228. doi: 10.1016/j.pocean.2004.09.005
- Tee, K. T., Smith, P. C., & Lefaivre, D. (1993). Topographic upwelling off southwest Nova Scotia. Journal of Physical Oceanography, 23(8), 1703–1726. doi: 10.1175/1520-0485(1993)023<1703:TUOSNS>2.0.CO;2
- Tremblay, J. E., Robert, D., Varela, D. E., Lovejoy, C., Darnis, G., Nelson, R. J., & Sastri, A. R. (2012). Current state and trends in Canadian Arctic marine ecosystems: I. Primary production. Climatic Change, 115(1), 161–178. doi: 10.1007/s10584-012-0496-3
- Ueno, H., Sato, K., Freeland, H. J., Crawford, W. R., Onishi, H., Oka, E., & Suga, T. (2009). Anticyclonic eddies in the Alaskan Stream. Journal of Physical Oceanography, 39(4), 934–951. doi: 10.1175/2008JPO3948.1
- Ullman, D. S., & Cornillon, P. C. (1999). Satellite-derived sea surface temperature fronts on the continental shelf off the northern U.S. coast. Journal of Geophysical Research, 104(C10), 23459–23478. doi: 10.1029/1999JC900133
- Valeur, H. H., Hansen, C., Hansen, K. Q., Rasmussen, L., & Thingvad, N. (1996). Weather, sea and ice conditions in eastern Baffin Bay, offshore northwest Greenland: A review. Technical Report no. 96–12 December. Mineral Resources Administration for Greenland, Copenhagen, Denmark.
- Van As, D. (2011). Warming, glacier melt and surface energy budget from weather station observations in the Melville Bay region of northwest Greenland. Journal of Glaciology, 57(202), 208–220. doi: 10.3189/002214311796405898
- Vermeer, K., Butler, R. W., & Morgan, K. H. (1992). Ecology, status, and conservation of marine and shoreline birds on the west coast of Vancouver Island, Canadian Wildlife Service, Occasional Paper, 75.
- Vladykov, V. D. (1933). Biological and oceanographic conditions in Hudson Bay 9. Fishes from the Hudson Bay region (except the Coregonidae). Contributions to Canadian Biology and Fisheries, 8(1), 13–61. doi: 10.1139/f33-002
- Waite, J. N., & Mueter, F. J. (2013). Spatial and temporal variability of chlorophyll-a concentrations in the coastal Gulf of Alaska, 1998–2011, using cloud-free reconstructions of SeaWiFS and MODIS-Aqua data. Progress in Oceanography, 116, 179–192. doi: 10.1016/j.pocean.2013.07.006
- Wall, C. C., Muller-Karger, F. E., Roffer, M.a., Hu, C., Yao, W., & Luther, M. E. (2008). Satellite remote sensing of surface oceanic fronts in coastal waters off west–central Florida. Remote Sensing of Environment, 112(6), 2963–2976. doi: 10.1016/j.rse.2008.02.007
- Wang, Q., Myers, P. G., Hu, X., & Bush, A. B. (2012). Flow constraints on pathways through the Canadian Arctic Archipelago. Atmosphere-Ocean, 50(3), 373–385. doi: 10.1080/07055900.2012.704348
- Wessel, P., & Smith, W. H. F. (1996). A global, self-consistent, hierachical, high-resolution shoreline database. Journal of Geophysical Research, 101(B4), 8741–8743. doi: 10.1029/96JB00104
- Whitney, F., Crawford, W. R., & Harrison, P. (2005). Physical processes that enhance nutrient transport and primary productivity in the coastal and open ocean of the subarctic NE Pacific. Deep Sea Research Part II: Topical Studies in Oceanography, 52(5–6), 681–706. doi: 10.1016/j.dsr2.2004.12.023
- Wong, S. N., Gjerdrum, C., Morgan, K. H., & Mallory, M. L. (2014). Hotspots in cold seas: The composition, distribution and abundance of marine birds in the North American Arctic. Journal of Geophysical Research: Oceans, 119, 1691–1705. doi:10.1002/2013JC009198
- Wu, Y., Tang, C., & Hannah, C. (2012). The circulation of eastern Canadian seas. Progress in Oceanography, 106, 28–48. doi: 10.1016/j.pocean.2012.06.005