
ABSTRACT
Environmental impacts, including tidal regimes and sediment transport in the Minas Basin, caused by tidal power extraction in the Minas Passage have been investigated using a three-dimensional hydrodynamic model in which tidal power extraction is represented using an arbitrary method that adds a friction term to the standard momentum equations. Using the model results, changes in tidal processes and sediment transport in the Minas Basin are examined by comparing model results with and without power extraction. With the presence of power extraction, the tidal level decreases by 0.5–1.5% and the tidal phase increases by 1.2–1.8°. Tidal currents decrease by 15–35% at the western head of the Minas Basin and increase by a comparable magnitude at the Southern Bight. The presence of power extraction could move the location of the tidal residual gyre in the western head of the Minas Basin south by about 2 km. Model results also show that less sediment would move into the central area of the Minas Basin but more sediment would be deposited into the Southern Bight at a rate of 8–12 mm y−1. The effect of the deposition rate might be negligible in the northern part of the Bight where the water is deep but could be important in the intertidal areas.
RÉSUMÉ
[Traduit par la rédaction] Nous avons étudié les impacts environnementaux, notamment sur les régimes de marée et sur le transport de sédiments dans le bassin Minas, de l'extraction d’énergie marémotrice dans le passage Minas à l'aide d'un modèle hydrodynamique tridimensionnel dans lequel l'extraction d’énergie marémotrice est représentée au moyen d'une méthode arbitraire qui ajoute un terme de frottement aux équations standards de quantité de mouvement. En nous servant des résultats du modèle, nous examinons les changements dans les processus de marée et le transport de sédiments dans le bassin Minas en comparant les résultats du modèle avec et sans extraction d’énergie. En présence d'extraction d’énergie, le niveau de la marée diminue de 0,5 à 1,5% et la phase de la marée augmente de 1,2 à 1,8°. Les courants de marée diminuent de 15 à 35% à l'entrée ouest du bassin Minas et augmente dans les mêmes proportions dans la Southern Bight. La présence d'extraction d’énergie pourrait déplacer d'environ 2 km vers le sud la position du tourbillon résiduel de marée dans l'entrée ouest du bassin Minas. Les résultats du modèle montrent aussi que moins de sédiments se déplaceraient vers la région centrale du bassin Minas mais plus de sédiments se déposeraient dans la Southern Bight au taux 8 à 12 mm par année. L'effet du taux de dépôt pourrait être négligeable dans la partie nord de la Southern Bight, où l'eau est profonde, mais pourrait être important dans les zones intertidales.
1 Introduction
Generating electricity by placing in-stream turbines in strong tidal currents is a prospective way to produce clean and renewable energy (Thresher & Musial, Citation2010; Xia, Falconer, & Lin, Citation2010). However, the presence of in-stream turbines and their accessories may increase resistance to tidal flows and change tidal regimes (Polagye, Malte, Kawase, & Durran, Citation2008). The changes caused by tidal power extraction may further affect other physical or biological processes in the near- and/or far-fields, and unacceptable distortions may limit the development of a tidal power project (Bryden & Melville, Citation2004). For example, Neill, Litt, Couch, and Davies (Citation2009) demonstrated that a tidal power farm based on in-stream turbines placed in a large estuary (Bristol Channel, UK) could change tidal asymmetry, thus having important implications for large-scale sediment transport.
The Bay of Fundy (), well known for its high tidal ranges in the Minas Basin and strong tidal currents in the Minas Passage, is an ideal setting for generating tidal power using in-stream turbines. Because only part of the Minas Passage is blocked, tidal power extraction using in-stream turbines is believed to be relatively environmentally friendly compared with the previously proposed dam, which exploits the potential energy between tidal ranges by almost completely blocking the water flowing into the Minas Basin. Several studies on the power assessment and environmental impacts of turbines in the Minas Passage have recently been published. For example, using a two-dimensional tidal model, Karsten, McMillan, Lickley, and Haynes (Citation2008) essentially verified the theory of Garrett and Cummins (Citation2004, Citation2005) and reported that potential tidal current energy across the Minas Passage reached 7 GW. Effects of in-stream turbines were implemented in their model by adding extra bottom friction. With respect to the maximum energy extracted, they found that tides would decrease by 36% in the Minas Basin but increase by over 15% along the northeast coast of the Gulf of Maine. More recently Hasegawa, Sheng, Greenberg, and Thompson (Citation2011) modelled power extraction in the Minas Passage and its related impacts using a three-dimensional (3-D) nested hydrodynamic model. The presence of in-stream turbines was simulated by Rayleigh friction in the standard momentum equations based on two different power extraction scenarios. One case has turbines covering the entire water column and the other has turbines covering the lower water column within 20 m above the sea bottom. They estimated the power available to be 7.6 GW in the first scenario and 2.0 GW in the second scenario. The tidal changes in the first scenario are comparable to those found by Karsten et al. (Citation2008), and the change in sea level in the second scenario is 5.7% in the Minas Basin and negligible in the outer Gulf of Maine. Using a 3-D tidal model, Walters, Tarbotton, and Hiles (Citation2013) reported that the maximum instantaneous power is 12 GW and maximum average power is about 5.7 GW. The presence of turbines in their model was simulated with form drag through a double averaging method (Walters & Plew, Citation2008).
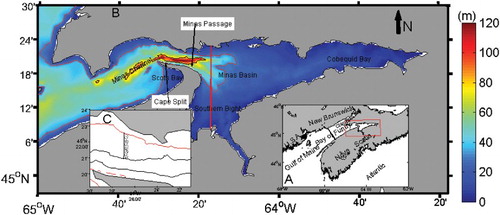
Fig. 1 Model domain and study area. The area of the red box in A indicates the location of the study area B. The straight black line across the Bay of Fundy in A indicates the western boundary of the model domain. The model elements used for power extraction are shown in C. The background colour in B represents water depth and the red contour lines represent the 30 and 80 m isobaths. The red line in B indicates the section used in and .
However, changes in sediment transport caused by power extraction based on in-stream turbines have not yet been discussed. At the same time, all these studies assumed that the turbines were placed across the entire passage, from the shallow coastal waters (water depth < 10 m) to the deep central channel, where water depth reaches 110 m. This assumption is reasonable for assessing the power available and can be considered an extreme example of the environmental impacts. In practice, the assumption may not be realistic because of the operational difficulties in deep water and conflicts with human activities in coastal areas. So, in the present study, we first examine the preferred site for power extraction in the Minas Passage based on preliminary engineering constraints. Environmental impacts caused by power extraction at the preferred site, including tidal levels, tidal currents, bottom stress, and sediment transport, are then discussed using a 3-D hydrodynamic model with a horizontal resolution of 100 m in the Minas Passage.
The paper is organized as follows: the model description is introduced in Section 2; changes in hydrodynamic processes, such as tidal levels, tidal currents, residual currents, and bottom stress resulting from two different power levels, are presented in Section 3; changes in the sediment transport regime are presented in Section 4. Some discussion is provided in Section 5.
2 Model
a Model Description
The model used in this study is the Finite-Volume Coastal Ocean Model (FVCOM), which is a 3-D, finite-volume, unstructured grid ocean model (Chen, Beardsley, & Cowles, Citation2006; Chen, Cowles, & Beardsley, Citation2004; Chen, Liu, & Beardsley, Citation2003). FVCOM has a free surface, uses sigma coordinates in the vertical, and employs mode time split technology. The model also contains an embedded second-order turbulence closure scheme (Blumberg & Mellor, Citation1987) in which the vertical eddy viscosity is parameterized by a mixing length, the turbulence kinetic energy, and a stability factor that depends on the vertical shear and buoyancy. The horizontal diffusion is estimated using Smagorinsky diffusivity. The flooding and drying processes are simulated with a mass-conserving wet and dry point method. The model mesh has 4588 nodes and 8629 triangular elements, and the resolution varies between approximately 7500 m in the outer part of the mesh and 100 m in the Minas Passage. There are twenty-one levels in the vertical, with enhanced resolution near the surface and bottom. The model was forced by the tidal elevation of the five largest constituents (M2, N2, S2, K1, and O1) derived from Web Tide, a software package for tidal prediction (Dupont, Hannah, Greenberg, Cherniawsky, & Naimie, Citation2002). The model runs 35 days from still water for spin up, and then runs 29 days for model validation and model results analysis with the hourly model output. All the parameters in the model runs use default values except bottom roughness. A more detailed description of the model setup can be found in Wu, Chaffey, Greenberg, Colbo, and Smith (Citation2011), who also evaluated the model using independent observational data including tidal elevation, tidal currents, tidal-induced residual currents, and tidal asymmetry indicators. The evaluation shows that the model is in good agreement with observations.
In this paper, a method similar to those of Hasegawa et al. (Citation2011) and Wu et al. (Citation2014) is used to estimate the kinetic energy extraction by adding an extra friction term to the standard momentum equation:(1) where the last term on the right-hand side represents the friction term, which is a function of the tidal velocity, u, and the drag coefficient,
, in units of millimetres−1;
is a step function equal to unity from 5 to 25 m above the sea bed and zero otherwise. Also, t is time, ρ is sea water density (1025 kg m−3), p is pressure, Fr is the horizontal and vertical diffusion term, and 2Ωu is the Coriolis acceleration. It is worth noting that the treatment of the friction term is based on the model elements in the horizontal and on the sigma levels in the vertical. In fact, the drag coefficient is variable; it depends on the geometry and density of turbines, the area used for averaging, and the placement of the sigma levels (Walters et al., Citation2013). As a preliminary study, the drag coefficient is assumed to be constant in this work. This seems arbitrary, but it may be reasonable because the aim of the present study is to examine the changes in tidal environment in the Minas Basin not to simulate the interactions between turbines and flows in the local area.
The average power within tidal cycles obtained from Eq. (1) is calculated following Hasegawa et al. (Citation2011):(2) where T is the averaging period (T = 29 days), and S is the area of model elements.
b Site Selection
In this subsection, we will discuss the location of the preferred site for power extraction based on preliminary engineering constraints. The proper placement of a tidal energy extraction facility, such as in-stream turbines, would allow high levels of electricity production, have low installation costs, and have minimal impact on the environment and existing human activities during management and maintenance (Blunden & Bahaj, Citation2007; Bryden & Melville, Citation2004). In the Minas Passage, peak tidal speed is usually more than 3 m s−1, meeting the requirement of a commercial-sized power station. For example, Polagye, Van Cleve, Copping, and Kirkendall (Citation2011) indicated that the peak speed should be above 2.5 m s−1. Water depth is also a key factor in determining the suitability of turbine installation. Excessively shallow water increases the risk of damage to turbines resulting from extreme weather. Excessively deep water, however, dramatically increases costs for turbine deployment, installation, and maintenance (Bryden & Melville, Citation2004). For gravity-anchored turbines, deployment in water deeper than 80 m is not recommended (Polagye, Citation2009). For the turbines, 20 m diameter and 5 m support, the minimum water depth for deployment is at least 25 m in order to ensure that the turbines are not exposed to air. At the same time, deeper water is required to keep the turbines submerged during spring tides, when sea level falls approximately an additional 5 m below the mean water level at low tide. Thus, the minimum water depth was adjusted to 30 m.
As discussed above, the preferred location for tidal energy extraction from the Minas Passage is mainly in the northwest (), where tidal speed is high and water depth is moderate. Other factors, such as the condition of the bed geology, availability of an electrical power grid on land, or ease of cable installation are also important considerations for site selection. Additionally, anticipated environmental impacts, such as changes in physical and biological processes, as well as changes in human activities, must be within acceptable limits. Considering the diameter of the turbines to be 20 m with 5 m for support, the momentum drag term is applied based on the model element in the horizontal direction and the sigma levels in the vertical, covering water depths from 30 to 80 m in the northern part of the Minas Passage and the water column from 5 to 25 m above the seabed () in the centre of the Passage; the horizontal width of the turbines is approximately 300 m ().
Fig. 2 Schematic arrangement of turbines across the Minas Passage.
Using Eqs (1) and (2), relations between the drag coefficient, the power extraction, and the flow reduction rate can be obtained by increasing the drag coefficient until a relatively stable power level is reached. The flow reduction rate here is defined as Q*amp = (Q λ=0 amp – Qamp)/Qλ=0 amp (where Qλ=0 amp and Qamp are the M2 flow volume amplitudes along the Minas Passage with and without power extraction, respectively; Qλ=0 amp = 9.5×10⁵ m3 s−1). The drag coefficient varies from 0 to 0.025 m−1 with an interval of 0.0005 m−1 and the results are plotted in . The drag coefficient for the maximum average power is about 0.025 m−1. This value is larger than that obtained by Hasegawa et al. (Citation2011) in their examination of two different power extraction events. As mentioned above, one case has turbines covering the entire water column across the Minas Passage and the other has turbines covering the lower water column within 20 m of the sea bottom. They obtained a drag coefficient of 0.0025 m−1 for the first case and 0.0090 m−1 for the second case. The drag coefficient in the second case is about four times that of the first case. This implies that the power extraction efficiency is lower in the second case. In the present paper, a partial section is used and the maximum power is only 554 MW, about 7% of the first case in Hasegawa et al. (Citation2011). The larger drag in this paper is likely a result of the smaller area for power extraction.
Fig. 3 Relation of drag coefficient versus (a) power and (b) flow reduction rate. The circles indicate the location of the 300 MW power level and the crosses indicate the location of the 500 MW power level.
3 Changes in tides
Based on a preliminary plan for power extraction of 262–333 MW in the Minas Passage (Hagerman, Fader, Carlin, & Bedard, Citation2006), the analysis below is based on two realistic power levels. One is 300 MW (Case I) and the other is 500 MW (Case II), corresponding to drag coefficients of 0.0014 and 0.0060 m−1, respectively. Proportional change is defined as the relative difference between the model runs with and without turbineswhere
and
are variables from model runs with and without power extraction, respectively. For a change in the tidal phase, the absolute difference (
) is used. In the comparison below, model runs with drag are referred to as Case I and Case II, corresponding to the two different power levels, respectively, and the model run without turbines is referred to as Case 0.
a Tidal Levels
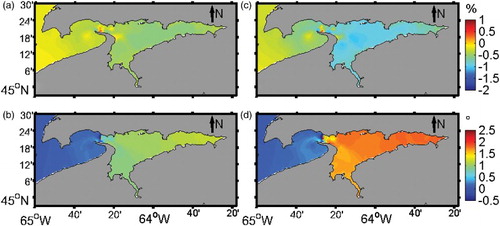
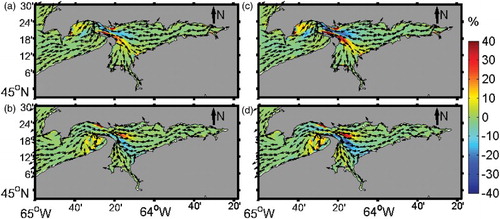
displays changes in amplitude and phase for M2 in Cases I and II. In general, sea level amplitude of the M2 tide in the Minas Basin decreases because of power extraction. The decrease in magnitude in the central area of the Minas Basin and the Southern Bight seems higher than that in Cobequid Bay. Specifically, the peak decrease in magnitude is about 0.5% for Case I and 1.5% for Case II. In contrast, the phase of M2 increases in both Case I and Case II meaning that tides will be delayed after the installation of power extraction in the Minas Passage. The area with increased phase covers the entire Minas Basin with the magnitude increasing from east to west, reaching a maximum in upper Cobequid Bay. The change in tidal phase in the Southern Bight is relatively weak compared with that of the remaining areas in the Minas Basin. The increase in magnitude is about 1.2° for Case I and 1.8° for Case II, corresponding to 150 and 225 s, respectively.
Fig. 4 Changes (defined in text) in (a) and (c) amplitude and (b) and (d) phase of M2 for (a) and (b) Case I and (c) and (d) Case II.
b Tidal Currents
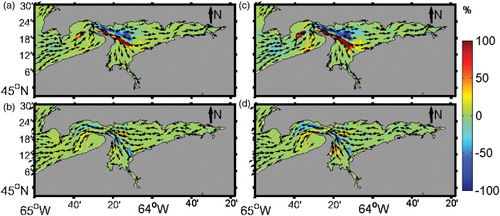
The changes in mean depth-averaged tidal speed during the flood and ebb stages are shown in . During flood, a prominent decrease in tidal speed can be found from the western head of the Minas Basin to its centre. The decrease in magnitude reaches 15% in Case I and 30% in Case II, corresponding to a decrease of 0.3 and 0.6 m s−1, respectively, for a tidal speed of 2.0 m s−1 in that area. In contrast, tidal speeds increase significantly in the northern section of the Southern Bight, by a magnitude of 20% in Case I and 35% in Case II, corresponding to 0.2 and 0.35 m s−1, respectively. During ebb, the tidal speeds increase at the western entrance to the Minas Basin by 15% in Case I and 30% in Case II. However, a clear decrease can be seen in the northern section of the Southern Bight, where the decrease in magnitude of the tidal speed is about 15% in Case I and 25% in Case II. This change is understandable. During flood, the presence of in-stream turbines in the Minas Passage blocks flowing water and reduces the current velocity entering the Minas Basin through the northern part of the Minas Passage. Part of the blocked water bypasses the turbines and flows into the Southern Bight through the deep southern channel of the Passage. During ebb, the tidal velocity is reduced in the Southern Bight and intensified in the western head of the Minas Basin because of the effect of the turbines. Overall, compared with the changes in sea level, the depth-averaged tidal currents could change significantly by a magnitude of 10–35%. However, the changes would be mainly limited to local areas at the western head of the Minas Basin and the northern section of the Southern Bight.
Fig. 5 Changes (defined in text) of mean depth-averaged velocity during (a) and (c) flood and (b) and (d) ebb for (a) and (b) Case I and (c) and (d) Case II. The arrows in the figures represent the direction of the tidal currents from the model run with turbines; their lengths are not scaled by the current magnitudes.
c Residual Currents
The tidal-induced residual currents averaged over the water depth were derived using the tidal analysis package T_Tide of Pawlowicz, Beardsley, and Lentz (Citation2002) in cases with and without power extraction and are plotted in . Without power extraction, the main feature of the tidally induced residual circulation in the Minas Basin is a clockwise gyre, which covers the western section of the Minas Basin and extends to the Southern Bight (). The gyre controls the net transport of sediment, especially the suspended sediment in the Minas Basin and the Southern Bight (Wu et al., Citation2011). With the presence of turbines, model results show that the location of the gyre would change (). To provide a detailed description of the change, the u and v components of the velocity were plotted along a section across the second gyre from north to south (see the location of the section in ). The results are shown in . The discussion in this subsection is mainly based on the u component of the velocity because its magnitude is 2–3 times larger than that of the v component (). We can see that the eddy moves south by about 2 km in Case I and 3 km in Case II. From north to south along the section, the main change in the u component of the velocity occurs in the area 4.3 to 11.5 km from the northern coast; this region is further divided into four separate regions, indicated as 1–4 in a. In regions 1 and 2, the strength of the eastern flow is clearly lower because of the presence of the turbines. The decrease in magnitude reaches 50% for Case II. In region 1, the residual current flows west in contrast with Case 0 in which it flows east. In regions 3 and 4, however, the residual flow increases in both Cases I and II. In region 4, the residual again flows opposite to the direction in Case 0. Overall, the presence of turbines in the Minas Passage changes the location of the clockwise gyre by moving it south by about 2 km. The residual current decreases at the western entrance of the Minas Basin but increases at the northern section of the Southern Bight as a result of power extraction.
Fig. 6 Differences in residual current field between Case 0 and (a) Case I and (b) Case II.
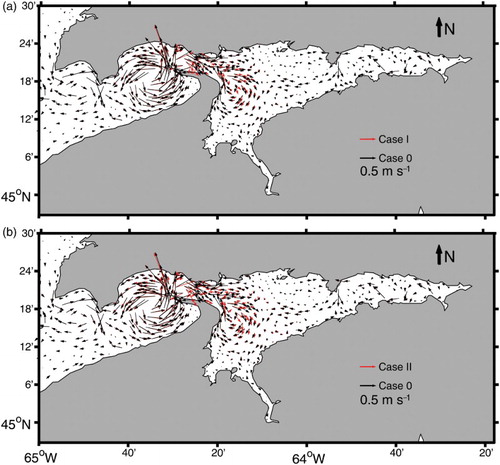
Fig. 7 Components of residual velocity along a section across the west Minas Basin. The location of the section is shown in .
d Bottom Shear Stress
Bottom shear stress is a key factor for the erosion and deposition processes of sediment transport. Without power extraction, the magnitudes of the bottom shear stress averaged over flood and ebb durations are high in the central area of the Minas Basin and Cobequid Bay and relatively low in the Southern Bight (Wu et al., Citation2011). Similar to the spatial feature of changes in the tidal currents, significant changes in the bottom shear stress are found in the western area of the Minas Basin with power extraction (). Specifically, the flood shear stress decreases at the western head of the Minas Basin but increases in the northern section of the Southern Bight. During ebb, the horizontal feature of the bottom stress is the opposite of that during flood. The stress increases in the western head of the Minas Basin but decreases in the Southern Bight. The changes in magnitude are weaker than those during flood. The changes in bottom shear stress in the western head of the Minas Basin would slow sediment flowing into the central area of the Minas Basin during the duration of flood but speed up sediment moving west into the Minas Passage during ebb. However, more sediment would move into the Southern Bight during flood, but less sediment would be transported to the Minas Passage during ebb. These results indicate that the presence of the turbines in the Minas Basin could alter the asymmetry of the bottom shear stress. According to Wu et al. (Citation2011), the asymmetry in the Minas Basin is mainly caused by tidal residual flow, and the non-linear interaction between M2 and M4 plays a minor role. With respect to tidal power extraction, tidal asymmetry due to M2 and M4 were also analyzed (results not shown). The analysis indicates that the change in the non-linear interaction of M2 and M4 is negligible compared with the residual flow.
Fig. 8 Changes (defined in text) in mean bottom shear stress during (a) and (c) flood and (b) and (d) ebb for (a) and (b) Case I and (c) and (d) Case II. The arrows in the figures represent the directions of the stress from the model run with turbines, and their lengths are not scaled by the current magnitudes.
4 Changes in sediment transport
Using grain size observation data, remotely sensed sediment concentration, and a hydrodynamic model, Wu et al. (Citation2011) investigated tidally induced sediment transport in the upper Bay of Fundy including bed load and suspended load. The bed load transport was estimated using the observed grain size data of Long (Citation1979), the formula of Meyer-Peter and Müller (Citation1948), and the modelled bottom shear stress. Alternatively, remotely sensed sediment concentration and modelled tidal current fields were used to estimate transport of the suspended sediment. The modelled transport rate was compared with the available observational data (Amos & Joice, Citation1977). General transport features obtained are qualitatively supported by field observations (Amos, Citation1985; Amos & Joice, Citation1977; Amos et al., Citation1980). In general, sediment in the Minas Passage moves eastward and is deposited into the central area of the Minas Basin. However, sediment from the eastern part of the basin moves westward and is also deposited into the central area of the Minas Basin. In Cobequid Bay, sediment moves eastward and is deposited in the upper bay. In this section, changes in sediment transport resulting from tidal power extraction will be discussed. Compared with Wu et al. (Citation2011), the same grain size data and model set up were used except for the presence of tidal power extraction in the Minas Passage. It is worth noting that changes in sediment transport in this paper are only limited to tidal currents. Some other factors, such as winds, waves, density variations, and far field general circulations, are ignored in our tidal model. They may play an important role in sediment transport in some areas, especially in shallow waters though the mean significant wave height is generally less than 0.5 m and the period is about 4–5 s according to Li et al. (Citation2010).
a Bed Load Transport
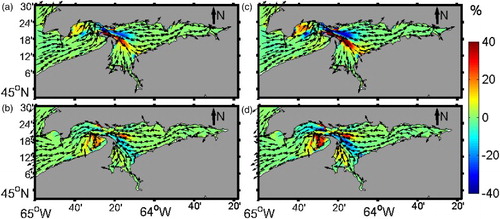
Changes in horizontal distribution of the mean transport rate of the bed load during flood and ebb at the two power levels are shown in . Similar to the horizontal features of the bottom stress, bed load transport rate during flood duration noticeably decreases at the western entrance of Minas Basin but increases in the northern section of the Southern Bight. The change in magnitude is about 40–60% in Case I and up to 100% in Case II. Changes during ebb show the opposite trend but with lower magnitudes compared with those during flood. Although the change rate is high, the absolute value of the transports may not be surprisingly large because the rates are rather low in Case 0 in these areas. Nevertheless, the changes indicate that more erosion occurs in the deep southern channel of the Minas Passage, and more coarse sediment is deposited in the Southern Bight instead of the central area of the Minas Basin in terms of the grain size data of Long (Citation1979).
Fig. 9 Changes (defined in text) of bed load transport during (a) and (c) flood and (b) and (d) ebb for (a) and (b) Case I and (c) and (d) Case II. The arrows in the figures represent the direction of the stress from the model run with turbines; their lengths are not scaled by the current magnitudes.
b Suspended Load Transport
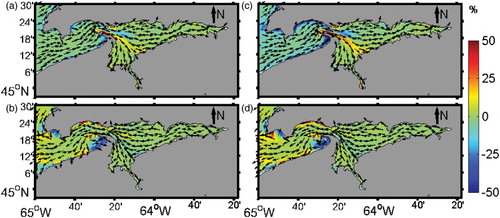
Similar to the bed load transport, significant changes in suspended load transport during flood occur mainly in two areas: the western head of the Minas Basin and the northern section of the Southern Bight (). A significant decrease of about 20% in Case I and 30% in Case II can be found in the former area. In the latter area, however, the suspended load transport rate increases with a slightly higher magnitude than in the former area. During ebb, the properties of the changes in these areas are the opposite of each other with lower magnitudes relative to those during flood.
Fig. 10 Changes (defined in text) of suspended load transport during (a) and (c) flood and (b) and (d) ebb for (a) and (b) Case I and (c) and (d) Case II. The arrows in the figures represent the direction of the stress from the model run with turbines; their lengths are not scaled by the current magnitudes.
In summary, sediment transport patterns, including the bed load and suspended load, change significantly in the western marginal areas of the Minas Basin as a result of tidal power extraction with two realistic power levels in the Minas Passage (). In the western head of the Minas Basin, less sediment moves into the central area of the Minas Basin. In contrast, more sediment is transported to the Southern Bight through the deep central channel of the Minas Passage. The magnitude of the change reaches 100%. However, the absolute value of the change may, surprisingly, not be large because the transport rates are rather low in the case without power extraction in these areas.
Fig. 11 (a) Mean total load transport rate in tidal cycles and changes (defined in the text) for (b) Case I and (c) Case II. The arrows in the figure represent the directions of the sediment transport rate from the model run with turbines.
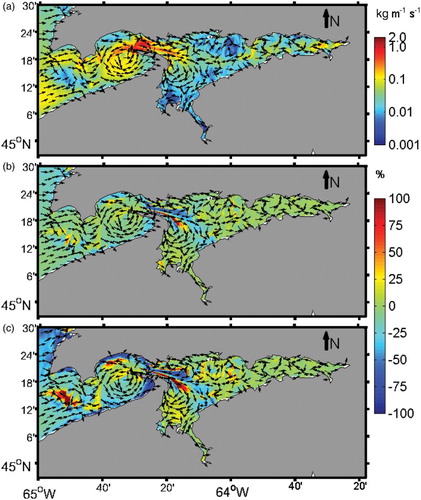
To determine the changes quantitatively, sediment transport rates along a section (see ) across the western area of the Minas Basin from north to south are plotted in a and the differences between Case I and Case 0 and Case II and Case 0 are shown in b. Sediment transport decreases in the western head of the Minas Basin (0–8 km) but increases in the Southern Bight (8–15 km). The transport fluxes through these two areas are listed in . For the western head of the Minas Basin, the amount of sediment moving into the Minas Basin significantly decreases as a result of power extraction, from 3880 m3 y−1 in Case 0 to 50 m3 y−1 in Case II. In contrast to the western head of the Minas Basin, significant sediment is transported into the Southern Bight, in the amount of 2690 m3 y−1, after tidal power extraction. As a result, there may not be much change in water depth in the western head of the Minas Basin after the installation of turbines. For the Southern Bight, however, water depth would shallow as a result of deposition at a rate of 8–12 mm −1 (the area of the Southern Bight is 221 km2) provided that all the sediment is deposited in the Southern Bight. The shallowing of the water depth is likely negligible in the northern section of the Southern Bight (water depth is about 20–40 m) but could be important in intertidal areas.
Fig. 12 (a) Transport rates and (b) differences from two power levels along a section across the western area of the Minas Basin (the location of the section is shown in ).
Table 1. Sediment transport across a section across the west Minas Basin (see the location of the section in ).
5 Discussion
The open boundary in the model used in this paper is in the middle of the Bay of Fundy, which is far from the edge of the continental shelf, which has commonly been used as an open boundary by previous studies in an attempt to avoid reflection from the power site in the Minas Passage, for example, Karsten et al. (Citation2008), Hasegawa et al. (Citation2011), and Walters et al. (Citation2013). As already discussed, extreme situations are assumed in these studies. The power extraction proposed by these studies reaches 7.0 GW, and the flow reduction in the Minas Basin is up to 38%, which is considerably higher than the power level proposed in this paper of 500 MW and 1.5% flow reduction. To examine sea level reflection at the open boundary across the middle of the Bay of Fundy (), time dependent sea level at a number of sites extending from the turbine site to the open boundary is compared with that in cases without power extraction and the changes are found to be negligible (results not shown). However, the authors recognize that the location of the open boundary in the present model should be extended to the shelf edge if an extreme case based on significant energy extraction from a complete section of the Minas Passage is discussed in the future.
Acknowledgements
We thank C. Hannah and M. Li for their many helpful suggestions. B. Law and A. Drozdowski read an early version of the paper and provided helpful comments and suggestions for improvement. We also gratefully acknowledge two anonymous reviewers for providing helpful comments on this manuscript.
Additional information
Funding
References
- Amos, C. L. (1985). The sedimentation effect of tidal power development in the Minas Basin, Bay of Fundy (Department of Energy, 18). Dartmouth, Nova Scotia, Geological Survey of Canada.
- Amos, C. L., Buckley, D. E., Daborn, G. R., Dalrymple, R. W., McCann, S. B., & Rick, M. J. (1980). Trip23: Geomorphology and sedimentology of the Bay of Fundy. Dartmouth, Nova Scotia: Bedford Institute of Oceanography.
- Amos, C. L., & Joice, G. H. E. (1977). The sediment budget of the Minas Basin, Bay of Fundy, N.S. Bedford Institute of Oceanography (Data Series Report, BI-D-77-3). Dartmouth, Nova Scotia: Bedford Institute of Oceanography.
- Blumberg, A. F., & Mellor, G. L. (1987). A description of a three-dimensional coastal ocean circulation model. In N. Heaps (Ed.), Three-dimensional coastal ocean models (Vol. 4, pp. 1–16). Washington, D.C.: American Geophysical Union.
- Blunden, L. S., & Bahaj, A. S. (2007). Tidal energy resource assessment for tidal stream generators. Proceedings of the Institution of Mechanical Engineers, Part A: Journal of Power and Energy, 221, 137–146.
- Bryden, I. G., & Melville, G. T. (2004). Choosing and evaluating sites for tidal current development. Proceedings of the Institution of Mechanical Engineers, Part A: Journal of Power and Energy, 218, 567–577.
- Chen, C., Beardsley, R. C., & Cowles, G. (2006). An unstructured grid, finite-volume coastal ocean model (FVCOM) system. Oceanography, 19, 78–89. doi: 10.5670/oceanog.2006.92
- Chen, C., Cowles, G., & Beardsley, R. C. (2004). An unstructured grid, finite-volume coastal ocean model: FVCOM user manual (SMAST/UMASSD Technical Report-04-0601). New Bedford, MA, USA: University of Massachusetts-Dartmouth.
- Chen, C., Liu, H., & Beardsley, R. C. (2003). An unstructured grid, finite-volume, three-dimensional, primitive equations ocean model: Application to coastal ocean and estuaries. Journal of Atmospheric and Oceanic Technology, 20, 159–186. doi: 10.1175/1520-0426(2003)020<0159:AUGFVT>2.0.CO;2
- Dupont, F., Hannah, C. G., Greenberg, D. A., Cherniawsky, J. Y., & Naimie, C. E. (2002). Modelling system for tides for the northwest Atlantic coastal ocean. Canadian Technical Report of Hydrography and Ocean Sciences no. 221, Dartmouth, Nova Scotia: Department of Fisheries and Oceans.
- Garrett, C., & Cummins, P. (2004). Generating power from tidal currents. Journal of Waterway, Port, Coastal, and Ocean Engineering. Ocean Engineering, 130, 114–118. doi: 10.1061/(ASCE)0733-950X(2004)130:3(114)
- Garrett, C., & Cummins, P. (2005). The power potential of tidal currents in channels. Proceedings of the Royal Society A: Mathematical, Physical and Engineering Sciences, 461, 2563–2572. doi: 10.1098/rspa.2005.1494
- Hagerman, G., Fader, G., Carlin, G., & Bedard, R. (2006). EPRI Nova Scotia tidal in-stream energy conversion (TISEC): Survey and characterization of potential project sites (EPRI-TP-003 Rev. 2). Palo Alto, California.
- Hasegawa, D., Sheng, J., Greenberg, D. A., & Thompson, K. R. (2011). Far-field effects of tidal energy extraction in the Minas Passage on tidal circulation in the Bay of Fundy and Gulf of Maine using a nested-grid coastal circulation model. Ocean Dynamics, 61, 1845–1868. doi: 10.1007/s10236-011-0481-9
- Karsten, R. H., McMillan, J. M., Lickley, K. J., & Haynes, R. D. (2008). Assessment of tidal current energy in the Minas Passage, Bay of Fundy. Proceedings of the Institution of Mechanical Engineers, Part A: Journal of Power and Energy, 222, 493–507. doi: 10.1243/13506501JET363
- Li, M. Z., Hannah, C., Perrie, W., Tang, C. L., Prescott, R., & Greenberg, D. A. (2010). Numerical model predictions of seabed shear stress, sediment mobility and sediment transport in the Bay of Fundy. Abstract with program, Atlantic Geoscience Society (AGS) Colloquium 2010, Wolfville, Nova Scotia, February 5–6.
- Long, B. F. N. (1979). The nature of bottom sediments in the Minas Basin system, Bay of Fundy (Bedford Institute of Oceanography Data Series, BI-D-79-4, No. vi). Dartmouth, Nova Scotia: NRCan.
- Meyer-Peter, E., & Müller, R. (1948). Formulas for bed-load transport. In W. Fellenius (Ed.), Proc., 2nd meeting (pp. 39–64). Stockholm, Sweden: IAHR.
- Neill, S. P., Litt, E. J., Couch, S., & Davies, A. G. (2009). The impact of tidal stream turbines on large-scale sediment dynamics. Renewable Energy, 34, 2803–2812. doi: 10.1016/j.renene.2009.06.015
- Pawlowicz, R., Beardsley, B., & Lentz, S. (2002). Classical tidal harmonic analysis including error estimates in MATLAB using T_TIDE. Computers and Geosciences, 28, 929–937. doi: 10.1016/S0098-3004(02)00013-4
- Polagye, B. (2009). Hydrodynamic effects of kinetic power extraction by in-stream tidal turbines (Ph.D. Dissertation). University of Washington.
- Polagye, B., Malte, P., Kawase, M., & Durran, D. (2008). Effect of large-scale kinetic power extraction on time-dependent estuaries. Proceedings of the Institution of Mechanical Engineers, Part A: Journal of Power and Energy, 222, 471–484. doi: 10.1243/13506501JET393
- Polagye, B., Van Cleve, B., Copping, A., & Kirkendall, K. (Eds.). (2011). Environmental effects of tidal energy development: Proceedings of a scientific workshop, March 22–25, 2010. Seattle, Washington: NOAA Technical Memorandum NMFS F/SPO-116.
- Thresher, R., & Musial, W. (2010). Ocean renewable energy's potential role in supplying electrical energy needs. Oceanography, 23, 16–21. doi: 10.5670/oceanog.2010.39
- Walters, R. A., & Plew, D. R. (2008). Numerical modelling of environmental flows using DAM: Some preliminary results. Acta Geophysica, 56, 918–934. doi: 10.2478/s11600-008-0024-z
- Walters, R. A., Tarbotton, M. R., & Hiles, C. E. (2013). Estimation of tidal power potential. Renewable Energy, 51, 255–262. doi: 10.1016/j.renene.2012.09.027
- Wu, Y., Chaffey, J., Greenberg, D. A., Colbo, K., & Smith, P. C. (2011). Tidally-induced sediment transport patterns in the upper Bay of Fundy: A numerical study. Continental Shelf Research, 31, 2041–2053. doi: 10.1016/j.csr.2011.10.009
- Wu, Y., Chaffey, J., Law, B., Greenberg, D. A., Drozdowski, A., Page, F., & Haigh, S. (2014). A three-dimensional hydrodynamic model for aquaculture: A case study in the Bay of Fundy. Aquaculture Environment Interactions, 5, 235–248. doi: 10.3354/aei00108
- Xia, J., Falconer, R. A., & Lin, B. (2010). Impact of different tidal renewable energy projects on the hydrodynamic processes in the Severn Estuary, UK. Ocean Modelling, 32, 86–104. doi: 10.1016/j.ocemod.2009.11.002