
ABSTRACT
This analysis compares the climate impacts over North America during winter associated with various El Niño–Southern Oscillation (ENSO) indices, including the Niño 3.4 index, the leading tropical Pacific outgoing longwave radiation and sea surface temperature (OLR-SST) covariability, and the eastern Pacific (EP) and central Pacific (CP) types of ENSO identified from both partial-regression–empirical orthogonal function (EOF) and regression–EOF approaches. The traditional Niño 3.4 SST index is found to be optimal for monitoring the tropical Pacific OLR-SST covariability and for the tropical SST impact on North America. The circulation anomalies associated with the Niño 3.4 index project on both the Pacific/North American (PNA) and Tropical/Northern Hemisphere (TNH) patterns. The ENSO associated with the PNA tends to come from both the EP and CP ENSOs, whereas that associated with the TNH comes more from the EP ENSO. The variability of ENSO significantly affects North American temperature and precipitation, as well as temperature and precipitation extremes. For either the EP or CP types of ENSO, qualitatively similar patterns of climate and climate extreme anomalies are apparent associated with the indices identified by the two EOF approaches, with differences mainly in the anomalous amplitude. The anomalous patterns are generally field significant over North America for the EP ENSO but not field significant for the CP ENSO.
The circulation anomalies associated with ENSO are reinforced and maintained by synoptic vorticity fluxes in the upper troposphere. The anomalous surface temperature is mainly determined by the anomalies in surface radiative heating in the face of upward surface longwave radiative damping. The precipitation anomalies are supported by the vertically integrated moisture transport. The differences in atmospheric circulation, surface temperature, and precipitation among the various ENSO indices, including the intensity and spatial structure of the fields, can be attributed to the corresponding differences in synoptic eddy vorticity forcing, surface radiative heating, and vertically integrated moisture transport.
Résumé
[Traduit par la rédaction] Cette analyse pousse plus avant la comparaison entre les impacts du climat hivernal en Amérique du Nord et divers indices liés au phénomène El Niño-oscillation australe (ENSO), y compris l'indice NINO 3.4, le mode principal de la covariabilité du rayonnement de grande longueur d'onde du Pacifique tropical et de la température de la surface de la mer (OLR-SST), et le régime El Niño du Pacifique central et celui du Pacifique Est déterminés à partir de régressions et de régressions partielles, ainsi que de fonctions orthogonales empiriques (FOE). L'indice usuel NINO 3.4 représentant la SST s'avère optimal pour surveiller la covariabilité de l'OLR-SST du Pacifique tropical et pour déterminer l'impact de la SST tropicale sur l'Amérique du Nord. La configuration des anomalies de la circulation associées à l'indice NINO 3.4 ressemble aux systèmes du Pacifique et de l'Amérique du Nord (PAN), ainsi qu’à ceux des tropiques et de l'hémisphère nord (THN). Les régimes ENSO touchant la région du PAN ont tendance à venir à la fois du Pacifique Est et du Pacifique central, tandis que la région des THN est touchée surtout par le régime ENSO du Pacifique central. La variabilité du phénomène ENSO perturbe de façon significative les températures et les précipitations nord-américaines, ainsi que les températures et les précipitations extrêmes. Les deux régimes ENSO (est et central) présentent dans les systèmes et les extrêmes climatiques des anomalies qualitativement semblables, et associées aux indices calculés par les deux types de régression avec FOE. Il apparaît surtout des différences dans les anomalies d'amplitude. La distribution des anomalies est généralement globalement significative sur l'Amérique du Nord pour le régime ENSO du Pacifique Est, mais non globalement significative pour celui du Pacifique central.
Les flux synoptiques de tourbillon dans la haute troposphère renforcent et maintiennent les anomalies de la circulation associées au phénomène ENSO. Les anomalies de réchauffement radiatif en surface déterminent principalement les anomalies de température en surface en présence de l'amortissement radiatif de grandes longueurs d'onde. Les anomalies de précipitations sont liées au transport de l'humidité intégré verticalement. Les différences dans la circulation atmosphérique, la température en surface et les précipitations que montrent les divers indices relatifs au phénomène ENSO, y compris l'intensité et la structure spatiale des champs, peuvent être attribuées aux différences correspondantes dans le forçage du tourbillon synoptique, le réchauffement radiatif en surface et le transport de l'humidité intégré verticalement.
1 Introduction
The El Niño–Southern Oscillation (ENSO) is the dominant mode of interannual climate variability in the tropics. The impact of ENSO on climate has been extensively investigated. During ENSO events, anomalous atmospheric heating over the tropical eastern Pacific (EP) and central Pacific (CP) affects atmospheric circulation features, such as jet streams and storm tracks in the mid-high latitudes, resulting in temperature and precipitation anomalies in many regions (e.g., Trenberth et al., Citation1998 and references therein; Hoerling & Kumar, Citation2000; DeWeaver & Nigam, Citation2002; Seager et al., Citation2005). For example, most El Niño winters are accompanied by warm weather over most of Canada and parts of the northern United States, as well as cold and wet weather over the southern United States (e.g., Harrison & Larkin, Citation1997; Larkin & Harrison, Citation2005; Lau, Leetmaa, & Nath, Citation2008; Ropelewski & Halpert, Citation1986, Citation1996; Smith, Legler, Remigio, & O'Brien, Citation1999). However, as pointed out recently by Zhang, Hoerling, Perlwitz, Sun, and Donald (Citation2011), most studies of mechanisms affected by ENSO have focused on atmospheric teleconnections, which cannot explain the immediate causes of remote temperature and precipitation anomalies. Thus, they investigated the physics of the response of surface temperature to ENSO by examining the surface energy balance directly and found that wintertime surface temperature anomalies in the United States associated with ENSO are determined principally by anomalies in surface radiative heating. The anomalous radiation budget is closely linked to the anomalous convergence of atmospheric water vapour transport and anomalies in tropospheric column temperature.
Recent studies also suggested that ENSO may be classified into EP and CP events (e.g., Ashok, Behera, Rao, Weng, & Yamagata, Citation2007; Larkin & Harrison, Citation2005; Yu & Kao, Citation2007; Kao & Yu, Citation2009; Yeh et al., Citation2009; Kug, Jin, & An, Citation2009; Lopez & Kirtman, Citation2013; Wu, Chen, He, & Chen, Citation2014). The EP ENSO has maximum sea surface temperature (SST) anomalies near the tropical South American coast, whereas the CP ENSO has maximum anomalies over the tropical central Pacific. Meanwhile, atmospheric general circulation model experiments indicated that atmospheric responses to ENSO depend on the location and magnitude of SST anomalies (e.g., Barsugli & Sardeshmukh, Citation2002; Hoerling & Kumar, Citation2002; Hoerling, Kumar, & Zhong, Citation1997; Trenberth et al., Citation1998). Because the two types of ENSO have different SST patterns and atmospheric responses (e.g., Mo, Citation2010; Weng, Behera, & Yamagata, Citation2009), it is expected that they would have different impacts on the climate over North America (e.g., Mo, Citation2010; Yu & Zou, Citation2013; Yu, Zou, Kim, & Lee, Citation2012).
On the other hand, deep atmospheric convection in the tropics is well represented by outgoing longwave radiation (OLR). The OLR variability is found to be associated with local and remote atmospheric circulation anomalies (e.g., Chiodi & Harrison, Citation2010; Garreaud & Wallace, Citation1997; Lau, Wu, & Bony, Citation1997; Trenberth et al., Citation1998). Thus OLR behaviour over the equatorial eastern Pacific has also been added to El Niño events, termed “OLR–El Niño events” by Chiodi and Harrison (Citation2010, Citation2013), in considering the impact of ENSO on North America. Specifically, they examined the maximum covariance of tropical OLR and global 500 hPa geopotential height anomalies to determine the patterns of OLR variability that are most strongly linked to broad-scale atmospheric circulation anomalies. The newly identified events are found to produce more robust patterns of composite seasonal US atmospheric circulation, temperature, and precipitation anomalies, compared with non-OLR–El Niño events.
Our analysis further compares climate impacts over North America in winter associated with various ENSO indices. In particular, we attempt to address the following issues. i) Which of the commonly used ENSO-related indices is optimal for monitoring the tropical Pacific atmospheric and oceanic covariability and for the tropical SST impact on North America? Unlike Chiodi and Harrison (Citation2010, Citation2013), we examine the wintertime interannual covariability of OLR and SST anomalies in the tropical Pacific and analyze its associated climate anomalies over North America. Our approach highlights the tropical atmospheric and oceanic variability because the tropical atmospheric circulation is primarily thermally driven (e.g., Peixoto & Oort, Citation1992). ii) Do various climate patterns affected by ENSO, as demonstrated in previous studies, have field significance over North America? This is an important issue in terms of the anomalous climate patterns and is a neglected aspect of previous studies that performed local and individual significance tests of climate anomalies associated with ENSO. iii) What are the mechanisms of dynamical (thermodynamical) maintenance, including the influence of synoptic eddies on the upper tropospheric circulation, moisture transport on precipitation, and the energy balance on surface temperature, for various climate anomalies related to ENSO. iv) What anomalous North American climate extremes are associated with various ENSO indices?
2 Data and methodology
a Data
Our analysis is mainly based on the December–February (DJF) monthly SST and atmospheric fields for the 1980–2011 period. Years are labeled according to the January dates in this study. Monthly SST data were obtained from the Met Office Hadley Centre's Sea-Ice and SST dataset, version 1 (HadISST1.1; Rayner et al., Citation2003). The OLR data were retrieved from the National Oceanic and Atmospheric Administration/Earth System Research Laboratory (NOAA/ESRL; http://www.esrl.noaa.gov/psd/data/gridded/data.interp_OLR.html), with data originally from the National Center for Atmospheric Research (NCAR) archives with gaps filled by temporal and spatial interpolation (Liebmann & Smith, Citation1996). The precipitation data employed are from the Climate Prediction Center (CPC) merged analysis of precipitation (Xie & Arkin, Citation1997). The monthly geopotential height, horizontal wind velocity, specific humidity, and daily horizontal wind data were extracted from the National Centers for Environmental Prediction-NCAR (NCEP-NCAR) reanalysis (hereafter NCEP; Kistler et al., Citation2001). All these variables are interpolated to a standard 2.5° × 2.5° grid. In addition, the daily surface skin temperature (SST over the ocean) and heat fluxes were also extracted from the NCEP reanalysis. The monthly surface temperature and flux variables were averaged from their daily values and were diagnosed on 192 × 94 Gaussian grids.
The monthly temperature and precipitation extreme indices were obtained from the HadEX2 dataset (http://www.climdex.org/indices.html) led by the Expert Team on Climate Change Detection and Indices (ETCCDI; Donat et al., Citation2013). The percentage of time when the daily maximum or minimum temperature is above the 90th percentile (TX90p and TN90p, respectively), the percentage of time when the daily maximum or minimum temperature is below the 10th percentile (TX10p and TN10p, respectively), and the maximum five-day precipitation amount (Rx5day) from 1980 to 2011 over North America (20°–60°N, 140°–60°W) were used. The extreme indices are available on 2.5° × 3.75° latitude-longitude grids. The ENSO-related indices, including the monthly Niño 1 + 2 (0°–10°S, 90°–80°W), Niño 3 (5°S–5°N, 150°–90°W), Niño 4 (5°S–5°N, 160°E–150°W), and Niño 3.4 (5°S–5°N, 170°–120°W) SST indices, derived from the Optimum Interpolation Sea Surface Temperature, version 2 (OISST.v2; Reynolds, Rayner, Smith, Stokes, & Wang, Citation2002), were obtained from the CPC (http://www.cpc.ncep.noaa.gov/data/indices). The Pacific/North American (PNA; Wallace & Gutzler, Citation1981) and Tropical/Northern Hemisphere (TNH; Mo & Livezey, Citation1986) atmospheric teleconnection indices were also obtained from the CPC website. The El Niño Modoki index (EMI; Ashok et al., Citation2007) from 1980 to 2011, based on OISST.v2, was obtained from the Japan Agency for Marine-Earth Science and Technology http://www.jamstec.go.jp/frcgc/research/d1/iod/enmodoki_home_s.html.en.
b Identification of EP and CP Types of ENSO
A variety of methods have been proposed to define the EP and CP types of ENSO. For example, Ashok et al. (Citation2007) defined a CP ENSO, termed the El Niño Modoki, associated with strong anomalous warming in the tropical central Pacific and cooling in the tropical eastern and western Pacific, as being characterized by the second EOF mode of interannual SST variability in the tropical Pacific. Kao and Yu (Citation2009) used an EOF combined with a regression analysis to identify EP and CP types of ENSO. They subtracted the SST anomalies regressed with the Niño 4 (Niño1 + 2) index before performing an EOF analysis to obtain the spatial pattern of the EP (CP) ENSO. In addition, given that the two types of ENSO can coexist (e.g., Yu, Kao, & Lee, Citation2010), contrasting SST anomalies in a specific region cannot be used to separate these two events completely because they may contribute to SST variation in the same region. Thus, the two types of ENSO were also identified using partial-regression–EOF analysis, which separates the effect of each independent variable on the dependent variable with the influence of the remaining independent variables held constant (Lopez & Kirtman, Citation2013). In this analysis, the EP and CP ENSOs are identified using both partial-regression–EOF and regression–EOF methods. We compare the tropical OLR and SST variability, as well as North American climate anomalies associated with the two types of ENSO identified by the two approaches.
c Diagnostic Methods
To assess SST and OLR variability, we applied the following procedure to the data. For the time series from 1980 to 2011, the linear trend over the 32 DJFs is subtracted from the original data at each grid point. Maximum covariance analysis (MCA; Bretherton, Smith, & Wallace, Citation1992; Wallace, Smith, & Bretherton, Citation1992) is employed to characterize the spatiotemporal pattern of maximum covariance between SST and OLR anomalies over the tropical Pacific; EOF analysis is also employed to characterize the principal mode of interannual SST (OLR) anomalies over the tropical Pacific. The relationship between a time series of interest and the associated atmospheric circulation, temperature, precipitation, and extreme anomalies is quantified through linear regression and correlation. The statistical significance level of a correlation is determined by a Student's t-test, assuming one degree of freedom per DJF. Similar results for significance tests are obtained using the effective sample size estimated following Bretherton, Widmann, Dymnikov, Wallace, and Bladé (Citation1999) by considering the autocorrelation of the time series of interest. The field significance of anomalous patterns within domains of interest are also assessed (e.g., Livezey & Chen, Citation1983; Yu & Zwiers, Citation2007).
The geopotential eddy activity associated with stationary wave anomalies in the upper troposphere is examined to help in understanding the maintenance of atmospheric circulation anomalies (e.g., Choi et al., Citation2010; Kug & Jin, Citation2009; Lau, Citation1988; Trenberth & Hurrell, Citation1994; Yu & Lin, Citation2012). The synoptic eddy vorticity forcing (Fv), which represents the geopotential tendency, can be written as,(1)
where f is the Coriolis parameter, V(u,v) the horizontal wind velocity, and ζ the relative vorticity. The prime denotes the 2–8 day bandpass-filtered synoptic perturbation, obtained by applying a Butterworth bandpass filter to retain the fluctuation (Murakami, Citation1979). The bar denotes the DJF wintertime mean; Fv is obtained by solving the Poisson equation globally with the divergence of eddy vorticity fluxes as the forcing term (Yu & Lin, Citation2012).
Analysis of the surface energy budget helps in understanding the maintenance of surface temperature anomalies (e.g., Wild, Ohmura, Gilgen, & Rosenfeld, Citation2004; Yu & Boer, Citation2002; Zhang et al., Citation2011). The surface energy budget over land can be written as,(2) where Cs is the surface layer heat capacity; Ts is the surface temperature;
is the net surface shortwave radiation, which is the sum of the downward (Rsd) and upward (Rsu) solar radiation across the surface;
is the net surface longwave radiation, which is the sum of the surface downward (Rld) and upward (Rlu) infrared radiation;
is the surface net radiation; B = LH + SH is the surface turbulent heat flux, which is the sum of the latent (LH) and sensible (SH) energy exchanges across the surface; Fg is the ground heat flux; and Fm is the surface energy flux used for melt. Note that all fluxes are defined as positive downward (i.e., in the direction that will increase Ts). In addition, as demonstrated by Wild et al. (Citation2004) and Zhang et al. (Citation2011), for the DJF time-averaged state considered here, the last two terms (Fg + Fm) on the right-hand side of Eq. (2) are negligible. Thus, only the surface radiative and turbulent heat flux anomalies are examined for surface temperature maintenance.
The moisture budget is also examined by calculating the vertically integrated equation for conservation of water vapour to help understand moisture transport. Following Hurrell (Citation1995), the moisture budget is calculated using the vertically integrated equation for conservation of water vapour, ignoring the role of liquid water in the atmosphere and the local rate of change term:(3)
where E is evaporation, P precipitation, q specific humidity, p pressure, ps surface pressure, and g acceleration due to gravity. Specific humidity data are available at eight vertical levels from 300 to 1000 hPa in the NCEP reanalysis.
3 Different types of ENSO variability
a ENSO and Tropical OLR and SST Covariability
ENSO has been characterized by interannual SST variations in the equatorial central and eastern Pacific and is typically categorized by means of the Niño 3.4 SST index (e.g., Anderson, Citation2007; Deser et al., Citation2012; Philander & Rasmusson, Citation1985; Trenberth, Citation1997). The current operational ENSO index in use at CPC, NOAA, is also the Niño 3.4 SST index or the oceanic Niño index (ONI; Kousky & Higgins, Citation2007).
(top panels) displays the OLR and SST anomalies regressed on the Niño 3.4 index in the tropical Pacific (30°S–30°N, 120°E–70°W). In association with the Niño 3.4 index, the anomalous OLR pattern tends to be characterized by negative OLR anomalies over the equatorial central Pacific, with a minimum located at 0°–5°S, 170°W, accompanied by anomalies of the opposite sign over the equatorial northwestern Pacific and the south Pacific convergence zone (SPCZ). This indicates enhanced convection and anomalous rising motion over the equatorial central Pacific and suppressed convection and sinking over the western Pacific. The anomalous vertical motions tend to weaken the climatological mean rising branch of the Pacific Walker cell over the western Pacific but strengthen its rising over the central Pacific (e.g., Peixoto and Oort (Citation1992), their Fig. 16.5), suggesting an eastward shift of the Pacific Walker cell during the positive Niño 3.4 phase. The anomalies over the subtropical Pacific are related to the downward branches of the Hadley circulation. The anomalous SST pattern exhibits temperatures that are higher than normal in the tropical central and eastern Pacific, with maxima around equatorial 140°W, surrounded by a horseshoe of temperatures that are lower than average in the western Pacific. The largest SST warming is located approximately 30° longitude further east than the strongest anomalous convection, illustrated by the OLR anomalies. The SST, convection, and inferred tropical circulation anomalies associated with Niño 3.4 feature the general characteristics of ENSO, as described in previous studies (e.g., McPhaden et al., Citation1998; Wallace et al., Citation1998).
Fig. 1 Regressions of OLR (top left, contours 4 W m−2) and SST (top right, contours 0.2°C) anomalies on the normalized Niño 3.4 index. The leading mode of MCA between OLR (middle left, contours 4 W m−2) and SST (middle right, contours 0.2°C) anomalies in the tropical Pacific. Time series of normalized Niño 3.4 index (red) and the leading MCA expansion coefficients of OLR (EC1-OLR, green) and SST (EC1-SST, blue) anomalies (lower panel). Results are based on 32 winters (DJF) from 1980 to 2011.
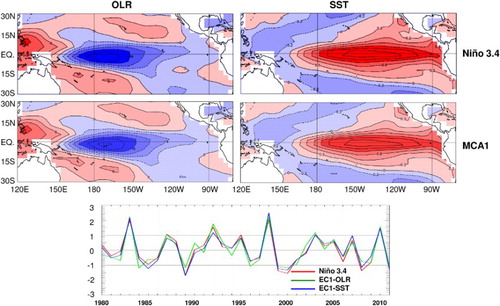
(middle panels) further displays the leading mode of MCA between DJF mean OLR and SST anomalies in the tropical Pacific. This is the dominant interannual covariability mode that explains 93.5% of the total squared covariance and accounts for 52.3% of total DJF interannual OLR variance and 54.1% of SST variance for the two individual fields. The leading OLR and SST patterns are also the corresponding leading EOF modes of the two fields in the tropical Pacific in terms of spatial distribution and amplitude (not shown). It is apparent both visually and from the spatial correlation (better than 0.97 for both OLR and SST fields in the tropical Pacific) that the leading MCA patterns are nearly identical to the OLR and SST patterns associated with Niño 3.4.
The expansion coefficients of OLR and SST anomalies for the leading MCA mode (EC1-OLR and EC1-SST; (bottom panel)) are highly correlated (r = 0.94, significant at the 1% level), indicating that the wintertime OLR and SST are strongly coupled to each other in the tropical Pacific. Another consequence of the high correlation is that similar significant relationships to the OLR-SST covariability are expected no matter which index is used. Thus the EC1-OLR is employed to represent the OLR-SST covariability in the following analysis and is referred to as the EC1 index. Time series analysis reveals that all the extreme values in the Niño 3.4 index (red, , bottom) correspond well to the extremes in the EC1 time series (green, , bottom). The correlation between them is 0.94, indicating that the leading covariability of OLR and SST anomalies in the tropical Pacific is captured well by the Niño 3.4 index.
b EP and CP Types of ENSO
EP and CP ENSOs are identified using both partial-regression–EOF and regression–EOF approaches as described above. Similar to Lopez and Kirtman (Citation2013), the DJF mean SST anomalies that are correlated to the EMI (Niño 3) index but not to the Niño 3 (EMI) index are removed before performing an EOF analysis (e.g., Zhang, Wallace, & Iwasaka, Citation1996). The leading principal component of the residual SST anomalies in the tropical Pacific is then used as an EP (CP) ENSO index and is referred to as the TE1 (TC1) index in our study. The identified EP (CP) pattern explains 51.2% (41.1%) of the corresponding residual SST variance. Meanwhile, similar to Kao and Yu (Citation2009), the DJF mean SST anomalies regressed with the Niño 4 (Niño 1 + 2) SST index are removed before performing an EOF analysis to obtain another EP (CP) index, termed the TE2 (TC2) index. The identified EP (CP) pattern explains 33.3% (39.8%) of the corresponding residual SST variance in the tropical Pacific. In addition, it is worth noting that the identified TE1 and TC1 indices closely resemble the corresponding time series (r≈0.90) calculated using the Niño 4 (Niño 1 + 2) index to replace the EMI (Niño 3) index in the partial-regression–EOF analysis.
displays the OLR and SST anomalies associated with the CP and EP ENSOs. In general, good correspondence is seen from the above two approaches, especially for the CP type of ENSO. The centres of action of OLR and SST anomalies associated with the CP (EP) ENSO shift west (east) by about 20°–30° compared with their counterparts associated with Niño 3.4 and the leading MCA mode (cf. with ). For the CP type of ENSO (, top two rows), the OLR anomalies are mostly confined to the equatorial central Pacific with a minimum at 175°E. The SST anomalies are dominated by positive values in the central Pacific between 160°E and 120°W, covering the Niño 4 and Niño 3.4 regions, consistent with previous studies (e.g., Kao & Yu, Citation2009; Lopez & Kirtman, Citation2013). The spatial correlation of OLR (SST) anomalies between the two approaches is 0.99 (0.99) over the domain of interest in , indicating that the features in the two associated patterns are nearly identical. The temporal correlation between the TC1 and TC2 indices is 0.98, significant at the 1% level. The correlations are 0.83 (0.74) between TC1 (TC2) and the Niño 4 index and 0.68 (0.60) between the TC1 (TC2) and the Niño 3.4 index ( and , top). Thus, the results obtained from the two approaches agree quite well. The TC1 and TC2 indices are also closely correlated with the EMI index (correlation r = 0.92, ).
Fig. 2 Regressions of OLR (left, contours 4 W m−2) and SST (right, contours 0.2°C) anomalies on the TC1, TC2, TE1, and TE2 indices (from top to bottom).
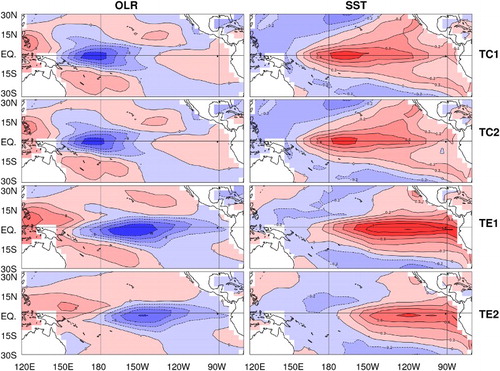
Fig. 3 Time series of normalized Niño 3.4 (red), Niño 4 (orange), TC1 (green), and TC2 (blue) indices (top panel). Time series of normalized Niño 1 + 2 (red), Niño 3 (orange), TE1 (green), and TE2 (blue) indices (bottom panel).
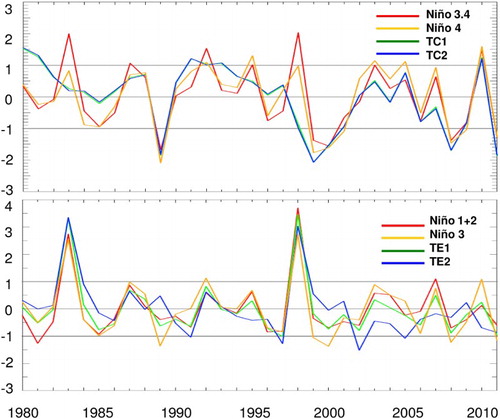
Table 1. Correlation coefficients among the leading MCA expansion coefficients of the OLR anomalies, the central Pacific and eastern Pacific ENSO indices, the different Niño indices, and the TNH and PNA teleconnection indices. Numbers in bold indicate a correlation significant at the 5% level (correlation r ≥ 0.35) determined by a Student's t-test, assuming one degree of freedom per DJF. EC1 denotes the leading MCA expansion coefficient of the OLR anomalies. EMI is the El Niño Modoki index; TC1, TC2, TE1, and TE2 are the central Pacific and eastern Pacific ENSO indices defined in the text. N12 is the Niño 1 + 2 index, N3 the Niño 3 index, N4 the Niño 4 index, and N34 the Niño 3.4 index. The calculations are based on the DJF mean variables from 1980 to 2011.
For the EP type of ENSO (, bottom two rows), the OLR anomalies are mostly confined to the equatorial central and eastern Pacific with the strongest anomalous convection located around 150°W. The SST anomalies tend to be characterized by anomalous warming extending from the South American coast into the central Pacific along the equator, mainly covering the Niño 1 + 2 and Niño 3 regions, also in agreement with previous studies (e.g., Kao & Yu, Citation2009; Lopez & Kirtman, Citation2013). The results of the two approaches are qualitatively similar. However, the OLR and SST anomalies associated with TE1 are somewhat stronger than their TE2 counterparts. Additionally, the dominant OLR and SST anomalies associated with TE1 extend slightly more westward (about 10°) than the anomalies associated with TE2. The spatial correlation of OLR (SST) anomalies between the two approaches is 0.91 (0.94) over the domain analyzed, lower than that of the anomalies associated with the CP ENSO. The difference is also seen in the TE1 and TE2 time series, especially for the post-1999 period (, bottom). Accordingly, the temporal correlation between the TE1 and TE2 indices is 0.86, also lower than that between the TC1 and TC2 indices. In addition, the correlations are 0.91 (0.74) between TE1 (TE2) and the Niño 1 + 2 index, 0.83 (0.58) between TE1 (TE2) and the Niño 3 index, and 0.61 (0.39) between TE1 (TE2) and the Niño 3.4 index ( and , bottom).
c Relations of the Leading Covariability to Various ENSO Indices
The relationships between the EC1 index and the EP and CP ENSO indices, as well as various ENSO-related Niño SST indices, are further compared in . The variance of the leading tropical Pacific OLR-SST covariability is indicated by EC1 and thus has relationships with both EP and CP ENSOs and with various Niño SST indices. The correlations between the EC1 and various CP ENSO indices, including the EMI, are comparable (r≈0.4–0.5, ). The correlation of EC1 with the TE1 index is 0.76, but only 0.39 with the TE2 index, mainly because of the difference between the TE2 and TE1 time series after 1999. The correlation of EC1 with all Niño indices is high (greater than 0.79) because its dominant SST anomalies appear in the tropical central and eastern Pacific (). Yet, it is interesting that the highest correlation among these is the relationship between the EC1 and the Niño 3.4 indices. The leading tropical OLR-SST covariability is captured well by the Niño 3.4 SST index, confirming that the Niño 3.4 region has the strongest ocean–atmosphere coupling in the tropical Pacific (e.g., Barnston, Chelliah, & Goldenberg, Citation1997).
4 Impacts of various ENSO indices on the North American climate
a Atmospheric Circulation
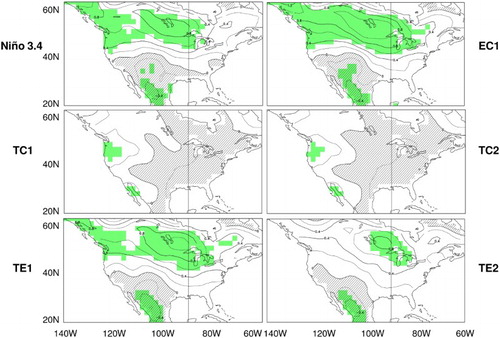
displays the 500 hPa geopotential height Φ500 anomalies associated with the Niño 3.4, EC1, TC1, TC2, TE1, and TE2 indices over the Pacific–North American sector. The Φ500 anomalies associated with Niño 3.4 and EC1 (, top panels) closely resemble each other in terms of both spatial structure and amplitude. The circulation anomalies tend to be characterized by negative anomalies located south of the Aleutian Islands and from the Gulf of Mexico extending northeastward across the western North Atlantic, together with positive anomalies over much of central Canada and the northern United States. Also, an anomalous centre is apparent over Mexico. The anomalous circulation is also similar to the Φ500 anomalies associated with the leading principal component of the tropical Pacific SST variability for DJFs from 1950 to 1999 (Hoerling & Kumar, Citation2002), indicating the stationarity of the anomalous circulation attributed to ENSO forcing. The anomalous centres of action are significantly correlated with the two indices at the 5% level (green shading in ), determined from the correlation coefficients. The field significance of the anomalous circulation pattern is then assessed. Within the domain of interest (20°–80°N, 150°E–30°W), about 16 EOFs of Φ500 anomalies are required to represent 95% of the total variance of the DJF mean geopotential height. According to Livezey and Chen (Citation1983), a rejection rate of about 21% is field significant at the 5% significance level in a field with 16 or more spatial degrees of freedom. Therefore, those locations with rejection rates of 21% or higher very likely indicate field significance at the 5% level (e.g., Wang & Swail, Citation2005; Yu & Zwiers, Citation2007; Zwiers, Wang, & Sheng, Citation2000). Over this analysis domain, more than 35% of the grid points of Φ500 anomalies are significantly correlated with the Niño 3.4 and EC1 indices (), suggesting that the anomalous pattern is field significant at the 5% level.
Fig. 4 500 hPa geopotential Φ500 anomalies (contours 60 m2 s−2) regressed on the Niño 3.4, EC1, TC1, TC2, TE1, and TE2 indices. Negative values are cross-hatched. The anomalies that are significantly correlated with the corresponding index at the 5% level are shaded green.
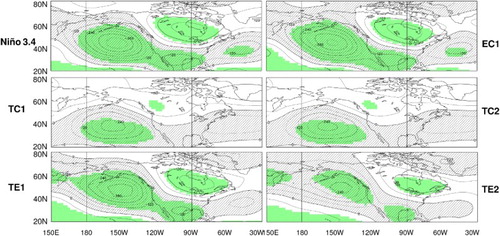
Table 2. The percentage area in which the field anomalies are found to be significantly correlated with the corresponding index at the 5% level. NEOF denotes the number of EOFs required to represent 95% of the total variance of the winter mean anomalies in each analysis domain. The corresponding rejection rates for field significance at the 5% level are denoted by 5% FRR. Φ500 anomalies are estimated for 20°–80°N, 150°E–30°W, and surface temperature and precipitation, temperature and precipitation extremes, and surface heat flux anomalies are estimated over North America (20°–60°N, 140°–60°W).
The Φ500 anomalies associated with Niño 3.4 and EC1 somewhat resemble both the PNA (Wallace & Gutzler, Citation1981) and TNH (Mo & Livezey, Citation1986) patterns. The correlation between the Niño 3.4 index and the PNA (TNH) index is 0.59 (-0.55) from 1980 to 2011 (). The two correlation coefficients are comparable and both are significant at the 5% level, indicating the pronounced projections of ENSO-associated circulation anomalies on both the PNA and TNH patterns. It has been noted that the ENSO wavetrain is usually only associated with the PNA pattern (e.g., Hoerling & Kumar, Citation2002; Trenberth et al., Citation1998; Straus & Shukla, Citation2002; Yu & Zwiers, Citation2007). In fact, the correlation between the DJF mean PNA and TNH indices is −0.46, significant at the 5% level, indicating a close relationship between the two teleconnection patterns.
The circulation patterns associated with the CP and EP ENSOs resemble the ones associated with Niño 3.4 and EC1. However, the CP ENSO only exhibits significantly negative Φ500 anomalies south of the Aleutian Islands and patches of significantly positive anomalies over western Canada (, middle panels). The anomalous low is also displaced slightly equatorward for the CP ENSO compared with its Niño 3.4 counterpart, in agreement with Garfinkel, Hurwitz, Waugh, and Butler (Citation2013). In addition, the Φ500 anomalies here are generally weaker than those associated with the Niño 3.4 and EC1 indices, especially over North America. Hence, the geopotential height anomalies associated with TC1 and TC2 are not field significant at the 5% level (). Nevertheless, the CP ENSO indices are positively correlated with the PNA index, marginally significant at the 5% level and only weakly and negatively correlated with the TNH index (). Accordingly, atmospheric responses related to the CP ENSO somewhat resemble the PNA pattern, generally consistent with Mo (Citation2010), which is based on the Niño 3 index. In contrast, the EP ENSO features significantly negative Φ500 anomalies south of the Aleutian Islands and Mexico, as well as significantly positive anomalies over central and eastern Canada (, lower panels). The anomalies shift slightly eastward and are somewhat weaker in comparison with their Niño 3.4 and EC1 counterparts. The geopotential height anomalies associated with both the TE1 and TE2 are field significant () although the amplitude of the Φ500 anomalies associated with TE2 is about one-third lower than that associated with TE1. The TE1 index correlates with both the TNH and PNA indices, significant at the 5% level. However, the TE2 index is only marginally correlated with the TNH index at the 5% level and weakly correlated with the PNA index (). The resemblance between the anomalous circulation associated with the EP ENSO and the TNH pattern is also consistent with Mo (Citation2010), based on the Niño 4 index.
Overall, the circulation associated with ENSO projects not only on the positive phase of the PNA pattern but also on the negative phase of the TNH pattern. Separating ENSO into EP and CP types, we found that the ENSO associated with the PNA pattern tends to come from both the EP and CP ENSOs, whereas the association with the negative phase of the TNH comes more from the EP ENSO.
b Surface Temperature and Precipitation over North America
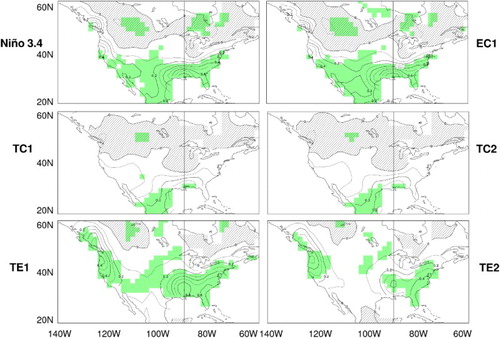
The surface temperature Ts patterns associated with Niño 3.4 and EC1 over North America are also similar and tend to be characterized by a north–south dipole pattern, in which warm anomalies are apparent over Canada and the northern United States with cold anomalies over Mexico and the southwestern United States (, top panels). These are the main features previously attributed to ENSO variability (e.g., Higgins, Leetmaa, & Kousky, Citation2002; Hurrell, Citation1996; Ropelewski & Halpert, Citation1986; Mo, Citation2010). Our analysis further indicates that the anomalous patterns are field significant at the 5% level over North America (). The anomalous circulation, especially the distinct above-average geopotential heights over central Canada and the northern United States (, top panels), may alter temperature advection, leading to the temperature anomalies.
Fig. 5 As in Fig. 4, but for surface temperature (contours 0.2°C).
The Ts anomalies associated with CP ENSO (, middle panels) are weaker than the Niño 3.4 and EC1 counterparts, consistent with the relatively weak circulation anomalies associated with the CP ENSOs, as discussed above. Consequently, the Ts pattern related to CP ENSO is also not field significant over North America (). The temperature anomalies primarily reveal a west–east contrast with warming over western North America and cooling over the eastern portions. In contrast, the Ts pattern associated with EP ENSO (, lower panels) resembles the ones associated with Niño 3.4 and EC1. The anomalous Ts exhibits warming anomalies mostly over central Canada and the northeastern United States and cooling anomalies over Mexico and the southwestern United States, a more southwest-to-northeast orientation. The anomalous circulation pattern, especially the above-average geopotential heights over central and eastern Canada and the below-average heights over Mexico (, middle panels), support the anomalous temperature pattern. However, the Ts anomalies associated with TE1 are stronger than their TE2 counterparts. The TE1-related pattern is field significant over North America, whereas the TE2-associated pattern is not (). We note that Mo (Citation2010) and Yu et al. (Citation2012) both found that the two types of ENSO affect the US climate in winter differently. However, they are not in complete agreement on what the different impacts are. The analysis with various indices found that the effects of ENSO on winter temperatures in the United States are more of an east–west contrast pattern for the CP ENSO, as reported by Mo (Citation2010), but more of a southwest–northeast pattern for the EP ENSO, as demonstrated by Yu et al. (Citation2012).
The precipitation anomalies associated with Niño 3.4 and EC1 are dominated by strong positive anomalies over the southern United States, northern California, and Mexico, as well as weak negative anomalies over most of Canada (, top panels). The anomalous pattern is found to be field significant at the 5% level over North America (). The precipitation patterns associated with the CP and EP ENSO (, middle and lower panels) are qualitatively similar to the ones associated with Niño 3.4 and EC1. However, the wet anomalies associated with the CP ENSO are weak, especially over the southern United States and northern California. Also, the anomalous precipitation pattern is not field significant over North America (). In contrast, the EP ENSO has strong precipitation anomalies over the southeastern United States and the west coast of North America. The positive anomalies also extend farther to the north into central Canada in comparison with their Niño 3.4 and EC1 counterparts. The precipitation anomalies related to TE1 and TE2 are field significant at the 5% level over North America although the latter is slightly weaker than the former. The results obtained also confirm that, over the United States, the CP ENSO produces stronger dry anomalies but weaker wet anomalies than the EP ENSO, as reported recently by Yu and Zou (Citation2013).
Fig. 6 As in Fig. 4, but for precipitation (contours 0.1 mm d−1).
In summary, the atmospheric circulation, surface temperature, and precipitation anomalies associated with the Niño 3.4 and the leading tropical Pacific OLR-SST covariability indices are very similar and are field significant at the 5% level over the domains analyzed. For either the CP or EP type of ENSO, qualitatively similar anomalous patterns are apparent associated with the indices identified by the partial-regression–EOF and regression–EOF methods, with differences appearing mainly in the amplitude of the anomalies. The anomalous climate patterns are generally field significant within the domains of interest for the EP type of ENSO but not field significant for the CP type of ENSO. In view of these similarities, we will focus on the comparison of anomalies associated with the Niño 3.4 index and the two types of ENSO identified from the partial-regression–EOF analysis in the following.
5 Dynamical maintenance of climate anomalies associated with ENSO
a Atmospheric Circulation and Moisture Transport
The circulation anomalies associated with ENSO are dominated by an equivalent barotropic structure in the troposphere. Similar geopotential anomalies are apparent at 250 and 500 hPa associated with various ENSO indices (c.f. shading in the left column of with contours in ). The centres of action of the circulation anomalies associated with ENSO are located near the mid-latitude jet stream and storm tracks (e.g., Peixoto & Oort, Citation1992), suggesting that their generation mechanisms may be associated with local processes such as instabilities of the jet or with transient eddies (e.g., Branstator, Citation1995; Kug & Jin, Citation2009; Trenberth & Hurrell, Citation1994; Yu & Lin, Citation2012). It is well recognized that synoptic vorticity forcing (Fv) is crucial to reinforcing the anomalous circulation in the upper troposphere (e.g., Choi et al., Citation2010; Hurrell & van Loon, Citation1997; Kug & Jin, Citation2009; Lau, Citation1988; Rogers, Citation1990; Trenberth & Hurrell, Citation1994; Teng, Fyfe, & Monahan, Citation2007). In addition, changes in the mean and eddy components of the flow affect the transport and convergence of atmospheric moisture and are, therefore, directly tied to changes in regional precipitation (e.g., Hurrell, Citation1995). The transport of atmospheric moisture can often lead to the atmospheric river phenomenon over the North Pacific. The El Niño pattern may result in the southward shift of the atmospheric river landfalling along the west coast of North America, leading to the precipitation anomalies shown in (e.g., Payne & Magnusdottir, Citation2014; Zhu & Newell, Citation1998). Hence, the influence of synoptic eddies on the upper tropospheric circulation anomalies in association with the various ENSO indices and the corresponding vertically integrated moisture transport anomalies are examined.
Fig. 7 Anomalies of (left) 250 hPa geopotential Φ250 (shading, m2 s−2) and eddy vorticity forcing Fv250 (contour interval 2 × 10⁻⁴ m2 s−3), and (right) vertically integrated moisture transports qV (arrows, kg m−2 with scale shown at the lower right) and divergence of vertically integrated moisture transports div·(qV)/g (contour interval 0.1 mm d−1) regressed on the (top) Niño 3.4, (middle) TC1, and (bottom) TE1 indices.
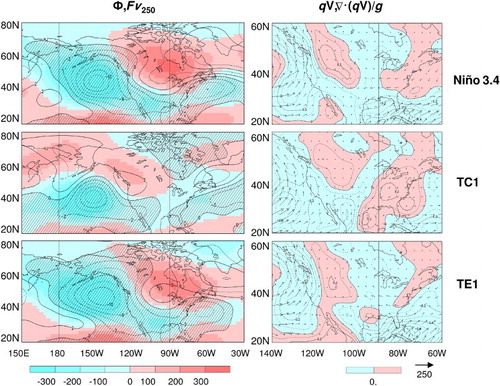
(left column) displays 250 hPa geopotential and synoptic eddy vorticity forcing anomalies regressed on the Niño 3.4, TC1, and TE1 indices. In association with the Niño 3.4 index (, top left), the dominant cyclonic circulation forcings are seen south of the Aleutian Islands, Mexico, and from the Gulf of Mexico extending northeastward across the western North Atlantic, which coincide well with negative geopotential anomalies there. On the other hand, dominant anticyclonic forcings are apparent over much of central and eastern Canada and the northern United States, which coincide with positive geopotential anomalies. The coincidence of the cyclonic (anticyclonic) vorticity forcing with the negative (positive) geopotential anomaly suggests that synoptic eddies systematically reinforce and help to maintain the anomalous circulation in the upper troposphere. The collocation of vorticity forcing and geopotential anomalies is also clearly evident in the fields associated with TC1 and TE1. The differences in atmospheric circulation between various ENSO indices, including the circulation intensity and spatial structure discussed above for , can also be attributed to the corresponding differences in the synoptic eddy vorticity forcing. Thus, in the upper troposphere the synoptic vorticity fluxes act to reinforce and maintain the circulation anomalies associated with ENSO.
The vertically integrated moisture transport anomalies associated with Niño 3.4 exhibit marked transports over the Gulf of Mexico and the west coast of North America (, top right). The convergence of anomalous moisture transports are apparent over the southeastern United States, northern California, and Mexico, indicating the excess of precipitation over evaporation there. Thus, the moisture transport anomalies support the precipitation anomalies over these areas (). The vertically integrated moisture transport anomalies are also dominated by moisture transports located in the lower troposphere (not shown). The vertically integrated moisture transport patterns associated with TC1 and TE1 resemble their Niño 3.4 counterparts (, right column). However, the anomalous transport over the Gulf of Mexico associated with the CP ENSO shifts southeast, and the anomalous transport over the west coast of North America shifts slightly west. Accordingly, the precipitation anomalies over the southeastern United States and northern California are weaker here than their Niño 3.4 counterparts (). On the other hand, the anomalous moisture transports associated with the EP ENSO are still evident over the Gulf of Mexico and the west coast of North America. The latter also shifts slightly east into northern California in comparison with its Niño 3.4 counterpart. Consequently, pronounced precipitation anomalies are seen over the southeastern United States and northern California ().
b Surface Energy Budget
The surface energy budget anomalies of Eq. (2) associated with ENSO are displayed in and . Recall the sign convention that all fluxes are positive downward so that the sign of the anomalies in and indicates whether it acts to warm or cool the North American land surface. gives the spatial standard deviations <X +2>1/2 of surface temperature and various terms in the energy budget (X = <X> + X+, with the angular braces indicating the spatial average over the land regions of and ), together with the spatial correlations between anomalies in temperature and energy budget components. In addition, following Zhang et al. (Citation2011), the surface radiation heating Rh is defined as the sum of net surface shortwave radiation and downward longwave radiation (Rs + Rld), which provides an insightful indicator of how water vapour and cloud feedbacks determine the North American surface temperature anomalies during ENSO.
Fig. 8 Anomalies of surface radiative heating Rh, upward longwave radiation Rlu, net radiation R, and turbulent heat flux B (from top to bottom rows) regressed on the (left column) Niño 3.4, (middle column) TC1, and (right column) TE1 indices. The contour interval is 0.6 W m−2. Negative values are cross-hatched. The anomalies significantly correlated with the corresponding index at the 5% level are shaded green.
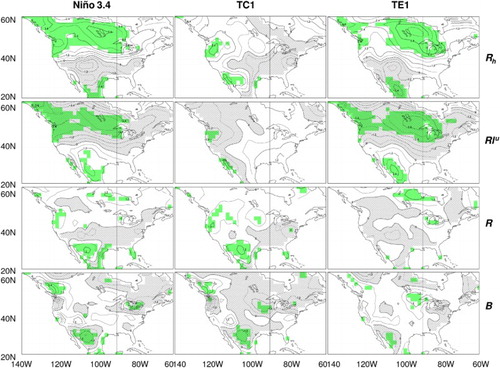
Fig. 9 As in Fig. 8, but for the regression of surface net shortwave radiation Rs, downward longwave radiation Rld, latent heat flux LH, and sensible heat flux SH anomalies.
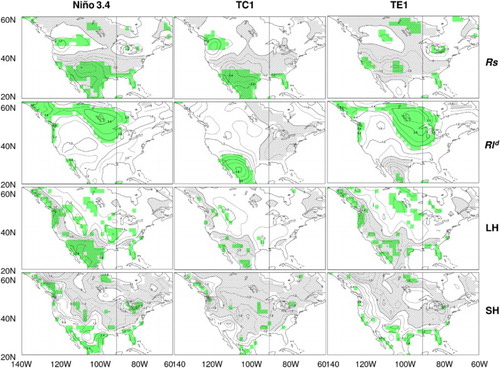
Table 3. Spatial standard deviations and correlations of the anomalies of surface temperature (°C) and the energy balance components (W m−2) associated with the Niño 3.4, TC1, and TE1 indices calculated over North America (20°–60°N, 140°–60°W).
The energy budget associated with the Niño 3.4 index is dominated by surface radiative heating and upward surface longwave radiation anomalies (, left column). The Rh (Rlu) anomalies are closely positively (negatively) correlated with temperature Ts anomalies (), indicating that surface radiative heating acts to support and maintain the temperature anomalies associated with ENSO, and the upward surface longwave radiation damps the temperature anomalies. The anomalous surface net radiation R, which is the sum of Rh and Rlu, is a small residual resulting from cancellation of these two terms (, left column). This is also apparent in the comparison of spatial standard deviations, 0.58 W m−2 for R versus 1.79 (1.52) W m−2 for Rh (Rlu) (). Spatial anomalies of R are positively but only weakly correlated with temperature anomalies compared with the high correlation between Rh (Rlu) and Ts anomalies. Furthermore, the anomalies in both surface net shortwave radiative flux Rs and downward longwave radiative flux Rld (, left column) contribute to the anomalous radiative heating. The anomalous warming over Canada and the northern United States is mainly attributed to increased Rld and reduced Rs reflection, whereas the cooling over Mexico and the southwestern United States is mainly caused by the enhancement of Rs reflection. The spatial correlation between Rs and Ts anomalies (0.70) is comparable to that between the Rld and Ts anomalies (0.76). Also, the two spatial standard deviations (1.20 W m−2 and 1.14 W m−2) are analogous (). In addition, the anomalous patterns of these surface radiative components are field significant at the 5% level over the North American land mass (). Thus, over North America there is more (less) downwelling longwave radiation at the surface when the atmosphere is warm (cold), as a consequence of the warm (cold) atmospheric anomaly imposed by anomalous advection as discussed above. This is offset mainly by the corresponding increase (decrease) in OLR at the warm (cold) surface, which follows the Planck feedback (e.g., Peixoto & Oort, Citation1992).
The turbulent heat transfer anomalies at the surface associated with Niño 3.4 are also weakly positively correlated with the temperature anomalies (). Latent heat flux anomalies are positively and somewhat more strongly correlated with surface temperature, whereas the sensible heat flux anomalies are weakly negatively correlated. In general, surface temperature anomalies alone would be expected to result in a negative correlation between temperature and turbulent heat flux anomalies. This is not the case for latent heat flux, as in Boer (Citation1993), implying that anomalies in near–surface gradients of moisture and temperature and the effective ventilation through anomalies in stability-dependent drag coefficients and winds are also important (Yu & Boer, Citation2002). Additionally, the turbulent heat flux anomalies generally compensate for the surface net radiative flux anomalies (, left column), as expected, with patchy exceptions along coastal regions. The key features of the energy budget associated with Niño 3.4 also agree well with observational findings previously attributed to ENSO variability based on data from the International Satellite Cloud Climatology Project (ISCCP) (Zhang et al., Citation2011).
The energy budget anomalies associated with the CP ENSO are also dominated by surface radiative heating and upward surface longwave radiation (, middle column). However, the anomalies are generally weaker than their Niño 3.4 counterparts, apparent in the spatial distribution and spatial standard deviations of the two terms (). This is consistent with the relatively weak temperature anomalies shown in . In addition, both Rs and Rld contribute to the anomalous warming or cooling (, middle column) in the face of Rlu damping, with anomalous temperature being slightly more highly correlated with Rld than with Rs (0.53 versus 0.34, ). The anomalous turbulent heat flux is also positively but only weakly correlated with surface temperature but with a slightly higher correlation between temperature and sensible heat flux than that between temperature and latent heat flux. Overall, the anomalous patterns of these energy budget components related to the CP ENSO are not field significant at the 5% level over North America (). In contrast, the energy budget anomalies associated with the EP ENSO ( and , right columns) closely resemble their Niño 3.4 counterparts, with differences mainly in the anomalous amplitude. Additionally, Rld dominates Rs in the anomalous surface radiative heating for the EP ENSO (, right column and ). Accordingly, the anomalous surface net shortwave radiation is not field significant over North America ().
6 Impacts of various ENSO indices on North American climate extremes
displays the anomalies of percentages of warm days (TX90p) and warm nights (TN90p) associated with the Niño 3.4, TC1, and TE1 indices. shows the corresponding anomalies for cool days (TX10p) and cool nights (TN10p), and shows the maximum 5-day precipitation (Rx5day).
Fig. 10 Anomalies of percentage of time when the daily maximum temperature is above the 90th percentile (TX90p) (left, contours 0.4%) and percentage of time when daily minimum temperature is above the 90th percentile (TN90p) (right, contours 0.4%) regressed on the (top row) Niño 3.4, (middle row) TC1, and (bottom row) TE1 indices. Negative values are cross-hatched. The anomalies significantly correlated with the corresponding index at the 5% level are shaded green.
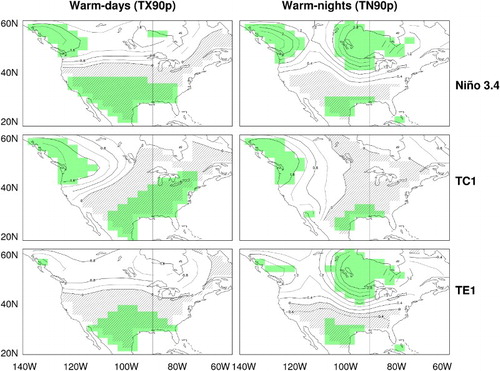
Fig. 11 As in Fig. 10, but for anomalies of percentage of time when the daily maximum temperature is below the 10th percentile (TX10p) (left, contours 0.4%) and percentage of time when the daily minimum temperature is below the 10th percentile (TN10p) (right, contours 0.4%).
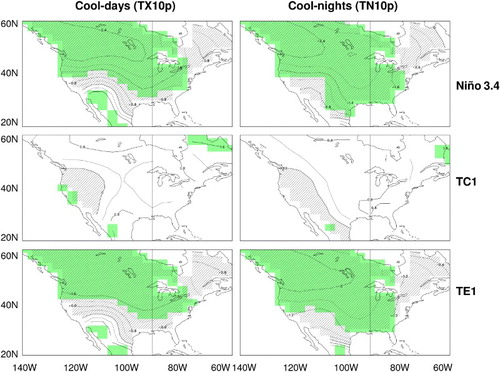
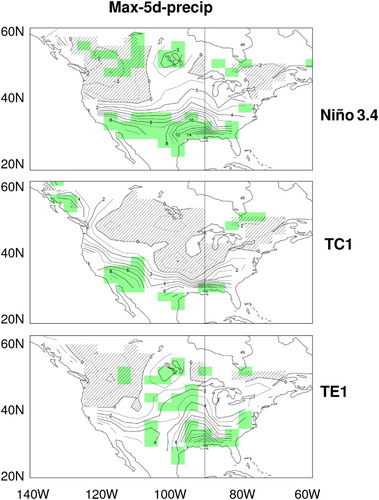
Fig. 12 Maximum five-day precipitation amount (Rx5day; contours 1 mm) anomalies regressed on the (top) Niño 3.4, (middle) TC1, and (bottom) TE1 indices. Negative values are cross-hatched. The anomalies significantly correlated with the corresponding index at the 5% level are shaded green.
The TX90p associated with Niño 3.4 tends to be characterized by a north–south dipole pattern, with increased warm days over Canada and the northern United States and reduced ones over the southern United States and Mexico (, top left). The anomalous pattern somewhat resembles the anomalous mean surface temperature pattern (, top left) and is field significant at the 5% level over North America (). The anomalous TX90p pattern is also similar to others previously attributed to ENSO variability over the United States (e.g., Higgins et al., Citation2002). The TX90p anomalies associated with the CP ENSO (, middle left) reveal a somewhat southeast-to-northwest orientation pattern, with increased warm days apparent over western Canada and the northwestern United States and reduced ones over the southeastern United States, Mexico, and central and eastern Canada. The pattern is field significant over North America (). In contrast, the TX90p anomaly patterns associated with EP ENSO (, bottom left) are similar to their Niño 3.4 counterparts but with slightly weaker amplitudes, especially over western Canada and for their TE2 counterparts (not shown). Neither the pattern associated with TE1 nor TE2 is field significant ().
The TN90p warm night anomalies associated with the Niño 3.4 and the CP and EP ENSO indices (, right column) somewhat resemble the corresponding TX90p anomalies. However, the TN90p anomalies associated with Niño 3.4 are stronger over central and western Canada than the corresponding TX90p anomalies (cf. , top right with top left). This feature is also apparent in the fields associated with the EP ENSO, in particular over central Canada (cf. , bottom right with bottom left). In addition, the TN90p anomalies associated with Niño 3.4 and TE1 are field significant over North America, but the anomalies associated with TC1 are not field significant ().
The TX10p anomalies associated with Niño 3.4 tend to be characterized by reduced cool days over Canada and the United States, accompanied by increased cool days over Mexico (, top left). The anomalous pattern is field significant at the 5% level over North America () and is also similar to the cold day anomalies attributed to ENSO variability over the United States (Higgins et al., Citation2002). The TX10p anomalies associated with TE1 (, bottom left) are similar to the ones associated with Niño 3.4, with modest differences in the anomalous amplitude detail. The TX10p anomalies associated with TE2 also feature this anomalous pattern but with weak amplitude anomalies (not shown). Thus, the pattern associated with TE1 is field significant over North America but the pattern associated with TE2 is not (). In contrast, the TX10p anomalies associated with the CP ENSO are weak and dominated by slightly increased cool days over North America, with the exception of northern California (, middle left) with less than 10% of the area being significantly correlated with the CP ENSO index at the 5% level (). The TN10p cool night anomalies also resemble the corresponding TX10p anomalies. The main differences appear in the anomalous amplitude detail, except for Mexico, for which the anomalies tend to be out of phase between the corresponding TN10p and TX10p anomalies.
The maximum five-day precipitation amount (Rx5day) anomalies associated with the Niño 3.4 and the CP and EP ENSO indices () are generally similar to the corresponding DJF mean precipitation anomalies described above () in terms of the spatial pattern and field significant features (). The differences between the corresponding Rx5day and precipitation anomalies are mainly seen over northern California. The anomalous Rx5day associated with the Niño 3.4 index is also similar to winter maximum daily precipitation anomalies attributed to ENSO variability (Zhang, Wang, Zwiers, & Groisman, Citation2010).
7 Summary and discussion
This study compares the winter North American climate impacts associated with various ENSO indices using observations and NCEP reanalysis data for the 1980–2011 period. Several indices relevant to ENSO were considered, including the traditionally used Niño 3.4 SST index, the leading tropical Pacific OLR-SST covariability, and the EP and CP types of ENSO identified using both partial-regression–EOF and regression–EOF approaches. The DJF mean anomalies in association with various ENSO indices, including the atmospheric circulation over the Pacific–North American sector, North American surface temperature and precipitation, and North American temperature and precipitation extremes, were examined and compared. The influences of synoptic eddies on upper tropospheric circulation, moisture transports on precipitation, and surface energy balance components on surface temperature were diagnosed to aid in understanding various climate anomalies associated with ENSO.
The OLR and SST are strongly coupled to each other in the tropical Pacific in winter. The tropical OLR-SST covariability, characterized by a maximum covariance analysis, is dominated by the leading MCA mode. The Niño 3.4 SST index captures the leading tropical Pacific OLR-SST covariability well. In association with the Niño 3.4 index and the expansion coefficient of OLR anomalies for the leading MCA mode (EC1), the anomalous circulation projects on both the PNA and TNH patterns. For the warm ENSO phase, supported by the anomalous circulation, the surface temperature features warm anomalies over Canada and the northern United States and cold anomalies over Mexico. The anomalous patterns of warm days and nights resemble the anomalous mean surface temperature pattern, with differences occurring mainly in the magnitudes of the anomalies. The corresponding cool day anomalies exhibit reduced values over Canada and the United States and increased ones over Mexico, as do the cool night anomalies, with the exception of weak anomalies over Mexico. The precipitation anomalies tend to be characterized by strong positive anomalies over the southern United States, northern California, and Mexico, as well as weak negative anomalies over most of Canada. The maximum five-day precipitation amount anomalies are generally similar to the mean precipitation anomalies in terms of the spatial pattern and field significant features, with the exception being northern California. All these anomalous patterns are field significant at the 5% level over the domains of interest. Note that these positive and negative anomalies are associated with the warm ENSO (El Niño) phase, and their opposites are associated with the cold ENSO (La Niña) phase.
The similarity of the variance and its impact on North American climate between Niño 3.4 and EC1 indices indicates that the Niño 3.4 region is optimal for monitoring the tropical Pacific OLR-SST covariability and for the tropical SST impact on North America. A similar result was also recently obtained by M. L'Heureux (personal communication, 2014) suggesting that the Niño 3.4 SST alone remains a good index for monitoring ENSO variability and its impact on North America, while the addition of OLR does not add much value to the Niño 3.4 index in this regard.
The association of ENSO with the PNA pattern tends to come from both the EP and CP ENSOs, whereas the association with the TNH comes more from the EP ENSO. The geopotential anomalies associated with the CP ENSO are generally weaker than their Niño 3.4 counterparts, especially over North America. Consequently the corresponding surface temperature and precipitation anomalies are weak and not field significant over North America, as are the corresponding anomalies of temperature and precipitation extremes, except anomalous warm days. In contrast, the circulation anomalies associated with the EP ENSO are slightly weaker and shift somewhat east compared with their Niño 3.4 counterparts. The corresponding temperature reveals cooling anomalies over Mexico and the southwestern United States and warming anomalies over central Canada and the northeastern United States. The precipitation features strong positive anomalies over the southeastern United States and northern California. In addition, the anomalies of temperature and precipitation extremes associated with the EP ENSO are similar to their Niño 3.4 counterparts, with differences occurring mainly in the magnitude of the anomalies. From the analyses using various indices, it is also found that the impact of ENSO on the winter temperature in the United States is more of an east–west contrast pattern for the CP ENSO as reported by Mo (Citation2010) and more of a southwest–northeast pattern for the EP ENSO as demonstrated by Yu et al. (Citation2012).
For either the CP or EP type of ENSO, qualitatively similar results are apparent associated with the two indices identified by the partial-regression–EOF and regression–EOF approaches. The anomalous climate patterns are not field significant for the CP ENSO. However, the amplitudes of the climate anomalies associated with the EP ENSO are generally lower in association with the index identified by the regression–EOF approach than that with the index identified by the partial-regression–EOF approach. Consequently, the anomalous EP ENSO patterns associated with the index identified by the partial-regression–EOF approach are field significant over the domains analyzed but those associated with the index identified by the regression–EOF approach are not field significant. These differences are attributed to differences in SST data processing used to define the EP ENSO. The partial-regression–EOF approach tends to separate the SST anomalies related to the two types of ENSO in the same region; hence, it is inclined to provide better indices for analyzing the impacts of the two types of ENSO, especially the EP ENSO, on North American climate than the regression–EOF approach.
It is worth noting that the Niño 3.4 SST variability is closely related to the OLR variability over the equatorial central Pacific, whereas the EP ENSO is dominated by OLR anomalies over the equatorial eastern Pacific. In Chiodi and Harrison (Citation2013), the OLR–El Niño events were identified as those with peak anomalies in both the Niño 3.4 index and the OLR anomalies over the region bounded by 5°S–5°N and 160°–110°W, which are closely collocated with the centre of action of OLR anomalies associated with the EP ENSO. In fact, choosing ENSO events with both Niño 3.4 and TE1 indices greater than the corresponding standard deviation leads to the same large events identified by Chiodi and Harrison (Citation2013). Significant ENSO impacts would be expected during these events, given the similarities of North American responses associated with the Niño 3.4 and TE1 indices discussed above. Thus, the results reported here do not conflict with the finding of Chiodi and Harrison (Citation2010, Citation2013), although the regression maps presented in this analysis reflect the effect not only of the strongest ENSO events but also of weak events.
The circulation anomalies associated with ENSO are dominated by an equivalent barotropic structure in the troposphere. In the upper troposphere, synoptic vorticity fluxes act to reinforce and maintain the anomalous circulation. The precipitation anomalies over North America are supported by vertically integrated moisture transports, in particular the anomalous transport in the lower troposphere. The differences in atmospheric circulation and precipitation among various ENSO indices, including the intensity and spatial structure of the fields, can be attributed to the corresponding differences in the synoptic eddy vorticity forcing and the vertically integrated moisture transport.
The surface energy budget associated with ENSO is dominated by the surface radiative heating anomalies in the face of upward surface longwave radiative damping. The anomalous surface net radiation is a small residual resulting from the cancellation of these two opposing terms and is generally compensated for by surface heat flux anomalies. The energy budget anomalies associated with the EP ENSO closely resemble the ones associated with Niño 3.4, while the anomalies associated with the CP ENSO are generally weaker than their Niño 3.4 counterparts. In addition, the warming over Canada and the northern United States associated with Niño 3.4 is mainly attributed to increased downward longwave radiative flux and reduced reflection of surface net shortwave radiation, while the cooling over Mexico and the southwestern United States is mainly caused by enhancement of the reflected surface net shortwave radiation. In contrast, both anomalous net shortwave radiative and downward longwave radiative fluxes contribute significantly to the warming or cooling associated with the CP ENSO, while downward longwave radiation dominates net shortwave radiation in the anomalous surface radiative heating for the EP ENSO.
Acknowledgements
We are indebted to H. Wan for help in dealing with the extremes data and D. Robataille for help with data processing, and to M. L'Heureux for helpful discussions and suggestions during the course of this study. We thank three anonymous reviewers for their constructive suggestions and advice, which considerably improved the paper.
References
- Anderson, B. T. (2007). On the joint role of subtropical atmospheric variability and equatorial subsurface heat content anomalies in initiating the onset of ENSO events. Journal of Climate, 20, 1593–1599. doi: 10.1175/JCLI4075.1
- Ashok, K., Behera, S. K., Rao, S. A., Weng, H., & Yamagata, T. (2007). El Niño Modoki and its possible teleconnection. Journal of Geophysical Research, 112, C11007. doi: 10.1029/2006JC003798
- Barnston, A. G., Chelliah, M., & Goldenberg, S. B. (1997). Documentation of a highly ENSO-related SST region in the equatorial Pacific. Atmosphere-Ocean, 35, 367–383. doi: 10.1080/07055900.1997.9649597
- Barsugli, J. J., & Sardeshmukh, P. D. (2002). Global atmospheric sensitivity to tropical SST anomalies throughout the Indo-Pacific basin. Journal of Climate, 15, 3427–3442. doi: 10.1175/1520-0442(2002)015<3427:GASTTS>2.0.CO;2
- Boer, G. J. (1993). Climate change and the regulation of the surface moisture and energy budgets. Clim. Dyn., 8, 225–239. doi: 10.1007/BF00198617
- Branstator, G. (1995). Organization of storm track anomalies by recurring low-frequency circulation anomalies. Journal of the Atmospheric Sciences, 52, 207–226. doi: 10.1175/1520-0469(1995)052<0207:OOSTAB>2.0.CO;2
- Bretherton, C. S., Smith, C., & Wallace, J. M. (1992). An intercomparison of methods for finding coupled patterns in climate data. Journal of Climate, 5, 541–560. doi: 10.1175/1520-0442(1992)005<0541:AIOMFF>2.0.CO;2
- Bretherton, C. S., Widmann, M., Dymnikov, V. P., Wallace, J. M., & Bladé, I. (1999). The effective number of spatial degrees of freedom of a time-varying field. Journal of Climate, 12, 1990–2009. doi: 10.1175/1520-0442(1999)012<1990:TENOSD>2.0.CO;2
- Chiodi, A. M., & Harrison, D. E. (2010). Characterizing warm-ENSO variability in the equatorial Pacific: An OLR perspective. Journal of Climate, 23, 2428–2439. doi: 10.1175/2009JCLI3030.1
- Chiodi, A. M., & Harrison, D. E. (2013). El Niño impacts on seasonal U.S. atmospheric circulation, temperature, and precipitation anomalies: The OLR-event perspective. Journal of Climate, 26, 822–837. doi: 10.1175/JCLI-D-12-00097.1
- Choi, D. H., Kug, J. S., Kwon, W. T., Jin, F. F., Baek, H. J., & Min, S. K. (2010). Arctic Oscillation responses to greenhouse warming and role of synoptic eddy feedback. Journal of Geophysical Research, 115, D17103. doi:10.1029/2010JD014160.
- Deser, C., Phillips, A. S., Tomas, R. A., Okumura, Y. M., Alexander, M. A., Capotondi, A., … Ohba, M. (2012). ENSO and Pacific decadal variability in the community climate system model version 4. Journal of Climate, 25, 2622–2651. doi: 10.1175/JCLI-D-11-00301.1
- DeWeaver, E., & Nigam, S. (2002). On the linearity of ENSO's atmospheric response. Journal of Climate, 15, 2446–2461. doi: 10.1175/1520-0442(2002)015<2446:LIESAR>2.0.CO;2
- Donat, M. G., Alexander, L. V., Yang, H., Durre, I., Vose, R., Dunn, R. J. H., … & Kitching, S. (2013). Updated analyses of temperature and precipitation extreme indices since the beginning of the twentieth century: The HadEX2 dataset. Journal of Geophysical Research: Atmospheres, 118, 2098–2118. doi: 10.1002/jgrd.50150
- Garfinkel, C. I., Hurwitz, M. M., Waugh, D. W., & Butler, A. H. (2013). Are the teleconnections of Central Pacific and Eastern Pacific El Niño distinct in boreal wintertime? Climate Dynamics, 41, 1835–1852. doi: 10.1007/s00382-012-1570-2
- Garreaud, R. D., & Wallace, J. M. (1997). The diurnal march of convective cloudiness over the Americas. Monthly Weather Review, 125, 3157–3171. doi: 10.1175/1520-0493(1997)125<3157:TDMOCC>2.0.CO;2
- Harrison, D. E., & Larkin, N. K. (1997). The Darwin sea level pressure record, 1876–1996: Evidence for climate change? Geophysical Research Letters, 24, 1779–1782. doi: 10.1029/97GL01789
- Higgins, R. W., Leetmaa, A., & Kousky, V. E. (2002). Relationships between climate variability and winter temperature extremes in the United States. Journal of Climate, 15, 1555–1572. doi: 10.1175/1520-0442(2002)015<1555:RBCVAW>2.0.CO;2
- Hoerling, M. P., & Kumar, A. (2002). Atmospheric response patterns associated with tropical forcing. Journal of Climate, 15, 2184–2203. doi: 10.1175/1520-0442(2002)015<2184:ARPAWT>2.0.CO;2
- Hoerling, M. P., & Kumar, A. (2000). Understanding and predicting extratropical teleconnections related to ENSO. In H. Diaz & V. Markgraf (Eds.), El Niño and the Southern Oscillation: Multi-Scale variability, and global and regional impacts (pp. 57–88). Cambridge, UK: Cambridge University Press.
- Hoerling, M. P., Kumar, A., & Zhong, M. (1997). El Niño, La Niña, and the nonlinearity of their teleconnections. Journal of Climate, 10, 1769–1786. doi: 10.1175/1520-0442(1997)010<1769:ENOLNA>2.0.CO;2
- Hurrell, J. W. (1995). Decadal trends in the North Atlantic Oscillation: Regional temperatures and precipitation. Science, 269, 676–679. doi: 10.1126/science.269.5224.676
- Hurrell, J. W. (1996). Influence of variations in extratropical wintertime teleconnections on northern hemisphere temperatures. Geophysical Research Letters, 23, 665–668. doi: 10.1029/96GL00459
- Hurrell, J. W., & van Loon, H. (1997). Decadal variations associated with the North Atlantic Oscillation. Climatic Change, 36, 301–326. doi: 10.1023/A:1005314315270
- Kao, H. Y., & Yu, J. Y. (2009). Contrasting eastern-Pacific and central-Pacific types of ENSO. Journal of Climate, 22, 615–632. doi: 10.1175/2008JCLI2309.1
- Kistler, R., Collins, W., Saha, S., White, G., Woollen, J., Kalnay, E., … Fiorino, M. (2001). The NCEP-NCAR 50-year reanalysis: Monthly means CD-ROM and documentation. Bulletin of the American Meteorological Society, 82, 247–267. doi: 10.1175/1520-0477(2001)082<0247:TNNYRM>2.3.CO;2
- Kousky, V. E., & Higgins, R. W. (2007). An alert classification system for monitoring and assessing the ENSO cycle. Weather and Forecasting, 22, 353–371. doi:10.1175/WAF987.1
- Kug, J. S., & Jin, F. F. (2009). Left-hand rule for synoptic eddy feedback on low-frequency flow. Geophysics Research Letters, 36, L05709. doi:10.1029/2008GL036435
- Kug, J. S., Jin, F. F., & An, S. I. (2009). Two types of El Niño events: Cold tongue El Niño and warm pool El Niño. Journal of Climate, 22, 1499–1515. doi:10.1175/2008JCLI2624.1
- Larkin, N. K., & Harrison, D. E. (2005). Global seasonal temperature and precipitation anomalies during El Niño autumn and winter. Geophysical Research Letters, 32, L16705. doi:10.1029/2005GL022860.
- Lau, K. M., Wu, H. T., & Bony, S. (1997). The role of large-scale atmospheric circulation in the relationship between tropical convection and sea surface temperature. Journal of Climate, 10, 381–392. doi: 10.1175/1520-0442(1997)010<0381:TROLSA>2.0.CO;2
- Lau, N.-C. (1988). Variability of the observed midlatitude storm tracks in relation to the low-frequency changes in the circulation pattern. Journal of the Atmospheric Sciences, 45, 2718–2743. doi: 10.1175/1520-0469(1988)045<2718:VOTOMS>2.0.CO;2
- Lau, N. C., Leetmaa, A., & Nath, M. J. (2008). Interactions between the responses of North American climate to El Niño–La Niña and to the secular warming trend in the Indian–western Pacific Oceans. Journal of Climate, 21, 476–494. doi: 10.1175/2007JCLI1899.1
- Liebmann, B., & Smith, C. A. (1996). Description of a complete (interpolated) outgoing longwave radiation dataset. Bulletin of the American Meteorological Society, 77, 1275–1277.
- Livezey, R. E., & Chen, W. Y. (1983). Statistical field significance and its determination by Monte Carlo techniques. Monthly Weather Review, 111, 46–59. doi: 10.1175/1520-0493(1983)111<0046:SFSAID>2.0.CO;2
- Lopez, H., & Kirtman, B. P. (2013). Westerly wind bursts and the diversity of ENSO in CCSM3 and CCSM4. Geophysical Research Letters, 40, 4722–4727. doi:10.1002/grl.50913
- McPhaden, M. J., Busalacchim, A. J., Cheney, R., Donguy, J. R., Gage, K. S., Halpern, D., … Takeuchi, K. (1998). The Tropical Ocean-Global Atmosphere (TOGA) observing system: A decade of progress. Journal of Geophysical Research, 103, 14169–14240. doi: 10.1029/97JC02906
- Mo, K. C. (2010). Interdecadal modulation of the impact of ENSO on precipitation and temperature over the United States. Journal of Climate, 23, 3639–3656. doi: 10.1175/2010JCLI3553.1
- Mo, K. C., & Livezey, R. E. (1986). Tropical–extratropical geopotential height teleconnections during the northern hemisphere winter. Monthly Weather Review, 114, 2488–2515. doi: 10.1175/1520-0493(1986)114<2488:TEGHTD>2.0.CO;2
- Murakami, M. (1979). Large-scale aspects of deep convective activity over the GATE area. Monthly Weather Review, 107, 994–1013. doi: 10.1175/1520-0493(1979)107<0994:LSAODC>2.0.CO;2
- Payne, A. E., & Magnusdottir, G. (2014). Dynamics of landfalling atmospheric rivers over the North Pacific in 30 years of MERRA reanalysis. Journal of Climate, 27, 7133–7150. doi: 10.1175/JCLI-D-14-00034.1
- Peixoto, J., & Oort, A. (1992). The physics of climate. New York: AIP.
- Philander, S. G., & Rasmusson, E. M. (1985). The Southern Oscillation and El Niño. Advances in Geophysics, 28A, 197–215. doi: 10.1016/S0065-2687(08)60224-1
- Rayner, N. A., Parker, D. E., Horton, E. B., Folland, C. K., Alexander, L. V., Rowell, D. P., … Kaplan, A. (2003). Global analyses of sea surface temperature, sea ice, and night marine air temperature since the late nineteenth century. Journal of Geophysical Research, 108(D14), 4407. doi:10.1029/2002JD002670
- Reynolds, R. W., Rayner, N. A., Smith, T. M., Stokes, D. C., & Wang, W. (2002). An improved in situ and satellite SST analysis for climate. Journal of Climate, 15, 1609–1625. doi: 10.1175/1520-0442(2002)015<1609:AIISAS>2.0.CO;2
- Rogers, J. C. (1990). Patterns of low frequency monthly sea level pressure variability (1899–1996) and associated wave cyclone frequencies. Journal of Climate, 3, 1364–1379. doi: 10.1175/1520-0442(1990)003<1364:POLFMS>2.0.CO;2
- Ropelewski, C. F., & Halpert, M. S. (1986). North American precipitation and temperature patterns associated with the El Niño/Southern Oscillation (ENSO). Monthly Weather Review, 114, 2352–2362. doi: 10.1175/1520-0493(1986)114<2352:NAPATP>2.0.CO;2
- Ropelewski, C. F., & Halpert, M. S. (1996). Quantifying Southern Oscillation-precipitation relationships. Journal of Climate, 9, 1043–1059. doi: 10.1175/1520-0442(1996)009<1043:QSOPR>2.0.CO;2
- Seager, R., Harnik, N., Robinson, W. A., Kushnir, Y., Ting, M., Huang, H. P., & Velez, J. (2005). Mechanisms of ENSO forcing of hemispherically symmetric precipitation variability. Quarterly Journal of the Royal Meteorological Society, 131, 1501–1527. doi: 10.1256/qj.04.96
- Smith, S. R., Legler, D. M., Remigio, M. J., & O'Brien, J. J. (1999). Comparison of 1997–98 U.S. temperature and precipitation anomalies to historical ENSO warm phases. Journal of Climate, 12, 3507–3515. doi: 10.1175/1520-0442(1999)012<3507:COUSTA>2.0.CO;2
- Straus, D. M., & Shukla, J. (2002). Does ENSO force the PNA? Journal of Climate, 15, 2340–2358. doi: 10.1175/1520-0442(2002)015<2340:DEFTP>2.0.CO;2
- Teng, Q., Fyfe, J. C., & Monahan, A. H. (2007). Northern hemisphere circulation regimes: Observed, simulated and predicted. Climate Dynamics, 28, 867–879. doi: 10.1007/s00382-006-0220-y
- Trenberth, K. E., (1997). The definition of El Niño. Bulletin of the American Meteorological Society, 78, 2771–2777. doi: 10.1175/1520-0477(1997)078<2771:TDOENO>2.0.CO;2
- Trenberth, K. E., & Hurrell, J. W. (1994). Decadal atmosphere-ocean variations in the Pacific. Climate Dynamics, 9, 303–319. doi: 10.1007/BF00204745
- Trenberth, K. E., Branstator, G., Karoly, D., Kumar, A., Lau, N. C., & Ropelewski, C. (1998). Progress during TOGA in understanding and modeling global teleconnections associated with tropical sea surface temperatures. Journal of Geophysical Research, 103, 14291–14324. doi: 10.1029/97JC01444
- Wallace, J. M., & Gutzler, D. S. (1981). Teleconnections in the geopotential height field during the northern hemisphere winter. Monthly Weather Review, 109, 784–812. doi: 10.1175/1520-0493(1981)109<0784:TITGHF>2.0.CO;2
- Wallace, J. M., Smith, C., & Bretherton, C. S. (1992). Singular value decomposition of wintertime sea surface temperature and 500 mb height anomalies. Journal of Climate, 5, 561–576. doi: 10.1175/1520-0442(1992)005<0561:SVDOWS>2.0.CO;2
- Wallace, J. M., Rasmusson, E. M., Mitchell, T. P., Kousky, V. E., Sarachik, E. S., & von Storch, H. (1998). On the structure and evolution of ENSO-related climate variability in the tropical Pacific: Lessons from TOGA. Journal of Geophysical Research, 103, 14241–14260. doi: 10.1029/97JC02905
- Wang, X. L., & Swail, V. R. (2005). Climate change signal and uncertainty in projections of ocean wave heights. Climate Dynamics, 26, 109–126. doi: 10.1007/s00382-005-0080-x
- Weng, H., Behera, S. K., & Yamagata, T. (2009). Anomalous winter climate conditions in the Pacific rim during recent El Niño Modoki and El Niño events. Climate Dynamics, 32, 663–674. doi: 10.1007/s00382-008-0394-6
- Wild, M., Ohmura, A., Gilgen, H., & Rosenfeld, D. (2004). On the consistency of trends in radiation and temperature records and implications for the global hydrological cycle. Geophysical Research Letters, 31, L11201. doi:10.1029/2003GL019188
- Wu, Z., Chen, S., He, J., & Chen, H. (2014). Quantifications of the two “flavors” of El Niño using upper-ocean heat content. Atmosphere-Ocean, 52(4), 351–362. doi: 10.1080/07055900.2014.942593
- Xie, P., & Arkin, P. A. (1997). Global precipitation: A 17-year monthly analysis based on gauge observations, satellite estimates, and numerical model outputs. Bulletin of the American Meteorological Society, 78, 2539–2558. doi: 10.1175/1520-0477(1997)078<2539:GPAYMA>2.0.CO;2
- Yeh, S. W., Kug, J. S., Dewitte, B., Kwon, M. H., Kirtman, B. P., & Jin, F. F. (2009). El Niño in a changing climate. Nature, 461, 511–514. doi:10.1038/nature08316
- Yu, B., & Boer, G. J. (2002). The roles of radiation and dynamical processes in the El Niño-like response to global warming. Climate Dynamics, 19, 539–553. doi: 10.1007/s00382-002-0244-x
- Yu, B., & Zwiers, F. (2007). The impact of combined ENSO and PDO on the PNA climate: A 1000-year climate modeling study. Climate Dynamics, 29, 837–851. doi: 10.1007/s00382-007-0267-4
- Yu, B., & Lin, H. (2012). Tropical/extratropical forcing on wintertime variability of the extratropical temperature and circulation. Climate Dynamics, 40, 1183–1200. doi:10.1007/s00382-012-1367-3
- Yu, J. Y., & Kao, H. Y. (2007). Decadal changes of ENSO persistence barrier in SST and ocean heat content indices: 1958–2001. Journal of Geophysics Research, 112, D13106. doi:10.1029/2006JD007654 doi: 10.1029/2006JD007715
- Yu, J. Y., Kao, H. Y., & Lee, T. (2010). Subtropics-related interannual sea surface temperature variability in the equatorial central Pacific. Journal of Climate, 23, 2869–2884. doi: 10.1175/2010JCLI3171.1
- Yu, J. Y., Zou, Y., Kim, S. T., & Lee, T. (2012). The changing impact of El Niño on US winter temperatures, Geophysics Research Letters, 39, L15702. doi:10.1029/2012GL052483 doi: 10.1029/2011GL050099
- Yu, J. Y., & Zou, Y. (2013). The enhanced drying effect of Central-Pacific El Niño on US winter. Environmental Research Letters, 8. doi:10.1088/1748-9326/8/1/014019
- Zhang, T., Hoerling, M. P., Perlwitz, J., Sun, D. Z., & Donald, M. (2011). Physics of U.S. surface temperature response to ENSO. Journal of Climate, 24, 4874–4887. doi: 10.1175/2011JCLI3944.1
- Zhang, X. B., Wang, J. F., Zwiers, F. W., & Groisman, P. Y. (2010). The influence of large-scale climate variability on winter maximum daily precipitation over North America. Journal of Climate, 23, 2902–2915. doi: 10.1175/2010JCLI3249.1
- Zhang, Y., Wallace, J. M., & Iwasaka, N. (1996). Is climate variability over the North Pacific a linear response to ENSO? Journal of Climate, 9, 1468–1478. doi: 10.1175/1520-0442(1996)009<1468:ICVOTN>2.0.CO;2
- Zhu, Y., & Newell, R. E. (1998). A proposed algorithm for moisture fluxes from atmospheric rivers. Monthly Weather Review, 126, 725–735. doi: 10.1175/1520-0493(1998)126<0725:APAFMF>2.0.CO;2
- Zwiers, F. W., Wang, X. L., & Sheng, J. (2000). Effects of specifying bottom boundary conditions in an ensemble of atmospheric GCM simulations. Journal of Geophysical Research, 105, 7295–7315. doi: 10.1029/1999JD901050