
ABSTRACT
Monthly output from a high-resolution numerical ocean model simulation of the North Atlantic Ocean for the 1990–2011 period is analyzed to investigate the properties and relationships between the various current streams in Atlantic Canadian shelf waters at seasonal and annual time scales. Particular focus is placed on the sections of the Atlantic Zone Monitoring Program, which are subdivided into nearshore and shelf-break components. At seasonal time scales, model results indicate that all nearshore series exhibit seasonal cycles with minima during mid-year, but shelf-break series do not. The seasonal cycles are consistent with the barotropic component of the Arctic melt cycle. At annual time scales, shelf-break series show generally decreasing correlations with increasing downstream distance. Correlation coefficients of approximately 0.5 exist for sections on the Newfoundland and Scotian shelves separated by over 2000 km. Remarkably, no correlation is found for the inshore Labrador Current and the flow through the Strait of Belle Isle or other downstream sections. The transport through these sections is found to correlate with across- and along-shelf sea level gradients. On the Scotian Shelf, nearshore series exhibit decreasing sequential correlation. Behaviour of flows into the Gulf of Maine is consistent with a conservation of volume relation whereby an increase in the Nova Scotia Current is compensated for by less inflow and more outflow through the Northeast Channel (and vice versa).
RÉSUMÉ
[Traduit par la rédaction] Nous analysons les données mensuelles de 1990 à 2011 que simule pour l'océan Atlantique Nord un modèle océanique numérique à haute résolution, afin d’étudier les liens entre les divers courants marins du plateau continental du Canada atlantique ainsi que leurs propriétés, et ce, à des échelles saisonnière et annuelle. Nous visons notamment les sections du Programme de monitorage de la zone atlantique (PMZA), qui sont subdivisées en zones longeant le littoral et le rebord du plateau continental. À l’échelle saisonnière, les résultats du modèle indiquent que toutes les séries de données côtières présentent des cycles saisonniers comportant des minimums au milieu de l'année, mais que les données calculées le long du rebord n'en montrent pas. Les cycles saisonniers correspondent à la composante barotropique du cycle de fonte arctique. À l’échelle annuelle, les séries de données provenant du rebord du plateau présentent généralement des corrélations qui décroissent à mesure que la distance augmente en aval. Des corrélations d'environ 0,5 existent pour les sections des plateaux de Terre-Neuve et néo-écossais, séparées par plus de 2000 km. Remarquablement, aucune corrélation ne ressort pour le courant côtier du Labrador et l’écoulement dans le détroit de Belle Isle, ou d'autres sections en aval. Le transport à travers ces sections est corrélé avec les gradients transversaux et longitudinaux du niveau de la mer au-dessus du plateau. Sur le plateau néo-écossais, les séries de données côtières montrent une corrélation séquentielle décroissante. Le comportement de l’écoulement dans le golfe du Maine concorde avec la relation de conservation de volume selon laquelle un débit entrant réduit et un débit sortant accru dans le chenal Nord-Est compensent une augmentation du courant de Nouvelle-Écosse (et vice versa).
1 Introduction
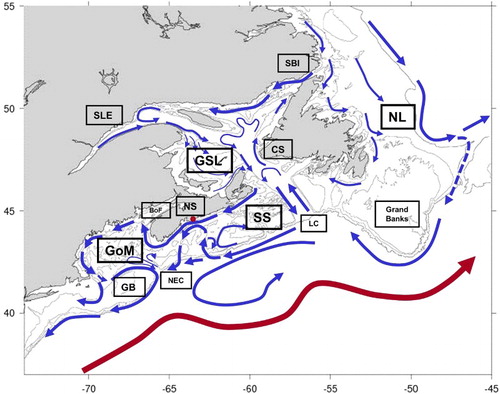
The Newfoundland and Labrador Shelves, the Gulf of St. Lawrence, the Scotian Shelf, and the Gulf of Maine form an interconnected set of shelf seas in Atlantic Canada. The circulation in the region is characterized by a general northeast–southwest flow of water from the area of the Newfoundland and Labrador Shelves through the Gulf of St. Lawrence, Scotian Shelf, and Gulf of Maine to the Middle Atlantic Bight (; and see for example, Han, Loder, & Smith, Citation1999; Hannah, Shore, Loder, & Naimie, Citation2001; Loder, Petrie, & Gawarkiewicz, Citation1998; Lu, Thompson, & Wright, Citation2001; Lynch, Ip, Naimie, & Werner, Citation1996; Saucier, Roy, Gilbert, Pellerin, & Ritchie, Citation2003; Thompson & Sheng, Citation1997; Urrego-Blanco & Sheng, Citation2012; Wu, Tang, & Hannah, Citation2012; Xue, Chai, & Pettigrew, Citation2000). Principal current streams include the inshore Labrador Current, part of which flows into the Gulf of St. Lawrence through the Strait of Belle Isle and part continues on to the Newfoundland Shelf; the shelf-break Labrador Current, which follows the shelf-break through Flemish Pass and around the Tail of the Grand Banks; a shelf-break current flowing east–west along the Scotian Shelf to southwest of Georges Bank; and a coastal current that exits the Gulf of St. Lawrence through Cabot Strait, travelling along the Nova Scotia coastline (as the Nova Scotia coastal current) and around the Gulf of Maine (as the Gulf of Maine coastal current). Numerous rivers enter the system with the primary source of freshwater being the St. Lawrence Estuary. Although small in volume flux (∼15 mSv (1 Sv = 106 m3 s−1), annual average), the outflow from the St. Lawrence Estuary has a characteristic low salinity pulse, with a peak in the spring, which can be followed through the Gulf of St. Lawrence and onto the Scotian Shelf as part of the Nova Scotia coastal current, arriving at southwest Nova Scotia in late summer.
Fig. 1 Schematic of the circulation in the study region. See for abbreviations used in figure. Blue (red) arrows denote cold (warm) current streams. The red dot denotes Halifax. The flow through Flemish Pass is illustrated by a dashed arrow.
Spring phytoplankton blooms occur throughout the region, mostly concentrated in the shallower regions (e.g., Grand Banks, St. Lawrence Estuary, southern Gulf of St. Lawrence, and Georges Bank) although considerable spatial and temporal (intra- and interannual) variability exists. Fall blooms are less predictable, with Georges Bank, one of the few areas where such blooms typically occur (Johnson et al., Citation2013). The zooplankton community is dominated by copepods (∼90%) with Oithona, Calanus finmarchicus, and Pseudocalanus ubiquitous from Newfoundland and Labrador to the western Gulf of Maine. Proceeding east to west, cold water species (Calanus hyperboreus, Calanus glacialis) exist in Newfoundland and Labrador and Gulf of St. Lawrence waters, become less prevalent in the Halifax and Bay of Fundy regions (which exhibit the highest zooplankton diversity), and essentially vanish in the western Gulf of Maine (DFO, Citation2010). Historically, the Atlantic Canada region supported a number of commercial groundfish fisheries many of which have declined over the last two decades resulting in reduced quotas and area closures, as well as the growth of invertebrate fisheries, such as shrimp, lobster, and snow crab.
Stock dynamics and recent observed changes in nutrients and lower trophic level communities are thought to be tied to circulation patterns. For example, snow crab are distributed in the southern Gulf of St. Lawrence, eastern Scotian Shelf, and the inshore region of southwest Nova Scotia. The degree to which these (sub)stocks are connected via the circulation (DFO, Citation2012) and how the circulation controls bottom temperature and thus habitat, particularly under climate change scenarios (Kuhn & Choi, Citation2011), are open questions. Nutrient ratios in the Gulf of Maine (Townsend, Rebuck, Thomas, Karp-Boss, & Gettings, Citation2010) are thought to be related to the water properties and transport of the current streams entering the Gulf of Maine through the Northeast Channel and the Nova Scotia current near southwest Nova Scotia. Similarly, the abundance of cold water (i.e., Arctic) versus warm water zooplankton communities in the Gulf of Maine are thought to relate to transport of Arctic species from the Gulf of St. Lawrence into the Gulf of Maine by the Nova Scotia coastal current versus onshelf advection of warm slope water species through the Northeast Channel (Johnson et al., Citation2013).
Since 1999, the Atlantic Zone Monitoring Program (AZMP) of Fisheries and Oceans Canada has conducted regular surveys along fixed sections and stations in order to help understand physical and biological processes in the region. In this study, the output of a high-resolution numerical ocean model simulation of the entire North Atlantic Ocean for 1990 to 2011 is analyzed in order to investigate the relationships between the various current streams in Atlantic Canadian waters at seasonal and annual time scales.
Particular focus is placed on the AZMP sections to aid in understanding the growing set of observations and to determine how information for a given section is reflected at other sections. The Atlantic Canada region will be considered from a system's point of view with characteristic inputs and throughputs (currents). At intra-annual time scales, we will investigate which current streams exhibit a seasonal cycle, how they are related, and any influences on those relationships. At annual time scales we will investigate the relationships between current streams by correlating the annual transport series and interpreting this information in the context of the general circulation in the region.
The outline of our paper is as follows. Section 2 describes the set-up of the circulation model and the analyses at seasonal and annual time scales. In Section 3, basic output from the circulation model is presented followed by the results of the seasonal cycle and annual average transport analyses. The final section is a discussion of the findings of our study.
2 Methods
a Circulation Model
The model is based on the Nucleus for European Modelling of the Ocean, version 2.3 (NEMO 2.3), which includes the Océan Parallelisé ocean component (OPA; Madec, Citation2008) and the Louvain-la-neuve sea-ice module (LIM; Fichefet & Morales Maqueda, Citation1997). The model has a maximum of 50 levels in the vertical, with level thickness increasing from 1 m at the surface to 200 m at a depth of 1250 m, reaching a maximum value of 460 m at the bottom of the deep basins. The maximum depth represented in the model is 5730 m. The domain covers the North Atlantic Ocean from 8°–75°N latitude and 100°W–30°E longitude–sufficiently far west to include Hudson Bay, which is important for modelling processes in Atlantic Canada. Model resolution is 1/12°. In the region of interest, this results in characteristic grid-cell dimensions of 5–6 km, providing adequate resolution of shelf-scale processes. The use of a high-resolution, large-area model for this study avoids potential problems with open boundaries that could affect a regional model applied to the area of interest.
Monthly climatological open boundary conditions for normal velocity, temperature (T), salinity (S), and sea surface height were derived from the 18-year Global Ocean Reanalysis and Simulations (GLORYS) reanalysis run (Ferry et al., Citation2010). The use of monthly climatologies at the open boundaries means that any interannual variability in the model simulation is a result of internal adjustments to surface forcing. The model surface forcing is taken from an atmospheric forcing dataset compiled for the Coordinated Ocean-ice Reference Experiments (CORE; Griffies et al., Citation2009). The surface momentum fluxes and the turbulent components of the heat and freshwater fluxes are calculated using the CORE bulk formulae. The spin-up simulation lasted 10 years using the Normal Year Forcing of CORE (Large & Yeager, Citation2004) representing the climatology of the reanalysis period. Then, the simulation switched to interannual surface forcing for the 1990–2011 period, derived from a combination of CORE and the National Centers for Environmental Prediction/National Center for Atmospheric Research (NCEP/NCAR), reanalysis forcing. Model forcing variables include 6-hourly, 10 m air temperature, wind velocities, and humidity, as well as daily short- and longwave radiation and total precipitation (rain plus snow). The runoff from the major rivers is specified according to a monthly climatology compiled for the DRAKKAR project (Barnier et al., Citation2006). This dataset allows the seasonality of key freshwater sources (i.e., Hudson and Ungava bays, Churchill River in Labrador, and the St. Lawrence Estuary) to be captured by the model. River inputs were modelled in the standard NEMO way, as precipitation applied to regions where rivers enter the ocean domain. The model simulation did not include tidal forcing, considered important for modelling tidally rectified flows that are known to exist around banks in the region (e.g., Georges Bank), or estuarine circulations (e.g., St. Lawrence Estuary). In such regions, the lack of tidally induced mixing can affect horizontal and vertical density gradients with possible effects on transports (Han, Hannah, Loder, & Smith, Citation1997). However, because we are interested in the relationship between current streams at time scales much longer than the tides, it is unlikely that this omission is relevant to our results.
b Analyses of Model Output
Model output was 22 years of monthly mean fields, allowing analysis at seasonal and annual time scales. Historically, standard sections have been sampled in Atlantic Canadian waters, particularly since the beginning of AZMP in 1999, providing a significant database of measurements (mostly temperature and salinity), which have been used in numerous studies (for a list see http://www.meds-sdmm.dfo-mpo.gc.ca/isdm-gdsi/azmp-pmza/publications-eng.html). Motivated by this, velocity data were extracted from the model simulation at section locations shown in . From these, monthly time series of depth-integrated transports through various subsections were created where the subsections were chosen based on the principal current streams found in the region. The transports computed were the coastal and shelf-break regions of the Seal Island section (i.e., the inshore and offshore Labrador currents); the net transport through the Strait of Belle Isle; the inner and shelf-break regions of the Bonavista, Flemish Cap, and southeast Grand Banks sections; Cabot Strait transports; inner and shelf-break regions of the Louisbourg and Halifax sections; inner shelf region of the Cape Sable Island section; and the transport into and out of the Gulf of Maine through a section across the Northeast Channel. (Note that for analysis purposes the Flemish Cap section is divided into Flemish Pass and Flemish Cap subsections (see ).) For the deeper water shelf-break subsections, transports were also calculated in vertical bins (from the surface to 100, 200, 300, 500, 1000, and 2000 m) to investigate the possibility of depth-dependent behaviour. Unless otherwise stated, results presented herein are for total-depth integrated transports. Section names and their abbreviations used in the text are contained in . The division of sections into fixed inner (where “inner” denotes the subsection that abuts the coastline) and shelf-break regions was based on identifying the location of these current streams in (22-year averaged) monthly mean model velocity sections. Computation of inflow and outflow through sections was based on the sign of the velocity (at a given time), as opposed to dividing the section into fixed inflow and outflow subsections.
Fig. 2 Sections analyzed in this study (thick red lines). See for abbreviations used in figure. The Flemish Cap section was broken into Flemish Pass (Fp) and Flemish Cap (Fc) subsections. Isobaths are shown at 50, 100, 200, 300, 500, 1000, and 2000 m. The 1000 m isobath is in bold, the 2000 m isobath is dashed, and the 100 m isobath is blue.
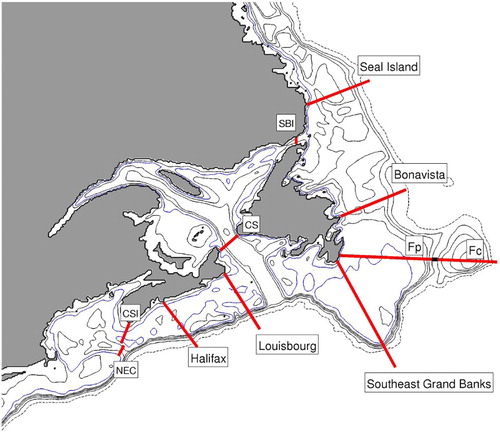
Table 1. Key section and place names and their abbreviations.
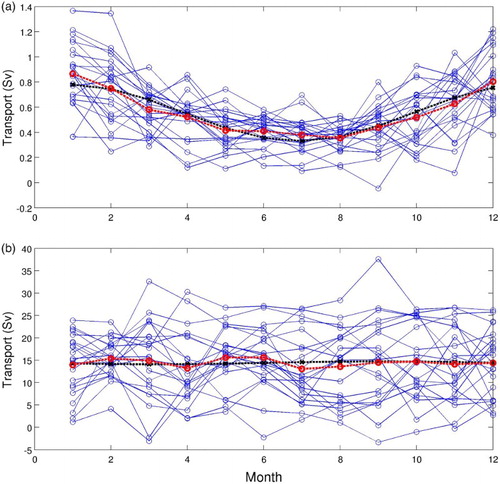
To understand the system at intra-annual time scales, the monthly time series were fit to sinusoids to investigate which streams exhibit seasonal cycles. Our interest is in determining which series have robust seasonal cycles (with parameters that do not vary much between years; a) versus those that behave more like constant transports plus monthly variability (b). To do this, each of the 22 years of monthly data was fit to a function of the form (
is mean transport,
is amplitude,
,
is month, and
is phase in months), using a least squares technique to determine the parameters
and
. To determine the suitability of a seasonal cycle model to the data, we compared the sinusoidal fit to that of a straight line. There is no standard technique for detecting robust seasonal cycles, so we devised a semi-quantitative criterion based on the variability of the 22 estimates of the phase (see Appendix A for details). These results are used to assess the connectivity between transport streams on seasonal time scales.
Fig. 3 Example of seasonal cycle fits showing (a) seasonal cycle behaviour at the inner part of the Louisbourg section and (b) no seasonal cycle behaviour at the shelf break of the Louisbourg section. The dashed blue lines are the raw data; red lines are the mean of the raw data; and the black lines are the model fits.
To understand the system at annual time scales, the monthly time series were averaged to produce 22 years of annual average transports. The series were detrended and correlations were computed to investigate how transports through one region of the system are related to transports through other regions.
3 Results
a Model Circulation
It is not our intention to present details of model validation in this study because this information is available in Wang and Greenan (Citation2014). Rather, in this section we present some basic model output to illustrate that the model captures the main features of the circulation in the Atlantic Canada region () and to help interpret other results of the study.
The climatological depth-averaged model circulation plus streamlines are shown in . The climatology is an average over all years and months of the model simulation. The streamlines—five- year long particle tracks in the climatological flow field—are selected to illustrate the various possible pathways from the northern Labrador Shelf to the south and west. The streamlines show the splitting of the inshore Labrador Current into a branch that flows through the Strait of Belle Isle around to the Gulf of Maine and a branch that continues along the inner Newfoundland Shelf. The latter follows a looping pattern in Laurentian Channel toward Cabot Strait and continues across the Scotian Shelf and shelf break with incursions into the central Scotian Shelf and the Northeast Channel regions before following the southern flank of the Georges Bank gyre. There is also a flow pathway from the inner Labrador Shelf, through Flemish Pass and around the tail of the Grand Banks. Flow along the outer Labrador Shelf can follow the shelf edge all the way to the Middle Atlantic Bight via Flemish Pass or around Flemish Cap or become caught in the Gulf Stream extension and head northeast.
Fig. 4 Circulation and streamlines based on model climatological depth-averaged flow field. Streamlines selected to illustrate the various pathways from the northern Labrador Shelf to the south and west. See text for details. Isobaths as in .
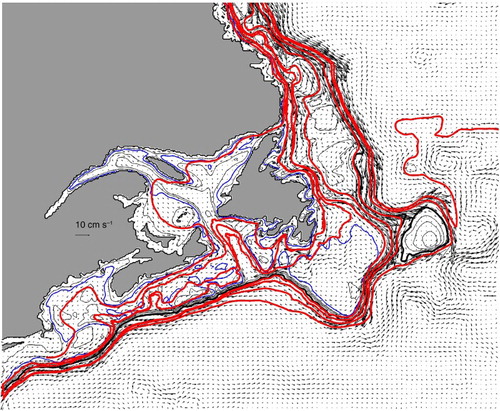
Note that the gyre around Georges Bank is evident despite the lack of tidal forcing, but the model does a poor job of simulating the Anticosti gyre (located at the mouth of the St. Lawrence Estuary). The latter problem is likely a result of the large precipitation footprint, covering part of the gyre region itself, which is part of the NEMO forcing for the freshwater outflow from the St. Lawrence Estuary. (A version of the NEMO-OPA model that treats river input as a freshwater transport source (Brickman & Drozdowski, Citation2012) does not suffer from this problem.)
b Relationships at Seasonal Time Scales
The seasonal cycle analysis is summarized in and . (The phase reported in the table has been adjusted to denote the (decimal) month of the cycle minimum.) All the onshelf series, including Cabot Strait and the Northeast Channel, exhibited clear seasonal cycles, with mid-year minima. The shelf-break currents were generally best modelled as a mean plus or minus the standard deviation, for all transport depth bins. The exceptions were the Seal Island shelf break where all bins in the upper 1000 m showed a weak seasonal cycle; the shelf break at Flemish Pass, which had a clear seasonal cycle that disappeared for depth bins greater than 500 m; and the shelf break at southeast Grand Banks where a weak seasonal cycle appeared for depth bins at or greater than 1000 m. These results were interpreted as uncertain, with seasonal cycle, and without seasonal cycle, respectively ().
Fig. 5 Summary of seasonal cycle analysis. The green (red) arrows denote locations with (without) seasonal cycles; the question mark denotes an uncertain result. The dashed lines connecting the arrows are based on model velocity field streamlines.
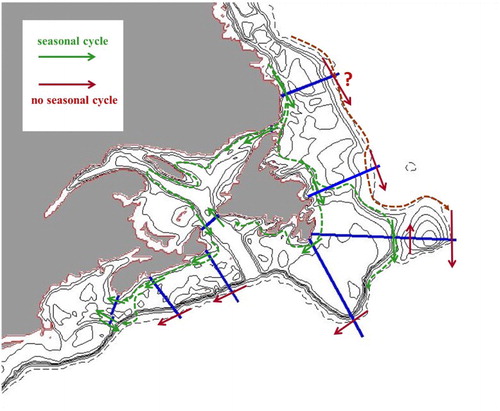
Table 2. Seasonal cycle fit for the 0–500 m depth bin.
Regarding the phase of the seasonal cycles (), there is a suggestion that the minima in transports shift to later months between the Strait of Belle Isle in the northeast and Cape Sable Island and the Northeast Channel in the southwest. Although supported by the raw plots (not shown), this is arguably not significant when the standard deviation of the phase is taken into consideration.
The mean transports in the coastal zone () show that the transport through Seal Island (SI:inner) splits with less than 10% passing through the Strait of Belle Isle (SBI:net) and the majority arriving at Bonavista (BV:inner). (The mean transport through SBI (0.16 Sv) is similar to that reported by Urrego-Blanco and Sheng, Citation2014.) This coastal current travels, in diminishing amounts, through the sections at Flemish Cap (Fp:inner), southeast Grand Banks (se-GB:inner), and into the (southern) Gulf of St. Lawrence as Cabot Strait inflow (CS:inflow). The transport through the Strait of Belle Isle and the net transport through Cabot Strait (CS:net) express conservation of volume in the Gulf of St. Lawrence on seasonal time scales with the difference in means (∼25 mSv) roughly consistent with the freshwater outflow from the St. Lawrence Estuary plus other rivers in the Gulf of St. Lawrence. Part of the outflow through Cabot Strait follows the Nova Scotia coastline with the mean transport highest at Halifax (Hfx:inner) and lowest at Cape Sable Island (CSI:inner), consistent with an incursion of the shelf-break current across the Halifax section which then bifurcates as it travels toward the southwest (see ). The seasonal dynamics at the entries into the Gulf of Maine show tight coupling at the Northeast Channel where the inflow and outflow series are essentially equal but opposite in sign, with the seasonal cycle at Cape Sable Island similar to that of the inflow to the Northeast Channel.
The picture that emerges from the above is that robust seasonal cycles exist for onshelf and coastal flows but are either weak or non-existent in shelf-break currents. We return to this in the discussion.
c Relationships at Annual Time Scales
As mentioned above, correlations between section transports are used to investigate flow variability at annual time scales. To provide a framework for the correlations, and to help interpret potential spurious correlations, use is made of the streamlines presented in . For example, a correlation between the shelf-break flow at Seal Island and the flow through the Strait of Belle Isle is likely spurious because there is no obvious connection between these two current streams, whereas a correlation between shelf-break flow at Seal Island and the shelf-break flow at Bonavista would be expected because there is a clear connection between these current streams.
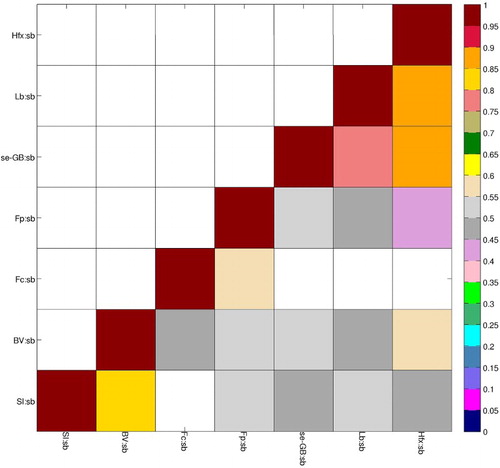
In general, the correlations between the 21 annually averaged series were weak, with only 12 out of 210 possibilities having absolute correlation coefficients greater than 0.7. Starting with the shelf-break series (SI:sb, BV:sb, Fc:sb, Fp:sb, se-GB:sb, Lb:sb, Hfx:sb; and ), we find that these show sequential downstream correlations that generally decrease with distance downstream, as would be deduced from the streamlines shown in . Correlation coefficients between the Newfoundland and Labrador Shelves and Scotian Shelf series level off at about 0.5, showing a connection between locations separated by more than 2000 km. The exception is the flow around eastern Flemish Cap (Fc:sb) which correlates with BV:sb and the southward flow through Flemish Pass (Fp:sb) but no other upstream or downstream series. This could be related to the bifurcation of the shelf-break flow after it passes the Bonavista section () and the possibility that the standard AZMP sections do not adequately capture the shelf-break flows. We return to this point in the discussion.
Fig. 6 Colour-coded correlations of shelf-break series at the 90% confidence level. Note that the colour scale is 0 to 1.
The onshelf series (SI:inner, SBI:net, BV:inner, Fp:inner, se-GB:inner, CS:net, CS:outflow, CS:inflow, Lb:inner, Hfx:inner, CSI:inner, NEC:inflow, NEC:outflow; and ) seem to break into two regions with the region of the Newfoundland and Labrador Shelves presenting a complicated story, while the Gulf of St. Lawrence–Scotian Shelf region behaves more like a flow-through system. Starting at the northeast we find, remarkably, that the transport of the inshore Labrador Current (SI:inner; ) shows no significant correlation with the net flow through SBI (SBI:net) or the nearshore transport series downstream at Bonavista, Flemish Cap, and southeast Grand Banks although SBI:net is weakly correlated with the latter three series. Motivated by the work of Garrett and Toulany (Citation1981) and Garrett and Petrie (Citation1981), the annual mean sea surface height (SSH) was computed for boxes on the Newfoundland and Labrador Shelves (extending from the coast to the 1000 m isobath) and in the Gulf of St. Lawrence west of the Strait of Belle Isle, and (various) SSH differences were computed along the Newfoundland and Labrador Shelves and across the Strait of Belle Isle. Three boxes were chosen on the Newfoundland Shelf, spanning the areas between each of the four AZMP sections (see ); two on the Labrador Shelf (starting at the Seal Island section with each box proceeding northward along shelf for about 400 km); the Strait of Belle Isle box extended from the Strait of Belle Isle section line to about 150 km west of the section. We find that the transport through the Strait of Belle Isle is correlated with the east–west SSH difference across the section from the Newfoundland side to the Gulf of St. Lawrence side (values from 0.65–0.81) and is weakly correlated with along-shelf SSH gradients (0.3–0.5). We find the reverse to be the case for the nearshore transports through the Bonavista, Flemish Cap, and southeast Grand Banks sections, which are more highly correlated with along-shelf SSH gradients (0.55–0.71) than the east–west for the Strait of Belle Isle SSH difference (0.2–0.4). The SI:inner transport is not significantly correlated with either the along-shelf or cross-shelf SSH gradients. We summarize the above in the following way; knowledge of the transport of the inner Labrador Current provides little information about the flow into the Gulf of St. Lawrence via the Strait of Belle Isle or the nearshore flows along the eastern Newfoundland coast. The transport through the Strait of Belle Isle is related to the east–west SSH difference on either side of the strait, whereas the nearshore transports along eastern Newfoundland are related to the SSH gradient along the Newfoundland and Labrador Shelves. This suggests that the factors that control the SSH field are responsible for the variability of these current streams. The inner Labrador Current is not correlated with SSH gradients, suggesting its variability comes from a source further upstream, such as the high latitude ice melt cycle. The relation between the transport in the Strait of Belle Isle and the Newfoundland nearshore series () can be explained as a spurious correlation resulting from a (weak) correlation between the along- and across-shelf gradients.
Fig. 7 Colour-coded correlations of the onshelf series at the 90% confidence level. Note that the colour scale is −1 to 1.
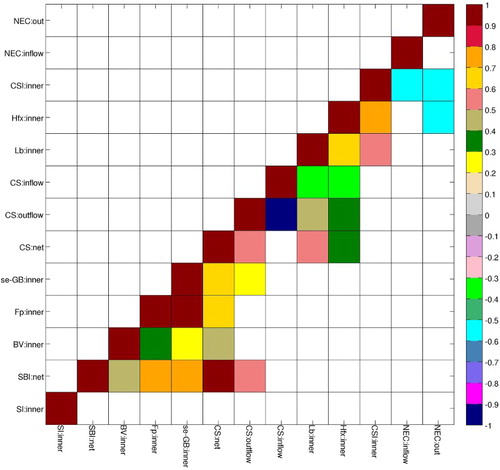
The nearshore transports through Bonavista, Flemish Cap, and southeast Grand Banks behave like a flow-through system, showing sequential correlations that decline with distance (). They are also correlated with the net transport through Cabot Strait (CS:net), which is likely a reflection of their correlation with SBI, which is itself perfectly correlated with CS:net (see below). We find no correlation for these current streams and the inflow to Cabot Strait, indicating that other processes are influencing the variability of Cabot Strait inflow.
As previously mentioned, the mass balance for the Gulf of St. Lawrence requires that the net transport through Cabot Strait be equal to the net transport through the Strait of Belle Isle plus the river inputs (which are ∼10 times smaller). Indeed SBI:net and CS:net are almost perfectly correlated (cor = 0.98), and their difference (on an annual basis) is consistent with the river input (mean ∼25 mSv). The outflow through Cabot Strait is highly (negatively) correlated with the inflow (cor = −0.95) and also correlated with SBI (cor = 0.56), whereas SBI:net is not correlated with the Cabot Strait inflow. Note that the inflow and outflows are both O(1 Sv) while the net flow through Cabot Strait is O(0.1–0.2 Sv). This suggests that the inflow through Cabot Strait largely circulates in the Gulf of St. Lawrence then exits through Cabot Strait, with the fraction (if any) that exits through the Strait of Belle Isle being insufficiently large to influence SBI:net. The SBI:net, which exits through Cabot Strait, is large enough to correlate with the outflow and is (almost) equal to the difference between CS:inflow and CS:outflow with which it correlates perfectly.
Proceeding from Cabot Strait along the Scotian Shelf and into the Gulf of Maine, the system exhibits flow-through behaviour with diminishing sequential correlations between CS:outflow, LB:inner, Hfx:inner, and CSI:inner (). Both Hfx:inner and CSI:inner correlate (−0.51 and −0.54, respectively) with the outflow from the Gulf of Maine at the Northeast Channel (i.e., NEC:outflow) indicating that part of the flow that enters the Gulf of Maine from the Scotian Shelf circulates around the Gulf of Maine (the correlation is negative because NEC:outflow is a negative quantity). The flow entering the Gulf of Maine at Cape Sable Island (CSI) is negatively correlated with the net transport through the Northeast Channel (−0.52, not shown) and with the inflow through the Northeast Channel (NEC:inflow, −0.59). The above express a general conservation of volume for the Gulf of Maine—more flow in at Cape Sable Island is accompanied by less inflow and more outflow at the Northeast Channel (there is also outflow from the Gulf of Maine at western Georges Bank). Regarding the inverse relationship between the inflows at Cape Sable Island and the Northeast Channel, the model result is consistent with the findings of Smith, Houghton, Fairbanks, and Mountain (Citation2001 and Smith, Pettigrew, Yeats, Townsend, & Han (Citation2012). Specifically, Smith et al. (Citation2012), in a study regarding a possible regime shift in the Gulf of Maine, report an inverse relationship (based on monthly data) between the deep inflow (below 75 m) at a mooring on the eastern flank of the Northeast Channel and the transport at their C2 mooring (located at approximately the 100 m isobath along the Cape Sable Island section): transport at C2 is approximately −0.47 times the deep transport at (eastern) the Northeast Channel. For comparison we computed a version of this relationship using the CSI and NEC:inflow series and find a similar relationship: CSI is approximately −0.3 NEC:inflow.
4 Discussion
In our study the output from a 22-year high-resolution numerical model simulation of the North Atlantic Ocean was analyzed to investigate relationships between current streams in the shelf seas of Atlantic Canada. The use of a large-scale model for investigation of regional processes minimizes potential contamination of the results from the direct influence of model open boundary conditions. To our knowledge, this is the first study to analyze results from a high-resolution, large-scale model in this way. The analysis focussed on the standard sections of the AZMP, to provide context for the suite of measurements compiled since 1999. The circulation in the region is characterized by coastal and shelf-break flows, so we subdivided the sections to extract these current streams. The monthly output of the model was used to determine relationships at seasonal and annual time scales.
Although presentation of detailed model validation was not the intention of our paper (this information is available in Wang & Greenan, Citation2014), it is worthwhile to point out that the section transports in compare favourably with those published elsewhere (for comparisons see, for example, Han et al. (Citation2008) for the Newfoundland and Labrador Shelves; Han and Loder (Citation2003), Hannah et al. (Citation2001), Loder, Hannah, Petrie, and Gonzalez (Citation2003) for the Scotian Shelf; and Smith (Citation1983) for Cape Sable Island and the Northeast Channel). This is particularly encouraging because our solutions are open boundary independent, whereas those listed above include models whose interior solutions depend directly on the boundary forcing and thus should be expected to better match available data.
With respect to the seasonal cycle analysis, the picture that emerges is that robust seasonal cycles exist for onshelf and coastal flows but are either weak or non-existent in shelf-break currents. In terms of model forcing the possible sources for seasonality are surface forcing, the open boundary conditions, and river runoff.
The mid-latitude storms that travel through the model domain do contain seasonality, with higher air temperatures and lower wind speeds during the summer. However, it is not obvious how complicated patterns of wind stress and surface heat flux could produce the coherent seasonal cycles in onshelf transports seen in the model. With respect to the open boundaries, the primary inflow regions are along the shelf regions of east Greenland and Baffin Island. Seasonal cycles are found to exist in these regions with maxima in transport and minima in salinity in October, representing the effect of Arctic ice melt (Beszczynska-Moeller, Woodgate, Lee, Melling, & Karcher, Citation2011; Schmidt & Send, Citation2007; de Steur et al., Citation2009). In fact, the nearshore transport series at Seal Island () closely resembles the open boundary, series at Baffin Island both in annual mean and phase. The flows from the major rivers in the model peak in May–June. Of these, the St. Lawrence Estuary has a peak freshwater transport of about 20 mSv and an annual average 15 mSv, which flows through the Gulf of St. Lawrence and exits through Cabot Strait. The rest of the rivers are north of the Seal Island section, with a peak total transport of about 30 mSv and an average of 18 mSv, which contributes to a coastal current that passes through the Seal Island section. These freshwater flows are much smaller than the approximately 2.4 Sv inshore Labrador Current passing through Seal Island and the 0.19 Sv passing through Cabot Strait.
The seasonal cycles in the shelf flows can be explained as follows (see ). The cumulative effect of ice melt in the Arctic produces a seasonally dependent, coastally trapped outflow along eastern Baffin Island with a mean barotropic component of 2.0 Sv that peaks in early fall (Lazier & Wright, Citation1993; Tang et al., Citation2004). This seasonal barotropic signal propagates quickly southward along the Labrador shelf (phase speed , with
m implies propagation of over 2500 km per day) and drives the seasonality of transport in the inshore Labrador Current as seen at the Seal Island section. The majority of this transport flows around the coastline of Newfoundland, carrying its seasonal cycle into the Gulf of St. Lawrence via Cabot Strait. A small fraction of the inner Seal Island flow enters the Gulf of St. Lawrence through the Strait of Belle Isle and exits the Gulf of St. Lawrence at Cabot Strait. Part of the outflow from Cabot Strait becomes the Nova Scotia coastal current whose seasonal cycle in transport follows that of the northern inflow.
The shelf-break transport in the upper 1000 m at Seal Island exhibits a weak seasonal cycle (as found by Lazier & Wright, Citation1993), likely reflecting a combination of the shelf-break flow that travels around the Labrador Sea from east Greenland and the flow originating along eastern Baffin Island that follows the complicated bathymetry of the Labrador Shelf. This shelf-break seasonality is not found downstream at Bonavista nor in the circulation around Flemish Cap but is found at Flemish Pass where it is likely an extension of the flow through BV:inner that follows the shelf-break (see streamlines in ). This seasonal influence seems to disappear near the complicated tail of the banks region of the southeast Grand Banks section.
The primary effect of the various river outflows, whose barotropic transports are small compared with the open boundary inflow, is a baroclinic signal that travels slowly downstream and is responsible for the characteristic late summer freshwater signals found in various onshelf sections. For example (in the model simulation), the salinity anomaly from the St. Lawrence Estuary, which peaks in May, arrives at Cabot Strait in August–September and passes through the Halifax section during September–October.
Monthly model output was averaged to produce 22-year time series of annual average barotropic transports. Annual averaging of the series was necessary because high correlations exist between most series because of the dominance of in-phase seasonal cycles in the data. Because barotropic transports were used (i.e., temperature and salinity properties of the fluid were not considered), we effectively considered signals that propagate through the domain at time scales much shorter than one year. We used correlations between series plus knowledge of the general circulation to determine relationships between current streams at annual time scales.
Shelf-break and onshelf transports were considered separately. For the shelf-break series we found that correlations generally decreased with distance downstream, but there was still a significant (but weak) correlation (∼ 0.5) between sections on the Newfoundland and Labrador Shelves and the Scotian Shelf.
Onshelf series portrayed more complicated relationships particularly on the Newfoundland and Labrador Shelves. We found, remarkably, that the transport of the inshore Labrador Current is not correlated with the flow through the Strait of Belle Isle and the nearshore transports downstream at Bonavista, Flemish Cap, and southeast Grand Banks, even though there is a clear connection between these locations. We found instead that the variability in the net transport through the Strait of Belle Isle is controlled by changes in the sea surface slope from east to west across the Strait (as did Garrett & Toulany, Citation1981), whereas the flows along the Newfoundland coast are controlled by along-shelf SSH gradients. Therefore, knowledge of the transport of the inshore Labrador Current would not seem to yield much information about downstream flows.
Regarding the flows in and out of the Gulf of St. Lawrence, we find that the inflow and outflow through Cabot Strait are almost perfectly (negatively) correlated, with their difference equal to SBI:net plus (much smaller) river inputs. Model correlation results indicate that the inflow through Cabot Strait circulates inside the Gulf of St. Lawrence where it merges with SBI:net and forms the Cabot Strait outflow. Coastal flows on the Scotian Shelf behave like a flow-through system with correlations decreasing with distance downstream. Flows into the Gulf of Maine at Cape Sable Island and the Northeast Channel were found to obey a conservation of volume relation whereby an increase in flow at Cape Sable Island is compensated for by an increase in outflow and a decrease in inflow through the Northeast Channel. The inverse relationship between the Cape Sable Island and Northeast Channel inflows is consistent with the current meter data analysis of Smith et al. (Citation2012).
One of the goals of our study was to use model results to complement the measurements at AZMP sections, and as such we used the actual section coordinates and divided the sections into coastal and shelf-break regions, based on qualitative analysis of the model sections. Although the choices for the coastal regions were fairly obvious, the same cannot be said for the shelf-break regions. Potential problems with the latter include the possibility that the actual section itself does not extend far enough offshelf to adequately monitor the shelf-break flows, and the observation that for some sections (especially southeast Grand Banks) the shelf-break current meanders side to side along the section so that any fixed choice of shelf-break region may not capture the true behaviour of the shelf-break flow at all times. Note that the latter problem also exists for fixed current meter measurements and thus may be responsible for apparent complicated behaviours found in both model and real current data. Another possibility is that there is important variability within a shelf-break region that gets suppressed because of the summation nature of the transport calculation. An example is the analysis (from the same model) of Wang et al. (unpublished manuscript) of the current through the AR7W line which found that the shelf-break Labrador Current could sensibly be partitioned into an eastern and western component. (The AR7W and Seal Island sections are essentially coincident over the extent of the latter.)
The result from the correlation analysis shows that correlations between series are weak with only about 5% of the combinations having correlation coefficients greater than 0.7 (i.e., 50% of the variance explained). Thus, the results of our study indicate that from the point of view of currents, the AZMP sections are fairly independent, hence, constitute a good suite of locations from which to observe the shelf circulation in Atlantic Canada.
Acknowledgements
The authors thank Dr. Y. Wu (Fisheries and Oceans Canada) and two anonymous reviewers for their comments on this manuscript.
Disclosure statement
No potential conflict of interest was reported by the authors.
Additional information
Funding
References
- Akaike, H. (1974). A new look at the statistical model identification. IEEE Transactions on Automatic Control, 19(6), 716–723. doi:10.1109/TAC.1974.1100705
- Barnier, B., Madec, G., Penduff, T., Molines, J.-M., Treguire, A.-M., Le Sommer, J., … Dengg, J. (2006). Impact of partial steps and momentum advection schemes in a global ocean circulation model at eddy permitting resolution. Ocean Dynamics, 56, 543–567. doi:10.1007/s10236-006-0082-1
- Beszczynska-Moeller, A., Woodgate, R. A., Lee, C., Melling, H., & Karcher, M. (2011). A synthesis of exchanges through the main oceanic gateways to the Arctic Ocean. Oceanography, 24(3), 82–99. doi:10.5670/oceanog.2011.59
- Brickman, D., & Drozdowski, A. (2012). Development and validation of a regional shelf model for Maritime Canada based on the NEMO-OPA circulation model. Can. Tech. Rep. Hydrogr. Ocean Sci. No. 278. Dartmouth, Nova Scotia: Bedford Institute of Oceanography.
- DFO. (2010). #9. Retrieved from http://www.meds-sdmm.dfo-mpo.gc.ca/isdm-gdsi/azmp-pmza/docs/bulletin_9_2010.pdf
- DFO. (2012). Assessment of Nova Scotia (4VWX) Snow Crab. DFO Can. Sci. Advis. Sec. Sci. Advis. Rep. 2012/050. Dartmouth, Nova Scotia: Bedford Institute of Oceanography.
- Ferry, N., Parent, L., Garric, G., Barnier, B., Jourdain, N. C., and the Mercator Ocean team. (2010). Mercator global eddy permitting ocean reanalysis GLORYS1V1: Description and results. Mercator Quarterly Newsletter, 36, 15–27.
- Fichefet, T., & Morales Maqueda, M. A. (1997). Sensitivity of a global sea ice model to the treatment of ice thermodynamics and dynamics. Journal of Geophysical Research, 102, 12609–12646. doi:10.1029/97JC00480
- Garrett, C., & Petrie, B. (1981). Dynamical aspects of the flow through the Strait of Belle Isle. Journal of Physical Oceanography, 11(3), 376–393. doi: 10.1175/1520-0485(1981)011<0376:DAOTFT>2.0.CO;2
- Garrett, C., & Toulany, B. (1981). Variability of the flow through the Strait of Belle Isle. Journal of Marine Research, 39(1), 163–189.
- Griffies, S., Biastoch, A., Böning, C., Bryan, F., Danabasoglu, G., Chassignet, E. P., … Yin, J. (2009). Coordinated ocean-ice reference experiments (COREs). Ocean Modelling, 26, 1–46. doi: 10.1016/j.ocemod.2008.08.007
- Han, G., Hannah, C. G., Loder, J. W., & Smith, P. C. (1997). Seasonal variation of the three-dimensional mean circulation over the Scotian Shelf. Journal of Geophysical Research, 102, 1011–1025. doi: 10.1029/96JC03285
- Han, G., & Loder, J. W. (2003). Three dimensional seasonal mean circulation and hydrography on the eastern Scotian Shelf. Journal of Geophysical Research, 108(C5), 3136. doi:10.1029/2002JC001463
- Han, G., Loder, J. W., & Smith, P. C. (1999). Seasonal-mean hydrography and circulation in the Gulf of St. Lawrence and eastern Scotian and southern Newfoundland Shelves. Journal of Physical Oceanography, 29, 1279–1301. doi: 10.1175/1520-0485(1999)029<1279:SMHACI>2.0.CO;2
- Han, G., Lu, Z., Wang, Z., Helbig, J., Chen, N., & De Young, B. (2008). Seasonal variability of the Labrador Current and shelf circulation off Newfoundland. Journal of Geophysical Research, 113(C10013). doi:10.1029/2007JC004376
- Hannah, C. G., Shore, J. A., Loder, J. W., & Naimie, C. E. (2001). Seasonal circulation on the western and central Scotian Shelf. Journal of Physical Oceanography, 31, 591–615. doi: 10.1175/1520-0485(2001)031<0591:SCOTWA>2.0.CO;2
- Johnson, C., Harrison, G., Casault, B., Spry, J., Li, W., & Head, E. (2013). Optical, chemical, and biological oceanographic conditions on the Scotian Shelf and in the eastern Gulf of Maine in 2012. DFO Can. Sci. Advis. Sec. Res. Doc. 2013/070. Dartmouth, Nova Scotia: Bedford Institute of Oceanography.
- Kuhn, P. S., & Choi, J. S. (2011). Influence of temperature on embryo developmental cycles and mortality of female Chionoecetes opilio (snow crab) on the Scotian Shelf, Canada. Fisheries Research, 107, 245–252. doi: 10.1016/j.fishres.2010.11.006
- Large, W. G., & Yeager, S. G. (2004). Diurnal to decadal global forcing for ocean and sea-ice models: The data sets and flux climatologies. NCAR Technical Note NCAR/TN-460+STR, Boulder, Colorado: National Center for Atmospheric Research.
- Lazier, J. R. N., & Wright, D. G. (1993). Annual velocity variations in the Labrador Current. Journal of Physical Oceanography, 23, 659–678. doi: 10.1175/1520-0485(1993)023<0659:AVVITL>2.0.CO;2
- Loder, J. W., Hannah, C. G., Petrie, B. D., & Gonzalez, E. A. (2003). Hydrographic and transport variability on the Halifax section. Journal of Geophysical Research, 108(C11), 8003. 15–27. doi:10.1029/2001JC001267
- Loder, J. W., Petrie, B., & Gawarkiewicz, G. (1998). The coastal ocean off north-eastern North America: A large-scale view. In A. R. Robinson & K. H. Brink (Eds.), The sea (Vol. 11, pp. 105–133). New York: Wiley.
- Lu, Y., Thompson, K. R., & Wright, D. G. (2001). Tidal currents and mixing in the Gulf of St. Lawrence: An application of the incremental approach to data assimilation. Canadian Journal of Fisheries and Aquatic Sciences, 58, 723–735.
- Lynch, D. R., Ip, J. T. C., Naimie, C. E., & Werner, F. E. (1996). Comprehensive coastal circulation model with application to the Gulf of Maine. Continental Shelf Research, 16, 875–906. doi: 10.1016/0278-4343(95)00028-3
- Madec, G. (2008). “NEMO ocean engine”. Note du Pôle de modélisation, Institut Pierre-Simon Laplace (IPSL), France, No 27 ISSN No 1288–1619.
- Saucier, F. J., Roy, F., Gilbert, D., Pellerin, P., & Ritchie, H. (2003). Modeling the formation and circulation processes of water masses and sea ice in the Gulf of St. Lawrence, Canada. Journal of Geophysical Research, 108(C8), 3269. doi:10.1029/2000JC000686
- Schmidt, S., & Send, U. (2007). Origin and composition of seasonal Labrador Sea freshwater. Journal of Physical Oceanography, 37, 1445–1454. doi:10.1175/JPO3065.1
- Smith, P. C. (1983). The mean and seasonal circulation off southwest Nova Scotia. Journal of Physical Oceanography, 13(6), 1034–1054. doi: 10.1175/1520-0485(1983)013<1034:TMASCO>2.0.CO;2
- Smith, P. C., Houghton, R. W., Fairbanks, R. C., & Mountain, D. G. (2001). Interannual variability of boundary fluxes and water mass properties in the Gulf of Maine and on Georges Bank: 1993–1997. Deep Sea Research Part II: Topical Studies in Oceanography, 48, 37–70. doi: 10.1016/S0967-0645(00)00081-3
- Smith, P. C., Pettigrew, N. R., Yeats, P., Townsend, D. W., & Han, G. (2012). Regime shift in the Gulf of Maine. In R. Stephenson, J. Annala, J. Runge, & M. Hall-Arber (Eds.), Advancing an ecosystem approach in the Gulf of Maine. American Fisheries Society Symposium 79, pp. 185–203, Bethesda, Maryland.
- de Steur, L., Hansen, E., Gerdes, R., Karcher, M., Fahrbach, E., & Holfort, J. (2009). Freshwater fluxes in the East Greenland Current: A decade of observations. Geophysical Research Letters, 36. doi:10.1029/2009GL041278
- Tang, C. C., Ross, C. K., Yao, T., Petrie, B., DeTracey, B. M., & Dunlap, E. (2004). The circulation, water masses and sea-ice of Baffin Bay. Progress in Oceanography, 63(4), 183–228. doi: 10.1016/j.pocean.2004.09.005
- Thompson, K. R., & Sheng, J. (1997). Subtidal circulation on the Scotian Shelf: Assessing the hindcast skill of a linear, barotropic model. Journal of Geophysical Research, 102, 24987–25003. doi: 10.1029/97JC00368
- Townsend, D. W., Rebuck, N. D., Thomas, M. A., Karp-Boss, L., & Gettings, R. M. (2010). A changing nutrient regime in the Gulf of Maine. Continental Shelf Research, 30, 820–832. doi: 10.1016/j.csr.2010.01.019
- Urrego-Blanco, J., & Sheng, J. (2012). Interannual variability of the circulation over the eastern Canadian Shelf. Atmosphere-Ocean, 50, 277–300. doi.10.1080/07055900.2012.680430 doi: 10.1080/07055900.2012.680430
- Urrego-Blanco, J., & Sheng, J. (2014). Formation and distribution of sea ice in the Gulf of St. Lawrence: A process-oriented study using a coupled ocean-ice model. Journal of Geophysical Research: Oceans, 119, 7099–7122. doi:10.1002/2014JC010185
- Wang, Z., & Greenan, B. (2014). Physical oceanographic conditions on Newfoundland Shelf/Flemish Cap from a model perspective (1990–2012). NAFO SCR Doc. 14/008, Serial No. N6298, Dartmouth, Nova Scotia: Northwest Atlantic Fisheries Organization.
- Wu, Y., Tang, C., & Hannah, C. (2012). The circulation of eastern Canadian seas. Progress in Oceanography, 106, 28–48. doi: 10.1016/j.pocean.2012.06.005
- Xue, H., Chai, F., & Pettigrew, N. R. (2000). A model study of the seasonal circulation in the Gulf of Maine. Journal of Physical Oceanography, 30, 1111–1135. doi: 10.1175/1520-0485(2000)030<1111:AMSOTS>2.0.CO;2
Appendix A: Seasonal cycle fitting procedure
The goal of this exercise is to develop a criterion that allows us to distinguish between series that show clear, repeatable seasonal cycles (a) versus those for which a straight line would be a better model (b).
A common fit metric for comparing two models is the Akaike Information Criterion (AIC) which can be expressed as (Akaike, Citation1974):where P and n are the number of parameters and data, respectively, and
is the residual sum of squares error. The lower the AIC the better the model, and for this problem this is proportional to the difference in
for the two models because both have
. There is no rule defining how much of a difference in AIC is significant enough to reject one of the models, and the AIC does not help determine whether or not a given model is a good fit to the data. For these data the AIC did not prove to be particularly useful because, when fitting to a single year, the sinusoidal fit was almost always better (∼87% of the fits), even for those cases in which a seasonal cycle did not seem to be a particularly good fit. For this reason we decided to develop a different criterion that better reflected the qualitative assessments deduced from inspection of plots of the time series.
What was common to results like a was that the standard deviation in the 22 estimates of the phase () was lower, typically less than or equal to 1 month, compared with b for which it was 1.6 or higher. Based on inspection of the plots and the observation that a histogram of all the standard deviations of
showed a local minimum at about 1.5 months, we chose the latter as the cutoff value to distinguish series that had robust (or clear) seasonal cycles from those that did not. We acknowledge the ad hoc nature of this analysis but emphasize that our objective was to quantify differences between cases that were fairly obvious upon inspection and do not propose to use this criterion as a strict metric for series whose standard deviations of
are close to 1.5 (which we will call series exhibiting weak seasonal cycles).