
Abstract
Pristine mountain environments are more sensitive to climate change than other land surfaces. Climatic variations in mountainous terrain are still poorly understood. Previous studies revealed inconsistent findings on the elevational dependence of warming in the mountains. In this study, the trends and elevational dependence of air temperature in the Cariboo Mountains Region (CMR) of British Columbia are explored using a surface air temperature dataset with a spatial resolution of five arc minutes over the 1950–2010 period. A Mann-Kendall test is performed for evaluation of trends and their significance. In recent decades the CMR has been warming at a faster rate than regional and global warming. The minimum air temperature trend shows significant amplified warming at higher elevations. The snow–albedo feedback and changes in cloud cover over the CMR may possibly be the major physical mechanisms responsible for these trends. The implications of such changes on the endangered mountain caribou and water resources of the area are also discussed.
Résumé
[Traduit par la rédaction] Les milieux montagneux vierges sont plus sensibles aux changements climatiques que les autres types de surfaces terrestres. Les variations climatiques en terrain montagneux demeurent mal comprises. Des études passées ont produit des résultats incohérents en ce qui concerne l'effet de l’élévation sur le réchauffement en montagnes. Dans cette étude, nous explorons les tendances de la température et les effets de l’élévation sur celles-ci, dans la région de la chaîne Cariboo, en Colombie-Britannique. Nous utilisons des données de température de l'air en surface, enregistrées entre 1950 et 2010, et dont la résolution spatiale s’élève à cinq minutes d'arc. Nous évaluons les tendances et leur niveau de signification à l'aide d'un test de Mann-Kendall. Au cours des dernières décennies, la région de la chaîne Cariboo s'est réchauffée à un taux supérieur aux réchauffements régional et planétaire. La tendance des températures minimales montre un réchauffement significativement amplifié à haute élévation. La rétroaction associée à l'albédo de la neige et la modification du couvert nuageux dans la région de la chaîne Cariboo pourraient s'avérer les principaux mécanismes responsables de ces tendances. Nous discutons aussi des conséquences de ces changements sur le caribou de montagne et les ressources en eau de la région.
1 Introduction
Mountain regions are often pristine environments that play a vital role in the sustainable functioning of the Earth system. It is generally accepted that mountainous regions are more sensitive to global scale climate change than other land surfaces at the same latitude (Barry, Citation2008; Beniston, Diaz, & Bradley, Citation1997; Beniston, Citation2003; Rangwala & Miller, Citation2012; Pepin et al., Citation2015). Mountains have substantial environmental and social significance; they are important sources of natural resources, such as freshwater and biodiversity, and are an essential part of the global ecosystem (Barry, Citation2008, Citation2012; Beniston, Citation2003). However, mountainous areas are experiencing the impacts of climate change, and the extent of the impacts of these changes is highly uncertain (Rangwala & Miller, Citation2012). There is a paucity of observational data in mountainous regions and modelling limitations for capturing the influence of complex topography, with high uncertainties in the model outputs. Combined, these factors make understanding air temperature variations and trends in mountainous regions challenging (Bradley, Keimig, & Diaz, Citation2004; Luce, Abatzoglou, & Holden, Citation2013; Rangwala & Miller, Citation2012; Wang, Fan, & Wang, Citation2013).
Global surface air temperature has been rising over the past century, and it is expected that there will be continued amplified warming in mountainous regions in the twenty-first century (Beniston, Citation2003; Bradley et al., Citation2004; Dong, Huang, Qu, Tao, & Fan, Citation2014; Engler et al., Citation2011; Ghatak, Sinsky, & Miller, Citation2014; IPCC, Citation2013; Stocker et al., Citation2013). Some studies show variations in the warming trend with elevation (Rangwala & Miller, Citation2012), and others show the dependence of surface warming on elevation, with greater warming rates at higher altitudes (Bradley et al., Citation2004; Daly et al., Citation2008; Dong et al., Citation2014; Ghatak et al., Citation2014; Liu, Cheng, Yan, & Yin, Citation2009; Pepin & Lundquist, Citation2008; Rangwala, Miller, & Xu, Citation2009; Rangwala, Sinsky, & Miller, Citation2013; Williams, Losleben, Caine, & Greenland, Citation1996); however, in other studies either no elevation-dependent warming was observed (Ceppi, Scherrer, Fischer, & Appenzeller, Citation2012; Pepin & Lundquist, Citation2008; Vuille, Bradley, Werner, & Keiming, Citation2003; Vuille & Bradley, Citation2000; You et al., Citation2010) or even decreasing air temperature trends with elevation were reported (Beniston & Rebetez, Citation1996; Ceppi et al., Citation2012; Lu, Kang, Li, & Theakstone, Citation2010; Vuille & Bradley, Citation2000). Thus, there is a need to further explore how air temperature changes are interrelated with time, space, and elevation in mountainous regions. This study examines whether warming differs with elevation for a given mountain region. Further, it explores the physical processes responsible for such different outcomes in the mountain environment and discusses some of the local and regional implications of these changes.
Several factors are associated with elevation that may lead to different warming responses in mountains. Indeed, different physical mechanisms and processes associated with either elevational differences or sensitivity of surface warming along with the atmospheric circulation may be responsible for enhanced air temperature trends at high elevations. Furthermore, these mechanisms and processes produce different annual and seasonal warming trends in the mountains (Ceppi et al., Citation2012; Rangwala & Miller, Citation2012). Detailed studies of changes in climatic variables, especially air temperature in pristine mountain environments, remain limited despite their importance (Bradley et al., Citation2004).
The objectives of this paper are to (i) explore the annual and seasonal trends of air temperatures in the Cariboo Mountains Region (CMR) of British Columbia (BC) from 1950 to 2010 and (ii) assess whether there are systematically differing trends in the higher elevations of the CMR compared with lower elevations. Further, we will discuss the possible climatic factors and physical mechanisms for the dependence of air temperature trends on elevation and the potential consequences of such changes for the environment of the region. The findings on air temperature trends in mountains at global and regional scales are inconsistent. Further, no studies have explored the trends and elevational dependence of air temperature for the mountains of BC. Thus, this paper seeks to fill an important knowledge gap in the understanding of the trends in air temperature and their dependence on elevation for the mountains of BC.
The remainder of this paper is structured as follows: the study area is described in Section 2, and the data and methods used are introduced in Section 3; further details on the methods are described in the Appendix. Results of the air temperature trends and their dependence on elevation are presented in Section 4. In Section 5 we compare our results with similar studies, discuss possible climatic drivers for the dependence of air temperature on elevation, and assess some implications of these changes. Section 6 provides our conclusions and guidance for future research.
2 Study area
To understand the complex interaction between mountains and air temperature, the CMR of north-central BC was selected as a study area (). These mountains form the northern extension of the Columbia Mountains and lie between the interior plateau and the Rocky Mountain Trench in BC. The study domain of the CMR is approximately 245 km in length and 44,150 km2 in area. The study area extends from 51° 37′N to 53° 30′N latitude and 119° 6′W to 122° 33′W longitude with elevations ranging from 330 masl (metres above sea level) to the highest peak at 3520 masl (at Mount Sir Wilfrid Laurier).
Fig. 1 Topographic map of the Cariboo Mountains Region (CMR) and its location within British Columbia, Canada, along with the location of the CAMnet and snow pillow stations used for validation and comparison of the gridded data.
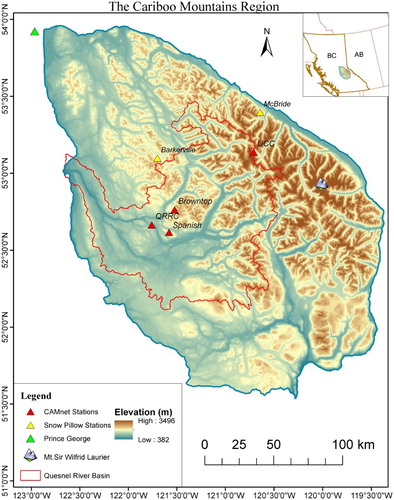
The CMR lies in the prevailing westerlies of the northern hemisphere mid-latitudes and forms a natural obstacle to the transport of moisture from the Pacific Ocean, causing strong orographic forcing. It experiences a transitional climate and is wetter than the Rocky Mountains to the east and interior plateau to the west but drier than the Coast Mountains further to the west (Beedle, Menounos, & Wheate, Citation2015).
The inland temperate rainforest is unique to this region, where forests dominated by red cedar (Thuja plicata) and hemlock (Tsuga heterophylla) are found in the lower valleys of the region. Logdepole pine (Pinus contorta), Engelmann spruce (Picea engelmannii), and subalpine fir (Abies lasiocarpa) are found in the mid-elevations, and only alpine meadows and lichens are found above the tree line (∼1700 masl) (Déry, Clifton, MacLeod, & Beedle, Citation2010; ForestEthics, Citation2014; Stevenson et al., Citation2011). The Cariboo Mountains provide habitat for the endangered mountain caribou, and its rivers and creeks are important habitats for keystone salmon species (Beacham & Murray, Citation1989; Beacham et al., Citation2004; Déry, Hernández-Henríquez, Owens, Parkes, & Petticrew, Citation2012; English et al., Citation2005; Mountain Caribou Science Team, Citation2005).
3 Data and methods
a Data
There are few observational stations in the CMR, especially at higher elevations, with both long-term and/or reliable quality data. The challenge for climate studies in remote regions is the lack of sufficient weather stations to monitor the local climate (Beniston, Citation2006; Bradley et al., Citation2004). Therefore, we used an observation-based interpolated gridded dataset using the Australian National University spline interpolation (ANUSPLIN), developed by Natural Resources Canada (NRCan) that encompasses all of Canada (NRCan, Citation2014). The air temperature data of the study domain are clipped from this nation-wide gridded dataset and consist of daily minimum and maximum air temperatures at a spatial resolution of five arc-minutes (∼10 km) spanning the period from 1950 to 2010.
In NRCan's ANUSPLIN gridded data, daily minimum and maximum temperature surfaces are calculated by fitting standard trivariate smoothing spline functions of three independent variables: longitude, latitude, and elevation identifying the location of each station (Hutchinson, Citation1991; Hutchinson et al., Citation2009; Hopkinson et al., Citation2011; McKenney et al., Citation2011). When a full trivariate spline function of latitude, longitude, and elevation is fitted it accounts for variation in air temperature lapse rates over the terrain. This method utilizes every observational data point that gives the robust and stable determination of dependence on the variable, particularly in data sparse, high elevation regions (McKenney et al., Citation2011; Hutchinson et al., Citation2009; Hutchinson & Xu, Citation2013; Hutchinson, Citation1991).
The ANUSPLIN gridded data are validated with an independent observational dataset from the Cariboo Alpine Mesonet (CAMnet) stations to determine how well they capture air temperature variations in the CMR (Déry et al., Citation2010; Sharma, Citation2014). Four CAMnet stations covering different elevations and with maximum continuous data are selected to validate the gridded data (). The daily frequency CAMnet data from 2007 to 2010 are averaged and aggregated to monthly values after quality control. The corresponding ANUSPLIN data from each grid point nearest the CAMnet station are extracted for the same period. In addition, the ANUSPLIN monthly temperature data are compared with data from long-term (>30 years) stations for two high-elevation snow pillow stations operated by the BC Ministry of Forests, Lands and Natural Resource Operations, namely the McBride (Upper) station (elevation 1620 m, ID 1A02P) and the Barkerville station (elevation 1520 m, ID 1A03P).
Table 1. Location and elevational differences of the CAMnet stations used for validation of the gridded data with corresponding gridded data elevation.
The paucity of meteorological stations at higher elevations in the CMR requires the use of the gridded ANUSPLIN dataset in this study. Although the gridded data are a good match with observations from independent CAMnet station data situated at high altitudes, caution must be used in interpreting results at elevations beyond those of the available meteorological stations. Although there is relatively good coverage of meteorological stations below 2000 m, few are situated in the alpine terrain of the CMR above this elevation. Thus, the reconstructed gridded data for the points of the CMR may be considered largely as being interpolated. Only 4% of the total grid points above 2000 m elevation are used in this study. Indeed, studies by Hijmans, Cameron, Parra, Jones, and Jarvis (Citation2005) and Bussières and Milewska (Citation2010) both report negative biases in the ANUSPLIN data in mountainous terrain including the Rocky Mountains. As such, there is greater uncertainty in the results of air temperature trends for higher elevations (>2000 m) of the Cariboo Mountains, although this affects a relatively small number of grid points.
b Methods
The daily frequency NRCan data are averaged and aggregated to annual and seasonal means for each grid cell. Temporal and spatial analyses of the mean aggregated gridded data are then performed. As a first step for the temporal analyses, the mean of all the grid cells for each year or seasons of each year is calculated. For spatial analysis, calculations are executed at the grid scale.
Temperature anomalies are calculated for annual and seasonal time series for the period 1950 to 2010 so that the data can be compared easily. We used the Mann-Kendall, non-parametric test to estimate trends in air temperature in the CMR (Déry, Stieglitz, McKenna, & Wood, Citation2005; Kendall, Citation1975; Mann, Citation1945; Wilks, Citation2011). The Mann-Kendall trend test is based on the relative ranking of the data rather than model fitting. This test is robust in that it is resistant to outlier effects, dominant data, and non-normal data. This test has been found to be an excellent tool for trend detection by many researchers in similar hydroclimatic studies (Burford, Déry, & Holmes, Citation2009; Burn & Elnur, Citation2002; Déry & Brown, Citation2007; Déry et al., Citation2005; Déry & Wood, Citation2005; Gan & Kwong, Citation1992; Gocic & Trajkovic, Citation2013; Modarres & Sarhadi, Citation2009; Shi, Déry, Groisman, & Lettenmaier, Citation2013). Further, trend magnitudes are calculated using the Theil-Sen trend estimate (Déry et al., Citation2005; Mondal, Kundu, & Mukhopadhyay, Citation2012; Sen, Citation1968).
The elevational dependence of trends is analyzed using the locally weighted regression (LOESS) curve. Annual and seasonal trends are plotted with respect to elevation for each grid cell of the study area. Further details on the methods used to calculate the climate anomalies, to establish trends and their significance, and to draw the LOESS curves are provided in the Appendix.
4 Results
a Validation of Gridded Data
Overall, the gridded data compare well with the observations from the CAMnet stations for both minimum and maximum air temperatures for all months (). The gridded data capture the patterns very well; however, there is some overestimation of the magnitudes of monthly maximum air temperature anomalies, especially for the Browntop and Upper Castle Creek (UCC) stations ( and ). The statistical performance of the gridded temperature anomalies also indicates good model fit with correlation coefficient (r) values greater than 0.96 (p < 0.05) at all stations (). The root-mean-square errors (RMSEs) and mean absolute error (MAE) for air temperature anomalies are relatively low with average values of 1.27° and 1.66°C, respectively. There are some discrepancies between the observed and gridded temperature data in the CMR, especially in the maximum air temperature data. This is likely a result of the difference in elevation between the station used to provide validation data and the grid cell nearest to the station (). The Quesnel River Research Centre (QRRC) and UCC stations, which are at the lowest and highest elevations, respectively, show negative differences in elevation with the gridded data; the other two stations show positive differences in elevation ().
Fig. 2 Validation of the gridded ANUSPLIN monthly mean minimum and maximum air temperature anomalies with observations from CAMnet weather stations: Browntop Mountain, Quesnel River Research Centre (QRRC), Spanish Mountain, and Upper Castle Creek (UCC) in the CMR, 2007–2010.
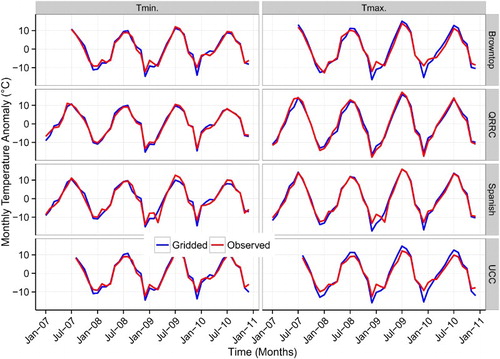
Fig. 3 Comparison between observed and gridded mean monthly minimum and maximum air temperature anomalies for the 2007–2010 period at four locations in the CMR. The solid dark blue diagonal line is the 1:1 line.
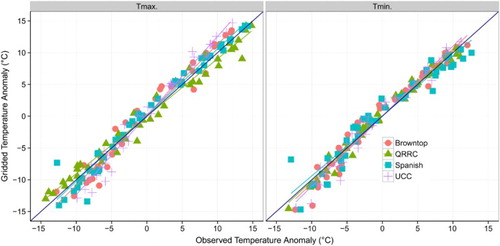
Table 2. Correlation and error analysis between observed and gridded air temperature data. The analysis is based on the anomalies of monthly values of minimum air temperature (Tmin) and maximum air temperature (Tmax) for January 2007 to December 2010. The following abbreviations are used: Pearson's correlation coefficients (r), root-mean-square error (RMSE), and mean absolute error (MAE). Values in bold are significant at the 95% confidence interval.
Furthermore, the linear trends from ANUSPLIN temperature data are similar to the observed trends from the snow pillow stations. For example, minimum air temperature trends from ANUSPLIN and observed data for Barkerville are 0.23°C decade−1 (p < 0.05) and 0.35°C decade−1 (p < 0.05), respectively. Similarly, maximum air temperature trends from ANUSPLIN and observed data for McBride are 0.30°C decade−1 (p < 0.05) and 0.32°C decade−1 (p < 0.05), respectively. These validation and comparison results are evidence that the observation-based gridded data from ANUSPLIN show good agreement with observational data in the CMR.
b Linear Trend
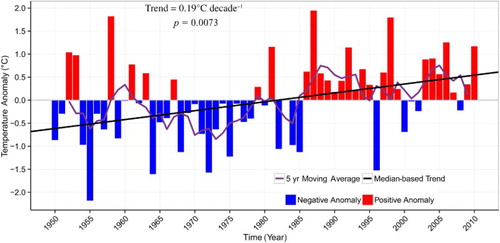
Average annual minimum and maximum air temperature anomalies show strong positive trends of 0.32°C decade−1 (p < 0.05) and 0.19°C decade−1 (p < 0.05), respectively, over the CMR for the 1950–2010 period ( and ). Both annual minimum and maximum air temperatures show positive anomalies for many recent years (24 out of 30 recent years for minimum air temperature and 22 out of 30 recent years for maximum air temperature).
Fig. 4 Annual minimum air temperature anomalies and trend for the CMR, 1950–2010.
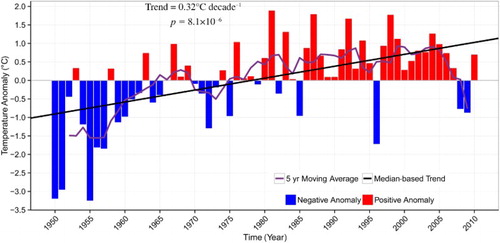
Fig. 5 Annual maximum air temperature anomalies and trend for the CMR, 1950–2010.
Seasonal air temperature analyses indicate significant positive temporal trends during winter, spring, and summer for minimum air temperature. The maximum air temperature trend is significant during winter only ( and ). The minimum air temperature trends in winter (0.62°C decade−1, p < 0.05) and spring (0.35°C decade−1, p < 0.05) are significantly higher than summer (0.12°C decade−1, p < 0.05) and fall (0.10°C decade−1, p = 0.44) (). Maximum seasonal air temperature trends are lower than minimum seasonal air temperature trends. The highest significant maximum air temperature trends (0.39°C decade−1, p < 0.05) of all the seasons occurs in winter followed by spring (0.15°C decade−1, p = 0.15), summer (0.11°C decade−1, p = 0.28), and fall (−0.04°C decade−1, p = 0.74) (). The uncertainty ranges of the trends are shown in . All seasons are warmer in the most recent 30 years than earlier.
Fig. 6 Seasonal minimum air temperature anomalies, trends, and p-value in the CMR, 1950–2010.
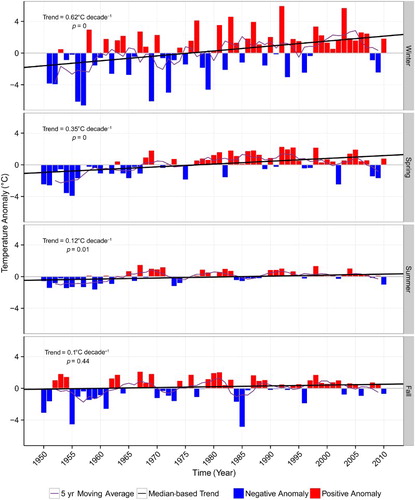
Fig. 7 Seasonal maximum air temperature anomalies, trends, and p-value in the CMR, 1950–2010.
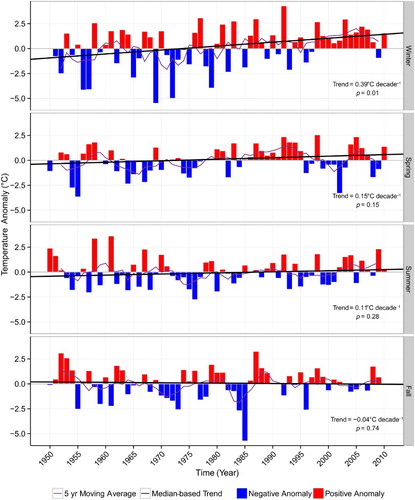
Table 3. Uncertainty range of the linear trends in the CMR. Trends in bold are significant at the 95% confidence level.
c Spatial Trends
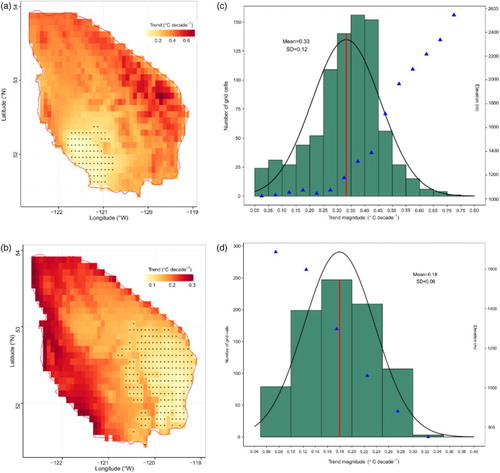
The average annual spatial warming rate over the CMR is 0.33°C decade−1 (maximum is 0.74°C decade−1, minimum is 0.002°C decade−1) and 0.18°C decade−1 (maximum is 0.30°C decade−1, minimum is 0.06°C decade−1) for minimum and maximum air temperatures, respectively (a and b). c and d, respectively, show the distribution of the magnitudes of minimum and maximum air temperature trends over the CMR. All trend magnitudes for both minimum and maximum air temperatures in the CMR are positive; minimum air temperature trend magnitudes are greater than the maximum air temperature trend magnitudes. Most of the CMR region experiences a significant increase in both minimum and maximum air temperatures, except those grid cells represented by dots in a and b.
Fig. 8 (a) Spatial trends of minimum air temperature,1950–2010; (b) spatial trends of the maximum air temperature,1950–2010; (c) distribution of minimum air temperature trends; and (d) distribution of maximum air temperature trends in the CMR. The grid cells with insignificant trends are indicated by black dots. In the distribution plots the red line shows the magnitude of the mean trend and the blue triangles indicate the average elevation for each bar.
d Elevational Dependence of Trends
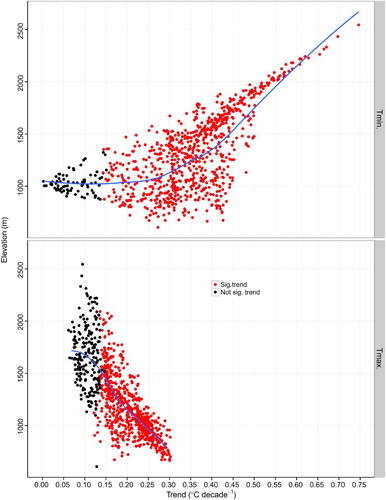
shows the vertical profile of annual minimum and maximum air temperature trends with elevation over the 1950–2010 period in the CMR. There is higher variability in minimum air temperature trends ranging from about 0.00°C decade−1 to 0.80°C decade−1 over the elevation range of the domain (∼500 masl to >2500 masl). Higher and significant minimum air temperature trends clearly arise at higher elevations, with grid cells above 2000 masl exhibiting trends greater than 0.50°C decade−1. Higher and significant maximum air temperature trends that range from 0.05°C decade−1 to 0.30°C decade−1 are found at lower elevations. Grid cells above 2000 masl show mostly non-significant maximum air temperature trends with a magnitude of about 0.10°C decade−1.
Fig. 9 Elevational dependence of annual minimum and maximum temperature trends in the CMR. The solid blue lines show the LOESS fits of trends with elevation.
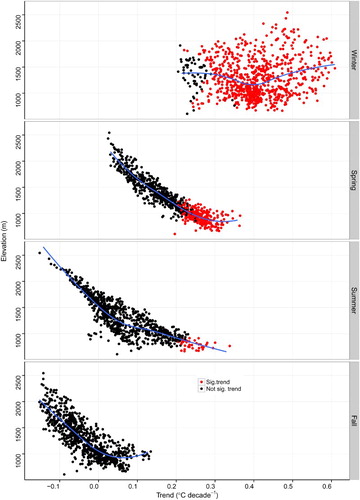
Furthermore, seasonal trend magnitude profiles of minimum and maximum air temperature are shown in and , respectively. Minimum air temperature trend magnitudes are increasing with increasing elevations for all seasons; most of the significant trends are at higher elevations. The highest trend magnitudes (>1.10°C decade−1) are observed above 2000 masl for winter. For both spring and summer, sharp increases in trend magnitudes with increasing elevations are observed; fall minimum air temperature does not show large, significant trends. Winter maximum air temperature does not show a specific pattern with elevation, but for all other seasons, higher and significant maximum air temperature trend magnitudes are found at lower elevations. For example, the highest increases during spring (>0.30°C decade−1) are observed at elevations less than 1000 masl.
Fig. 10 Elevational dependence of seasonal minimum air temperature trends, 1950–2010. The solid blue lines show the LOESS fits of trends with elevation.
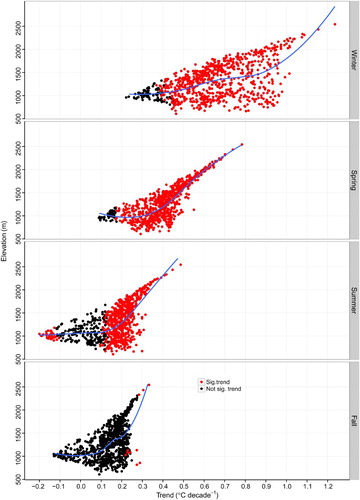
Fig. 11 Elevational dependence of seasonal maximum air temperature trends, 1950–2010. The solid blue lines show the LOESS fits of trends with elevation.
5 Discussion
a Comparison with Other Studies
The trend analysis indicates that the minimum and maximum air temperatures of the CMR region rose by 1.93°C and 1.16°C, respectively, over 1950–2010 providing clear evidence that the region is warming. These increases in air temperature are consistent with other studies reporting for other regions of BC. Dawson, Werner, and Murdock (Citation2008) analyzed historical temperature data from Environment Canada's Quesnel Airport station, which is at the lower elevation of our study area, and found that average air temperature increased 0.32°C decade−1 during the 1950–2001 period. Although point observation data cannot adequately represent the entire study area, they do provide a reference for comparison of our results. The Ministry of Environment (Citation2014) reported an increase of 0.5°–1.7°C in average annual air temperature in BC during the twentieth century. Our findings show similar or higher increases in air temperature in the CMR. Therefore, the CMR region may be warming at rates either equal to or even faster than the remainder of BC. Picketts et al. (Citation2012) showed that the 1918–2006 minimum and maximum temperatures increased at the rate of 0.23°C decade−1 and 0.002°C decade−1, respectively, in Prince George, a city to the northwest of our study area. The trends are much stronger during the latter half of the century. For example, Picketts et al. (Citation2012) found a rate of increase in mean temperature of up to 0.46°C decade−1 from 1971 to 2006. Our findings are consistent with their results. In addition, the warming trends found in this study, especially for minimum air temperature over the CMR, are not only consistent with, but also stronger than most of the regional, northern hemisphere, and global warming trends. The findings on air temperature trends are consistent with the work of Acquaotta, Fratianni, and Garzena (Citation2014), Dong et al. (Citation2014), Rangwala et al. (Citation2013), Stocker et al. (Citation2013), Picketts et al. (Citation2012), Ceppi et al. (Citation2012), Bonsal and Prowse (Citation2003), MWLA (Citation2002), Easterling (Citation2000), Mann, Bradley, and Hughes (Citation1999) and Zhang, Vincent, Hogg, and Niitsoo (Citation2000).
Furthermore, the variation of the trends with topography of minimum and maximum air temperatures show almost opposite patterns with elevation. Indeed, there is a significant negative correlation (−0.43, p < 0.05) between annual minimum and maximum air temperatures trend magnitudes. Minimum air temperature trends are stronger at higher elevations; maximum air temperature trends are stronger at lower elevations. There is a strong seasonal variation in the magnitudes of the air temperature trends and related spatial patterns in the CMR. shows the magnitudes of the annual and seasonal average trends, the range of the trends (showing their variations) used to calculate the average, and the percentage of significant trends.
Table 4. Average spatial annual and seasonal minimum (Tmin) and maximum (Tmax) air temperature trends with their range and percentage of significant values over the CMR, 1950–2010.
b Physical Processes for Elevational Dependence of Temperature
Temperature change is largely a response to the energy balance; therefore, those factors that increase the net flux of energy at the Earth's surface lead to enhanced warming (Pepin et al., Citation2015). If global warming was the only cause and the influence of elevation was not included, then either uniform warming or higher warming in lower elevations throughout the region would be expected. However, the results indicate that the magnitude of the seasonal trends have a spatial difference across elevations over the study area. Therefore, altitude influences the variation of long-term air temperature trends. In the CMR, the patterns of air temperature trends are related to the elevation of the region. The seasonal breakdown of minimum air temperature trends with elevation show stronger, significant trends with increasing elevation. Winter and spring trends are greater than 0.50°C decade−1 above 2000 masl (extreme values of winter trends above 2000 masl are 0.80°C decade−1 to 1.30°C decade−1 and for spring 0.60°C decade−1 to about 0.80°C decade−1). For maximum air temperature, the most significant trends are observed below 1500 masl in all seasons, showing decreasing trends with increasing elevation except for winter. During winter, there is no specific pattern to the trends of maximum air temperature with elevation in the CMR.
The role of the snow–albedo feedback (SAF), clouds, soil moisture, and other local factors in the region are likely responsible for sharp gradients in air temperature trends with elevation in the CMR. The SAF mechanism is one of the strongest climate drivers in the natural climate system. It causes elevational gradients of warming in snow-covered regions, particularly near the 0°C isotherm in relation to the surface energy budget; surface albedo changes are responsible for net solar radiation changes, which, in turn, dominate surface energy balance changes. The effects of such changes are responsible for surface warming (Flanner, Shell, Barlage, Perovich, & Tschudi, Citation2011; Fyfe & Flato, Citation1999). Indeed, many studies have reported amplified warming during spring because of the SAF (Déry & Brown, Citation2007; Fyfe & Flato, Citation1999; Pepin & Lundquist, Citation2008; Scherrer, Ceppi, Croci-Maspoli, & Appenzeller, Citation2012). The SAF may, therefore, have some role in the steep minimum spring and winter air temperature increases with elevation in the CMR.
Clouds affect both short- and longwave radiation, thus affecting surface air temperatures; they directly influence the diurnal air temperature range and precipitation (Duan & Wu, Citation2006; Vuille et al., Citation2003; Free & Sun, Citation2014; Ramanathan et al., Citation1989; Warren, Eastman, & Hahn, Citation2007). Studies have shown that positive trends in cloud amount in BC and the northwestern United States in recent years have resulted in increased downwelling longwave radiation leading to increased minimum air temperature (Dai, Karl, Sun, & Trenberth, Citation2006; Free & Sun, Citation2014; Milewska, Citation2004). Therefore, increased minimum air temperature over the CMR especially during nighttime is consistent with these studies. Similarly, increased cloud amount decreases surface insolation during daytime, especially during summer, which could be another climatic factor responsible for a reduction in daily maximum air temperature over the CMR. Furthermore, it is likely that the increase in minimum air temperature with elevation could be caused by cloud–radiation feedback effects (Liu et al., Citation2009). Therefore, the warm and moist atmosphere leading to increased cloud amount and consequent feedbacks is likely responsible for the air temperature trends observed over the CMR.
Soil moisture conditions affect the energy balance and result in changes in surface energy partitioning and, hence, surface air temperature (Meng & Shen, Citation2014; Seneviratne, Lüthi, Litschi, & Schär, Citation2006). Daily maximum air temperature (Tmax) increases with decreasing soil moisture, whereas an increase in soil moisture decreases the diurnal temperature range (DTR) (Durre, Wallace, & Lettenmaier, Citation2000). The soil moisture content of the CMR may be decreasing with decreasing precipitation during summer (Sharma, Citation2014). This may have contributed to increased maximum air temperature during summer in the CMR.
Other local and regional disturbances such as the Pacific Decadal Oscillation and the El Niño–Southern Oscillation, and aerosol concentrations may be considered additional factors contributing to elevational warming of the CMR. For example, Maness, Kushner, and Fung (Citation2012) found that an increase of about 1°C in summer surface air temperature was associated with shifting evapotranspiration and albedo resulting from forest dieback following the mountain pine beetle infestation in BC. Following Rangwala and Miller (Citation2012), a summary of different physical factors that may be responsible for such elevational dependence of air temperature in the CMR is given in . The observed air temperature trends in the CMR are the result of a combination of one or more mechanisms discussed above. The roles of these mechanisms become more influential during certain times of the day or season of the year. This may account for variations in seasonal trends and differences in the trends in minimum and maximum air temperatures in the CMR.
Table 5. Climatic factors that may be responsible for elevational warming in the CMR.
c Implications of these Changes
Increases in air temperature have had direct and indirect effects on the local and regional ecohydrology and economy of BC. Such effects are expected to continue in the twenty-first century. Increased warming in the CMR has affected and will continue to affect the seasonal climate of the region, its water resources, vegetation growth and distribution, and animal species and their habitat.
With increasing warming trends in cold regions, such as the CMR, the most notable impacts would be on the onset of snowmelt in spring and the start of the freezing period in fall. Spring melt is starting earlier (0.41 day decade−1) and fall freezing is delayed (0.45 day decade−1), consistent with the hypothesis that with increased warming the cryospheric environment may be shrinking (Bonsal & Prowse, Citation2003; Choi, Robinson, & Kang, Citation2010). Such a change in the timing of snowmelt will affect runoff generation and the overall hydrology and water resources of the region (Lundquist, Dettinger, Stewart, & Cayan, Citation2009; Pederson et al., Citation2011). There are other potential impacts, such as decreased reservoir efficiencies (Stewart, Cayan, & Dettinger, Citation2004), increased number of forest fire events (Westerling, Hidalgo, Cayan, & Swetnam, Citation2006), increasing river flooding, and disturbances in the aquatic habitat (Tohver, Hamlet, & Lee, Citation2014; Zwiers, Schnorbus, & Maruszeczka, Citation2011). The earlier start of snowmelt will also influence water rights and management issues among provinces and states in the future (Kenney, Klein, Goemans, Alvord, & Shapiro, Citation2008).
Milder winters will affect the endangered mountain caribou populations in the CMR through increased competition with other species, such as elk, moose, and deer. Further, shallow snow depths will make the caribou's major winter food, arboreal lichen, inaccessible because the caribou are not tall enough to eat the arboreal lichens when snow depths are shallow (Apps, McLellan, Kinley, & Flaa, Citation2001; Apps & McLellan, Citation2006; Lenart, Bowyer, Hoef, & Ruess, Citation2002; Mountain Caribou Science Team, Citation2005; Wittmer et al., Citation2005). Most of the Cariboo Mountains drain into the Fraser River, a major habitat for keystone salmon species. Many studies and model simulations show significant changes in the hydrological regime of the Fraser River basin with increasing temperature (Déry et al., Citation2012; Kang, Shi, Gao, & Déry, Citation2014; Shrestha, Schnorbus, Werner, & Berland, Citation2012). Rising air temperature is one of the causes of a greater range in annual runoff fluctuations in the Fraser River (Déry et al., Citation2012). Such fluctuations have detrimental effects on migrating and spawning salmon. Temperature increases in the CMR are expected to result in increased mountain pine beetle infestations, forest fires, sediment deposits in reservoirs, as well as affect hydroelectricity generation and glacier retreat.
6 Conclusions
The CMR has been warming from 1950 to 2010, with the minimum air temperature increasing at a faster rate than its lowland counterpart. Altitude influences the variation of long-term air temperature trends. Stronger warming signals occur at higher elevations; minimum air temperature has been increasing at a faster rate, especially in winter and spring. Such changes affect the ecohydrology and overall environmental health of northern BC and beyond. This study primarily explored air temperature trends in the elevated region of the Cariboo Mountains, BC, discussed the possible physical factors related to elevational warming, and the impacts of changes to the local ecohydrology. There may be other physical phenomena associated with this variation either in combination or individually. Quantification of the contribution of each of the physical processes to test the elevational dependence of air temperature trends is important but beyond the scope of this work. This could be achieved through regional climate modelling as well as analysis of large- and regional-scale influences.
This study is limited by the coarse-resolution observation-based interpolated data. Further, the discussion of physical factors responsible for elevational warming is supported only through a literature review. For future studies, it is proposed to have a dense network of continuously operating weather stations in the region, especially at high elevations. Furthermore, application of high-resolution, long-term climate or atmospheric models is recommended to increase confidence in the results. Further investigation of relevant physical mechanisms and accurate quantification of processes and their role in the elevational dependence of warming in large mountain ranges is strongly encouraged.
In the future, increases in air temperature over the CMR are likely, making the region warmer than present; large temperature increases will be experienced at higher elevations in the CMR. This warming has seasonal effects that will modify runoff into and the water temperature of the rivers that will ultimately affect the salmon run and population, a keystone species of the region. Milder winters may also make the endangered mountain caribou population more vulnerable. Likewise, these changes will affect the livelihood and practices of local and regional communities and, hence, the society and economy of the region and province. Therefore, understanding climate change, especially in mountainous regions, is important for developing well-informed adaptation policies and minimizing the risks associated with changes to the ecology, hydrology, and economy of a region.
Acknowledgements
We thank the two anonymous reviewers who provided comprehensive and constructive comments on our manuscript. Thanks to Peter L. Jackson (UNBC), Margot Parkes (UNBC), and Andrew Bush (University of Alberta) for their comments on this work. Thanks also to Alex Cannon (Pacific Climate Impacts Consortium), Dan McKenney (Natural Resources Canada), and Pia Papadopol (Natural Resources Canada) for providing access to and information on the ANUSPLIN observed gridded data and all the Northern Hydrometeorology Group (NHG) colleagues at UNBC.
Disclosure statement
No potential conflict of interest was reported by the authors.
Additional information
Funding
References
- Acquaotta, F., Fratianni, S., & Garzena, D. (2014). Temperature changes in the north-western Italian Alps from 1961 to 2010. Theoretical and Applied Climatology, 122, 619–634. doi:10.1007/s00704-014-1316-7
- Apps, C. D., & McLellan, B. N. (2006). Factors influencing the dispersion and fragmentation of endangered mountain caribou populations. Biological Conservation, 130(1), 84–97. doi:10.1016/j.biocon.2005.12.004
- Apps, C. D., McLellan, B. N., Kinley, T. A., & Flaa, J. P. (2001). Scale-dependent habitat selection by Mountain Caribou, Columbia Mountains, British Columbia. The Journal of Wildlife Management, 65(1), 65–77. doi: 10.2307/3803278
- Barry, R. G. (2008). Mountain weather and climate (3rd ed.). Cambridge, UK: Cambridge University Press.
- Barry, R. G. (2012). Recent advances in mountain climate research. Theoretical and Applied Climatology, 110(4), 549–553. doi:10.1007/s00704-012-0695-x
- Beacham, T. D., Lapointe, M., Candy, J. R., McIntosh, B., MacConnachie, C., Tabata, A., … Withler, R. E. (2004). Stock identification of Fraser River sockeye salmon using microsatellites and major histocompatibility complex variation. Transactions of the American Fisheries Society, 133(5), 1117–1137. doi:10.1577/T04-001.1
- Beacham, T. D., & Murray, C. B. (1989). Variation in developmental biology of sockeye salmon (Oncorhynchus nerka) and chinook salmon (O. tshawytscha) in British Columbia. Canadian Journal of Zoology, 67, 2081–2089. doi: 10.1139/z89-297
- Beedle, M. J., Menounos, B., & Wheate, R. (2015). Glacier change in the Cariboo Mountains, British Columbia, Canada (1952–2005). The Cryosphere, 9(1), 65–80. doi:10.5194/tc-9-65-2015
- Beniston, M. (2003). Climatic change in mountain regions: A review of possible impacts. Climatic Change, 59, 5–31. doi: 10.1023/A:1024458411589
- Beniston, M. (2006). Mountain weather and climate: A general overview and a focus on climatic change in the Alps. Hydrobiologia, 562(1), 3–16. doi:10.1007/s10750-005-1802-0
- Beniston, M., Diaz, H. F., & Bradley, R. S. (1997). Climatic change at high elevation sites: An overview. Climatic Change, 36, 233–251. doi: 10.1023/A:1005380714349
- Beniston, M., & Rebetez, M. (1996). Regional behaviour of minimum temperatures in Switzerland for the period 1979-1993. Theoretical and Applied Climatology, 53, 231–243. doi: 10.1007/BF00871739
- Bonsal, B. R., & Prowse, T. D. (2003). Trends and variability in spring and autumn 0°C-isotherm dates over Canada. Climatic Change, 57, 341–358. doi: 10.1023/A:1022810531237
- Bradley, R. S., Keimig, F. T., & Diaz, H. F. (2004). Projected temperature changes along the American cordillera and the planned GCOS network. Geophysical Research Letters, 31(16), 2–5. doi:10.1029/2004GL020229
- Burford, J. E., Déry, S. J., & Holmes, R. D. (2009). Some aspects of the hydroclimatology of the Quesnel River Basin, British Columbia, Canada. Hydrological Processes, 23, 1529–1536. doi:10.1002/hyp
- Burn, D. H., & Elnur, M. A. H. (2002). Detection of hydrologic trends and variability. Journal of Hydrology, 255(1–4), 107–122. doi:10.1016/S0022-1694(01)00514-5
- Bussières, N., & Milewska, E. (2010). Potential and limitations of using satellite data to evaluate the spatial detail in climatological air temperature maps. Atmosphere-Ocean, 48, 294–307. doi:10.3137/AO1112.2010
- Ceppi, P., Scherrer, S. C., Fischer, A. M., & Appenzeller, C. (2012). Revisiting Swiss temperature trends 1959-2008. International Journal of Climatology, 32(2), 203–213. doi:10.1002/joc.2260
- Choi, G., Robinson, D. A., & Kang, S. (2010). Changing northern hemisphere snow seasons. Journal of Climate, 23(19), 5305–5310. doi:10.1175/2010JCLI3644.1
- Cleveland, W. S., & Devlin, S. J. (1988). Locally weighted regression: An approach to regression analysis by local fitting. Journal of American Statistical Association, 83(403), 596–610. doi: 10.1080/01621459.1988.10478639
- Dai, A., Karl, T. R., Sun, B., & Trenberth, K. E. (2006). Recent trends in cloudiness over the United States: A tale of monitoring inadequacies. Bulletin of the American Meteorological Society, 87(5), 597–606. doi:10.1175/BAMS-87-5-597
- Daly, C., Halbleib, M., Smith, J. I., Gibson, W. P., Doggett, M. K., Taylor, G. H., & Pasteris, P. P. (2008). Physiographically sensitive mapping of climatological temperature and precipitation across the conterminous United States. International Journal of Climatology, 28, 2031–2064. doi:10.1002/joc.1688
- Dawson, R. J., Werner, A. T., & Murdock, T. Q. (2008). Preliminary analysis of climate change in the Cariboo-Chilcotin area of British Columbia (p. 49). Victoria, BC: Pacific Climate Impacts Consortium, University of Victoria, Victoria BC.
- Déry, S. J., & Brown, R. D. (2007). Recent northern hemisphere snow cover extent trends and implications for the snow-albedo feedback. Geophysical Research Letters, 34(22), L22504. doi:10.1029/2007GL031474
- Déry, S. J., Clifton, A., MacLeod, S., & Beedle, M. J. (2010). Blowing snow fluxes in the Cariboo Mountains of British Columbia, Canada. Arctic, Antarctic, and Alpine Research, 42(2), 188–197. doi:10.1657/1938-4246-42.2.188
- Déry, S. J., Hernández-Henríquez, M. A., Owens, P. N., Parkes, M. W., & Petticrew, E. L. (2012). A century of hydrological variability and trends in the Fraser River Basin. Environmental Research Letters, 7(2), 024019. doi:10.1088/1748-9326/7/2/024019
- Déry, S. J., Stieglitz, M., McKenna, E. C., & Wood, E. F. (2005). Characteristics and trends of river discharge into Hudson, James, and Ungava Bays, 1964–2000. Journal of Climate, 18, 2540–2557. doi: 10.1175/JCLI3440.1
- Déry, S. J., & Wood, E. F. (2005). Observed twentieth century land surface air temperature and precipitation covariability. Geophysical Research Letters, 32(21), L21414. doi:10.1029/2005GL024234
- Dong, D., Huang, G., Qu, X., Tao, W., & Fan, G. (2014). Temperature trend–altitude relationship in China during 1963–2012. Theoretical and Applied Climatology, 122, 285–294. doi:10.1007/s00704-014-1286-9
- Duan, A., & Wu, G. (2006). Change of cloud amount and the climate warming on the Tibetan Plateau. Geophysical Research Letters, 33(22), L22704. doi:10.1029/2006GL027946
- Durre, I., Wallace, J. M., & Lettenmaier, D. P. (2000). Dependence of extreme daily maximum temperatures on antecedent soil moisture in the contiguous United States during summer. Journal of Climate, 13, 2641–2651. doi: 10.1175/1520-0442(2000)013<2641:DOEDMT>2.0.CO;2
- Easterling, D. R. (2000). Climate extremes: Observations, modeling, and impacts. Science, 289(5487), 2068–2074. doi:10.1126/science.289.5487.2068
- Engler, R., Randin, C. F., Thuiller, W., Dullinger, S., Zimmermann, N. E., Araújo, M. B., … Guisan, A. (2011). 21st century climate change threatens mountain flora unequally across Europe. Global Change Biology, 17(7), 2330–2341. doi:10.1111/j.1365-2486.2010.02393.x
- English, K. K., Koski, W. R., Sliwinski, C., Blakley, A., Cass, A., & Woodey, J. C. (2005). Migration timing and river survival of late-run Fraser river sockeye salmon estimated using radiotelemetry techniques. Transactions of the American Fisheries Society, 134(5), 1342–1365. doi:10.1577/T04-119.1
- Flanner, M. G., Shell, K. M., Barlage, M., Perovich, D. K., & Tschudi, M. A. (2011). Radiative forcing and albedo feedback from the northern hemisphere cryosphere between 1979 and 2008. Nature Geoscience, 4(3), 151–155. doi:10.1038/ngeo1062
- ForestEthics. (2014). Inland temperate rainforest: Saving the endangered Mountain Caribou. Retrieved from http://www.forestethics.org/inland-temperate-rainforest
- Free, M., & Sun, B. (2014). Trends in U.S. total cloud cover from a homogeneity-adjusted dataset. Journal of Climate, 27(13), 4959–4969. doi:10.1175/JCLI-D-13-00722.1
- Fyfe, J. C., & Flato, G. M. (1999). Enhanced climate change and its detection over the Rocky Mountains. Journal of Climate, 12, 230–243. doi: 10.1175/1520-0442-12.1.230
- Gan, T. Y., & Kwong, Y. T. J. (1992). Identification of warming trends in northern Alberta and southern Northwest Territories by the non-parametric Kendall Test Using hydrometric data to detect and monitor climate change. In G. E. Kite & K. D. Harvey (Eds.), Proceedings of NHRI Symposium 8 (pp. 43–56). Saskatoon: National Hydrological Research Institute.
- Ghatak, D., Sinsky, E., & Miller, J. (2014). Role of snow-albedo feedback in higher elevation warming over the Himalayas, Tibetan Plateau and Central Asia. Environmental Research Letters, 9(11), 114008. doi:10.1088/1748-9326/9/11/114008
- Gocic, M., & Trajkovic, S. (2013). Analysis of changes in meteorological variables using Mann-Kendall and Sen's slope estimator statistical tests in Serbia. Global and Planetary Change, 100, 172–182. doi:10.1016/j.gloplacha.2012.10.014
- Hijmans, R. J., Cameron, S. E., Parra, J. L., Jones, P. G., & Jarvis, A. (2005). Very high resolution interpolated climate surfaces for global land areas. International Journal of Climatology, 25(15), 1965–1978. doi:10.1002/joc.1276
- Hopkinson, R. F., McKenney, D. W., Milewska, E. J., Hutchinson, M. F., Papadopol, P., & Vincent, L. A. (2011). Impact of aligning climatological day on gridding daily maximum–minimum temperature and precipitation over Canada. Journal of Applied Meteorology and Climatology, 50(8), 1654–1665. doi:10.1175/2011JAMC2684.1
- Hutchinson, M. F. (1991). The application of thin plate smoothing splines to continent-wide data assimilation. In J. D. Jasper (Ed.), BMRC research report No. 27 (pp. 104–113). Melbourne: Bureau of Meteorology Research Centre.
- Hutchinson, M. F., McKenney, D. W., Lawrence, K., Pedlar, J. H., Hopkinson, R. F., Milewska, E., & Papadopol, P. (2009). Development and testing of Canada-wide interpolated spatial models of daily minimum–maximum temperature and precipitation for 1961–2003. Journal of Applied Meteorology and Climatology, 48(4), 725–741. doi:10.1175/2008JAMC1979.1
- Hutchinson, M. F., & Xu, T. (2013). ANUSPLIN Version 4.4 User Guide. The Australian National University. Retrieved from http://fennerschool.anu.edu.au/files/anusplin44.pdf
- Intergovernmental Panel on Climate Change (IPCC). (2013). Climate change 2013: The physical science basis. Contibution of Working Group I to the fifth assessment report of the Intergovernmental Panel on Climate Change. T. F. Stocker, D. Qin, G.-K. Plattner, M. Tignor, S. K. Allen, J. Boschung, … P. M. Midgley, Eds. Cambridge, United Kingdom and New York, NY, USA: Cambridge University Press.
- Kang, D. H., Shi, X., Gao, H., & Déry, S. J. (2014). On the changing contribution of snow to the hydrology of the Fraser River Basin, Canada. Journal of Hydrometeorology, 15(4), 1344–1365. doi:10.1175/JHM-D-13-0120.1
- Kendall, M. G. (1975). Rank correlation methods (4th ed.). London: Charles Griffin.
- Kenney, D., Klein, R., Goemans, C., Alvord, C., & Shapiro, J. (2008). The impact of earlier spring snowmelt on water rights and administration: A preliminary overview of issues and circumstances in the western states. (Final Project Report). Boulder, Colorado: Western Water Assessment.
- Lenart, E. A., Bowyer, R. T., Hoef, J. Ver, & Ruess, R. W. (2002). Climate change and caribou: Effects of summer weather on forage. Canadian Journal of Zoology, 80, 664–678. doi:10.1139/Z02-034
- Liu, X., Cheng, Z., Yan, L., & Yin, Z.-Y. (2009). Elevation dependency of recent and future minimum surface air temperature trends in the Tibetan Plateau and its surroundings. Global and Planetary Change, 68(3), 164–174. doi:10.1016/j.gloplacha.2009.03.017
- Lu, A., Kang, S., Li, Z., & Theakstone, W. H. (2010). Altitude effects of climatic variation on Tibetan Plateau and its vicinities. Journal of Earth Science, 21(2), 189–198. doi:10.1007/s12583-010-0017-0
- Luce, C. H., Abatzoglou, J. T., & Holden, Z. A. (2013). The missing mountain water: Slower westerlies decrease orographic enhancement in the Pacific Northwest USA. Science, 342(1360), 1360–1364. doi:10.1126/science.1242335
- Lundquist, J. D., Dettinger, M. D., Stewart, I. T., & Cayan, D. R. (2009). Variability and trends in spring runoff in the Western United States. In F. Wagner (Ed.), Climate warming in western North America-Evidence and environmental effects (pp. 63–76). Salt Lake City: University of Utah Press.
- Maness, H., Kushner, P. J., & Fung, I. (2012). Summertime climate response to mountain pine beetle disturbance in British Columbia. Nature Geoscience, 5(12), 65–70. doi:10.1038/ngeo1642
- Mann, H. B. (1945). Nonparametric tests against trend. Econometrica, 13(3), 245–259. doi: 10.2307/1907187
- Mann, M. E., Bradley, R. S., & Hughes, M. K. (1999). Northern hemisphere temperatures during the past millennium: Inferences, uncertainties, and limitations. Geophysical Research Letters, 26(6), 759–762. doi: 10.1029/1999GL900070
- McKenney, D. W., Hutchinson, M. F., Papadopol, P., Lawrence, K., Pedlar, J., Campbell, K., … Owen, T. (2011). Customized spatial climate models for North America. Bulletin of the American Meteorological Society, 92(12), 1611–1622. doi:10.1175/2011BAMS3132.1
- Meng, L., & Shen, Y. (2014). On the relationship of soil moisture and extreme temperatures in east China. Earth Interactions, 18(1), 1–20. doi:10.1175/2013EI000551.1
- Milewska, E. J. (2004). Baseline cloudiness trends in Canada 1953–2002. Atmosphere-Ocean, 42(4), 267–280. doi:10.3137/ao.420404
- Ministry of Environment. (2014). LiveSmartBC: Effects of climate change in British Columbia. Retrieved from http://www.livesmartbc.ca/learn/effects.html
- Modarres, R., & Sarhadi, A. (2009). Rainfall trends analysis of Iran in the last half of the twentieth century. Journal of Geophysical Research, 114, D03101. doi:10.1029/2008JD010707
- Mondal, A., Kundu, S., & Mukhopadhyay, A. (2012). Rainfall trend analysis by Mann-Kendall Test: A case study of north-eastern part of Cuttack District, Orissa. International Journal of Geology, 2(1), 70–78.
- Mountain Caribou Science Team. (2005). Mountain Caribou in British Columbia: A situation analysis (pp. 1–9). Victoria, British Columbia: BC Ministry of Environment.
- MWLA. (2002). Indicators of climate change for British Columbia 2002. Victoria, British Columbia: Ministry of Water, Land and Air Protection.
- NRCan. (2014). Regional, national and international climate modeling. Retrieved from http://cfs.nrcan.gc.ca/projects/3?lang=en_CA
- Pederson, G. T., Gray, S. T., Ault, T., Marsh, W., Fagre, D. B., Bunn, A. G., … Graumlich, L. J. (2011). Climatic controls on the snowmelt hydrology of the northern Rocky Mountains. Journal of Climate, 24(6), 1666–1687. doi:10.1175/2010JCLI3729.1
- Pepin, N., Bradley, R. S., Diaz, H. F., Baraer, M., Caceres, E. B., Forsythe, N., … Yang, D. Q. (2015). Elevation-dependent warming in mountain regions of the world. Nature Climate Change, 5(5), 424–430. doi:10.1038/nclimate2563
- Pepin, N., & Lundquist, J. D. (2008). Temperature trends at high elevations: Patterns across the globe. Geophysical Research Letters, 35, L14701. doi:10.1029/2008GL034026
- Picketts, I. M., Werner, A. T., Murdock, T. Q., Curry, J., Déry, S. J., & Dyer, D. (2012). Planning for climate change adaptation: Lessons learned from a community-based workshop. Environmental Science & Policy, 17, 82–93. doi:10.1016/j.envsci.2011.12.011
- Ramanathan, V., Cess, R. D., Harrison, E. F., Minnis, P., Barkstrom, B. R., Ahmad, E., & Hartmann, D. (1989). Cloud-radiative forcing and climate: Results from the Earth radiation budget experiment. Science, 243(4887), 57–63. doi:10.1126/science.243.4887.57
- Rangwala, I., & Miller, J. R. (2012). Climate change in mountains: A review of elevation-dependent warming and its possible causes. Climatic Change, 114(3-4), 527–547. doi:10.1007/s10584-012-0419-3
- Rangwala, I., Miller, J. R., & Xu, M. (2009). Warming in the Tibetan Plateau: Possible influences of the changes in surface water vapor. Geophysical Research Letters, 36(6), L06703. doi:10.1029/2009GL037245
- Rangwala, I., Sinsky, E., & Miller, J. R. (2013). Amplified warming projections for high altitude regions of the northern hemisphere mid-latitudes from CMIP5 models. Environmental Research Letters, 8(2), 024040. doi:10.1088/1748-9326/8/2/024040
- Scherrer, S. C., Ceppi, P., Croci-Maspoli, M., & Appenzeller, C. (2012). Snow-albedo feedback and Swiss spring temperature trends. Theoretical and Applied Climatology, 110(4), 509–516. doi:10.1007/s00704-012-0712-0
- Sen, P. K. (1968). Estimates of the regression coefficient based on Kendall's Tau. Journal of the American Statistical Association, 63(324), 1379–1389. doi: 10.1080/01621459.1968.10480934
- Seneviratne, S. I., Lüthi, D., Litschi, M., & Schär, C. (2006). Land-atmosphere coupling and climate change in Europe. Nature, 443(7108), 205–209. doi:10.1038/nature05095
- Sharma, A. R. (2014). Trends and elevational dependence of the hydroclimatology of the Cariboo Mountains, British Columbia (M.Sc. Thesis). University of Northern British Columbia, Prince George, British Columbia.
- Shi, X., Déry, S. J., Groisman, P. Y., & Lettenmaier, D. P. (2013). Relationships between recent Pan-Arctic snow cover and hydroclimate trends. Journal of Climate, 26(6), 2048–2064. doi:10.1175/JCLI-D-12-00044.1
- Shrestha, R. R., Schnorbus, M. A., Werner, A. T., & Berland, A. J. (2012). Modelling spatial and temporal variability of hydrologic impacts of climate change in the Fraser River basin, British Columbia, Canada. Hydrological Processes, 26(12), 1840–1860. doi:10.1002/hyp.9283
- Stevenson, S. K., Armleder, H. M., Arsenault, A., Coxson, D., DeLong, S. C., & Jull, M. (2011). British Columbia's Inland Rainforest. Vancouver and Toronto: UBC Press.
- Stewart, I. T., Cayan, D. R., & Dettinger, M. D. (2004). Changes in snowmelt runoff timing in western North America under a “business as usual” climate change scenario. Climatic Change, 62, 217–232. doi: 10.1023/B:CLIM.0000013702.22656.e8
- Stocker, T. F., Qin, D., Plattner, G.-K., Alexander, L. V., Allen, S. K., Bindoff, N. L., … Gregory, J. M. (2013). Technical summary. In T. F. Stocker, D. Qin, G.-K. Plattner, M. Tignor, S. K. Allen, J. Boschung, … P. M. Midgley (Eds.), Climate change 2013: The physical science basis. Contribution of Working Group I to the Fifth Assessment Report of the Intergovernmental Panel on Climate Change. Cambridge, UK: Cambridge University Press. Retrieved from http://www.climatechange2013.org/images/report/WG1AR5_TS_FINAL.pdf
- Tohver, I. M., Hamlet, A. F., & Lee, S. (2014). Impacts of 21st-century climate change on hydrologic extreme in the Pacific Northwest region of North America. JAWRA Journal of the American Water Resources Association, 50(6), 1461–1476. doi:10.1111/jawr.12199
- Vuille, M., & Bradley, R. S. (2000). Mean annual temperature trends and their vertical structure in the tropical Andes. Geophysical Research Letters, 27(23), 3885–3888. doi: 10.1029/2000GL011871
- Vuille, M., Bradley, R. S., Werner, M., & Keiming, F. (2003). 20th century climate change in the tropical Andes: Observations and model results. Climatic Change, 59, 75–99. doi: 10.1023/A:1024406427519
- Wang, Q., Fan, X., & Wang, M. (2013). Recent warming amplification over high elevation regions across the globe. Climate Dynamics, 43, 87–101. doi:10.1007/s00382-013-1889-3
- Warren, S. G., Eastman, R. M., & Hahn, C. J. (2007). A survey of changes in cloud cover and cloud types over land from surface observations, 1971–96. Journal of Climate, 20(4), 717–738. doi:10.1175/JCLI4031.1
- Westerling, A. L., Hidalgo, H. G., Cayan, D. R., & Swetnam, T. W. (2006). Warming and earlier spring increase in western U.S. forest wildfire activity. Science, 313(5789), 940–943. doi:10.1126/science.1128834
- Wilks, D. S. (2011). Statistical methods in the atmospheric sciences (3rd ed.). Amsterdam: Elsevier Inc.
- Williams, M. W., Losleben, M., Caine, N., & Greenland, D. (1996). Changes in climate and hydrochemical responses in a high-elevation catchment in the Rocky Mountains, USA. Limnology and Oceanography, 41(5), 939–946. doi:10.4319/lo.1996.41.5.0939
- Wittmer, H., McLellan, B., Seip, D., Young, J., Kinley, T., Watts, G., & Hamilton, D. (2005). Population dynamics of the endangered mountain ecotype of woodland caribou (Rangifer tarandus caribou) in British Columbia, Canada. Canadian Journal of Zoology, 83(3), 407–418. doi:10.1139/z05-034
- You, Q., Kang, S., Pepin, N., Flügel, W., Yan, Y., Behrawan, H., & Huang, J. (2010). Relationship between temperature trend magnitude, elevation and mean temperature in the Tibetan Plateau from homogenized surface stations and reanalysis data. Global and Planetary Change, 71(1–2), 124–133. doi:10.1016/j.gloplacha.2010.01.020
- Zhang, X., Vincent, L. A., Hogg, W. D., & Niitsoo, A. (2000). Temperature and precipitation trends in Canada during the 20th century. Atmosphere-Ocean, 38(3), 395–429. doi:10.1080/07055900.2000.9649654
- Zwiers, F. W., Schnorbus, M. A., & Maruszeczka, G. D. (2011). Hydrologic impacts of climate change on BC water resources. Victoria, BC: Pacific Climate Impacts Consortium, University of Victoria.
Appendix
1 Climate anomalies
An anomaly, z, is calculated by subtracting the mean of the raw data (for a given year or season) as given in Eq. (A1) (Wilks, Citation2011).
Let be the series of the hydroclimatic data, then the anomaly,
, is
where is the mean of the
time series.
2 Trend magnitude and significance
a Mann-Kendall Trend Test
Let be the monotonically increasing time series with time index,
, then test statistics for the Mann-Kendall trend test
is (Wilks, Citation2011)
where
The test p-value is evaluated using the standard normal distribution as
Using Eq. (A4), the significance of a trend at a level is established if
, where
is the standard normal distribution (Déry et al., Citation2005; Wilks, Citation2011). In this study, significance level α = 0.05 is used; the null hypothesis of no trend is rejected if the standard normal test statistics
b Median-based Trend Estimate (Theil-Sen Trend Estimate)
Let be time;
is the climate variable and
a constant, then the Kendall-Theil Robust Line develops a linear equation
where is the slope. To calculate this slope, the slopes
for each tied group of a time series are computed as
where .
The intercept is calculated by substituting the median time and
and solving for
in Eq. (A5). The median slope of all elements
is then taken as the slope of Eq. (A5) that gives the trend magnitude of the time series. The lower and upper 95% confidence intervals of the slope
are calculated as the slope values corresponding to
and
, where
and
are calculated using Eqs (A7) and (A8), respectively, following Sen (Citation1968).
where is the number of slopes
arranged in ascending order.
3 Elevational dependence of trends
Locally weighted regression (LOESS) is a tool to estimate a regression through a multivariate smoothing procedure, fitting a function of the independent variables locally and in a moving fashion analogous to the way in which a moving average is computed for a time series (Cleveland & Devlin, Citation1988). Let x be a point in a data series then the quadratic fit of x using other points around it, weighted by their distance from x, gives the LOESS. In this study, LOESS is used to evaluate the elevational dependence of temperature in the CMR.