
ABSTRACT
We used a numerical model forced with three different scenarios to analyze Baffin Bay circulation sensitivity to runoff around Baffin Bay, especially the Greenland runoff, for the past (1970–2010) and future (2010–2099). We observed an overall decrease in transport from the Arctic to the North Atlantic for the volume, heat, and freshwater over the time period as well as an augmentation of the freshwater and heat in Baffin Bay. In the early 1990s, the increase in heat in Baffin Bay was consistent with an increase in the West Greenland Irminger Water (WGIW) inflow at Davis Strait while later West Greenland Shelf Water played an important role in the heat import, sustaining the idea that the West Greenland Current might have an impact on the melt of West Greenland tidewater glaciers. The increase in freshwater and later in heat in Baffin Bay leads to changes in the steric height inside Baffin Bay, which leads to changes in the circulation. After 1978, the WGIW reaches the North Water polynya and recirculates into the Baffin Bay gyre where it accumulates over time. In the future experiment, the dynamic changes in Baffin Bay are mainly related to the accumulation of heat inside the gyre.
RÉSUMÉ
[Traduit par la rédaction] Nous avons utilisé un modèle numérique avec trois scénarios de forçage différents, afin d’analyser la sensibilité de la circulation de la baie de Baffin au ruissellement provenant du pourtour de la baie, notamment le ruissellement du Groenland, et ce, pour le passé (1970–2010) et pour le futur (2010–2099). Nous avons observé, sur la période visée, une diminution générale du transport de l’Arctique vers l’Atlantique Nord, en ce qui concerne le volume, la chaleur et l’eau douce, ainsi qu’une augmentation d’eau douce et de chaleur dans la baie de Baffin. Au début des années 1990, l’augmentation de chaleur dans la baie de Baffin correspond à une augmentation des courants de l’ouest du Groenland et de la mer d’Irminger entrant par le détroit de Davis, tandis que plus tard l’eau du plateau de l’ouest du Groenland joue un rôle important en ce qui concerne l’apport de chaleur. Ce qui étaye la notion que le courant de l’ouest du Groenland pourrait agir sur la fonte des glaciers de marée du Groenland occidental. L’augmentation d’eau douce et, plus tard, de chaleur dans la baie de Baffin entraîne des changements de la hauteur stérique dans la baie de Baffin, ce qui modifie la circulation. Après 1978, le courant entrant atteint la polynie des eaux du Nord et circule à nouveau dans le tourbillon de la baie de Baffin, où il s’accumule avec le temps. Dans l’analyse des années futures, les changements dynamiques dans la baie de Baffin sont principalement reliés à l’accumulation de chaleur dans le tourbillon.
1 Introduction
The Arctic Ocean is an enclosed basin surrounded by North America, the Canadian Arctic Archipelago, Greenland, and Eurasia. The relative isolation of the Arctic Ocean from other oceans limits exchanges with the Pacific Ocean to Bering Strait, where relatively warm and freshwater is imported. The Arctic Ocean’s cold and fresh upper layer is exported to southern latitudes. This outflow may take two different pathways: in the East Greenland Current through Fram Strait or through the Canadian Arctic Archipelago (CAA). Previous studies have shown that the CAA is a major pathway for liquid freshwater export from the Arctic to the North Atlantic. The freshwater transport through the CAA is evaluated as being between and
mSv (1 mSv =
m3 s−1), with a reference salinity of 34.8 (Dickson et al., Citation2007; McGeehan & Maslowski, Citation2012; Serreze et al., Citation2006) while the liquid freshwater export through Fram Strait is evaluated as being
mSv, with a slightly different reference salinity of 34.9 (Rabe et al., Citation2013). Once in the CAA, the outflow can leave through Baffin Bay (Aksenov, Bacon, Coward, & Holliday, Citation2010; Wang, Myers, Hu, & Bush, Citation2012) or through Foxe Basin to Hudson Strait.
Baffin Bay is a small and relatively deep body of water between the CAA and Greenland (a). It is surrounded by Greenland to the east, Ellesmere and Devon Islands to the north, and Baffin Island to the west. It is about 1400 km long by 550 km wide, with a large abyssal plain in its central area having a depth greater than 2300 m. The continental shelf on the Baffin Island side is narrower than on the Greenland side. The connection to the Labrador Sea takes place in Davis Strait, which has a sill depth of about 650 m and a width of about 170 km. In the north, Baffin Bay is connected to the Arctic Ocean through three different passages. The deepest, Nares Strait located between Greenland and Ellesmere Island, is about 26 km wide at its narrowest point, with a sill about 250 m deep in the centre of the strait. The shallower Lancaster and Jones Sounds are located between Baffin and Devon Islands and Devon and Ellesmere Islands, respectively. The first has a width of about 55 km and a sill about 125 m deep, while the second is no wider than 30 km with a 190 m deep sill (Melling et al., Citation2008; Tang et al., Citation2004). Baffin Bay is mostly ice free in the summer and has near complete ice cover between December and April (Tang et al., Citation2004).
Fig. 1 (a) Baffin Bay and the Canadian Arctic Archipelago (NS: Nares Strait; JS: Jones Sound; LS: Lancaster Sound; DS: Davis Strait, SS: Smith Sound) with its placement in the Arctic (inset).The black arrows represent the direction of travel of different water masses (solid line: West Greenland Current; dotted line: West Greenland Shelf Water; dashed lines: Arctic Water). The straight dark lines indicate the domain boundaries used in our calculations. (b) Representation of the definitions of the water masses used in the current paper.
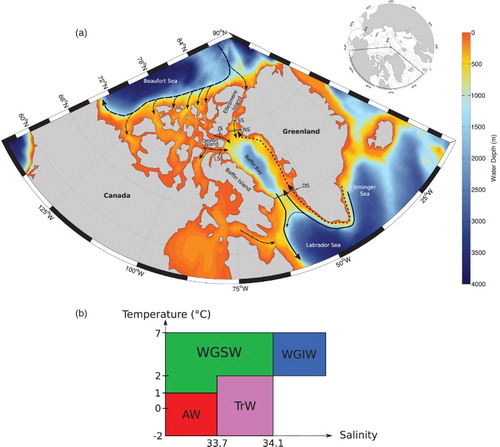
The oceanic circulation in Baffin Bay is mostly driven by a baroclinic gradient (Kliem & Greenberg, Citation2003; Myers & Ribergaard, Citation2013; Tang et al., Citation2004). The West Greenland Slope Current transports the shallow West Greenland Shelf Water (WGSW) while further offshore the West Greenland Current (WGC) carries West Greenland Irminger Water (WGIW). These waters, mostly originating in the Irminger Sea, are Atlantic Waters. They import warm and salty water through the eastern part of Davis Strait (Cuny, Rhines, & Ron Kwok, Citation2005; Curry, Lee, Petrie, Moritz, & Kwok, Citation2014; Tang et al., Citation2004). They follow the continental shelf and slope in east Baffin Bay, with the WGC following the west coast of Greenland. In the north of Smith Sound, in northern Baffin Bay, this current curves to the west, following the east coast of Baffin Island toward the south. It is then called the Baffin Island Current (Münchow, Falkner, & Melling, Citation2015). Export to the Labrador Sea occurs in the western part of Davis Strait. Moreover, in northern Baffin Bay, the WGC is modified by the addition of shallow cold and fresh polar outflow, or Arctic Water (AW), that enters Baffin Bay through Nares Strait and Jones and Lancaster Sounds. Finally, a cyclonic gyre exists in the centre of Baffin Bay (Fissel, Lemon, & Birch, Citation1982; Tang et al., Citation2004). Under the previously mentioned water masses, a fourth water mass fills the bottom of Baffin Bay; this is the Transitional Water (TrW).
Each of these water masses will have, due to its origin, different temperatures and salinity. In the current paper, we use the same definitions for the water masses as Curry et al. (Citation2014): WGIW is warm (T > 2°C) and salty (S > 34.1), WGSW has a larger temperature range (T < 7°C) and is fresher (S < 34.1), AW is cold (T < 1°C) and fresh (S < 33.7), and TrW lies between the AW and the WGSW (T < 2°C, S > 33.7). b summarizes the water mass definitions.
Between 1916 and 2003, Baffin Bay underwent major changes, becoming warmer and fresher (Zweng & Münchow, Citation2006). The extended warming took place in several parts of the water column. Firstly, a warming in the deep areas in Baffin Bay (between the 300 and 2400 m isobaths) occurred with an increase in temperature of about 0.23°°C decade−1 around 300 m. Secondly, significant warming also happened in the 600 to 1000 m range with a temperature increase of about 0.15°
°C decade−1 in the WGC (0.17°
°C decade−1 at 900 m depth; Zweng and Münchow (Citation2006)). Below, the warming is vertically uniform (
°C decade−1). It is suspected that this increase in temperature is related to changes that bring warmer water into Baffin Bay, as proposed by Holland, Jenkins, and Holland (Citation2008) and Andresen et al. (Citation2011).
The freshening might be a consequence of the observed warming. It has been shown that ice shelf basal melting is sensitive to heat increase in the ocean (Holland, Jenkins, et al., Citation2008; Myers & Ribergaard, Citation2013). In particular, Holland, Thomas, De Young, Ribergaard, and Lyberth (Citation2008) and Andresen et al. (Citation2011) showed, respectively, that the enhanced melting of the Jakobshavn and Helheim Glaciers over the past decades is not only related to milder atmospheric conditions but also to warmer sub-surface water.
The possible impact of the surface temperature increase goes further: if tidewater glaciers are melting, runoff will increase, inputting more freshwater to the ocean surface. Castro de la Guardia, Hu, and Myers (Citation2015) showed from their numerical experiments that this runoff could lead to the lifting of the sea surface height (SSH) in Baffin Bay due to steric effects, changing the baroclinic circulation and reducing the flow through the CAA. The inflow from the WGC will increase, leading to warmer and shallower WGIW that can more easily reach fjords on the Greenland coast and accelerate their melt. Consequently they identified the possibility of a positive feedback between Greenland Ice Sheet melt and Baffin Bay heat content on the eastern Baffin Bay shelf.
The relative impact of the evolution of the temperature and salinity to linear steric height trends in the high latitude ocean was studied by Steele and Ermold (Citation2007) who found that the steric height increase in the North Pacific Subpolar Gyre and Nordic Seas is mostly from freshening. They found freshening in the North Atlantic between 1950 and 2000, but a compensating cooling limited the steric height change. They identified a possible slowdown in the circulation over the North Atlantic and the Arctic Oceans from 1965 to 1990 due to a decrease in steric height, leading to a change in the baroclinic balance. However, their study did not include Baffin Bay.
The long-term evolution of the heat and liquid freshwater going into and out of Baffin Bay is mainly unknown. Observations at Davis Strait and Lancaster Sound show an important variability in the incoming freshwater (heat) flux, with inflow values between and
mSv (18 and 20 TW) at Davis Strait (Cuny et al., Citation2005; Curry, Lee, & Petrie, Citation2011; Dickson et al., Citation2007). At Lancaster Sound, the freshwater and heat inflows are
mSv and
TW, respectively (Melling et al., Citation2008; Petersen, Hamilton, Prinsenberg, & Pettipas, Citation2012). Only freshwater inflow data are available at Nares Strait (between
and
mSv; Melling et al., Citation2008; Münchow Citation2016) and Jones Sound (
mSv, Melling et al., Citation2008). Numerical studies focused on Baffin Bay and the CAA improved our understanding of the fluxes through Baffin Bay by providing numerical evaluation of the unknown fluxes. The simulated net outflow is usually lower than observed at Davis Strait but within the variability range at the northern passages (Aksenov et al., Citation2010; Kliem & Greenberg, Citation2003; McGeehan & Maslowski, Citation2012).
From numerical experiments, the relative importance of each northern passage on heat import has been evaluated. Kliem and Greenberg (Citation2003) found that the same amount of heat crosses Barrow Strait (which feeds Lancaster Sound) and Nares Strait (about each) followed by Jones Sound (
). However, their simulation is based only on summer conditions. Numerical experiments over multiple decades from Aksenov et al. (Citation2010) showed that Lancaster Sound had a higher relative importance in the heat transport into Baffin Bay between 1989 and 2006 than the other northern passages (
of the heat carried, with a reference temperature of
°C). The liquid freshwater transport is
through Lancaster Sound,
through Nares Strait and
through Jones Sound (Aksenov et al., Citation2010; McGeehan & Maslowski, Citation2012).
The evolution of individual water masses inside Baffin Bay has been observed in order to understand the origin of the variability and the changes that happened in Baffin Bay. Myers and Ribergaard (Citation2013) showed that the temperature of the polar water layer in Disko Bay has increased by 1°–2°C since the mid-1990s. An acceleration of this warming occurs after 1997. They also noticed an increase in WGIW heat by a factor of two. From the mooring array at Davis Strait, Curry et al. (Citation2014) observed a decrease in the cold and fresh AW transport between 1987–1990 and 2004–2010 (from to
Sv) and an increase in the warm and salty WGIW inflow (from
to
Sv). The consequences for Baffin Bay is a reduction in the freshwater outflow and an increase in the heat and salt inflow.
A future projection of the Canadian Arctic based on the Special Report on Emissions Scenarios (SRES) A1B scenario shows a lifting of the SSH of Baffin Bay (Hu & Myers, Citation2014). This leads to a decrease in the SSH gradient between the Arctic and North Atlantic Oceans. Consequently, the current velocity in Baffin Bay may be modified in response to the lower baroclinic gradient. In addition, the projection predicts a decrease in sea-ice cover in the CAA, which will increase the freshwater available in the ocean because of sea-ice melt. The increased surface and duration of open water will lead to enhanced penetration of precipitation and runoff into the ocean. Finally, the absence of sea ice will increase the area where heat exchange occurs between the ocean and atmosphere, enhancing air–sea exchange. All of these processes might significantly affect the freshwater and heat supply to the North Atlantic, in particular the Labrador Sea.
The aim of this study is to analyze how the dynamics of Baffin Bay will be modified by the runoff around Baffin Bay, especially from Greenland. In order to do so, we analyzed the evolution of the water masses in Baffin Bay and the transports into and out of the Bay in two sensitivity experiments. One with a constant and the other with an interannual runoff from Greenland. The impact of these changes on the steric height in Baffin Bay for the past (1958–2010) and future (2010–2099) is discussed, as well as the consequences on Baffin Bay circulation and mixing. We present the domain considered, the numerical experiments, their setup, and the numerical tools used for this study in Section 2. The evolution of the volume, heat, and freshwater transport of the entire water column, as well as an evaluation of the model’s ability to reproduce realistic variability for the past will be discussed (Section 3). Then, we break down the results by individual water mass and present the evolution in terms of the volume, heat, and freshwater transport (Section 4), as well as the evolution inside Baffin Bay (Section 5). The same analysis will then be discussed for simulation under an Intergovernmental Panel on Climate Change (IPCC) projection for the future (Section 6). We discuss the significance of the results by showing their relation with Baffin Bay steric height (Section 7) and present conclusions in the final section (Section 8).
2 Method
a Numerical models
In this study we used a pan-Arctic configuration based on the Nucleus for European Modelling of the Ocean (NEMO) numerical framework, version 3.1 (Madec, Citation2008). This coupled ocean and sea-ice model includes a three-dimensional, free surface, hydrostatic, primitive-equation ocean component and a dynamic–thermodynamic sea-ice model. The sea-ice module is from the Louvain-la-Neuve sea-ice model (LIM2; Fichefet & Maqueda, Citation1997) with a modified elastic-viscous-plastic (EVP) ice rheology (Hunke, Citation2001; Hunke & Dukowicz, Citation1997). No-slip and free-slip boundary conditions were applied for sea ice and the ocean, respectively.
Our model domain starts from the North Atlantic north of 45°N and covers the Arctic seas and the northern Bering Sea with a variable horizontal resolution ranging from approximately 11 km within the central CAA region to approximately 15 km in the Arctic Ocean (Hu & Myers, Citation2014). In order to overcome the coordinate singularity at the North Pole in standard spherical grids, an orthogonal transformation method (Murray, Citation1996) was used. In the vertical, 46 -levels were used with layer thickness varying smoothly from approximately 6 m at the surface to approximately 240 m at the bottom. The bathymetry data were derived from the 1 arc-minute global relief model (ETOPO1; Amante & Eakins, Citation2009) provided by the US National Geophysical Data Center (NGDC).
The model was spun up for 18 years with initial ocean temperature and salinity from the Polar Science Center Hydrographic Climatology (PHC 3.0; Steele, Morley, & Ermold, Citation2001) using normal year atmospheric forcing (6-hourly 10 m surface wind, 10 m air temperature and specific humidity, daily downward longwave and shortwave radiation, and monthly total precipitation and snowfall) from the Coordinate Ocean-ice Reference Experiments-phase II (CORE-II; Large & Yeager, Citation2009). No temperature or salinity restoring is active except the buffer zones close to the open boundaries and in Foxe Basin. More details can be found in Hu and Myers (Citation2013).
After the spin up we have three different experiments: an interannual hindcast experiment (HINDCAST), forced with atmospheric forcing (1970–2007) from the interannual CORE-II dataset (Large and Yeager, Citation2009); a climatic experiment (CLIMATIC), forced by an interannual (1970–2010) hindcast of rescaled monthly atmospheric output from the twentieth century climate experiment (20C3M) of the UK Met Office Hadley Centre Coupled Model, version 3 (HadCM3; Gordon et al., Citation2000) (horizontal resolution of 3.75° 2.5°); and a future scenario simulation (2010–2099; FUTURE). HINDCAST atmospheric variables used the same frequency of the CORE-II normal year forcing. For CLIMATIC and FUTURE, the experiment was forced with monthly rescaled atmospheric output from HadCM3 run under the SRES A1B scenario (Nakicenovic & Swart, Citation2000) (horizontal resolution of 3.75°
2.5°).
The low resolution of the atmospheric model fields could affect the high-resolution ocean simulation because of local bias (e.g., due to too coarse a coastline in the atmospheric model). Thus, following an approach similar to that of Dumas, Flato, and Brown (Citation2006), reconstructing the atmospheric dataset by applying the variations in the original fields onto relatively higher resolution climatological fields might help avoid part of the bias. This approach allowed us to study the responses of the sea ice and ocean to changes in the original fields, meanwhile, guaranteeing a reasonable seasonal cycle by taking advantage of the climatology dataset as the base. The preprocess is documented in Hu and Myers (Citation2014). A brief summary is described here.
The precipitation, snowfall, and specific humidity are corrected by multiplying the climatology by a ratio between the original numerical output and the climatological mean (CORE-II normal year data):(1) where
is the new value;
is the CORE-II normal year value;
is the output from HadCM3;
is the average of the output from HadCM3 for 1970 to 1999, and
is time. The surface air temperature and downward radiation are modified by adding the mathematical difference from the mean to climatology data:
(2)
Runoff and winds ( and
winds) are left unmodified.
Monthly eastern and western open boundary fields are taken from a global numerical simulation (ORCA025-KAB001; Barnier et al., Citation2006) for HINDCAST. The open boundary fields for CLIMATIC and FUTURE are taken from the corresponding runs of the Canadian Centre for Climate Modelling and Analysis (CCCma) Third Generation Coupled Global Climate Model CGCM3.1 (Gordon et al., Citation2000).
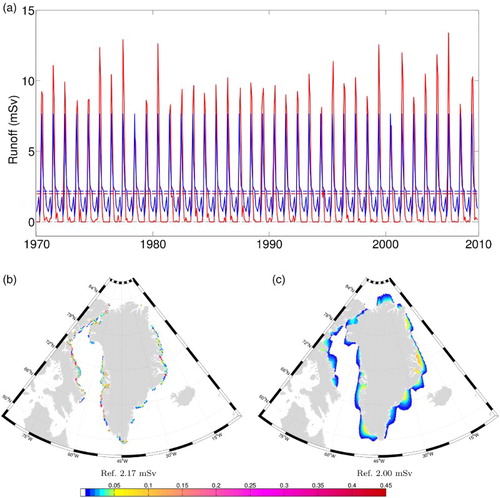
The runoff after the spin up phase is different in the experiments. The HINDCAST simulation uses monthly Dai and Trembert (2002) climatology runoff data repeated every year, whereas CLIMATIC and FUTURE use unmodified interannual runoff data from HadCM3 output. Both seasonal and interannual cycles are different. Around Baffin Bay, on average, between 1970 and 2010, the HINDCAST simulation has more runoff into Baffin Bay ( mSv) than the CLIMATIC simulation (
mSv; a). However, the interannual seasonal runoff has a more realistic seasonal cycle, with more runoff in summer and almost no runoff during winter and with interannual varibility (a). Moreover, the spatial distribution is different. The HINDCAST simulated runoff is located close to the coast leading to locally high values of freshwater (b), while the interannual runoff has a smoother distribution of freshwater along the continental shelf, which includes freshwater from rivers, glaciers, and fjords (b), as well as the coarse resolution of the HadCM3 model. Note that the simulated sea surface is used as the river’s temperature in the experiments.
Fig. 2 (a) Temporal evolution of summed monthly runoff over the areas shown in (b) and (c). HINDCAST simulation is in blue and CLIMATIC is in red. (b) and (c) Spatial distribution of the runoff around Baffin Bay and Greenland for (b) HINDCAST and (c) CLIMATIC. The colour bar shows the mean fraction of runoff at each grid point averaged over the mean runoff from 1970 to 2010 for each forcing considered.
b Transport and storage
We define Baffin Bay as the area located between Davis Strait in the south and Lancaster Sound, Jones Sound, and Nares Strait in the north (grey lines in a). The criteria used to define each water mass are based on the water masses crossing Davis Strait, similar to those used by Curry et al. (Citation2011) as described in Section 1.
To characterize the evolution of Baffin Bay water masses we examined the relation between the heat and freshwater contained in Baffin Bay and the evolution of the transport of volume, heat, and freshwater at the boundaries of the domain, including the ocean–air (sea-ice) boundary.
1 Transport calculations
The annual averaged volume, liquid freshwater, and heat transports were computed for each grid-cell face, summed over the grid cells defining each boundary and time averaged to compute the annual transport. Volume transport across a grid cell of a given section is calculated by multiplying the normal velocity field belonging to a grid cell by the corresponding area of the same grid cell. To obtain the total transport across a section we then sum the transport of each individual grid cell belonging to the cross-section considered. Heat (Eq. (3a)) and liquid freshwater (Eq. (3b)) transports are calculated as:(3) where
,
,
, Cp, and
are, respectively, the normal velocity, the salinity, the temperature, the heat content (Cp = 4218 J °C−1 kg−1), and area associated with a given grid cell. The reference salinity (
) considers the average Arctic Ocean salinity (Aagaard & Carmack, Citation1989), and the reference temperature (
°C) corresponds to the freezing point at the highest salinity possible in this area. The temperature reference was chosen to avoid a negative value for heat that would be wrongly summed during the discrete integration process. The transport sign is defined as positive when entering Baffin Bay and negative when exiting Baffin Bay. Solid transports were not examined, considering their minor contribution (Sou & Flato, Citation2009). If not specified, the freshwater transport discussed later in the paper will consider only the liquid part.
2 Domain storage calculations
The volume storage is defined by computing the volume of each grid cell within the domain. Heat and freshwater storage are computed from the 5- or 30-day average ocean temperature and salinity:(4) where
,
, and
are, respectively, the normal velocity, the salinity, the temperature, the heat content, and volume associated with a given grid cell.
c Steric height
The steric height corresponds to the vertically integrated departure of density at a given salinity, temperature, and pressure,
,
, and
, respectively, from a standard reference
multiplied by the layer thickness
summed from the surface to a given depth
, computed from the 5- or 30-day average model output as:
(5) In order to be certain that we captured all the changes in the deeper part of Baffin Bay the integration was carried out over the top 1000 m.
The total steric height can also be separated into the contribution from temperature (thermosteric height, ) and salinity (halosteric height,
) alone, that is:
(6)
Non-linear terms in the equation of state are generally less than 1% and were neglected (Landerer, Jungclaus, & Marotzke, Citation2007). Non-Boussinesq effects are negligible in our region of interest and thus were not taken in consideration by the model, which uses the Boussinesq approximation (Griffies & Greatbatch, Citation2012). Moreover, the thermosteric (halosteric) height can be related to the vertically integrated heat content and freshwater content for small departures of temperature (salinity) from their reference value, that is,(7)
where heat capacity is considered constant over the the temperature range (
°C−1 kg−1) and angle brackets
denote the vertical average.
3 Transports
a Volume
The net long-term model outflow transport through Davis Strait is larger ( versus
Sv,
Sv
) in the HINDCAST simulation than in the CLIMATIC one (a). This is comparable to observational estimates between
and
Sv (Cuny et al., Citation2005; Curry et al., Citation2011; Melling et al., Citation2008). Values from HINDCAST are closer to these estimates than previous modelling experiments, such as McGeehan and Maslowski (Citation2012) who obtained
Sv between 1979 and 2004. Both the CLIMATIC and HINDCAST simulations have local transport peaks in the early 1980s and 1990s. Transports between the two experiments are not correlated. Higher frequency variability is seen in HINDCAST.
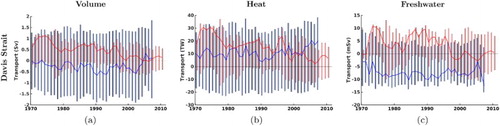
Fig. 3 Total volume (left column), heat (middle column), and freshwater (right column) transports for Davis Strait (a), (b), and (c), Lancaster Sound (d), (e), and (f), Nares Strait (g), (h), and (i), and Jones Sound (j), (k), and (l). The bars show the inflow (positive) or outflow (negative) component of the transport only. The thick coloured lines correspond to the net transport. The HINDCAST simulation is shown in blue, and CLIMATIC is shown in red.
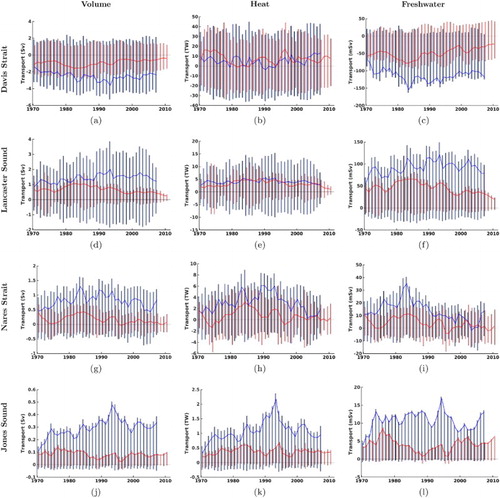
The inflow component of the Davis Strait transport (i.e., inflow in the WGC) is comparable between the two runs ( versus
Sv). Thus, the difference in the net transport between the two experiments is a function of the southward transport in the Baffin Island Current being significantly larger (
versus
Sv) in HINDCAST. Years with enhanced outflow transport are generally those with larger net transport.
The volume transport is larger in HINDCAST for each of the northern passages. Lancaster Sound is the main source of inflow (73% in HINDCAST and 56% in CLIMATIC) into Baffin Bay, followed by Nares Strait (32% and 17%) and Jones Sound (12% and 9%). Compared with previous studies focused on the northern transport, values from CLIMATIC are closer to the observational breakdown, evaluated at approximately at Lancaster Sound, approximately
at Nares Strait, and approximately
at Jones Sound (Melling et al., Citation2008; Münchow, Falkner, & Melling, Citation2007; Münchow & Melling, Citation2008; Petersen et al., Citation2012).
At Lancaster Sound, CLIMATIC shows a decreasing trend in the net transport after 1984 from Sv to
Sv (d) because of an
reduction in the inflow (from
to
Sv) and a reduction of
in the outflow (from
Sv to
Sv). This evolution is not present in HINDCAST where the variability hides any clear trend.
Nares Strait outflow stays stable in both experiments, with an average of Sv (g). The inflow component has more variability and controls the net transport. The transport in HINDCAST increases between 1970 and 1985 from
Sv to
Sv (increase of
) and decreases after 1985 to its initial value. Only the second period is present in CLIMATIC (decrease of
), but it is initiated five years later, in 1990.
The net transport for Jones Sound in the HINDCAST simulation increases from Sv to
Sv with a spike of about
Sv in 1992 (j) because of higher inflow. The net transport in CLIMATIC decreases slightly from
Sv to
Sv after 1984 (decrease of about
).
b Heat
The net heat transport at Davis Strait is slightly higher in the CLIMATIC simulation ( versus
TW; b). The inflow component only (i.e., the heat carried by the WGC) is also higher in this experiment (
versus
TW). The relatively low value of the net transport in HINDCAST is related to a higher outflow (
versus
TW). This is comparable to the observational estimates of about
TW (inflow) and
TW (outflow) (Cuny et al., Citation2005). We note that Cuny et al. (Citation2005) do not include the West Greenland shelf, and they use a different reference temperature of about 0°C than our −2°C. From numerical modelling experiments, Aksenov et al. (Citation2010) showed a smaller value for net heat transport of about
TW, with a reference temperature of −0.1°C.
Both experiments present strong interannual variability that is very likely controlled by the strength of the WGC. This is consistent with the high correlation coefficient between the total net transport and the inflow (0.90 in CLIMATIC and 0.80 in HINDCAST). We note the large increase in heat associated with a higher inflow between 1994 and 1996 in both experiments.
The net heat transport at the northern passages presents a net inflow in both experiments at Lancaster Sound ( versus
TW, correlated at 0.48; e). HINDCAST net transport is higher for both Nares Strait (
versus
TW; h) and Jones Sound (
versus
TW; k). This compares well with the previous numerical modelling study of Aksenov et al. (Citation2010) that evaluated Lancaster Sound heat inflow at about
TW, Nares Strait at about
TW, and an outflow at about
TW at Jones Sound.
The net heat transport through Lancaster Sound stays close to its average over the time period for both experiments ( and
TW). In both experiments, the heat transport is highly correlated to the net transport (
). After 1988 the correlation coefficient increases to 0.98 for CLIMATIC and 0.89 for HINDCAST.
Nares Strait heat transport is highly correlated to the volume transport for Davis Strait () in both experiments. The heat outflow at Nares Strait is related to the warm inflow pulse that follows the west coast of Greenland and pushes north inside a deep trough present at Smith Sound, before shifting toward the west and returning.
At Jones Sound, the volume and heat transports are highly correlated in HINDCAST (correlation coefficient of about 0.90), while in CLIMATIC the correlation coefficient decreases to 0.50.
c Freshwater
At Davis Strait, the evolution of the net liquid freshwater transport is highly correlated to the volume transport (HINDCAST: 0.95, CLIMATIC: 0.81; c). The net freshwater transport is higher in HINDCAST ( versus
mSv). This is comparable to the observations and other model results that are between
mSv (model; McGeehan and Maslowski (Citation2012)) and
mSv (observation; Curry et al. (Citation2011).
At the northern passages, the correlation coefficient between the volume transport and the liquid freshwater transport is the highest at Lancaster Sound with a correlation coefficient greater than 0.95 for both experiments (f). Regarding the other passages, CLIMATIC has a higher correlation coefficient for Nares Strait (0.96 versus 0.63; i) and Jones Sound (0.86 versus 0.62; l). The net freshwater transport is still lower in CLIMATIC (Lancaster Sound: versus
mSv; Jones Sound:
versus
; and Nares Strait:
versus
mSv). This is comparable to observations that evaluated the freshwater transport as being between
and
mSv for Lancaster Sound,
mSv at Jones Sound, and
to
mSv at Nares Strait (McGeehan & Maslowski, Citation2012; Melling et al., Citation2008; Münchow et al., Citation2007; Wekerle, Wang, Danilov, Jung, & Schroter, Citation2013). From a numerical study, Aksenov et al. (Citation2010) evaluated the liquid transport between 1989 and 2005 as being
mSv at Lancaster Sound,
mSv at Nares Strait, and
mSv at Jones Sound.
4 Transport of the water masses
a Arctic water
At Davis Strait, the AW transport is mainly southward (i.e., outflow) in both experiments (a). The net transport is higher in HINDCAST ( versus
Sv), but its proportion of the total outflow is smaller (
versus
). The AW outflow increases by
in the 2000s in both experiments to reach an average transport of about
Sv (CLIMATIC) and
Sv (HINDCAST). This is comparable to measurements from Curry et al. (Citation2014) over the 2002–2010 period; they evaluated the AW mean outflow at
Sv (all future measurements reported from this paper will be for the mean over the same time period). Davis Strait outflow variability is more closely related to the AW variability in HINDCAST (correlation coefficient of about 0.70 versus 0.65).
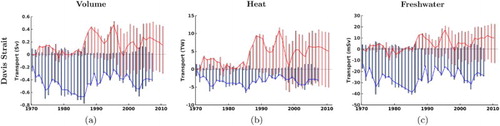
Fig. 4 Arctic Water volume (left column), heat (middle column), and freshwater (right column) transport for Davis Strait (a), (b), and (c), Lancaster Sound (d), (e), and (f), Nares Strait (g), (h), and (i), and Jones Sound (j), (k), and (l). The bars represent the inflow (positive) or outflow (negative) component of the transport only. The thick coloured lines correspond to the net transport. The HINDCAST simulation is shown in blue, and CLIMATIC is shown in red.
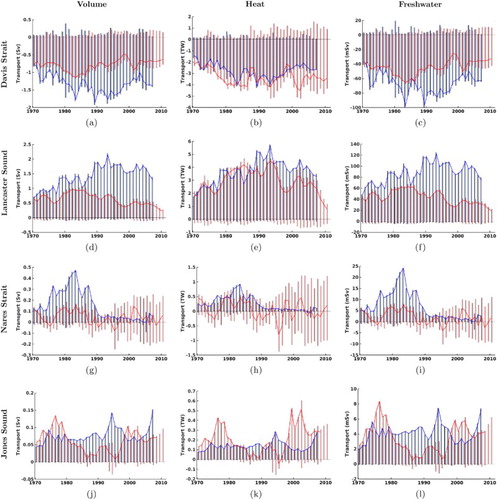
The correlation coefficient between the total AW transport and the heat and freshwater transport are high in both experiments (heat: > 0.70, freshwater: ) (b and c). The AW is only a marginal source of heat through Davis Strait in both experiments (
). CLIMATIC AW carries approximately
more heat than HINDCAST. This conveys a similar amount of heat, given the lower volume transport, implying that AW is warmer in this experiment.
In both experiments AW is the main source of freshwater outflow. Despite the lower transport in CLIMATIC, its importance in the freshwater outflow is higher ( versus
of the total freshwater exported at Davis Strait). The corresponding outflow is higher in HINDCAST (
versus
mSv). This compares well with the approximately
mSv average between 2002 and 2010 noted by Curry et al. (Citation2014).
In the north, Lancaster Sound is the main source of AW with a higher inflow in HINDCAST ( versus
Sv) (d). The AW represents more than
of the total transport through the strait in both experiments. The AW variability is the main source of the total volume variability at Lancaster Sound, especially in HINDCAST (correlation coefficient of about 0.81 versus 0.93).
In CLIMATIC, after 1985 the correlation coefficient between AW inflow at Lancaster Sound and AW outflow at Davis Strait decreases by 0.20, showing that these straits start to be less important. The AW inflow across Nares Strait and Jones Sound is higher in HINDCAST ( versus
Sv and
versus
Sv, respectively) ( and ). At Jones Sound, the AW represents the same amount of the inflow but is relatively more important in CLIMATIC (0.70 versus 0.24; j). This is the main source of variability in the total transport in CLIMATIC only (correlation coefficient between AW and the net inflow is 0.85 versus 0.67).
The heat transport through northern passages carried by AW is higher in the HINDCAST simulation because of the higher transport (Lancaster Sound: versus
TW, Nares Strait:
versus
TW, Jones Sound:
versus
TW; , , and , respectively). The net inflow, however, is small in both simulations. At Lancaster Sound, AW is warmer in CLIMATIC and carries about
of the total heat in both experiments. This could be the reason for the higher heat in the outflow at Davis Strait in this experiment.
The main source of AW freshwater is Lancaster Sound with higher transport overall in the HINDCAST simulation because of the higher volume transport ( versus
mSv; f). Nares Strait and Jones Sound transport about the same amount of freshwater (
versus
mSv and
versus
mSv, respectively; and ). At Nares Strait, the AW proportion is higher in CLIMATIC but is not the main inflow water mass (
versus
), and its variability has only a moderate impact on the total transport, particularly in HINDCAST (correlation coefficient of about 0.27 versus 0.62)
We note at Nares Strait, in the CLIMATIC simulation, an increase in the interannual variability in the volume inflow and outflow after 1995. This variability does not significantly affect the freshwater net transport (correlation coefficient: 0.99); however, there is a decrease in the correlation coefficient between the volume and heat transport (0.87). It indicates a warming of AW after 1995 in this experiment.
This is also observed in the same experiment at Jones Sound where two periods of important inflow appear in 1975–1976 and 1999–2002. The second spike brings about more heat into Baffin Bay than the first one, despite a smaller volume transport (
)
b West Greenland Irminger and Shelf Waters
At Davis Strait, the mean WGIW inflow over the time period is larger in the HINDCAST simulation ( versus
Sv; a). This explains
and
of the total inflow. The outflow is also much higher in HINDCAST (
versus
Sv) for
and
of the total outflow. The higher outflow in HINDCAST leads to negative net transport of WGIW through Davis Strait (i.e., net export) with a total mean net transport over the time period of about
Sv.
Fig. 5 West Greenland Irminger Water volume (left), heat (middle), and freshwater (right) transport for Davis Strait. The bars indicate the inflow (positive) and outflow (negative) component of the transport only. The thick coloured lines correspond to the net transport. The HINDCAST simulation is shown in blue, and CLIMATIC is shown in red.
The temporal evolution of the WGIW transport does not show any significant variation in the HINDCAST simulation, while in CLIMATIC the reduction of the northward component after 1975 leads to a reduction of about in the net transport, reaching an average of
Sv between 2004 and 2010. This compares with previous measurements of the WGIW inflow of between
and
Sv (Curry et al., Citation2014); no outflow of WGIW at Davis Strait was found by the authors.
In the CLIMATIC simulation, the higher WGIW inflow around 1975 is also associated with a pulse of WGSW inflow of about Sv. After 1985 this water mass becomes more important in this experiment with a much higher inflow of about
Sv, representing
of the total inflow. This is not balanced by any outflow before 1995 when the changing outflow leads to a reduction in the net transport of
. This evolution is not present in HINDCAST, in which the WGSW inflow is very small (
of the total inflow). The outflow is, however, more important (
versus
) leading to an export of WGSW. This is comparable to previous measurement by Curry et al. (Citation2014) who evaluated the WGSW inflow to be about
Sv. They did not observe WGSW outflow at Davis Strait.
In both experiments, these two water masses carried more than of the total heat inflow through Davis Strait ( and ). In the HINDCAST simulation, almost all the heat is carried by the WGIW alone whereas in CLIMATIC this amount is shared (WGIW:
, WGSW:
). The net transport of heat is higher in CLIMATIC (
versus
TW).
Fig. 6 West Greenland Shelf Water volume (left), heat (middle), and freshwater (right) transport for Davis Strait. The bars indicate the inflow (positive) or outflow (negative) component of the transport only. The thick coloured lines correspond to the net transport. The HINDCAST simulation is shown in blue, and CLIMATIC is shown in red.
The evolution of the total heat flux in the HINDCAST simulation can be explained by the evolution of the WGIW, with a correlation coefficient between the total heat transport and the WGIW transport of about 0.98. In CLIMATIC, the total evolution is shared with the WGIW and WGSW (correlation coefficients of about 0.78 and 0.50, respectively).
At Davis Strait, the WGIW and WGSW inflows are sources of freshwater ( and ). The proportion of freshwater carried by these water masses is higher in CLIMATIC than in HINDCAST (WGIW: 30% versus 15%; WGSW: 39% versus 32%). The greater outflow of WGIW and WGSW in HINDCAST leads, however, to a net export of freshwater in this simulation. This export is also present in CLIMATIC but only after 1998, showing that the outflow is fresher than the inflow.
The mean net freshwater transport during the entire time series for both water masses is higher in the HINDCAST simulation ( versus
mSv and
versus
). This is comparable to previous measurements of about
to
mSv for the WGIW transport and
mSv for the WGSW (Curry et al., Citation2014).
In the north, both WGIW and WGSW transports across our boundaries are almost negligible and not seen every year. However, we note, a similar evolution of the northward and southward transports in HINDCAST that suggests that the WGIW is recirculating through the boundary: everything that comes from the east side of the cross-section crosses to the west side of the section in the same year (not shown). We note a particularly strong inflow pulse of WGIW between 1989 and 1991 of about Sv (
TW and
mSv).
c Transitional water
The inflow of TrW at Davis Strait is higher in the CLIMATIC simulation but still small ( versus
Sv; a). The TrW outflow is also higher in CLIMATIC (
versus
of the total outflow). The net outflow averaged over the entire time period is higher in CLIMATIC (
versus
Sv). This is comparable to previous measurements of about
Sv (Curry et al., Citation2014).
Fig. 7 Transitional Water volume (left column), heat (middle column), and freshwater (right column) transport for Davis Strait (a), (b), and (c), Lancaster Sound (d), (e), and (f), Nares Strait (g), (h), and (i), and Jones Sound (j), (k), and (l). The bars indicate the inflow (positive) or outflow (negative) component of the transport only. The thick coloured lines correspond to the net transport. The HINDCAST simulation is shown in blue, and CLIMATIC is shown in red.
In the HINDCAST simulation, the outflow increases slowly by over the entire time period; CLIMATIC presents a clear decrease in the transport resulting from a lower outflow between 1975 and 1980 (drop of
) and after 1990 (drop of
).
The transport of heat and freshwater at Davis Strait is strongly related to the volume transport in both experiments with a correlation coefficient greater than 0.90 ( and ). The heat outflow is higher in CLIMATIC ( versus
TW). However, the freshwater outflow is similar in both experiments (
versus
mSv), despite the higher outflow in CLIMATIC. This indicates that the TrW outflow in CLIMATIC is warmer and fresher than in HINDCAST. This is comparable to a measurement of TrW freshwater outflow of about
mSv by Curry et al. (Citation2014).
At the northern passages, TrW inflow is only significant in the HINDCAST simulation in which it comes from Lancaster Sound and Nares Strait (0.5 and Sv, respectively). The inflow from Jones Sound is smaller (
Sv). Only Nares Strait inflow is significant in CLIMATIC with an inflow of about
. The net inflow from Lancaster Sound and Jones Sound is close to zero; the transport across Lancaster Sound is mainly recirculation around the section (not shown).
The correlation coefficient between the heat and freshwater inflow is higher than 0.95 in both experiments, which gives negligible TrW heat and freshwater inflow, consistent with the low volume inflow. The TrW heat inflow is greater in the HINDCAST simulation at each strait (Lancaster Sound: versus
TW; Nares Strait:
versus
TW; Jones Sound:
versus
TW) as well as the freshwater transport (Lancaster Sound:
versus
mSv, Nares Strait:
versus
mSv, Jones Sound:
versus
mSv).
5 Evolution of the water masses in Baffin Bay
The evolution of the volume of each water mass shows no major changes in time in the HINDCAST simulation (a), which is not the case in CLIMATIC (d). The only observable change in HINDCAST concerns the AW which increases in importance between 1970 and 1981 then slowly decreases. The TrW is the dominant water mass (), followed by the AW (
), and the WGIW (
). The WGSW is almost absent in Baffin Bay (<1%).
Fig. 8 Volume (left panels), heat (middle panels), and freshwater (right panels) storage for each water mass in Baffin Bay. The top row is for the HINDCAST simulation and the bottom row is for CLIMATIC. Transitional Water is shown in purple, West Greenland Shelf Water in green, West Greenland Irminger Water in red, and Arctic Water in blue.
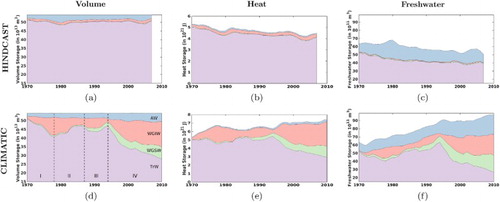
Sharing the same initial conditions, CLIMATIC starts with similar proportions as HINDCAST. However, during the run the TrW loses its dominance in the total volume to reach only of the total. For later analysis we define 1970–1978 as Period I, 1979–1988 as Period II, 1989–1994 as Period III, and 1995–2010 as Period IV. In Period I, the importance of WGIW reaches
. Its importance decreases to
by 1988. In Period II the importance of WGSW starts to grow, reaching
in 1994. In Period III the increase in WGSW is associated with a decrease in WGIW, reaching a minimum of
in 1994, and an increase in the TrW. In Period IV, the importance of the WGIW grows to
, and the WGSW increases to
. The relative importance of AW remains almost steady during the first decade. It starts to increase after 1994 to reach a maximum of
in 2008.
Three possibilities could explain the evolution of each individual water mass: a larger input of heat or freshwater at the surface, an imbalance in the transport going through Baffin Bay, or internal changes inside the domain. The increase in the AW proportion in Baffin Bay in the HINDCAST simulation around 1980 and 2005 can be explained by the increase in the AW inflow not immediately balanced by an increase in the outflow, leading to greater importance of AW. Meanwhile, in CLIMATIC, the slow increase in AW with time is related to the transformation being more important in this experiment. The AW is located at the surface and is thus more easily affected by runoff. The greater spreading of the runoff in this simulation and the enhanced runoff in summer when Baffin Bay is mostly ice free leads to easier freshening of the water column (b). Consequently, more AW is generated from saltier water during the journey through Baffin Bay because of interaction with the other water mass. We note that in our simulation we do not consider the temperature of the runoff. Thus, the enhanced runoff can only lead to the creation of fresher water masses.
The evolution of the other water masses in the CLIMATIC simulation can be explained by a combination of transport imbalance and internal changes, depending on the time period. During Period I the large WGIW inflow from the WGC replaces the TrW in Baffin Bay (see Supplementary Material 1). During Period II the WGIW is trapped in the northern trough and canyons of Baffin Bay and then mixes with the underlying TrW, leading to the formation of more TrW. During Period III, the WGSW inflow increases from the WGC, replacing the WGIW. After 1996, the WGIW curves to the inside of the gyre at Davis Strait and gets trapped. The WGIW builds up inside the gyre during Period IV, mixing with the TrW and leading to the formation of more WGIW. The WGSW pathway follows a different route. It stays on the shelves and circulates around Baffin Bay. It avoids central Baffin Bay, preventing this water mass from being trapped by the gyre. This prevents any significant mixing between the WGSW and the other water masses in the interior, which leads to no noticeable change in the proportion of WGSW in Baffin Bay.
Under the influence of the WGSW and WGIW the TrW becomes warmer and fresher due to the increase in the surface exchange, which enhances mixing between the three water masses. We note in the CLIMATIC simulation a transformation of about of the AW to the WGSW in central Baffin Bay during the summer due to air–sea interactions (i.e., surface heating). The cooling in winter reverses the process (see Supplementary Material 1). The process is also present over the east Baffin Island Current with a smaller magnitude (about
). None of the interactions discussed previously are present in HINDCAST; thus, the water mass proportions do not evolve beyond that due to the transport imbalance, which is less than
.
a Heat storage evolution
In the HINDCAST simulation the heat available in Baffin Bay decreases by during the time period (b). The decrease is steady at
per decade (
ZJ =
J), with the exception of the periods when the importance of TrW decreases, leading to a rapid reduction in the total heat in Baffin Bay. The heat contained by the other water masses does not change significantly.
In the CLIMATIC simulation, the heat inside Baffin Bay increases by . The heat evolution is closely related to the evolution of the individual water mass (correlation coefficient between the heat and volume content evolution > 0.97 for every water mass). From 1970 to 1978 the heat increases by
. From 1978 to 1995, after a decrease of about
, the heat content stays relatively stable. From 1995 to 1998 the heat increases abruptly by
. After 1998 the heat increases only slowly until the end of the simulation.
The change in Period I is driven by the increase in the heat contained in the WGIW, which is directly related to the higher proportion of this water mass in Baffin Bay (i.e., related to the WGIW inflow). During Periods II and III, the importance of WGIW decreases in favour of cooler TrW (i.e., the WGIW inflow is replaced by the cooler TrW inflow). The 1995 heat increase is also related to an increase in the WGIW importance in Baffin Bay, but it is also associated with an increase in the WGSW importance during this period.
We also note a steady increase of in the heat contained by the AW despite the low increase in this water mass volume ( and ). This indicates warming of this water mass with time. This evolution is only present in the AW. The WGIW heat and WGSW heat have large interannual variability but no clear long-term trend. However, we note an increase in the WGIW heat beginning between 1992 and 1995 (
related to the warmer WGIW inflow at Davis Strait. The TrW heat content stays relatively constant with a small increase between 1970 and 1975 (
) and a slow decrease after 1995 (
).
b Freshwater storage evolution
In the HINDCAST simulation, the freshwater decreases by during the period of the experiment (c). The decrease is the same for all water masses; thus, is more likely due to a model drift that increases the salinity with time. This decrease is not related to the evolution of the water masses.
In the CLIMATIC simulation, the freshwater content increases by from 1970 to 2010 (f). This freshening is almost constant with time and closely related to the evolution of the volume of each water mass (
). From 1970 to 1995 the AW, WGIW and, after 1978, the TrW freshwater content increases by (
,
, and
, respectively). We note that the WGSW freshwater content starts to grow after 1985 (
). Finally, after 1995 the total freshwater increases more slowly.
This evolution is mainly due to the augmentation of the proportion of the high freshwater content water masses but also to a freshening in Baffin Bay (d and f). The WGIW water mass freshens the most (). The TrW freshwater content per cubic metre does not change significantly. The WGSW experiences a significant has an important drop in its freshwater content per cubic metre between 1984 and 1987 (
), related to an increase in its salinity, but otherwise stays relatively constant with time. The AW actually slowly loses freshwater between 1970 and 2000 (
) before increasing again to its initial state.
6 Twenty-first century transport
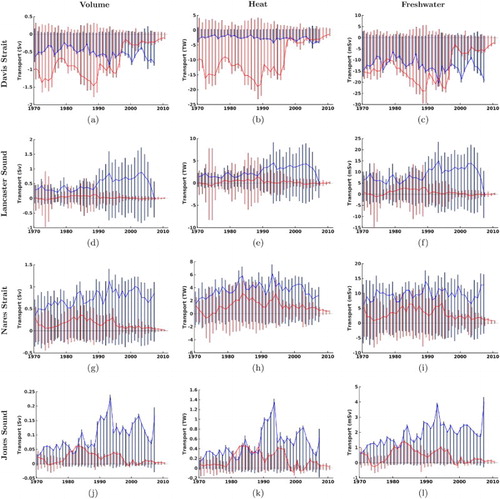
a Volume
The volume transport at Davis Strait stays relatively constant until 2020. The decrease from Sv (i.e., southward flow) to almost zero by 2040 (a). This decrease is the result of the outflow decreasing by
because of the decrease in the AW outflow by
between 2010 and 2050 (correlation coefficient of about
between net volume transport and AW outflow decrease). The proportion of AW does not significantly change after this decrease (
of the total outflow; a). The WGIW decreases (
; a), while the WGSW increases (
; a). The TrW outflow becomes marginal (
; a).
Fig. 9 Total volume (left column), heat (middle column), and freshwater (right column) transport for Davis Strait (a), (b), and (c), Lancaster Sound (d), (e), and (f), Jones Sound (g), (h), and (i), and Nares Strait (j), (k), and (l) for FUTURE. The bars indicate the inflow (positive) and outflow (negative) component only. The thick lines correspond to the net transport.
Fig. 10 Arctic Water volume (left column), heat (middle column), and freshwater (right column) transport for Davis Strait (a), (b), and (c), Lancaster Sound (d), (e), and (f), Jones Sound (g), (h), and (i) and Nares Strait (j), (k), and (l) for FUTURE. The bars indicate the inflow (positive) and outflow (negative) component only. The thick lines correspond to the net transport.
Fig. 11 West Greenland Irminger Water volume (left), heat (middle), and freshwater (right) transports for Davis Strait for FUTURE. The bars indicate the inflow (positive) and outflow (negative) component only. The thick lines correspond to the net transport.
Fig. 12 West Greenland Shelf Water volume (left), heat (middle), and (right) freshwater transports for Davis Strait for FUTURE. The bars indicate the inflow (positive) and outflows (negative) components only. The thick lines correspond to the net transport.
Fig. 13 Transitional Water volume (left), heat (middle), and freshwater (right) transports for Davis Strait for FUTURE. The bars indicate the inflow (positive) and outflow (negative) components only. The thick lines correspond to the net transport.
The total inflow stays relatively constant over the entire time period. The relative proportion of each water mass stays constant over the twenty-first century with the WGIW becoming more important than WGSW (), followed by the WGIW (
), the AW (
), and the TrW (2%).
After 2060, both the inflow and outflow variability increases without any noticeable effect on the net transport. This higher variability is due to the AW and WGSW variability across the strait during the same period ( and
).
After 2040, the net transport is Sv. We note that the TrW net transport becomes close to zero after 2040.
The net transport decreases at each of the northern passages until 2040, when high interannual variability obscures any clear trend (, , and ). The decrease is explained by a decrease in the inflow component of the transport at Lancaster Sound () and Jones Sound (
). At Nares Strait, no clear trend is seen over this period. The decrease in the inflow is led by a decrease in the AW (
for each passage). No other water mass seems to be significantly involved in the inflow decrease (
for each water mass and passage).
At Lancaster Sound, the transport reaches Sv affter 2040, with the transport at Nares Strait and Jones Sound being
Sv. This decrease does not significantly affect the relative importance of the transport in each passage, decreasing only the importance of Jones Sound (from
to
) in favour of Nares Strait (from
to
).
We observe a negative net transport (i.e., outflow) through all the passages in the 2045–2065 period and, for Lancaster Sound and Nares Strait only, around 2070 and 2090. These outflows are associated with higher inflow from Davis Strait. The net transport at the northern passages is highly correlated with Davis Strait transport ( for each strait).
The relative importance of each water mass crossing the northern passages does not significantly change during the twenty-first century with more than of the transport being composed of AW.
b Heat
The heat transport at Davis Strait does not decrease significantly between 2010 and 2040 (b), showing that the WGC inflow is not affected by the reduction in the outflow. The interannual variability is correlated at 0.75 with the volume transport. The average transport of heat over this time period is TW. The interannual variability is more pronounced after 2060 as is the volume transport.
The WGSW has a greater importance in the heat inflow at Davis Strait, carrying about the same amount of heat as the WGIW ( and
) ( and ). The interannual variability in the heat transport is mainly led by the WGSW (correlation coefficient of about 0.85). The WGIW has lower importance in the heat transport variability (correlation coefficient of about 0.40).
At the northern passages, the heat transport is strongly related to the volume transport ( for each passage) (, , and ). Consequently, low volume transport leads to a small amount of heat transport (mean over the period for Lancaster Sound is
TW, for Nares Strait
TW, and for Jones Sound
TW). We note that heat is also exported when the net volume transport is negative.
At Lancaster and Jones Sounds, the AW inflow between 2010 and 2040 decreases by (correlation coefficient between the volume and heat transport
for both passages) ( and ). At Nares Strait, the main source of heat transport variability is the WGIW (correlation coefficient of about 0.97), followed by the AW (correlation coefficient of about 0.86) (not shown).
After 2040, the importance of AW to the heat transport at the northern passages decreases significantly with only of the heat carried at Lancaster Sound,
at Nares Strait, and
at Jones Sound. At Lancaster Sound, the main source of heat becomes the WGIW (
, WGSW is
). At Nares Strait the WGSW is more important (
, WGIW is
). At Jones Sound, both WGIW and WGSW share about the same importance (
and
, respectively).
c Freshwater
At Davis Strait, the freshwater transport is correlated at 0.99 with the volume transport. Consequently, after 2040 the WGC carries more freshwater into Baffin Bay than the Arctic outflow removes (c).
The AW proportion of the Davis Strait outflow decreases from to
between 2010 and 2040 and after 2040 the net export is
mSv (c). The WGSW increases from
to
(c). This is associated with an increase in WGSW freshwater inflow (
) between 2010 and 2040 because of the higher volume inflow of this water mass (correlation coefficient between WGSW volume and freshwater transport is 0.96). The net WGIW freshwater transport at Davis Strait is close to zero, the inflow and outflow being of the same order of magnitude (net transport:
mSv) (c). We note that the TrW volume transport is not large enough to have any effect on the freshwater transport (c).
At the northern passages, between 2010 and 2040, the average freshwater transport decreases for each passage by the same proportion as the volume transport (correlation coefficient between the volume and freshwater transport for each passage). The dynamics of the freshwater transport into Baffin Bay are modified, with an export of freshwater toward the CAA at Lancaster Sound (average transport between 2040 and 2099 is
mSv). At Nares Strait, the transport can be in either direction, depending on the year. High interannual variability hides any clear trend (average:
mSv). Jones Sound remains, on average, a source of freshwater to Baffin Bay (with an average of
mSv). More than
of this freshwater is carried by the AW (f, the other water masses are not shown).
d Future evolution of the water masses in Baffin Bay
The relative importance of the TrW to the total volume steadily decreases over the twenty-first century () replaced by the WGIW (
) and the WGSW (
) (a) because of the build-up in these two water masses inside the gyre and in its periphery (Supplementary Material 1). The amount of AW stays constant with little interannual variability. In 2040, the TrW represents
of the total water in Baffin Bay, followed by the WGIW (
), the WGSW (
), and the AW (
). By 2099, the proportion is TrW (
), WGIW (
), WGSW (
), and AW (
).
Fig. 14 (a) Volume, (b) heat, and (c) freshwater storage for each water mass in Baffin Bay for FUTURE. Transitional Water is shown in purple, West Greenland Shelf Water in green, West Greenland Irminger Water in red, Arctic Water in blue.
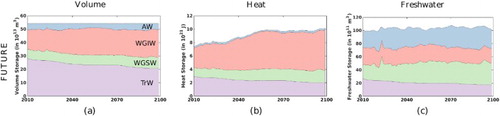
During the twenty-first century, the heat content available in Baffin Bay increases by (b). This increase occurs mainly between 2040 and 2060 (
). This increase is partially the result of a higher proportion of the WGIW in Baffin Bay but is also due to a significant warming of the warmer mass itself (
for the amount of heat contained by the same volume of WGIW between 2010 and 2099). The decrease in the TrW heat is related to the decrease in its importance, while the WGSW and the AW heat content do not change significantly.
The evolution of the water masses can be explained by a warming of Baffin Bay that transforms some of the TrW into the warmer WGIW and WGSW. This transformation is driven by the input of additional heat into Baffin Bay. The total freshwater content does not change significantly during the twenty-first century (c).
7 Discussion
The differences between our two experiments come from the atmospheric forcing and the seasonality and total amount of runoff, especially from Greenland. The corresponding additional freshwater that remains in the upper layer of the ocean increases the buoyancy of the top surface layer, increasing the stratification. It also increases the sea surface height due to steric effects. The global evolution of the steric height (SH) over the entire bay, for the period between 1970 and 2010 is a net increase ( cm,
) in CLIMATIC (a).
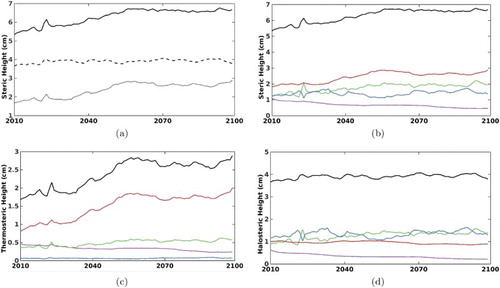
Fig. 15 (a) Evolution of steric height in Baffin Bay. The thick line indicates the total steric height; the dashed line indicates the halosteric component only, and the dotted line indicates the thermosteric component only. Evolution of the total steric height separated by water masses for (b) the total steric height, (c) the thermosteric component only, and (d) the halosteric component only. Transitional Water is shown in purple, West Greenland Shelf Water in green, West Greenland Irminger Water in red, and Arctic Water in blue.
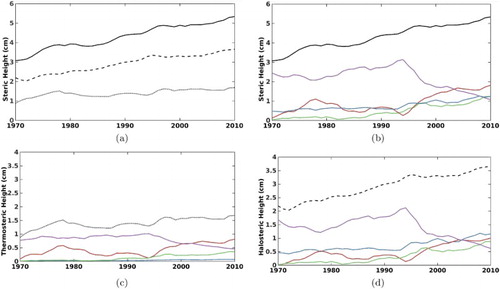
The additional freshwater is not the only cause of the change in the SH. The total increase can be separated into the contribution from the freshwater component only (SHs) and heat component only (SHt). A larger contribution to the total SH in Baffin Bay is made by SHs than the SHt. Between 1970 and 2010, the absolute increase in SHs is larger than the increase in SHt ( cm,
versus
cm,
); however, both have the same relative importance in the total SH evolution (correlation between SH and SHs is 0.80 and between SH and SHt is 0.78). We note the larger relative increase in SHt.
At the beginning of the experiment, SH is higher in the interior of Baffin Bay and along the Baffin Island Current (a) because of the accumulation of warm TrW over the top 1000 m in the centre of Baffin Bay that increases SHt (b). The high proportion of fresh AW in western Baffin Bay increases SHs (c). In the eastern part of Baffin Bay, SHt increases over the shelf break and inside the troughs on the continental shelf. This is a consequence of the presence of incoming WGIW from Davis Strait (Supplementary Material 1).
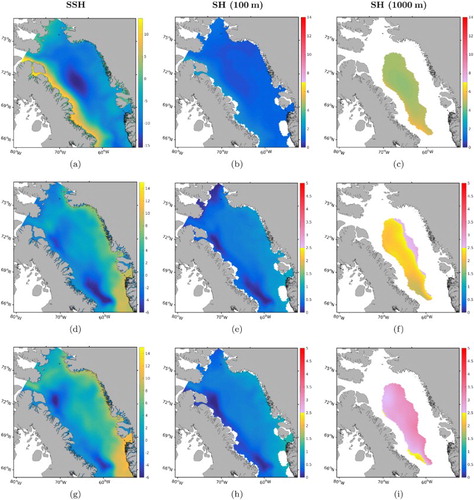
Fig. 16 Annual averaged total steric height (left column), thermosteric component only (middle column), and halosteric component only (right column) in Baffin Bay for 1970 (first row) and the difference between 1970 and 1995 (second row), and between 1970 and 2007 (third row). The colour bar is in centimetres.
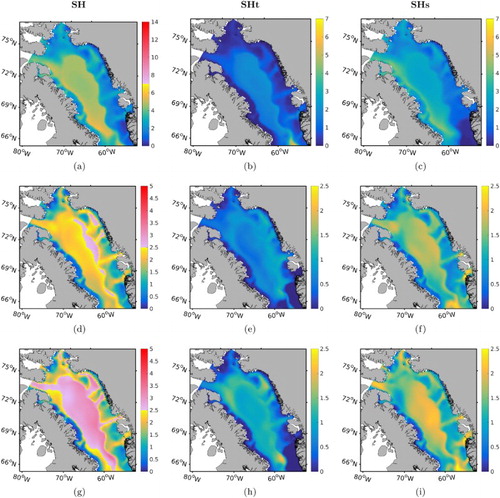
We acknowledge that the SH in 1970 does not appear to be consistent with the SSH leading to a cyclonic circulation ( and ). This occurs because of a topography effect in the SH (i.e., deeper regions will contain more water and thus more heat and freshwater). The integration over the deeper part of Baffin Bay is necessary to capture the evolution of the intermediate water masses (i.e., WGIW, WGSW, and TrW). With a shallow integration depth (e.g., 100 m) we miss most of the change in SH over the twentieth century (, , and ) and over the twenty-first century (not shown). Removing the region shallower than the reference from our calculation misses the interesting features that occur over the shelf and especially in the troughs (e.g., with an integration depth of about 1000 m; , , and ).
Fig. 17 Annual averaged total sea surface height (left column), total steric height over the first 100 m only (middle column), and steric height over the first 1000 m only (right column) in Baffin Bay for 1970 (first row) and the difference between 1970 and 1995 (second row), and between 1970 and 2007 (third row). The colour bar is in centimetres.
By 1995, the central region of Baffin Bay has been lifted significantly, particularly along the WGC and in the troughs that are draining various Greenland tidewater glaciers (up to cm in the WGC) (d). This lifting is a result of WGIW inflow that increases the SHt (e) along the WGC pathway and the increase in freshwater from the Greenland runoff that accumulates in the troughs, the WGC, and inside the gyre (f). This additional freshwater is contained inside all the water masses ( and ) that are freshened in eastern Baffin Bay in response to the larger runoff from Greenland.
The SH increase between 1995 and 2007 is less pronounced, with an augmentation smaller than cm, on average, over central Baffin Bay (g). The main increase is due to the heat from the WGIW. The WGC transports the WGIW to the northern part of Baffin Bay. When the current curves to the west, the WGIW is caught in the Baffin Bay gyre and accumulates inside it, progressively filling the interior of the gyre (Supplementary Material 1).
Because of its location over the continental shelf, the WGSW is not trapped by the gyre. Instead it continues its path toward the western part of Baffin Bay and follows the Baffin Island Current (Supplementary Material 1). As a consequence, it takes the place of the cold AW and thus increases the heat available in northern Baffin Bay and inside the Baffin Island Current, increasing the SHt (h).
We note that the WGSW inflow at Davis Strait in the early 2000s is not larger than the WGIW inflow, as observed by Curry et al. (Citation2014). It might arise from a mismatch between the WGIW and the WGSW: the WGIW observed by Curry et al. (Citation2014) is simulated as WGSW in our experiment. The runoff inputs occur over a large region away from the Greenland coastline in CLIMATIC (c). Consequently, the WGC freshens over a larger area, including the region close to the shelf break, where the WGIW is located. This could lead to the formation of the fresher WGSW where WGIW should be present.
The freshening of the WGC and Baffin Island Current plays an important role in the increase in the overall SH, increasing SHs (i). This evolution is due to the increased freshwater contained by most of the water masses (d). Between 1970 and 1995 the WGIW mean salinity decreases by , the WGSW by
, and the TrW by
. The AW mean salinity does not change significantly, with the increase in freshwater from this water mass thus related to its larger proportion in Baffin Bay. Between 1995 and 2007 no significant change in the salinity of AW can be seen. Overall, the mean salinity of Baffin Bay drops by
from 1970 to 2007 (
per decade), which is a larger freshening than the
per decade observed by Zweng and Münchow (Citation2006).
The modification of the baroclinic gradient resulting from runoff from Greenland is not present in HINDCAST. The freshening of the Baffin Island Current and the strengthening of the WGC is consistent with the results of Castro de la Guardia et al. (Citation2015). The modification of the SH gradient also leads to a greater spreading of the WGIW and WGSW in Baffin Bay. This increases the contact surfaces between the WGIW, the WGSW, and the underlying water mass (i.e., TrW). Between 1970 and 1995, the resulting enhanced mixing increases the mean temperature of the AW by °C, the WGIW by
°C, the WGSW by
°C, and the TrW by
°C. Between 1995 and 2007 the increase flattens and only the WGIW and WGSW show a significant change in temperature with a decrease of
°C and
°C, respectively.
Overall, Baffin Bay mean temperature increases in CLIMATIC by °C between 1970 and 2007, with an increase between 1970 and 1995 (
°C) and a decrease between 1995 and 2007 (
°C). The temperature change is slightly larger than observed from 1916 to 2003 by Zweng and Münchow (Citation2006), and they did not observe any warming after 1995.
The increase in SHt from the mid-1990s onward is related to the increase in heat contained inside the WGIW. The increase is due to a higher proportion of this water mass instead of a higher mean temperature (, , and ). The increase is consistent with previous studies (Andresen et al., Citation2011; Curry et al., Citation2014; Holland, Thomas, et al., Citation2008; Myers & Ribergaard, Citation2013). This increase is associated with a pulse of WGIW inflow and also of the WGSW inflow (d and Supplementary Material 1). We note that the two pulses start in the same year (1992, two years earlier than observations), with the WGIW pulse continuing for two further years (until 1997).
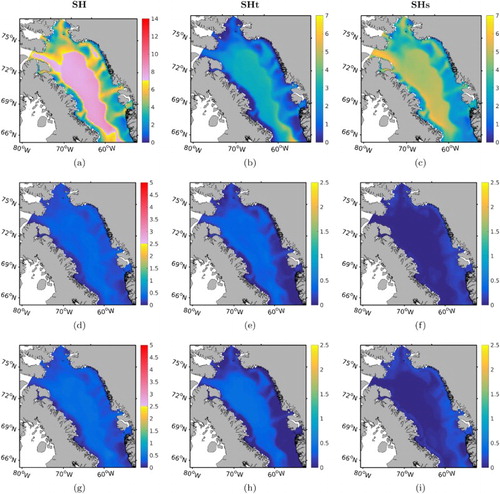
Fig. 18 Annual averaged total steric height (left column), thermosteric component only (middle column), and halosteric component only (right column) in Baffin Bay for 2010 (first row), and the difference between 2010 and 2050 (second row), and between 2010 and 2099 (third row). The colour bar is in centimetres.
In eastern Baffin Bay, the heat increase over the continental shelf and close to the west coast of Greenland is consistent with the enhanced melt of the tidewater glaciers along the west coast of Greenland from the 1990s onwards, as has been discussed previously (Andresen et al., Citation2011; Holland, Thomas, et al., Citation2008; Zweng & Münchow, Citation2006).
In the North Water Polynya (i.e., near Lancaster Sound, Jones Sound, Smith Sound, and east to Devon Island) the SHt between 1995 and 2007 (b and h) associated with a higher proportion of the warm WGIW and WGSW at this location (Supplementary Material 1) might help to explain the reduced ice thickness over the polynya. It could also explain the increase in size and number of completely open water regions inside the polynya, which leads to an overall increase in polynya size. This could have a significant effect on local species (e.g., narwhals, white whales, and more generally sea birds; Stirling (Citation1980)). The detailed impact of oceanic dynamic changes on biology is, however, out of the scope of this paper.
The evolution of the transport at the boundaries of Baffin Bay is consistent with the evolution of the SH. The baroclinic gradient between the CAA and northern Baffin Bay is modified by the flows of WGIW and WGSW that increase the SHt, as well as the increase in freshwater and its effect on SHs. Between 1976 and 1985, the freshening of the Baffin Island Current increases the SHs and consequently increases outflow through Davis Strait (c, f, and Supplementary Material 2). In the north, the western part of Lancaster Sound becomes fresher, increasing the SHs and thus the baroclinic gradient, leading to a higher inflow. A similar freshening occurs in Smith Sound that explains the higher volume transport through Nares Strait. We note that Jones Sound transport is not significantly affected by the SH changes in Baffin Bay.
After 1985, a shift in the baroclinic balance in Baffin Bay occurs, when eastern Baffin Bay SH becomes higher than in western Baffin Bay (i and Supplementary Material 2). In consequence, the gyre strength is reduced and the transport of water through Baffin Bay decreases. The inflow from the northern boundary decreases accordingly, as well as the outflow at Davis Strait. Overall, the lift in Baffin Bay reduces the baroclinic gradient between the CAA and the North Atlantic, thus reducing the overall transport to the North Atlantic (Hu & Myers, Citation2014; Steele & Ermold, Citation2007).
We note that the features shown in the evolution of SH (e.g., lifting of eastern and central Baffin Bay and lifting in the eastern troughs) are also present in the evolution of SSH (, , and ) and shallow integration SH evolution (, , and ).
a Future evolution of Baffin Bay
In the FUTURE simulation, the mean SHs in Baffin Bay increases from cm to
cm (
) between 2010 and 2023 (a). After that, there is no clear trend (mean SHs:
cm). The SHt increases significantly between 2010 and 2055 (from
cm to
cm;
) and stabilizes thereafter (mean between 2055 and 2099:
cm). As a result, total SH increases between 2010 and 2055 (from
to
cm;
) and stabilizes thereafter.
Fig. 19 (a) Evolution of steric height in Baffin Bay. The thick line indicates the total steric height; the dashed line indicates the halosteric component only; and the dotted line indicates the thermosteric component only. Evolution of the total steric height separated by water masses for (b) the total steric height, (c) the thermosteric component only, and (d) the halosteric component only. Transitional Water is shown in purple, West Greenland Shelf Water in green, West Greenland Irminger Water in red, and Arctic Water in blue.
The spatial distribution of the SH shows that the interior of Baffin Bay will be the region that undergoes the larger SH increase (). This evolution occurs mainly during the first half of the twenty-first century, with a significant warming (1.00°°C, on average, for the entire bay) due to the accumulation of WGIW inside the gyre and in the troughs, increasing SHt (, and ). In the second half of the twenty-first century, the mean temperature of Baffin Bay decreases (0.33°
°C). Overall, from 2010 to 2099, the mean temperature of most of the water masses increases (average temperatures at the end of the twenty-first century are AW: −0.17°
°C, WGIW: 2.41° ± 0.20°C, and WGSW: −0.68°
°C). The only exception is TrW which has a decrease in its mean temperature (average temperature at the end of the twenty-first century is −0.36°
°C), showing a transfer of heat from deep Baffin Bay to shallower layers.
The mean salinity in Baffin Bay decreases slightly over the first part of the twenty-first century (), but there is no significant change over the second half of the century. Over the entire century the AW and the WGSW mean salinity decrease by
and
, respectively, while the WGIW and TrW mean salinity increase by
and
, respectively. The consequence for SHs is that it increases only over the shelf in the eastern part of Baffin Bay for this period, and most of the change happens during the first half of the century (, , and ).
Baffin Bay lifting is consistent with previous studies (Hu & Myers, Citation2014; Sou & Flato, Citation2009). The consequence of this lifting is a reduction in the overall transport due to the lower baroclinic gradient, as discussed for the past. However, the leading component of the SH change in the FUTURE simulation is SHt, not SHs. This can be explained by the changes in the circulation in Baffin Bay. The new baroclinic gradient inside Baffin Bay reduces AW inflow and thus the inflow of freshwater, while the WGC carries warmer water. Moreover, under the future projection experiment conditions, the sources of freshwater from runoff decrease because of the heavy melt that occurred during the half of the twenty-first century (e.g., the south of the CAA is eventually ice free during winter; Hu & Myers, Citation2014), reducing the ongoing sources of freshwater.
From a more general point of view, we can infer that the changes in the circulation in Baffin Bay and the resultant changes in the AW outflow are a consequence of the interplay of heat and freshwater. The increase in heat coming from the WGC in the early 1990s is associated with enhanced runoff from Greenland. The additional heat creates a positive feedback on the runoff, increasing the tidewater glacier melt. The additional freshwater increases the SH in the eastern part of Baffin Bay, leading to more mixing of the water masses, increasing the temperature, and decreasing the salinity of most of the water masses.
In the twentieth century, freshwater plays a greater role in changes in the dynamics of Baffin Bay, but the situation changes in the twenty-first century when the SH gradient in Baffin Bay inverts (i.e., the east is higher than the west) with the circulation leading to an accumulation of WGIW in Baffin Bay, significantly increasing the temperature of Baffin Bay due to mixing processes. After this point, the freshwater does not significantly change the total SH. However, the accumulation of heat due to higher temperatures continues the process of lifting in eastern and central Baffin Bay. The threshold point is reached in the 2050s. These results are consistent with the sensitivity experiments of Castro de la Guardia et al. (Citation2015).
8 Conclusions
The purpose of this paper is to evaluate the sensitivity of the throughflow into and out of Baffin Bay and the dynamic responses of Baffin Bay to Greenland runoff. We set up two numerical experiments for the past: HINDCAST and CLIMATIC with different runoffs. The CLIMATIC experiment was also extended into the twenty-first century (FUTURE). The CLIMATIC and FUTURE simulations have enhanced Greenland runoff from the 1990s and during the twenty-first century; the atmospheric forcing also differs. The HINDCAST and CLIMATIC simulations start from the same initial conditions after an 18-year normal-year forcing spin-up phase.
Over time, Baffin Bay becomes fresher and warmer in CLIMATIC, whereas in HINDCAST Baffin Bay becomes saltier and cooler. Consequently, due to SH, Baffin Bay lifts in CLIMATIC and lowers in HINDCAST. In both cases, the evolution of the SH is mainly controlled by the variation in SHs, which is associated with the evolution of the freshwater in Baffin Bay.
The lifting of Baffin Bay due to steric effects in the CLIMATIC simulation reduces the baroclinic gradient between the fresh and cold Arctic Ocean and the warm and salty North Atlantic, reducing the transport from the northern passages. This reduction leads to reduced transport of freshwater entering Baffin Bay. The modification of the baroclinic gradient in Baffin Bay also strengthens the WGC inflow. It brings more heat because of enhanced northward transport of warm WGIW and WGSW through Davis Strait. The second consequence is an increase in the surface of contact between the waters carried by the WGC and the underlying TrW, which increases mixing in Baffin Bay, and thus the transformation of one water mass to another. This behaviour is not present in HINDCAST in which the SH is mainly driven by the numerical salt drift common to many regional models. We thus suggest that the additional Greenland runoff explains the difference between the two experiments.
For the twenty-first century, the FUTURE simulation shows that the transport across Baffin Bay is reduced to a fraction of what it was during the twentieth century. This affects all water mass transport with the greatest effect being on the AW outflow. The flow of AW from the Arctic Ocean is reduced to a very small amount; AW is even exported back through the northern passages in some years. The freshwater storage in Baffin Bay stays relatively stable.
Despite this smaller inflow and outflow, the heat available in Baffin Bay increases as the result of an increase in the relative proportion of the WGIW, as well as a warming of this water mass. This warming is not associated with an increase in the transport of this water mass at the boundaries nor with surface heating and, thus, is probably controlled by internal processes that are warming Baffin Bay.
Most of the features seen in the CLIMATIC simulation have been observed previously. The warming of Baffin Bay is similar to observations by Zweng and Münchow (Citation2006). The increase in heat in Baffin Bay is also consistent with the increase in the temperature in Disko Bay found by Myers and Ribergaard (Citation2013), as well as the acceleration of the heat increase in Baffin Bay since 1997 because of an increase in the available heat in the WGIW.
The origin of these changes are consistent with the proposal of both Andresen et al. (Citation2011) and Holland, Jenkins, et al. (Citation2008): a change in the baroclinic gradient inside Baffin Bay triggered by freshwater inflow coming from enhanced runoff from Greenland enhances the WGC inflow.
However, we did not find a similar increase in the WGIW heat content. Instead, we found that the increase in heat in the WGC was associated with an increase in heat in the WGSW. This mismatch in the water masses might be a consequence of the increased runoff in Baffin Bay that freshens the WGC. It should also be noted that the runoff we input does not change the temperature of the grid cell where it is input, only the salinity.
We did not detect a strengthening of the southward export of AW, as found by Münchow et al. (Citation2015). However, we did detect a freshening of Baffin Bay due to the freshening of both the AW and the WGSW. The consecutive SH increases in Baffin Bay are consistent with those proposed by Antonov et al. (Citation2002) and Steele and Ermold (Citation2007).
Finally, further improvements in this experiment may need to be considered. The first would be the implementation of the temperature of the runoff water in order to determine whether it has an effect on the heat available in Baffin Bay. The second would be to obtain a more realistic freshwater discharge from Greenland. The effect of these changes on the freshwater supply in the Labrador Sea is beyond the scope of this paper.
Supplemental data
Supplemental data for this article can be accessed at https://doi.org/10.1080/07055900.2017.1333950
Acknowledgments
We are grateful to Westgrid and Compute Canada for computional resources. We thank C. Boening and A. Biastoch for providing us model output that was used for open boundary forcing. We also thank two anonymous reviewers for their useful comments and suggestions.
Disclosure statement
No potential conflict of interest was reported by the authors.
Additional information
Funding
References
- Aagaard, K., & Carmack, E. C. (1989). The role of sea ice and other fresh water in the Arctic circulation. Journal of Geophysical Research, 94(C10), 14485–14498. doi: 10.1029/JC094iC10p14485
- Aksenov, Y., Bacon, S., Coward, A. C., & Holliday, N. P. (2010). Polar outflow from the Arctic Ocean: A high resolution model study. Journal of Marine Systems, 83, 14–37. doi: 10.1016/j.jmarsys.2010.06.007
- Amante, C., & Eakins, B. (2009). ETOPO1 1 arc-minute global relief model: procedures, data sources and analysis. NOAA Technical Memorandum NESDIS NGDC-24.
- Andresen, C. S., Straneo, F., Ribergaard, M. H., Bjørk, A. A., Andersen, T. J., Kuijpers, A., … Ahlstrøm, A. P. (2011). Rapid response of Helheim Glacier in Greenland to climate variability over the past century. Nature Geoscience, 5(1), 37–41. doi: 10.1038/ngeo1349
- Antonov, J. I., Levitus, S., & Boyer, T. P. (2002). Steric sea level variations during 1957–1994: Importance of salinity. Journal of Geophysical Research: Oceans (1978–2012), 107(C12), SRF-14. doi: 10.1029/2001JC000964
- Barnier, B., Madec, G., Penduff, T., Molines, J.-M., Treguier, A.-M., Sommer, J. L., … Cuevas, B. D. (2006). Impact of partial steps and momentum advection schemes in a global ocean circulation model at eddy-permitting resolution. Ocean Dynamics, 56(5–6), 543–567. doi: 10.1007/s10236-006-0090-1
- Castro de la Guardia, L. C., Hu, X., & Myers, P. G. (2015). Potential positive feedback between Greenland Ice Sheet melt and Baffin Bay heat content on the west Greenland shelf. Geophysical Research Letters, 42(12), 4922–4930. doi: 10.1002/2015GL064626
- Cuny, J., Rhines, P. B., & Ron Kwok, P. B. (2005). Davis Strait volume, freshwater and heat fluxes. Deep Sea Research Part I: Oceanographic Research Papers, 52(3), 519–542. doi: 10.1016/j.dsr.2004.10.006
- Curry, B., Lee, C. M., & Petrie, B. (2011). Volume, freshwater, and heat fluxes through Davis Strait, 2004–05. Journal of Physical Oceanography, 41(3), 429–436. doi: 10.1175/2010JPO4536.1
- Curry, B., Lee, C. M., Petrie, B., Moritz, R. E., & Kwok, R. (2014). Multiyear volume, liquid freshwater, and sea ice transports through Davis Strait, 2004-10. Journal of Physical Oceanography, 44(4), 1244–1266. doi: 10.1175/JPO-D-13-0177.1
- Dickson, R., Rudels, B., Dye, S., Karcher, M., Meincke, J., & Yashayaev, I. (2007). Current estimates of freshwater flux throught Arctic and subarctic seas. Progress in Oceanography, 73, 210–230. doi: 10.1016/j.pocean.2006.12.003
- Dumas, J. A., Flato, G. M., & Brown, R. D. (2006). Future projections of landfast ice thickness and duration in the Canadian Arctic. Journal of Climate, 19(20), 5175–5189. doi: 10.1175/JCLI3889.1
- Fichefet, T., & Maqueda, M. A. M. (1997). Sensitivity of a global sea ice model to the treatment of ice thermodynamics and dynamics. Journal of Geophysical Research: Oceans (1978–2012), 102(C6), 12609–12646. doi: 10.1029/97JC00480
- Fissel, D., Lemon, D., & Birch, J. (1982). Major features of the summer near-surface circulation of western Baffin Bay, 1978 and 1979. Arctic, 35, 180–200.
- Gordon, C., Cooper, C., Senior, C. A., Banks, H., Gregory, J. M., Johns, T. C., … Wood, R. A. (2000). The simulation of SST, sea ice extents and ocean heat transports in a version of the Hadley Centre coupled model without flux adjustments. Climate Dynamics, 16(2–3), 147–168. doi: 10.1007/s003820050010
- Griffies, S. M., & Greatbatch, R. J. (2012). Physical processes that impact the evolution of global mean sea level in ocean climate models. Ocean Modelling, 51, 37–72. doi: 10.1016/j.ocemod.2012.04.003
- Holland, D. M., Thomas, R. H., De Young, B., Ribergaard, M. H., & Lyberth, B. (2008a). Acceleration of Jakobshavn Isbrae triggered by warm subsurface ocean waters. Nature Geoscience, 1(10), 659–664. doi: 10.1038/ngeo316
- Holland, P. R., Jenkins, A., & Holland, D. M. (2008b). The response of ice shelf basal melting to variations in ocean temperature. Journal of Climate, 21(11), 2558–2572. doi: 10.1175/2007JCLI1909.1
- Hu, X., & Myers, P. G. (2013). A Lagrangian view of Pacific water inflow pathways in the Arctic Ocean during model spin-up. Ocean Modelling, 71, 66–80. doi: 10.1016/j.ocemod.2013.06.007
- Hu, X., & Myers, P. G. (2014). Changes to the Canadian Arctic Archipelago sea ice and frewhater fluxes in the twenty-first century under the intergovernmental panel on climate chance A1B climate scenario. Atmosphere-Ocean, 52(4), 1–20. doi: 10.1080/07055900.2014.942592
- Hunke, E. C. (2001). Viscous-plastic sea ice dynamics with the EVP model: Linearization issues. Journal of Computational Physics, 170(1), 18–38. doi: 10.1006/jcph.2001.6710
- Hunke, E. C., & Dukowicz, J. K. (1997). An elastic-viscous-plastic model for sea ice dynamics. Journal of Physical Oceanography, 27(9), 1849–1867. doi: 10.1175/1520-0485(1997)027<1849:AEVPMF>2.0.CO;2
- Kliem, N., & Greenberg, D. A. (2003). Diagnostic simulations of the summer circulation in the Canadian Arctic Archipelago. Atmosphere-Ocean, 41, 273–289. doi: 10.3137/ao.410402
- Landerer, F. W., Jungclaus, J. H., & Marotzke, J. (2007). Regional dynamic and steric sea level change in response to the IPCC-A1B scenario. Journal of Physical Oceanography, 37(2), 296–312. doi: 10.1175/JPO3013.1
- Large, W., & Yeager, S. (2009). The global climatology of an interannually varying air-sea flux data set. Climate Dynamics, 33(2–3), 641–364. doi: 10.1007/s00382-008-0441-3
- Madec, G. (2008). NEMO ocean engine. Note du Pole de modelisation, 27, 1288–1619.
- McGeehan, T., & Maslowski, W. (2012). Evaluation and control mechanisms of volume and freshwater export through the Canadian Arctic Archipelago in a high-resolution pan-Arctic ice-model. Journal of Geophysical Research, 117(C00D14), doi: 10.1029/2011JC007261
- Melling, H., Agnew, T. A., Falkner, K. K., Greenberg, D. A., Lee, C. M., Münchow, A., … Woodgate, R. A. (2008). Fresh-water fluxes via Pacific and Arctic outflows across the Canadian polar shelf. In R. Dickson, J. Meinke, & P. Rhines (Eds.), Arctic-subarctic ocean fluxes (pp. 193–247). Holland: Springer.
- Münchow, A. (2016). Volume and freshwater flux observations from Nares Strait to the west of Greenland at daily time scales from 2003 to 2009. Journal of Physical Oceanography, 46(1), 141–157. doi: 10.1175/JPO-D-15-0093.1
- Münchow, A., Falkner, K. K., & Melling, H. (2007). Spatial continuity of measured seawater and tracer fluxes through Nares Strait, a dynamically wide channel bordering the Canadian Archipelago. Journal of Marine Research, 65(6), 759–788. doi: 10.1357/002224007784219048
- Münchow, A., Falkner, K. K., & Melling, H. (2015). Baffin Island and West Greenland current systems in northern Baffin Bay. Progress in Oceanography, 132, 305–317. doi: 10.1016/j.pocean.2014.04.001
- Münchow, A., & Melling, H. (2008). Ocean current observations from Nares Strait to the west of Greenland: Interannual to tidal variability and forcing. Journal of Marine Research, 66(6), 801–833. doi: 10.1357/002224008788064612
- Murray, R. J. (1996). Explicit generation of orthogonal grids for ocean models. Journal of Computational Physics, 126(2), 251–273. doi: 10.1006/jcph.1996.0136
- Myers, P. G., & Ribergaard, M. H. (2013). Warming of the polar water layer in Disko Bay and potential impact on Jakobshavn Isbrae. Journal of Physical Oceanography, 43(12), 2629–2640. doi: 10.1175/JPO-D-12-051.1
- Nakicenovic, N., & Swart, R. (2000). Intergovernmental Panel on Climate Change Special Report on Emissions Scenarios. Cambridge: Cambridge University Press.
- Petersen, I., Hamilton, J., Prinsenberg, S., & Pettipas, R. (2012). Wind-forcing of volume transport through Lancaster Sound. Journal of Geophysical Research: Oceans (1978–2012), 117(C11), doi: 10.1029/2012JC008140
- Rabe, B., Dodd, P., Hansen, E., Falck, E., Schauer, U., Mackensen, A., … Cox, K. (2013). Liquid export of Arctic freshwater components through the Fram Strait 1998-2011. Ocean Science, 9(1), 91–109. doi: 10.5194/os-9-91-2013
- Serreze, M. C., Barret, P., Slater, A. G., Woodgate, R. A., Aagaard, K., Lammers, R. B., … Lee, C. M. (2006). The large-scale freshwater cycle of the Arctic. Journal of Geophysical Research, 111(C11010), doi: 10.1029/2005JC003424
- Sou, T., & Flato, G. (2009). Sea ice in the Canadian Arctic Archipelago: Modelling the past (1950–2004) and future (2041–60). Journal of Climate, 22, 2181–2198. doi: 10.1175/2008JCLI2335.1
- Steele, M., & Ermold, W. (2007). Steric sea level change in the Northern Seas. Journal of Climate, 20, 403–417. doi: 10.1175/JCLI4022.1
- Steele, M., Morley, R., & Ermold, W. (2001). PHC: A global ocean hydrography with a high-quality Arctic Ocean. Journal of Climate, 14(9), 2079–2087. doi: 10.1175/1520-0442(2001)014<2079:PAGOHW>2.0.CO;2
- Stirling, I. (1980). The biological importance of polynyas in the Canadian Arctic. Arctic, 30, 303–315.
- Tang, C. C. L., Ross, C. K., Yao, T., Petrie, B., DeTracey, B. M., & Dunlap, E. (2004). The circulation, water masses and sea-ice of Baffin Bay. Progress in Oceanography, 63(4), 183–228. doi: 10.1016/j.pocean.2004.09.005
- Wang, Q., Myers, P. G., Hu, X., & Bush, A. B. G. (2012). Flow constraints on pathways through the Canadian Arctic Archipelago. Atmosphere-Ocean, 50, 373–385. doi: 10.1080/07055900.2012.704348
- Wekerle, C., Wang, Q., Danilov, S., Jung, T., & Schroter, J. (2013). The Canadian Arctic Archipelago throughflow in a multiresolution global model: Model assessment and the driving mechanism of interannual variability. Journal of Geophysical Research: Oceans, 118(9), 4525–4541.
- Zweng, M. M., & Münchow, A. (2006). Warming and freshening of Baffin Bay, 1916–2003. Journal of Geophysical Research: Oceans (1978–2012), 111(C7), doi: 10.1029/2005JC003093