
ABSTRACT
It has been frequently observed that there are surface cold patches (SCPs) in the Yellow Sea in summer. Although previous studies based on monthly mean temperature distribution found that these SCPs are a result of tidal mixing and tide-induced upwelling, tidal mixing and upwelling alone cannot explain all the occurrences. In our study we found that the three typical patches, namely, the Shandong SCP, the Subei SCP, and the Mokpo SCP, have different temporal patterns over a spring–neap tidal cycle; hence, they have different generating mechanisms. Based on a multiple-year simulation, the latter two show conspicuous spring–neap variations. The highest temperature occurs during the neap tide phase (about two days after a quarter moon). Because of weak upwelling and mixing, strong stratification is established and the SCPs are suppressed or even disappear. The opposite holds for the spring tide phase (about two days after a new or full moon). This is quite different from the Shandong SCP, which does not display a distinct difference between spring and neap tides. Buoy observations and composite analyses with data from the Moderate Resolution Imaging Spectroradiometer (MODIS) further support this conclusion.
RÉSUMÉ
[Traduit par la rédaction] Des zones d’eau froide en surface ont été fréquemment observées dans la mer Jaune en été. Bien que des études précédentes sur la distribution de températures moyennes mensuelles aient trouvé que ces zones résultaient de mélange et de remontée des eaux dus à la marée, ces deux mécanismes ne peuvent expliquer à eux seuls toutes les occurrences. Nous avons trouvé que trois zones typiques, notamment, les zones du Shandong, de Subei et de Mokpo, montrent des configurations temporelles différentes durant le cycle morte-eau–vive-eau et donc découlent de mécanismes différents. Selon une simulation sur plusieurs années, les zones de Subei et de Mokpo montrent des variations morte-eau–vive-eau notables. La température la plus élevée survient durant la marée de morte-eau (environ deux jours après un quartier de lune). Une forte stratification se forme, en raison d’une remontée des eaux et d’un mélange faibles, et atténue ou fait disparaître la zone froide en surface. Le contraire se produit durant la phase de vive-eau (environ deux jours après une nouvelle ou une pleine lune). Le phénomène diffère considérablement en ce qui a trait à la zone du Shandong, qui ne montre pas de différence entre les marées de morte-eau et de vive-eau. Les observations émanant de bouées et les analyses composites issues du MODIS (spectroradiomètre imageur à résolution moyenne) étayent aussi cette conclusion.
1 Introduction
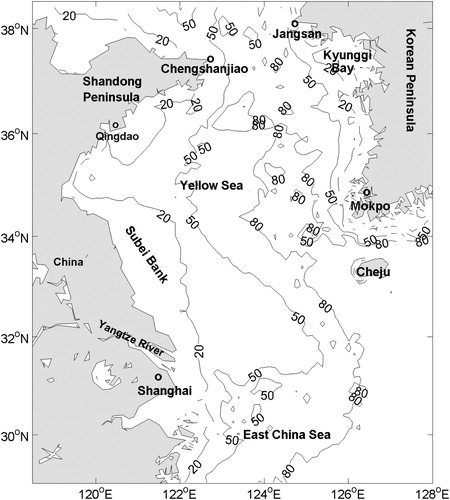
The Yellow Sea is a western Pacific marginal shallow sea surrounded by mainland China and the Korean Peninsula (). The average water depth is about 44 m, with a maximum close to 100 m in the central trough. The Yellow Sea can be divided into two parts, with the dividing line running across the sea from Chengshanjiao, Shandong, China, to Jangsan point, Korea.
Fig. 1 Bathymetry of the study area (contour interval is 30 m).
A conspicuous phenomenon in the Yellow Sea is the Yellow Sea Cold Water Mass (YSCWM) in warm seasons. It is believed to be induced by bottom topography and summer atmospheric conditions. Surface cold patches (SCPs) are often observed around the YSCWM (e.g., Seung, Chung, & Park, Citation1990; Zou, Guo, Tang, Lee, & Lie, Citation2001), in contrast to the ambient high sea surface temperature (SST) in boreal summer. Previously, these patches around the southwestern coast of Korea (off Mokpo) have been ascribed to pure tidal mixing (e.g., Lie, Citation1986). But they may also result from the upwelling of deep water beneath the thermocline, just as off Nova Scotia (e.g., Garrett & Loucks, Citation1976).
Recently, Lü, Qiao, Xia, Wang, and Yuan (Citation2010) found that two processes account for the formation of the SCPs: tidal mixing and tide-induced upwelling. The intensified tidal mixing, hence the surface cold patch, is concentrated along the slope of the Yellow Sea trough. The sharp change in water depth increases the velocity shear significantly, thus enhancing vertical mixing. The intensified mixing changes the density distribution in the horizontal, which consequently triggers a secondary upwelling. In addition, the site selectivity of the SCPs agrees with the maximum values of tidal currents. Fast current speed results in high tidal mixing that induces strong upwelling (Lü et al., Citation2010, their ). Besides, the location of the SCPs is related to the Simpson–Hunter index (Simpson & Hunter, Citation1974), SH = log(H/|U3|), where H is water depth, and U is the amplitude of the tidal velocity. This criterion describes the influence of surface buoyancy input and tidal mixing in controlling the water column structure of shelf seas in summer. The value of SH (1.8–2.0) shows good agreement with the location of the SCPs (Zhao, Citation1987; Lü et al., Citation2010, their ). These processes have also been shown to play a role in the formation of the three fronts in the Yellow Sea, namely, the Subei Bank Front, Shandong Peninsula Front, and Mokpo Front (Ren, Xie, & Jiang, Citation2014). Specifically, through comparative experiments with and without tidal forcing and examination of the term balances of the potential temperature equation, tidal mixing is the dominant factor in the formation of the Shandong SCP; the SCP off Mokpo is mainly driven by tide-induced upwelling. The Subei SCP is induced by the combined effects of upwelling and tidal mixing.
So far, both model results and satellite observations have confirmed that the SCPs do exist on the SST monthly mean maps in summer, and it has been argued that tidal mixing and tide-induced upwelling are the two key factors in the formation of the SCPs. However, the SCPs do not exist consistently during summer. Simply examining the monthly mean field may not be sufficient to investigate the underlying mechanisms. On the other hand, the spring–neap tidal cycles show the apparent effects on turbulent mixing, stratification, and residual circulation in Chesapeake Bay (Li & Zhong, Citation2009). Besides, previous ocean colour observations from satellites have revealed distinct differences in ocean optical and biogeochemical properties over the spring–neap tidal cycle in the Bohai Sea, Yellow Sea, and East China Sea (Shi, Wang, & Jiang, Citation2011) in summer. The Changjiang River plume is also modulated by the tides (Wu, Zhu, Shen, & Wang, Citation2011). Freshwater flux (FWF) from diluted Changjiang water to the southward and northward branches also contains spring–neap signals, while the FWF usually reaches its maximum during the spring tide (Wu, Shen, Zhu, Zhang, & Li, Citation2014). The spring–neap variations also show potential impacts on the evolution of the YSCWM in autumn (Li et al., Citation2016). However, there has been no report on the influence of the spring–neap tidal cycles on the evolution of SCPs.
This study is intended to fill that gap. We used a three-dimensional (3D) numerical model to investigate the temperature variation over the spring–neap tidal cycles. The remainder of this paper is organized as follows. Section 2 provides a brief description of the seasonal evolution of the SCPs. The numerical model and its validation are introduced in Section 3. The effects of the spring–neap tidal cycles on the SCPs are discussed in Section 4. Conclusions are provided in Section 5.
2 Seasonal evolution
Based on multiple years (2003–2016) of Moderate Resolution Imaging Spectroradiometer (MODIS) SST datasets (https://modis.gsfc.nasa.gov/), the seasonal evolution of the SCPs is shown in . In general, the SCPs form in spring, flourish in summer, and decline in autumn. To further describe the evolution, following Ma, Qiao, and Xia (Citation2004), we calculate the zonal gradient of temperature:(1)
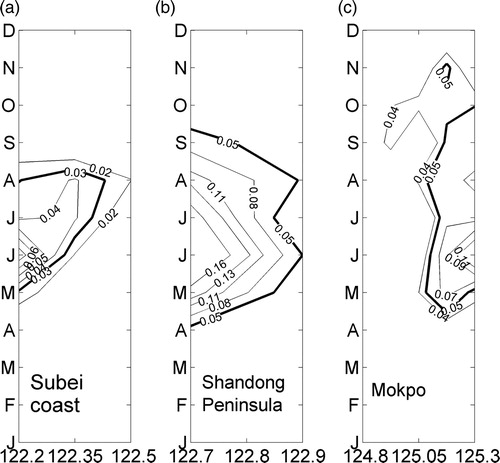
shows the annual cycles of
for the three lines off the coasts of Subei, Shandong Peninsula, and Mokpo shown in . We use 0.03°C km−1 to mark the boundary of the SCP off the Subei coast. As shown, the SCP starts to emerge in May, grows during June and July, and disappears in late August. Compared with the Subei SCP, the SCP off Shandong is stronger (b), with 0.05°C km−1 as its boundary. It forms in late April, reaches its maximum in June and July, and vanishes in late September. The isoline of 0.05°C km−1 is also used to demarcate the SCP off Mokpo, which appears in May and disappears in October.
Fig. 2 Monthly SST (°C) climatology (2003–2016) based on MODIS-Aqua and MODIS-Terra measurements from April to November. The SCPs are marked by a dashed ellipse during summer and the three lines used to calculate |ST| are shown in the June subplot.
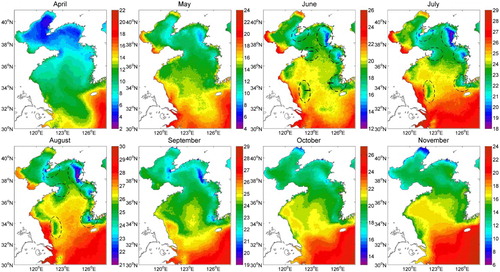
Fig. 3 Annual cycles of (°C km−1; from MODIS) off (a) the Subei coast (122.2°–122.5°E, 33.7°N), (b) Shandong Peninsula (122.7°–122.9°E, 37.35°N), and (c) Mokpo (124.8°–125.3°E, 34.4°N).
3 Numerical model and its validation
a Numerical model
The model we used is the Estuarine, Coastal and Ocean Model (semi-implicit) (ECOM-si), which covers all the East China Seas (including the Yellow Sea, Bohai Sea, and East Sea), as well as parts of the Pacific Ocean and the Japan Sea (Wu et al., Citation2014). The open boundary lies approximately parallel to the Ryukyu Islands. The resolution varies, from several hundred metres near the river mouth to 2–3 km in the open ocean. There are twenty sigma layers in the vertical, and a wet/dry scheme is included with a critical depth of 0.25 m. The inclusion of intertidal flats is important for a correction simulation of the Changjiang plume (Wu & Zhu, Citation2010).
At the open boundaries the specified currents are a combination of the shelf and tidal currents. The boundary shelf current is from daily Hybrid-Coordinate Ocean Model (HYCOM) data with 1/12° spatial resolution, including the Kuroshio Current, Taiwan Warm Current, and Tsushima Warm Current. The harmonic constants of tidal currents were derived using a method suggested by Wu et al. (Citation2011). Boundary and initial conditions of salinity and temperature are from HYCOM and the Simple Ocean Data Assimilation dataset, respectively. Heat flux is derived from the six-hour European Centre for Medium–range Weather Forecasts (ECMWF) dataset (ERA-Interim; January 1979 to present). More details can be found in Wu et al. (Citation2011, Citation2014).
The model starts 1 January 2008, reaching a statistical equilibrium after a spin-up of one year. Our study uses the hourly output for July and August of 2009–2013.
b Model validation
1 Tide verification
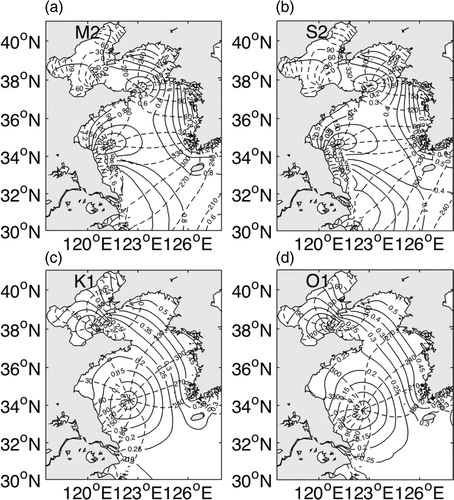
Considering the strong influence of tides in the Yellow Sea, the modelled cotidal charts are compared with previous model results and satellite observations (Fang et al., Citation2004; Lü et al., Citation2010; Ren et al., Citation2014). The distributions of the four main constituents (i.e., M2, S2, K1, and O1) are satisfactorily reproduced (). Specifically, the semidiurnal tides (M2 and S2) in the Yellow Sea display two amphidromic points located off Chengshanjiao and Haizhou Bay, respectively.
Fig. 4 Simulated cotidal charts for (a) M2, (b) S2, (c) K1, and (d) O1 tidal constituents. Dashed and solid lines denote phase lag (degree; with respect to Beijing standard time (utc + 8 h)) and amplitude (cm), respectively.
2 Surface cold patches
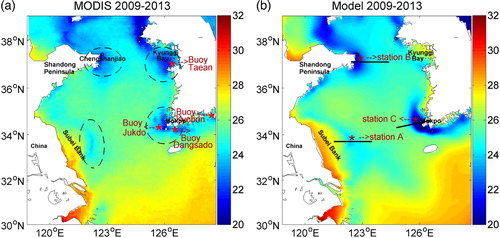
Our goal is to understand the evolution of the SCPs over the spring–neap tidal cycles. Because the SCPs are enhanced during summer (), we chose the monthly mean SST for July and August of 2009 to 2013 for the validation (). In a, four SCPs, marked with ellipses, can be seen: off Subei Bank, off Chengshanjiao (the eastern tip of Shandong Peninsula), and off two tips of the Korean Peninsula (Kyunggi Bay and Mokpo). Overall, the modelled SST agree well with observations even though the simulated SST off the Subei coast are warmer (about 1°–2°C) than the MODIS SST. The intensities of the simulated SCPs off Subei Bank, Shandong Peninsula, and the southwestern tip of the Korean Peninsula are all in good agreement with the MODIS results, but the intensity off Mokpo is a little stronger. The SCP in Kyunggi Bay (northeastern part of the Yellow Sea) is not well reproduced by the model. There are two possible reasons. First, river discharges into Kyunggi Bay were not included. Sensitivity tests (with and without the Han River) indicated that whether or not the Han River discharge was included has little influence on the SCP simulation in Kyunggi Bay (not shown). Second, the bathymetry around Kyunggi Bay was not well resolved because of a lack of data. The model could be further improved given more detailed bathymetry data in the eastern part of the Yellow Sea.
Fig. 5 Distribution of monthly mean SST (°C) for July to August of 2009–2013 from (a) MODIS and (b) model results. The SCPs are marked with dashed ellipses. Locations of stations referred to in are indicated by asterisks.
3 Sea surface temperature
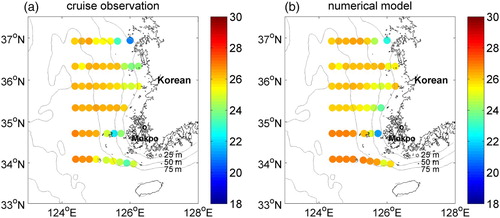
Hydrographic data from the Korean Oceanographic Data Center of the National Fisheries Research and Development Institute are compared with the modelled SST in summer. The results are shown in . The hydrographic observations cover the southeast part of the Yellow Sea. Even though the sampling is not sufficiently dense to resolve the SCP off the coast of Korea, it can serve to validate the model. Generally, the simulation shows satisfactory results compared with the cruise observations, with an error tolerance within 2°C. Thus, our model results can be used for the purposes of this study.
Fig. 6 (a) KODC hydrographic mean SST for the summers of 2010 to 2013 (22–27 August 2010; 1–5 July 2011; 10–18 August 2012; 13–20 August 2013). (b) As in (a) but for modelled SST. Contours denote the bathymetry of the Yellow Sea (contour interval is 25 m).
4 Results
a Spring–Neap Tidal cycle of the SCP off the Subei coast
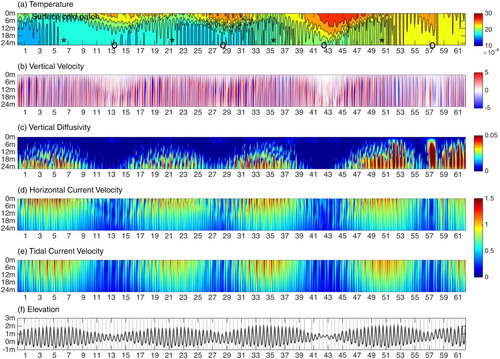
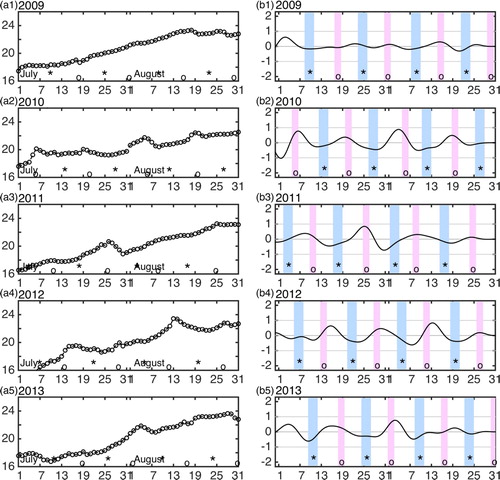
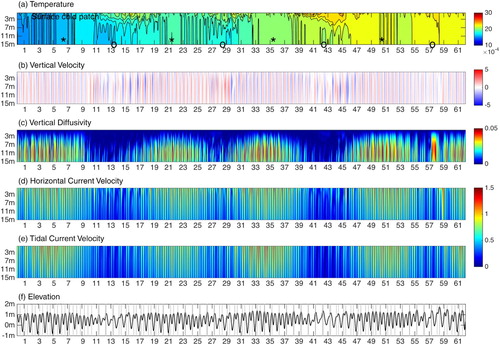
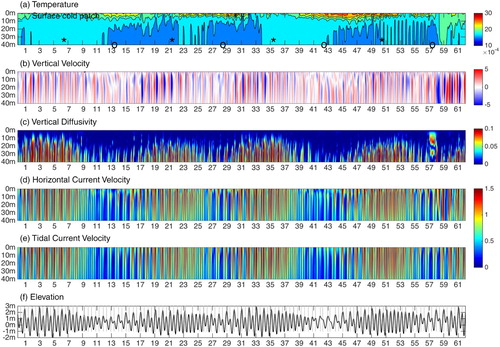
The time series of the modelled near-surface temperature (3 m) for July and August of 2009–2013 at station A (122.3°E, 33.7°N) is plotted in a. They are then band-pass filtered using a Butterworth filter between 7 and 21 days to check whether the SCP off the Subei coast contains the spring–neap signal (b). In b, obviously, the five years of band-pass filtered results all show a clear spring–neap temperature cycle. The temperature reaches its minimum (maximum) during the spring (neap) tidal phases. The modelled vertical profile of temperature, vertical velocity, vertical diffusivity, horizontal velocity, and the reconstructed tidal currents and surface elevation at station A for July and August 2012 are shown in . All the variables show obvious spring–neap variations. During the spring tidal phases, lower level cold water rises because of strong tidal mixing, while upwelling supplies cold water from the subsurface layer. During the neap tidal phases, the vertical velocity in the upper layer is weak and the tidal mixing effect almost disappears. As a result, the cold water in the deep layer cannot penetrate to the surface, and the SCP fades away. For example, on 13 July (Day 13) and 12 August (Day 43), with the weak upwelling and mixing, strong stratification is established and the upper layer water becomes warmer, and the SCP is suppressed.
Fig. 7 Time series of modelled temperature (°C) at station A for July and August of 2009–2013. (a) Raw time series and (b) band-pass (7–21 days) filtered time series. The asterisks indicate the times of the spring tide, while the circles mark the times of the neap tide. The blue and red vertical bars in (b) represent the spring and neap tidal phases, respectively.
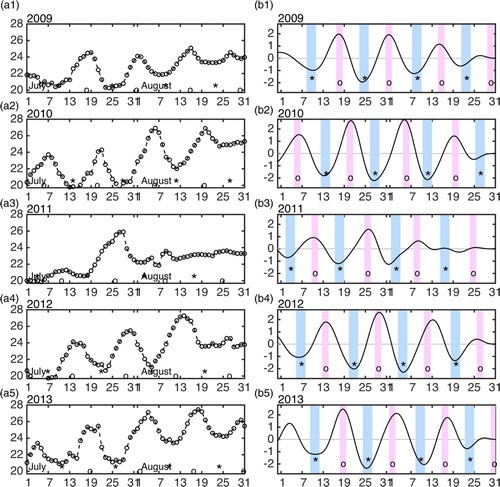
Fig. 8 Time-depth distribution of the modelled and reconstructed data at station A (b) for July and August 2012. The rows from top to bottom are (a) temperature (°C), (b) vertical velocity (m s−1), (c) vertical diffusivity (m2 s−1), (d) horizontal current (m s−1), (e) reconstructed tidal current velocity (m s−1), and (f) surface elevation (m). The asterisks indicate the times of the spring tide, while the circles denote the times of the neap tide.
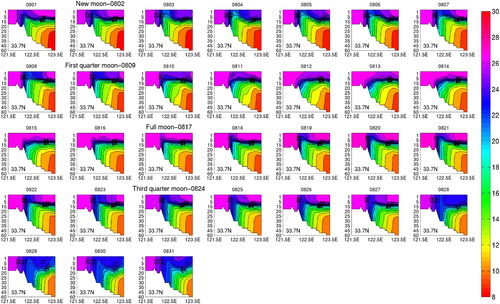
To further demonstrate the evolution of the SCP off the Subei shoal, in we show the section profile along 33.7°N, from 121.5°E to 123.5°E, for temperature in August 2012. On 4 August (two days after the new moon), the SCP reaches its maximum, and the 23°C isotherm line outcrops to the sea surface. On 11 August (two days after the first quarter moon), the outcrop isotherm line is 26°C, but, from 12 to 16 August, the 26°C isotherm line is totally suppressed. The temperature difference between the spring tide SCP and the neap tide SCP can be as large as 3°C. This difference implies that the effect of the spring–neap tidal variation cannot be ignored when investigating the evolution of SCPs. This kind of spring–neap variation is similar during the next cycle.
Fig. 9 Temperature profiles (°C) along 33.7°N from 1 to 31 August 2012. The 22° to 26°C isolines (with a 1°C interval) are contoured.
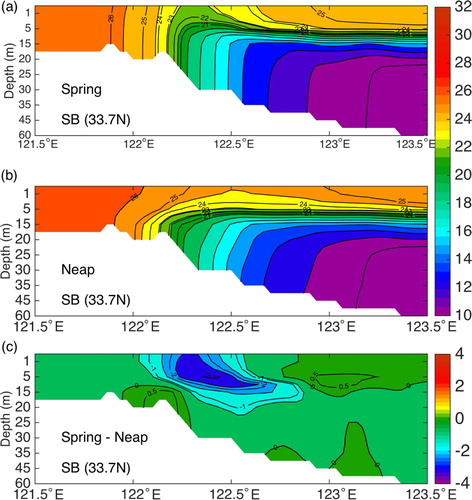
The modelled temperature for July and August of 2009–2013 is sorted based on spring tides (defined as two days after the new or full moon) and neap tides (defined as two days after the quarter moon). shows the profiles of spring and neap tide composites and their differences. Obviously, the monthly mean does not explain everything. The outcropped isothermal line of the spring profile is between 22° and 23°C while the neap profile is between 24° and 25°C. In addition, in c, the minimum value occurs in the area where the SCP emerges, consistent with the spring–neap variation. For the Subei region, we may, therefore, safely say that the formation of the SCP in summer is mainly induced during the spring tidal phase. In the neap tidal phase, the tidal effect may not be evident. In addition, during some neap tide days, such as 14–16 August 2012, strong stratification is established and the upwelling and mixing are totally suppressed and so the SCP disappears.
Fig. 10 Section profiles of temperature (°C) for the (a) spring mean, (b) neap mean, and (c) their difference (spring minus neap) along 33.7°N, from 121.5°E to 123.5°E off the Subei coast.
b Spring–Neap Tidal cycle of the SCP off Shandong Peninsula
We now look at another major region of SCP along the coast of China. The raw and band-pass filtered temperature time series at station B (122.7°E, 37.1°N; b) are shown in . Compared with station A off the coast of Subei, the spring–neap variations off Shandong Peninsula are not evident, with their amplitude being less than 1°C.
Fig. 11 As in , but for station B.
The upwelling at station B is not only weaker than at station A (off the coast of Subei) but is also not obviously different over a spring–neap cycle (b). However, tidal mixing is strong here during the spring tidal phases, making the water column vertically homogeneous (c). Tidal mixing is the dominant factor that induces the Shandong Front, in agreement with Lü et al. (Citation2010) and Ren et al. (Citation2014).
Fig. 12 As in , but for station B.
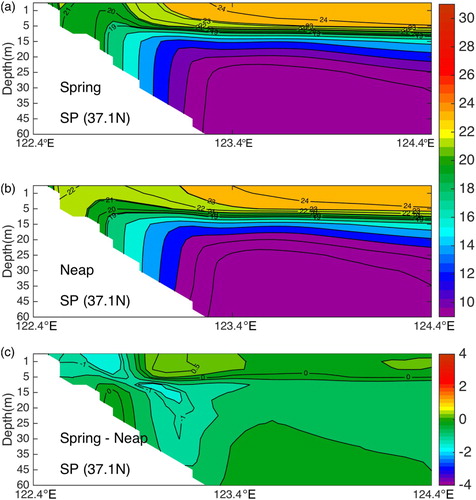
Similarly, shows the temperature profile along 37.1°N off the tip of the Shandong Peninsula (station B in b). The outcropped isothermal line on the spring profile is about 21°C, while on the neap profile it is close to 22°C. The SCP off Shandong also has a spring–neap variation, but the difference between the spring temperature and the neap temperature is not significant; this is different from that at the Subei shoal.
Fig. 13 As in , but for the profiles off Shandong Peninsula.
Based on the results of a high-resolution model, HYCOM, Ren et al. (Citation2014) suggested that tidal mixing is the dominant factor that induces the Shandong Front, while both tidal upwelling and tidal mixing are important for the Subei Front. The difference in the generating mechanism may account for the differences in the spring–neap temperature variations between these two regions. In this sense, previous studies with the monthly mean temperature are appropriate only for the Shandong SCP.
c Spring–Neap Tidal cycle of the SCP off Mokpo
We now concentrate on the SCP off Mokpo (southwest of the Korean Peninsula). The time series for temperature at station C (125.6°E, 34.7°N; b) are shown in . Similar to station A (off the Subei coast), this station also shows significant spring–neap variations. From , we see that both upwelling and tidal mixing show obvious spring–neap variations. During the spring tidal phases, strong upwelling combined with tidal mixing leads to the formation of the SCP. During the neap tidal phases, the SCP diminishes because of weak upwelling and mixing.
Fig. 14 As in , but for station C.
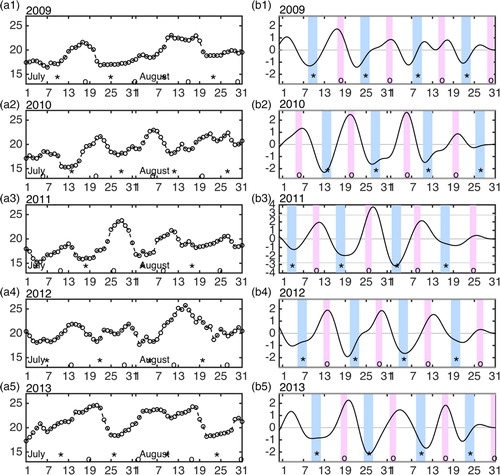
Fig. 15 As in , but for station C.
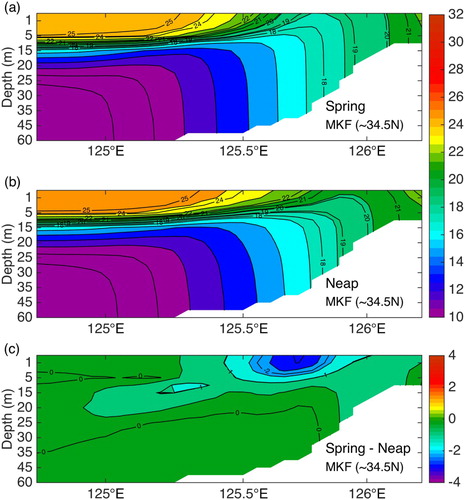
shows the profile of the temperature off the tip of Mokpo along approximately 34.5°N (station C in b). The outcropped isothermal line on the spring profile is about 19°C, while on the neap profile it is close to 21°C. The vertical temperature profile in c shows a pattern similar to c. The minimum values are trapped near the surface below the SCP, while in other areas they are almost zero.
Fig. 16 As in , but for the profile off Mokpo.
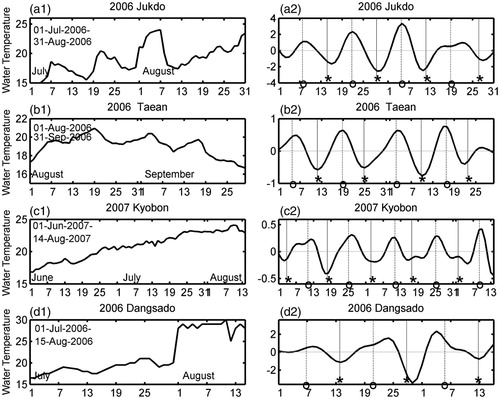
Buoy observations and MODIS data also reveal a similar temporal pattern over a spring–neap cycle. Thirteen years (2003–2015) of MODIS daily SST data were sorted based on spring and neap tides to obtain SST maps averaged during each phase. The daily SST images are data sparse in the Yellow Sea. For convenience, the spring and neap tide days are defined as 1–3 days after the new or full moon and quarter moon, respectively. A composite analysis shows that SST fluctuates over the spring–neap tidal cycles (). During spring tides, the SST anomaly is negative because of strong mixing and upwelling, while during neap tides the weakened mixing and upwelling result in a positive SST anomaly. In general, tidal currents exceed 1 m s−1 near the coast and gradually decrease offshore in the central Yellow Sea basin (Larsen, Cannon, & Choi, Citation1985). That is to say, the tides are coastally trapped. So, the spring–neap SST variation is also enhanced in coastal regions. This is the case for both the Subei SCP and Mokpo SCP (b and 16c). Buoy observations (a) also support this (in ). In a2, the Jukdo buoy is at the core of the SCP off Mokpo and shows obvious spring–neap variations, with its amplitude being consistent with modelled results (b).
Fig. 17 MODIS SST (°C) fluctuations over a spring–neap tidal cycle in the Yellow Sea. (a) MODIS SST (°C) averaged for July and August of 2003–2015 and SST anomalies during (b) spring tides and (c) neap tides.
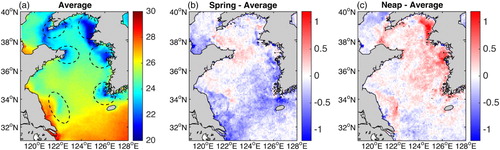
Fig. 18 Raw time series of temperature (°C) from buoy observations at (a1) Jukdo (125.51°E, 34.13°N), (b1) Taean (126.24°E, 36.91°N), (c1) Kyobon (128.31°E, 34.70°N), and (d1) Dangsado (126.36°E, 34.05°N). Band-pass filtered (7–21 days) time series of temperature (°C) for (a2) Jukdo, (b2) Taean, (c2) Kyobon, and (d2) Dangsado. Asterisks indicate the times of the spring tide, while the circles mark the times of the neap tide. Buoy locations are shown in a.
However, the Shandong SCP does not have negative anomalies during the spring tidal phase. This could be caused by a lack of significant spring–neap difference in that region.
5 Conclusions
Multiple years of MODIS SST data show that SCPs in the Yellow Sea form in spring, grow in summer, and disappear in autumn. Time-longitude plots of the zonal gradient of SST show that the SCP off the Subei coast starts to emerge in May and disappears in late August. The SCP off Shandong Peninsula forms in late April and vanishes in late September, while the SCP off Mokpo appears in May and disappears in October. We used a 3D numerical model to investigate how the spring–neap tidal cycles influence the formation and evolution of these SCPs in summer. We found that the SCPs are quite different during spring tidal days and neap tidal days.
The spring–neap tidal cycle signals filtered from the varying background temperature fields show that the lowest temperature occurs during spring tidal days (defined as two days after a new moon or full moon), and the highest temperature occurs during neap tidal days (defined as two days after a quarter moon). This agrees with ocean colour observations; Shi et al. (Citation2011) showed that ocean colour in the Yellow Sea also has a spring–neap tidal cycle, with the largest (smallest) turbid water coverage lagging the new/full (quarter) moon by 2–3 days. This type of situation is most evident off the coasts of Subei and Mokpo, while the spring–neap variation off Shandong Peninsula is not notable.
The time-depth distributions of temperature, vertical velocity, and vertical diffusivity off the Subei shoal show that strong stratification is established during the neap tidal phase because of weak upwelling and mixing; hence, the SCPs are suppressed, while during the spring tidal period the SCPs are intensified thanks to the subsequent strong upwelling and mixing. The SCP off Mokpo shows a spring–neap variation similar to the Subei SCP. In contrast, the Shandong SCP does not show much variation over such a cycle. The composite analysis of the MODIS SST data and buoy observations also confirms the aforementioned SST fluctation over a spring–neap tidal cycle.
Acknowledgements
The hydrography and buoy data are from the Korean Oceanographic Data Center (KODC; http://kodc.nifs.go.kr/page?id = kr_index) and the National Marine Data and Information Service (NMDIS; http://www.cmoc-china.cn/). The MODIS data are available from https://modis.gsfc.nasa.gov/, and the phases of the moon are provided by the National Aeronautic and Space Administration (https://eclipse.gsfc.nasa.gov/lunar.html). The ECMWF dataset is from http://apps.ecmwf.int/datasets/data/interim-full-daily/levtype=sfc/.
Disclosure statement
No potential conflict of interest was reported by the authors.
Additional information
Funding
References
- Fang, G., Wang, Y., Wei, Z., Choi, B. H., Wang, X., & Wang, J. (2004). Empirical cotidal charts of the Bohai, Yellow, and East China Seas from 10 years of TOPEX/Poseidon altimetry. Journal of Geophysical Research, 109(C11), 227–251. doi: 10.1029/2004JC002484
- Garrett, C. J. R., & Loucks, H. (1976). Upwelling along the Yarmouth shore of Nova Scotia. Journal of the Fisheries Research Board of Canada, 33, 116–117. doi: 10.1139/f76-013
- Larsen, L. H., Cannon, G. A., & Choi, B. H. (1985). East China Sea tide currents. Continental Shelf Research, 4(1-2), 77–103. doi: 10.1016/0278-4343(85)90023-8
- Li, J., Li, G., Xu, J., Dong, P., Qiao, L., Liu, S., … Fan, Z. (2016). Seasonal evolution of the Yellow Sea cold water mass and its interactions with ambient hydrodynamic system. Journal of Geophysical Research: Oceans, 121, 6779–6792.
- Li, M., & Zhong, L. (2009). Flood–ebb and spring–neap variations of mixing, stratification and circulation in Chesapeake Bay. Continental Shelf Research, 29(1), 4–14. doi: 10.1016/j.csr.2007.06.012
- Lie, H. J. (1986). Summertime hydrographic features in the southeastern Hwanghae. Progress in Oceanography, 17(17), 229–242. doi: 10.1016/0079-6611(86)90046-7
- Lü, X., Qiao, F., Xia, C., Wang, G., & Yuan, Y. (2010). Upwelling and surface cold patches in the Yellow Sea in summer: Effects of tidal mixing on the vertical circulation. Continental Shelf Research, 30(6), 620–632. doi: 10.1016/j.csr.2009.09.002
- Ma, J., Qiao, F., & Xia, C. (2004). Tidal effects on temperature front in the Yellow Sea. Chinese Journal of Oceanology and Limnology, 22(3), 314–321. doi: 10.1007/BF02842565
- Ren, S., Xie, J., & Jiang, Z. (2014). The roles of different mechanisms related to the tide-induced fronts in the Yellow Sea in summer. Advances in Atmospheric Sciences, 31(5), 1079–1089. doi: 10.1007/s00376-014-3236-y
- Seung, Y.-H., Chung, J.-H., & Park, Y.-C. (1990). Oceanographic studies related to the tidal front in the mid-Yellow Sea off Korea: Physical aspect. Journal of the Oceanological Society of Korea, 25, 84–95.
- Shi, W., Wang, M., & Jiang, L. (2011). Spring–neap tidal effects on satellite ocean color observations in the Bohai Sea, Yellow Sea, and East China Sea. Journal of Geophysical Research, 116(2011), C12032. doi: 10.1029/2011JC007234
- Simpson, J. H., & Hunter, J. R. (1974). Fronts in the Irish Sea. Nature, 250(5465), 404–406. doi: 10.1038/250404a0
- Wu, H., Shen, J., Zhu, J., Zhang, J., & Li, L. (2014). Characteristics of the Changjiang plume and its extension along the Jiangsu coast. Continental Shelf Research, 76(2), 108–123. doi: 10.1016/j.csr.2014.01.007
- Wu, H., & Zhu, J. (2010). Advection scheme with 3rd high-order spatial interpolation at the middle temporal level and its application to saltwater intrusion in the Changjiang Estuary. Ocean Modelling, 33(1-2), 33–51. doi: 10.1016/j.ocemod.2009.12.001
- Wu, H., Zhu, J., Shen, J., & Wang, H. (2011). Tidal modulation on the Changjiang River plume in summer. Journal of Geophysical Research, Atmospheres, 116(C8), 192–197. doi: 10.1029/2011JC007209
- Zhao, B. (1987). A preliminary study of continental shelf fronts in the western part of southern Huanghai Sea and circulation structure in the front region of the Huanghai Cold Water Mass (HCWM). Oceanologia et Limnologia Sinica (in Chinese, with English Abstr). 18: 217–226.
- Zou, E. M., Guo, B. H., Tang, Y. X., Lee, J. H., & Lie, H. J. (2001). An analysis of summer hydrographic features and circulation in the southern Yellow Sea and the northern East China Sea. Oceanologia et Limnologia Sinica, 32(3), 340–348.