
ABSTRACT
Previous studies have shown that the recent summer climate (precipitation in particular) over East Asia is varying significantly. Here we extend the study to April, May, and June (AMJ) or the seasonal transition period associated with the onset of the summer monsoon. It is found that the average 1000–400 hPa AMJ tropospheric temperature (TT) experienced a sudden change at the end of the twentieth century. The change has a dipolar modal structure, with one pole over countries in Central Asia (Pakistan, Afghanistan, Uzbekistan, Kazakhstan, Kyrgyzstan, and Tajikistan.) and the other over the Tibetan Plateau. The difference in the TT between the centres of the two poles (∇TT), which characterizes the zonal gradient of the TT over Asia, has seen a significant reduction since 1999. The causal relations of ∇TT with the local circulation, outgoing longwave radiation (OLR), surface shortwave flux (SSWF), precipitation, etc. have been investigated using a newly developed rigorous causality analysis, which unambiguously reveals a one-way causality from ∇TT to each of OLR, SSWF, and precipitation.
RÉSUMÉ
[Traduit par la rédaction] Des études existantes ont montré que le climat estival récent (notamment les précipitations) de l’Asie orientale varie considérablement. Nous étendons ici ces travaux à avril, mai et juin, soit la période de transition saisonnière associée à l’arrivée de la mousson d’été. En ce qui concerne les mois de transition, la température troposphérique moyenne (TT) entre 1000 et 400 hPa a subi une modification soudaine à la fin du XXe siècle. Cette modification possède une structure modale bipolaire. L’un des pôles se situe au-dessus de l’Asie centrale (Pakistan, Afghanistan, Ouzbékistan, Kazakhstan, Kirghizstan et Tadjikistan) tandis que l’autre couvre le plateau du Tibet. La différence entre la température troposphérique de chacun des deux pôles (∇TT), qui caractérise le gradient zonal de la température troposphérique sur l’Asie, a connu une réduction considérable depuis 1999. Nous étudions la relation de cause à effet du ∇TT avec la circulation locale, le rayonnement sortant d’ondes longues, le flux en surface d’ondes courtes, les précipitations, etc. à l’aide d’une nouvelle méthode d’analyse rigoureuse de causalité, qui révèle sans équivoque une relation de cause à effet unilatérale du ∇TT avec chacun des facteurs énumérés.
1 Introduction
East Asia is a typical monsoon region and is one of the most active areas of the climate system because of its unique location and topography, which exhibits complex and distinctive spatiotemporal variations (Liu, Wang, & Yang, Citation2008; Lu & Fu, Citation2009; Zhou, Gong, Li, & Li, Citation2009). Among the signals characterizing the climate change is the tropospheric temperature (TT), which has seen a dramatic change in the recent climate record, such as increased tropical cyclone potential intensity, change in the withdrawal dates of the Indian summer monsoon, and increased precipitation amount over East Asia (Randel et al., Citation2009; Emanuel, Solomon, Folini, Davis, & Cagnazzo, Citation2013; Vaid & Liang, Citation2015; Vecchi, Fueglistaler, Held, Knutson, & Zhao, Citation2013; Xavier, Marzin, & Goswami, Citation2007). There have been several studies regarding changes in the TT over East Asia, especially during the summer monsoon; they are all associated with climate variability over this region and other parts of the world. For example, variability in the South and East Asian summer monsoon precipitation has been found to be related to the variation of TT; weakening of the East Asian summer monsoon has been attributed to the cooling of the upper TT during the 1958–2001 period (Yu, Wang, & Zhou, Citation2004), whereas warming of the TT over the tropical area of the Indian Ocean and western Pacific is believed to have weakened the Indian summer monsoon in the late 1970s. Also, the TT has been found to influence tropical storm activity through changing the intensity of storms (Emanuel, Citation2010; Vecchi et al., Citation2013). This, among other mechanisms, will bring exceptional rainfall causing flooding or drought in the populous Asian region (Parthasarathy, Rupakumar, & Sontakke, Citation1990; Yu et al., Citation2004; Zhang & Zhou, Citation2012). Over China, for example, the northward progression of the southerly monsoon winds may weaken because of the upper-tropospheric variation giving rise to a mid-lower Yellow River valley (34°–40°N) drought and excessive rain in the Yangtze River valley (Yu & Zhou, Citation2007). These, among numerous other findings, confirm the importance of variations of the TT. However, to the best of our knowledge, the variations of the TT during the seasonal transition period (from winter to summer), which usually occurs in April, May, and June (AMJ) and is usually associated with the onset of the Asian monsoon (Hirasawa, Kato, & Takeda, Citation1995), have not yet been fully explored; the associated pattern and the underlying possible mechanisms remain elusive.
The AMJ period is characterized by an abrupt change in general circulation and weather patterns and is usually accompanied by natural hazards (Chen & Chen, Citation1995; Murakami & Matsumoto, Citation1994). It is during this period that well-developed Meiyu fronts occur over East Asia and that strong westerlies over the Tibetan Plateau trigger early monsoon rainfall, particularly over the South and East Asian region (Park, Chiang, & Bordoni, Citation2012). Duan, Liu, and Wu (Citation2005) found that the thermal properties over the Tibetan Plateau during AMJ can be a useful predictor of early summer rainfall and atmospheric circulation over East Asia, especially in the valley between the Yangtze and Huaihe Rivers. Research into the variation of the TT during this period is, therefore, of great societal concern; it is also of scientific interest because it has been observed that the variability of the dynamics and thermodynamics during this period form a compact, interpretable, and significant set of predictors for the summer monsoon (Cannon & McKendry, Citation1999; Hastenrath & Greischar, Citation1993; Krishna Kumar, Soman, & Rupa Kumar, Citation1995; Parthasarathy, Diaz, & Eischeid, Citation1988; Singh, Bhadram, & Mandal, Citation1995). In this study, we continue our previous research along this line (Vaid & Liang, Citation2015) but with a particular focus on the monsoon onset period, namely the AMJ period. As we will see, this will result in a distinct pattern never discovered before. In the following, we first list the data sources and then present the results. This study is summarized in Section 4.
2 Data and methodology
The data we used came from the National Centers for Environmental Prediction (NCEP)–Department of Energy (DOE) Atmospheric Model Intercomparison Project (AMIP-II) reanalysis daily data and include air temperature, surface pressure, horizontal wind fields, and specific humidity (Kanamitsu et al., Citation2002). Other data include outgoing longwave radiation (OLR) and surface shortwave flux (SSWF). The former were obtained from the National Oceanographic and Atmospheric Administration (NOAA) Interpolated OLR team and the latter from the Modern-Era Retrospective Analysis for Research and Applications (MERRA; Rienecker et al., Citation2011). Precipitation data used in the study were obtained from the Asian Precipitation–Highly Resolved Observational Data Integration Towards Evaluation of Water Resources (APHRODITE) team (Yatagai et al., Citation2012).
We used traditional methodologies (e.g., regression analysis) and a newly developed tool for identifying the causality between time series. As is well known, one of the major challenges in data science is causal inference. During the past few years, Liang (Citation2014, Citation2016) established, in a rigorous sense, that the causality between two series, say, X1 and X2, can be quantitatively assessed. Moreover, the resulting formula is very concise in form. In the linear limit, the maximum likelihood estimator of the causality from X2 to X1 (units: nats per unit time) iswhere Cij is the sample covariance between Xi and Xj (i, j = 1, 2), and Ci,dj is the covariance between Xi and [Xj(t + kΔt) - Xj(t)]/(kΔt), with Δt being the time step and k ≥ 1 some integer. Ideally, when T2→1 is non-zero, then X2 is causal to X1 and vice versa. In practice, it usually cannot be precisely zero, and a statistical significance test should be performed (Liang, Citation2015); in the present study, the computed causality is significant at the 95% level. A corollary of the above formula is that causation implies correlation, but correlation does not imply causation. For details about the derivation and applications (in climate science and financial economics), see Liang (Citation2014, Citation2015, Citation2016) among others.
3 Results
We have shown previously that the TT averaged between 400 and 1000 hPa (or between 400 hPa and pressure at the surface in mountainous regions with an altitude higher than 1000 hPa, such as the Tibetan Plateau) characterizes climate variability well (Vaid & Liang, Citation2015). In the following, we will then refer to the depth-averaged TT simply as the TT unless confusion may arise. In this study, we analyze the same field; this effectively reduces the spatial dimensionality from three to two. In the time dimension, we will deal with the periods 1988–1998 and 1999–2009 separately; the former period (latter period) will hereafter be referred to as PRE99 (POST99). This distinction is motivated by the observation that the leading empirical orthogonal function modes of the tropical Pacific sea surface temperature anomalies for these two periods have shown very different warming patterns (Chung & Li, Citation2013; Xiang, Wang, & Li, Citation2013) and also by several findings that the global temperature has probably been experiencing an abrupt warming hiatus since the late 1990s (England et al., Citation2014; Kosaka & Xie, Citation2013; Trenberth & Fasullo, Citation2013; Watanabe et al., Citation2014; Ying, Shen, & Piao, Citation2015).
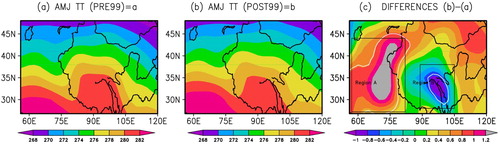
a shows the AMJ average TT for PRE99 and b shows the same average for POST99. The difference is displayed in c. As can be seen, the difference is organized into a dipole pattern, with one pole dominant over Central Asia (Pakistan, Afghanistan, Uzbekistan, Turkmenistan, Kazakhstan, Kyrgyzstan, and Tajikistan) and the other over the Tibetan Plateau. In c, the 57°–82°E, 27°–44°N regions (hereafter region A) and 89°–105°E, 28°–38°N (hereafter region B) are marked; they approximately correspond to the two poles of the difference in TT. To check the statistical significance of the difference, a Student’s t-test was performed. It was found that the two regions of the dipole in c enclosed by white contours are significantly different from zero at the 99.9% confidence level. A significant cooling centre is located over the Tibetan Plateau (c). This implies that there was a warming hiatus during the late 1990s compared with the early 1990s. This agrees with the results of An, Hou, Hu, and Wu (Citation2017). This warming hiatus over the Tibetan Plateau could be related to changes in the regional radiative energy and land surface processes (An et al., Citation2017).
Fig. 1 (a) AMJ TT (K) for the PRE99 period. (b) As in (a), but for the POST99 period. (c) Difference between (a) and (b). The regions in (c) enclosed by white contours are significantly different from zero at the 99.9% confidence level based on a Student's t-test. The regions indicated by the rectangular boxes are A (57°–82°E, 27°–44°N) and B (89°–105°E, 28°–38°N).
It is important to note that the thermal contrast over Asia plays a major role in driving the East Asian summer monsoon and is, therefore, of paramount scientific importance. For example, several studies have shown that the land–sea thermal contrast between the Eurasian continent and its adjacent ocean is a major driver of the East Asian summer monsoon (Cheng, Wu, & Dong, Citation2008; Goswami & Xavier, Citation2005; Vaid & Liang, Citation2015; Wu et al., Citation2012 and references therein). However, to the best of our knowledge, none of the previous studies in the literature have revealed such a dipole modal structure during the seasonal transition period (AMJ) and assessed its importance in affecting the climate over East Asia.
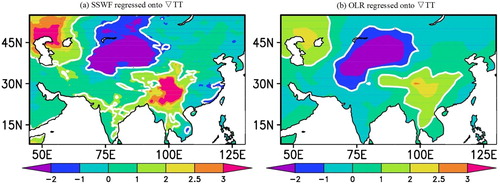
The basic driver of monsoon circulation is differential heating, which creates the necessary atmospheric temperature and pressure gradients (e.g., He, Ju, Wen, Lu, & Jin, Citation2007; Holton, Citation2004; Webster, Citation1987). Hence, we subtract the TT over region A from that over region B and analyze the resulting difference, which is essentially a zonal TT gradient (hereafter ∇TT). Because of the clear physical meaning, ∇TT forms an index measuring the monsoon circulation anomaly. To see this, we regress the zonal wind shear U200–U850 (i.e., the difference between the zonal velocity at 200 hPa and the zonal velocity at 850 hPa) onto the index; the result is shown by the contours in a. The procedure is repeated for the meridional wind shear (b). These two combined yield a regressed flow pattern (c) which is reminiscent of the TT difference; particularly, the two closed circulation centres are similar to the dipole structure shown in c. It is well known that longwave radiation and shortwave radiation play an important role in atmospheric processes. For comparison with the circulation features shown in , in we show the SSWF and OLR regressed onto ∇TT. A close look at the regression patterns for SSWF and OLR shows that they are similar to those for the circulation, reflecting the active convection over location B (see and for details). This dipole pattern thus seems to be the basic mode of the recent climate variability for the AMJ period over Asia.
Fig. 2 (a) Zonal wind shear regressed onto ∇TT. (b) Meridional wind shear regressed onto ∇TT. (c) Wind vectors (m s−1) regressed onto ∇TT (the regions enclosed by white contours are statistically significant at the 99% level based on a Student’s t-test). The regressions are for AMJ from 1988 to 2009.
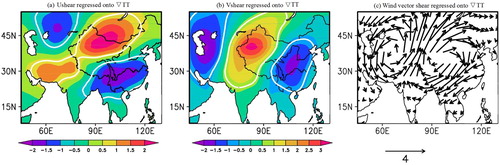
Fig. 3 (a) SSWF and (b) OLR regressed onto ∇TT for AMJ from 1988 to 2009 (the regions enclosed by white contours are statistically significant at the 99% level based on a Student’s t-test).
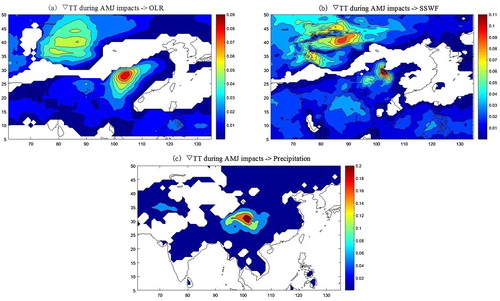
To further illustrate the importance of the AMJ ∇TT, we use the causality analysis introduced in Section 2 to estimate its impact on OLR, SSWF, and precipitation over the region of interest. This is a technique capable of quantitatively evaluating the cause-and-effect relation between any pair of time series, whether their dynamics are known or not. The results are plotted in , which show that ∇TT has a major impact on convection, shortwave radiation, and precipitation over the region under consideration. The impact on precipitation, in particular, has a remarkable pattern, with a single maximum over the Tibetan Plateau. Note that the results obtained here are strictly unidirectional (i.e., they are one-way causalities from ∇TT to OLR, SSWF, and precipitation), which cannot be obtained using the traditional correlation analysis.
Fig. 4 The causality (information flow) from ∇TT to (a) OLR (b) SSWF, and (c) precipitation for AMJ from 1988 to 2009. Units are nats d−1. The numbers are significant at the 95% level (those inside the white areas are insignificant).
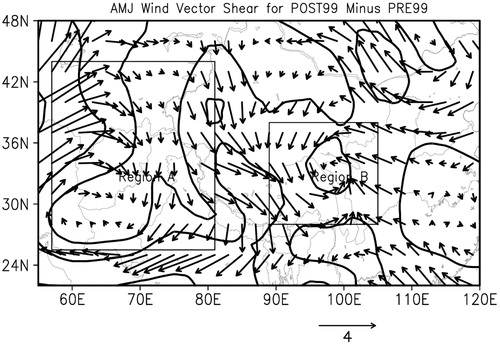
It is interesting to see how the circulation may change before and after 1999. For this purpose, we construct the AMJ horizontal wind shear (U200–U850 hPa) averaged for the PRE99 and POST99 periods, respectively, and then subtracted the former from the latter. The resulting difference field is drawn in . Again, this seems to be well correlated with the TT difference pattern (c). In particular, the closed loop circulation structures are clearly seen over regions A and B, with the one over region A being anticyclonic and the one over region B being cyclonic. This is in agreement with the thermal wind relation, which implies that, when facing downstream, warm air is on the right.
Fig. 5 The difference between the AMJ wind shear (m s−1) (POST99 minus PRE99). The regions enclosed by black contours are statistically significant at the 99% level based on a Student’s t-test.
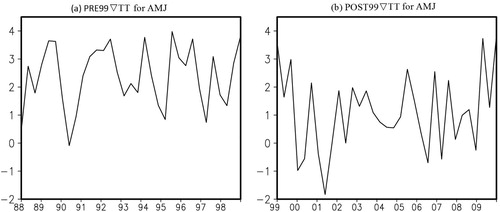
To see how the ∇TT index varies with time, the index series are drawn for the PRE99 period (mean 2.4, harmonic mean 5.6, minimum −0.1, maximum 3.97, and median 2.5) and POST99 peiod (mean 1.1, harmonic mean 0.1, minimum −1.8, maximum 3.8, and median 1.1) in a and b, respectively. Clearly, we see that the latter is significantly smaller than the former. This, from one aspect, reflects the recent abrupt change in the climate over Asia, as seen in the observations of Xiang et al. (Citation2013) and Chung and Li (Citation2013), among others.
Fig. 6 ∇TT (K) for the (a) PRE99 period and (b) POST99 period. The difference between (a) and (b) is significantly different from zero at the 99% level based on a Student's t-test.
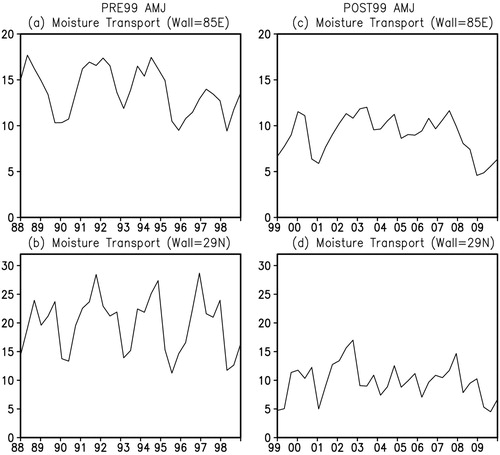
In the above, we have established that the dipole modal structure during the seasonal transition period (AMJ) is closely related to the circulation. It is natural to enquire about its relation to moisture transport, which is of primary importance to monsoon onset. The Tibetan Plateau, also called the Asian water tower, is one of the most important geographic features on Earth, affecting water sustainability for nearly 40% of the world's population (Dong, Zhao, & Zeng, Citation2007). The distribution and transport of moisture over the Tibetan Plateau is very important for water vapour budgets and hydrological cycles over Asia (e.g., Fekete, Vorosmarty, & Grabs, Citation1999; Xu et al., Citation2002). Anomalies in moisture transport over the Tibetan Plateau could significantly affect the frequency and intensity of floods or droughts in the vast majority of its downstream areas (i.e., the Yangtze and Yellow River basins, South China, and other countries in East and Southeast Asia; Bao, Yang, Liu, Wu, & Wang, Citation2010; Wang, Bao, Hoskins, Wu, & Liu, Citation2008). Despite the importance of the climate over East Asia, the moisture variability remains highly uncertain and poorly understood. Here, we choose a meridional wall at 85°E from 29° to 39°N and compute the vertically integrated zonal moisture flux across it. The longitude and latitude are chosen on the basis of the ∇TT shown in c, in the midst of the two dipole regions. The positive values of moisture flux across the meridional wall mean that moisture transport over the region is eastward. The results are plotted in a (mean 13.8, harmonic mean 13.3, minimum 9.4, maximum 17.7, and median 13.6) and c (mean 9.0, harmonic mean 8.4, minimum 4.6, maximum 12.0, and median 9.4). Interestingly, ∇TT is well correlated to the flux; particularly, larger (smaller) ∇TT during PRE99 (POST99) corresponds to larger (smaller) moisture transport between regions A and B. Likewise, we also set a zonal wall at 29°N from 75° to 95°E and compute the meridional moisture flux. A positive value indicates northward moisture transport. The results, as plotted in b (mean 19.7, harmonic mean 18.5, minimum 11.3, maximum 28.7, and median 21.2) and d (mean 9.8, harmonic mean 8.8, minimum 4.5, maximum 17.0, and median 9.9), also clearly display a substantial reduction in value after 1999. From the analysis, moisture transports over the region during PRE99 and POST99 are both southwesterly, but there is a reduction in magnitude after 1999, echoing the reduction in temperature gradient during POST99 ().
Fig. 7 Moisture flux (×108 kg s−1) across the meridional wall (at 85°E, from 29° to 39°N) for the (a) PRE99 period and (b) POST99 period. Moisture flux (×108 kg s−1) across the zonal wall (at 29°N, from 75° to 95°E) for the (c) PRE99 period and (d) POST99 period. In the left column, the time ends at June 1999, while in the right column, the time begins in April 1999. The moisture fluxes across the meridional wall and zonal wall are found to be statistically significant at the 99% level based on a Student's t-test.
Of course, correlation alone does not imply that ∇TT has indeed caused the reduction in moisture transport between regions A and B. Let us look at it from a dynamical point of view. Using the thermal wind relation, the geostrophic velocity difference between the two pressure levels 1000 and 400 hPa iswhere
is the temperature difference between two pressure levels, R is the universal gas constant, f is the Coriolis parameter, and
is the gradient operator on the pressure surface. That is to say, in the northern hemisphere, if we face downstream, warm air is on the right. The structure in c, therefore, implies a northerly wind anomaly (evident in ). Because a northerly wind blows from inland to the Indian Ocean, Asia must experience a reduction in moisture transport. From a dynamical aspect, this substantiates our previous claim.
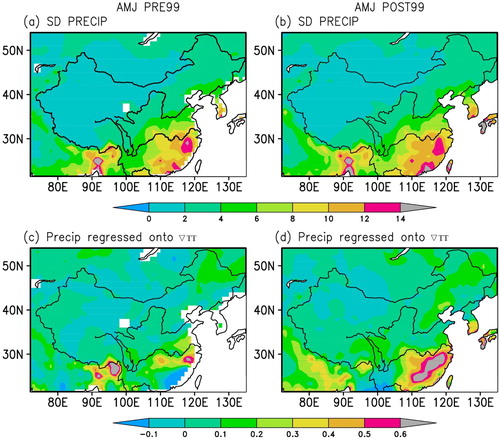
Because moisture is a basic element in the monsoon system, we speculate that ∇TT will play an important role in the precipitation (the basic factor which decides the economy of the region) variation during the monsoon period. Hence, we examine the relationship between ∇TT and precipitation variability. The standard deviations of precipitation variability for the PRE99 and POST99 periods are plotted in a and b. The general patterns are similar before and after 1999, but the change over the transition period differs from region to region. For the sake of comparison, we regressed the precipitation variability onto ∇TT (the regression coefficients are significant at the 99% confidence level), and the resulting structures are shown in c and d. Observe that the precipitation over the vast region can be well explained by ∇TT. Therefore, we are confident that the ∇TT is indeed related to precipitation variability during the AMJ monsoon season. Of course, a detailed study using an adequate global climate model (GCM) with TT forcing data would be necessary before a conclusive statement could be made. We leave this issue to future study.
Fig. 8 Standard deviation of the precipitation during AMJ for the (a) PRE99 period and (b) POST99 period. Precipitation variability regressed (statistically significant at the 99% level based on a Student’s t-test) onto ∇TT for the (c) PRE99 period and (d) POST99 period.
4 Concluding remarks
The difference between the POST99 and PRE99 TTs over East Asia reveals two closed centres, one over countries in Central Asia (Pakistan, Afghanistan, Uzbekistan, Turkmenistan, Kazakhstan, Kyrgyzstan, and Tajikistan) and the other over Tibet. This dipole structure is actually the mode of the recent climate variability over East Asia. We took the difference between the depth-averaged TT (averaged between 400 and 1000 hPa) at the centres of the two poles and created an index, ∇TT, which essentially gives the zonal gradient of the TT over the regions. This gradient is found to characterize the variabilities of not only the temperature field but also the circulation and other fields, such as the OLR. In particular, we found that it is consistent with the moisture transport between the poles. The ∇TT experienced an abrupt change late in the 1990s, and correspondingly the moisture transport also has the same trend.
It has been established that the current skill of most atmospheric GCMs is highly dependent on the dynamic and thermodynamic variability during the seasonal transition period (i.e., AMJ) because they form a compact, interpretable, and significant set of predictors for the summer monsoon (Cannon & McKendry, Citation1999; Krishna Kumar et al., Citation1995). A better understanding of the dynamics and thermodynamics during the period will certainly benefit current forecasts (Hastenrath & Greischar, Citation1993; Parthasarathy et al., Citation1988; Singh et al., Citation1995). In this study, we found that the ∇TT series contain much information that may be useful for this purpose though the relation between the abrupt change in ∇TT and phenomena, such as monsoon onset, is yet to be investigated in detail. The observed moisture transport reduction between regions A and B may also have direct implications for the Himalayan glaciers and snow packs and, in turn, the hydrological cycle over much of South Asia, which has received growing scientific attention during the past decade (e.g., Barnett, Adam, & Lettenmaier, Citation2005).
Acknowledgements
The authors wish to thank the editor-in-chief, associate editor, and four anonymous reviewers for their valuable comments and suggestions, which helped to improve the manuscript. Thanks also go to NASA, the APHRODITE team, Woods Hole Oceanographic Institutution, Objectively Analyzed Air–Sea Fluxes (OAFlux), and the NCEP-DOE AMIP II Reanalysis Version 2 team for providing the respective datasets. The figures were prepared using GrADS.
Disclosure statement
No potential conflict of interest was reported by the authors.
Additional information
Funding
References
- An, W., Hou, S., Hu, Y., & Wu, S. (2017). Delayed warming hiatus over the Tibetan Plateau. Earth and Space Science, 4, 128–137. doi: 10.1002/2016EA000179
- Bao, Q., Yang, J., Liu, J. M., Wu, G., & Wang, B. (2010). Roles of anomalous Tibetan Plateau warming on the severe 2008 winter storm in central-southern China. Monthly Weather Review, 138(6), 2375–2384. doi: 10.1175/2009MWR2950.1
- Barnett, T., Adam, J., & Lettenmaier, D. (2005). Potential impacts of a warming climate on water availability in snow-dominated regions. Nature, 438, 303–309. doi: 10.1038/nature04141
- Cannon, A. J., & McKendry, I. G. (1999). Forecasting all-India summer monsoon rainfall using regional circulation principal components: A comparison between neural network and multiple regression models. International Journal of Climatology, 19, 1561–1578. doi: 10.1002/(SICI)1097-0088(19991130)19:14<1561::AID-JOC434>3.0.CO;2-3
- Chen, T. C., & Chen, J. R. (1995). An observational study of the SCS monsoon during the 1979 summer: Onset and life-cycle. Monthly Weather Review, 123(8), 2295–2318. doi: 10.1175/1520-0493(1995)123<2295:AOSOTS>2.0.CO;2
- Cheng, H., Wu, T., & Dong, W. (2008). Thermal contrast between the middle-latitude Asian continent and adjacent ocean and its connection to the East Asian summer precipitation. Journal of Climate, 21, 4992–5007. doi: 10.1175/2008JCLI2047.1
- Chung, P. H., & Li, T. (2013). Interdecadal relationship between the mean state and El Niño types. Journal of Climate, 26(2), 361–379. doi: 10.1175/JCLI-D-12-00106.1
- Dong, H. P., Zhao, S. X., & Zeng, Q. C. (2007). A study of influencing systems and moisture budget in a heavy rainfall in low latitude plateau in China during early summer. Advances in Atmospheric Sciences, 24(3), 485–502. doi: 10.1007/s00376-007-0485-z
- Duan, A., Liu, Y., & Wu, G. (2005). Heating status of the Tibetan Plateau from April to June and rainfall and atmospheric circulation anomaly over East Asia in midsummer. Science in China Series D; Earth Sciences, 48(2), 250–257. doi: 10.1360/02yd0510
- Emanuel, K. (2010). Tropical cyclone activity downscaled from NOAA-CIRES reanalysis 1908-1958. Journal of Advances in Modeling Earth Systems, 2, 1–12. doi: 10.3894/JAMES.2010.2.1
- Emanuel, K., Solomon, S., Folini, D., Davis, S., & Cagnazzo, C. (2013). Influence of the tropical tropopause layer cooling on Atlantic hurricane activity. Journal of Climate, 26, 2288–2301. doi: 10.1175/JCLI-D-12-00242.1
- England, M. H., McGregor, S., Spence, P., Meehl, G. A., Timmermann, A., Cai, W. J., … Santoso, A. (2014). Recent intensification of wind-driven circulation in the Pacific and the ongoing warming hiatus. Nature Climate Change, 4, 222–227. doi: 10.1038/nclimate2106
- Fekete, B. M., Vorosmarty, C. J., & Grabs, W. (1999). Global composite runoff fields based on observed river discharge and simulated water balances. Technical Report No. 22, Koblenz: Global Runoff Data Center.
- Goswami, B. N., & Xavier, P. K. (2005). ENSO control on the south Asian monsoon through the length of the rainy season. Geophysical Research Letters, 32, L18717. doi: 10.1029/2005GL023216
- Hastenrath, S., & Greischar, L. (1993). Changing predictability of Indian monsoon rainfall anomalies? Proceedings of the Indian Academy of Sciences - Earth and Planetary Sciences, 102(1), 35–47.
- He, J. J., Ju, J. H., Wen, Z. P., Lu, J. M., & Jin, Q. H. (2007). A review of recent advances in research on Asian monsoon in China. Advances in Atmospheric Sciences, 24, 972–992. doi: 10.1007/s00376-007-0972-2
- Hirasawa, N., Kato, K., & Takeda, T. (1995). Abrupt change in the characteristics of the cloud zone in subtropical east Asia around the middle of May. Journal of the Meteorological Society of Japan. Ser. II, 73, 221–239. doi: 10.2151/jmsj1965.73.2_221
- Holton, J. R. (2004). An introduction to dynamic meteorology. Int. Geophys. Ser., vol. 88, 4th ed., Boston, Mass: Elsevier Academic Press.
- Kanamitsu, M., Ebisuzaki, W., Woollen, J., Yang, S. K., Hnilo, J. J., Fiorino, M., & Potter, G. L. (2002). NCEP-DOE AMIP-II reanalysis (R-2). Bulletin of the American Meteorological Society, 83, 1631–1643. doi: 10.1175/BAMS-83-11-1631
- Kosaka, Y., & Xie, S. P. (2013). Recent global-warming hiatus tied to equatorial Pacific surface cooling. Nature, 501, 403–407. doi: 10.1038/nature12534
- Krishna Kumar, K., Soman, M. K., & Rupa Kumar, K. (1995). Seasonal forecasting of Indian summer monsoon rainfall: A review. Weather, 50, 449–467. doi: 10.1002/j.1477-8696.1995.tb06071.x
- Liang, X. S. (2014). Unraveling the cause-effect relation between time series. Physical Review E, 90, 052150. doi: 10.1103/PhysRevE.90.052150
- Liang, X. S. (2015). Normalizing the causality between time series. Physical Review E, 92, 022126. doi: 10.1103/PhysRevE.92.022126
- Liang, X. S. (2016). Information flow and causality as rigorous notions ab initio. Physical Review E, 94, 052201. doi: 10.1103/PhysRevE.94.052201
- Liu, J., Wang, B., & Yang, J. (2008). Forced and internal modes of variability of the East Asian summer monsoon. Climate of the Past Discussions, 4, 645–666. doi: 10.5194/cpd-4-645-2008
- Lu, R., & Fu, Y. (2009). Summer climate variability in East Asia and the western North pacific and its mechanisms. Adv Earth Sci, 24, 123–131.
- Murakami, T., & Matsumoto, J. (1994). Summer monsoon over the Asian continent and western North Pacific. Journal of the Meteorological Society of Japan. Ser. II, 72, 719–745. doi: 10.2151/jmsj1965.72.5_719
- Park, H. S., Chiang, J. C. H., & Bordoni, S. (2012). The mechanical impact of the Tibetan Plateau on the seasonal evolution of the South Asian monsoon. Journal of Climate, 25(7), 2394–2407. doi: 10.1175/JCLI-D-11-00281.1
- Parthasarathy, B., Diaz, H. F., & Eischeid, J. K. (1988). Prediction of all-India summer monsoon rainfall with regional and large-scale parameters. Journal of Geophysical Research, 93(D5), 5341–5350. doi: 10.1029/JD093iD05p05341
- Parthasarathy, B., Rupakumar, K., & Sontakke, N. A. (1990). Surface and upper air temperatures over India in relation to monsoon rainfall. Theoretical and Applied Climatology, 42, 93–110. doi: 10.1007/BF00868216
- Randel, W. J., Shine, K. P., Austin, J., Barnett, J., Claud, C., Gillett, N. P., … Yoden, S. (2009). An update of observed stratospheric temperature trends. Journal of Geophysical Research, 114, D02107. doi: 10.1029/2008JD010421
- Rienecker, M. M., Suarez, M. J., Gelaro, R., Todling, R., Bacmeister, J., Liu, E., … Woollen, J. (2011). MERRA: NASA’s Modern-Era Retrospective Analysis for Research and Applications. Journal of Climate, 24, 3624–3648. doi: 10.1175/JCLI-D-11-00015.1
- Singh, D., Bhadram, C. V. V., & Mandal, G. S. (1995). New regression model for Indian summer monsoon rainfall. Meteorology and Atmospheric Physics, 55, 77–86. doi: 10.1007/BF01029603
- Trenberth, K. E., & Fasullo, J. T. (2013). An apparent hiatus in global warming? Earth's Future, 1, 19–32. doi: 10.1002/2013EF000165
- Vaid, B. H., & Liang, X. S. (2015). Tropospheric temperature gradient and its relation to the South and East Asian precipitation variability. Meteorology and Atmospheric Physics, 127(3), 579–585. doi: 10.1007/s00703-015-0385-1
- Vecchi, G. A., Fueglistaler, S., Held, I. M., Knutson, T. R., & Zhao, M. (2013). Impacts of atmospheric temperature trends on tropical cyclone activity. Journal of Climate, 26, 3877–3891. doi: 10.1175/JCLI-D-12-00503.1
- Wang, B., Bao, Q., Hoskins, B., Wu, G., & Liu, Y. (2008). Tibetan Plateau warming and precipitation changes in East Asia. Geophysical Research Letters, 35(14), L14702. doi: 10.1029/2008gl034330
- Watanabe, M., Shiogama, H., Tatebe, H., Hayashi, M., Ishii, M., & Kimoto, M. (2014). Contribution of natural decadal variability to global warming acceleration and hiatus. Nature Climate Change, 4, 893–897. doi: 10.1038/nclimate2355
- Webster, P. J. (1987). The elementary monsoon. In J. S. Fein, & P. L. Stephens (Eds.), Monsoons (pp. 3–32). New York: John Wiley.
- Wu, G., Yimin, L., Bian, H., Qing, B., Anmin, D., & Jin, F.-F. (2012). Thermal controls on the Asian summer monsoon. Scientific Reports, 2, 404. doi: 10.1038/srep00404
- Xavier, P. K., Marzin, C., & Goswami, B. N. (2007). An objective definition of the Indian summer monsoon season and a new perspective on the ENSO-monsoon relationship. Quarterly Journal of the Royal Meteorological Society, 133, 749–764. doi: 10.1002/qj.45
- Xiang, B., Wang, B., & Li, T. (2013). A new paradigm for the predominance of standing Central Pacific Warming after the late 1990s. Climate Dynamics, 41(2), 327–340. doi: 10.1007/s00382-012-1427-8
- Xu, X., Tao, S., Wang, J., Chen, L., Zhou, L., & Wang, X. (2002). The relationship between water vapor transport features of Tibetan Plateau-monsoon “large triangle” affecting region and drought-flood abnormality of China. Acta Meteor Sinica, 60, 257–266.
- Yatagai, A., Kamiguchi, K., Arakawa, O., Hamada, A., Yasutomi, N., & Kitoh, A. (2012). APHRODITE: Constructing a long-term daily gridded precipitation dataset for Asia based on a dense network of rain gauges. Bulletin of the American Meteorological Society, 93, 1401-1415. doi: 10.1175/BAMS-D-11-00122.1
- Ying, L., Shen, Z., & Piao, S. (2015). The recent hiatus in global warming of the land surface: Scale-dependent breakpoint occurrences in space and time. Geophysical Research Letters, 42, 6471–6478. doi: 10.1002/2015GL064884
- Yu, R., Wang, B., & Zhou, T. (2004). Tropospheric cooling and summer monsoon weakening trend over East Asia. Geophysical Research Letters, 31, L22212. doi: 10.1029/2004GL021270
- Yu, R., & Zhou, T. (2007). Seasonality and three-dimensional structure of the interdecadal change in East Asian monsoon. Journal of Climate, 20, 5344–5355. doi: 10.1175/2007JCLI1559.1
- Zhang, L., & Zhou, T. (2012). The interannual variability of summer upper-tropospheric temperature over East Asia. Journal of Climate, 25, 6539–6553. doi: 10.1175/JCLI-D-11-00583.1
- Zhou, T., Gong, D., Li, J., & Li, B. (2009). Detecting and understanding the multidecadal variability of the East Asian summer monsoon—recent progress and state of affairs. Meteorologische Zeitschrift, 18, 455–467. doi: 10.1127/0941-2948/2009/0396