
Abstract
Chatham Sound, a semi-enclosed inland sea located off northern British Columbia, is an important waterway due to many proposed industrial activities related to the Port of Prince Rupert, along with its high levels of marine productivity. The oceanographic forcing in Chatham Sound is complex due to a combination of large tides, seasonally strong winds, and large freshwater discharges. Although much oceanographic data have been collected over the past six decades, past studies of the oceanographic regime of the full Chatham Sound area have been very limited. Using these extensive forcing datasets, high-resolution three-dimensional numerical modelling using the Coastal Circulation model for Sediment transport was conducted to investigate the tidal and wind-driven currents in the stratified waters of Chatham Sound. The numerical study shows the progression of the river-dominated lower salinity near-surface waters being advected northward, especially on the eastern side of Chatham Sound, with more saline waters on the western side of the Sound, especially in areas of exchanges with the waters of Hecate Strait through side channels. These surface circulation results are in good agreement with the large-scale representation of the outer diffuse Skeena River plume as seen in high-resolution Landsat satellite imagery. The model was operated over a representative year with four seasonal model runs. Southern Chatham Sound was found to be dominated by large tidal currents. Seasonal variations of residual flow were also investigated. Significant correlation between non-tidal current speeds and Skeena River discharges was found in the Skeena River delta area and through narrow tidal channels in southern Chatham Sound. In other offshore areas, non-tidal currents were found to be constrained near the surface and driven mainly by winds.
Résumé
[Traduit par la rédaction] Le détroit de Chatham, une mer intérieure semi-fermée située au large du nord de la Colombie-Britannique, est un plan d’eau important en raison des nombreuses activités industrielles liées au port de Prince Rupert, ainsi que de la productivité marine élevée. Le forçage océanographique dans le détroit de Chatham reste complexe en raison d’une combinaison de grandes marées, de puissants vents saisonniers et de grands apports d’eau douce. Bien que de nombreuses données océanographiques aient été recueillies au cours des soixante dernières années, les études antérieures sur le régime océanographique de l’ensemble de la région du détroit de Chatham demeurent très limitées. À l’aide de ce vaste ensemble de données de forçage, nous avons réalisé une modélisation numérique tridimensionnelle à haute résolution à l’aide du modèle de circulation côtière et de transport de sédiments, afin d’étudier les courants de marée et de vent dans les eaux stratifiées du détroit de Chatham. L’étude numérique montre la progression de la salinité inférieure qu’engendre le fleuve dans les eaux situées près de la surface et qui se dirigent vers le nord, notamment du côté est du détroit de Chatham. De l’eau plus salée se trouve du côté ouest du détroit, en particulier dans les zones d’échange, par des chenaux latéraux, avec les eaux du détroit d’Hécate. Les résultats concernant la circulation de surface correspondent bien avec la représentation à grande échelle du panache au bord diffus du fleuve Skeena, comme le montre l’imagerie satellitaire Landsat à haute résolution. Nous avons exploité le modèle sur une année représentative selon les quatre saisons. Nous constatons que de forts courants de marée dominent le sud du détroit de Chatham. Nous avons aussi étudié les variations saisonnières du débit résiduel. Nous observons une corrélation significative entre la vitesse des courants non soumis à la marée et le débit du fleuve Skeena dans la région de son delta et dans les chenaux à marée étroits, dans le sud du détroit de Chatham. Dans d’autres zones au large des côtes, nous constatons que les courants non soumis à la marée sont confinés près de la surface et engendrés principalement par les vents.
1 Introduction
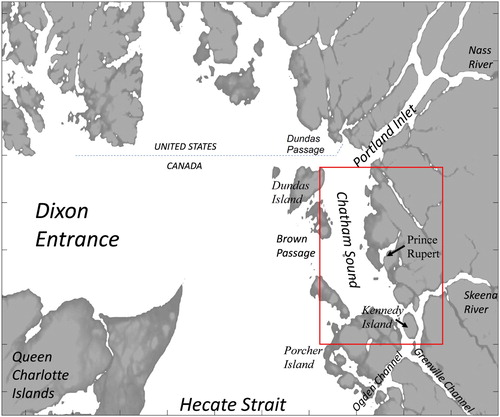
Chatham Sound is a semi-enclosed inland sea located off northern British Columbia, Canada (). Oceanographic research of this complex oceanic- and river-dominated inland waterway is being driven by industrial activities related to the expansion of the Port of Prince Rupert (), along with high levels of marine productivity in Chatham Sound. As also described in this section, previous studies of oceanographic processes over the full Chatham Sound area were reviewed and found to be very limited, with the last published paper on the oceanography of Chatham Sound dating back to the 1950s; however, much oceanographic data have been collected in Chatham Sound over the past six decades. In Section 2, it is shown that the oceanographic forcing in Chatham Sound is complex resulting from a combination of large tides, seasonally strong winds, and large freshwater discharges. The Skeena River, the largest river draining into the Pacific waters of northern British Columbia, provides the major source of fresh water into Chatham Sound in the southeast. These important forcing mechanisms are used to provide realistic inputs to a high-resolution three-dimensional (3D) numerical model developed for Chatham Sound, which is described in Section 3. In Section 4, this numerical model is used to examine the variability of the circulation in Chatham Sound at tidal and seasonal time scales, in particular, in relation to the forcing by tides, freshwater discharges, and winds.
Fig. 1 Location of Chatham Sound (marked by red box) based on gridded bathymetry data from GEBCO (Citation2014).
a Physical Setting
Chatham Sound is situated between Grenville Channel and the Skeena River delta to the south and the Canadian–US border to the north (). Chatham Sound spans a total distance of approximately 70 km from south to north and has a width of 15–25 km. On its east, Chatham Sound is bounded by the mainland coast of British Columbia (BC) and adjoining islands. On its western side, it is separated from the more exposed open waters of Dixon Entrance and Hecate Strait by several island groups, separated by channels or passages. Among them are the two largest and deepest passages: the eastward extension of Dixon Entrance to the north of Dundas Island and Brown Passage in central western Chatham Sound (). They are the most important channels allowing the exchange of currents and waves with the larger water bodies to the west. Exchanges between Chatham Sound and Grenville Channel and waterways to the south are limited by the narrow cross-sectional areas of these southern waterways and the shallow water depths in the vicinity of Porcher and Kennedy Islands ( and ).
Fig. 2 Map of water depths in Chatham Sound (metres below chart datum, CHS). Predicted water levels are located at sites () in red. Current meter sites (RUP2 and CP01S, see ) are marked as red dots. Wind stations (data presented in ) are in orange. Grey lines outline the model domain.
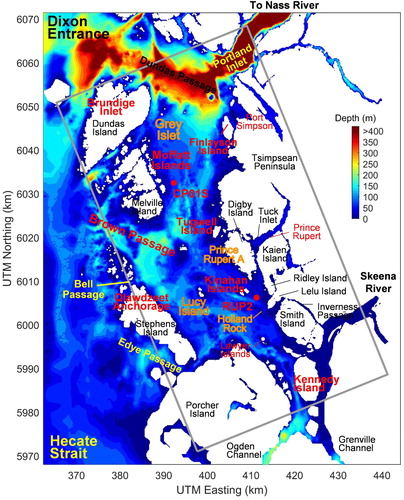
Table 1. Largest predicted tidal heights based on measured values in Chatham Sound.
Table 2. Current meter data used for model verification.
The water depth of Chatham Sound () is generally less than 200 m and is shallower in the south and deeper in the north (Canadian Hydrographic Service, Citation2017). However, much deeper water with depths of more than 600 m occur in the northeastern part of Chatham Sound at the entrance to Portland Inlet. Another major northern BC river, the Nass River, flows into Portland Inlet resulting in reduced salinities in the upper layer of this waterway. Water depths of less than 100 m are present over large areas of southern Chatham Sound and on the western side of northern Chatham Sound.
b Importance of Chatham Sound
Improved understanding of the marine physical environment of Chatham Sound is important to support expanding industrial activities in the region, especially in terms of minimizing environmental consequences. The Port of Prince Rupert, the eighth largest port in Canada and second largest port on Canada’s Pacific Coast (Statistics Canada, Citation2012), is the focus of major marine industrial activities in Chatham Sound. In recent years, the Port of Prince Rupert has considered several expansion projects including the ongoing expansion of the Fairview Container Terminal, the proposed Pacific Northwest liquefied natural gas (LNG) project, a Propane Export Terminal, a transload facility for exporting agricultural products, as well as other LNG projects (Port of Prince Rupert, Citation2016). Over the past decade, environmental assessments of many marine projects have been underway or have been completed, and these depend in part on developing an understanding of the circulation and water properties (temperature, salinity, and suspended sediments) in Chatham Sound.
The need for a better understanding of the physical oceanography is also related to the high level of phytoplankton concentrations in Chatham Sound (Lucas, Verrin, & Brown, Citation2007) attributed to high levels of tidal mixing (Clarke & Jamieson, Citation2006). Marine plants, including kelp beds and eelgrass, are abundant in parts of Chatham Sound. Marine invertebrates, including clams and molluscs, are also abundant; these are harvested by First Nations and for commercial purposes. Green sea urchins are abundant in the Port of Prince Rupert, and the area supports major Dungeness crab fishing grounds and diverse stocks of shrimp species (Clarke & Jamieson, Citation2006). Finfish harvests by First Nations and commercial fishers are also important in Chatham Sound. Skeena sockeye salmon are the most valuable commercial fish in the region, second only to the Fraser River within Canada in terms of overall abundance (Gottesfeld & Rabnett, Citation2007). Other fish are also harvested in Chatham Sound including other salmonid species, rockfish, and eulachon (Lucas et al., Citation2007). It is also an important area for herring spawning and larval rearing beds (Clarke & Jamieson, Citation2006), as well as an important habitat for marine mammals including humpback and killer whales, steller sea lions (Clarke & Jamieson, Citation2006; Lucas et al., Citation2007), and marine seabirds including Black- and White-winged Scoters (Clarke & Jamieson, Citation2006).
c Previous Oceanographic Studies
Despite the high importance of Chatham Sound for marine biology and industrial development activities, there has only been one study of the oceanography of the full Chatham Sound inland sea (Trites, Citation1956). The results of the Trites (Citation1956) study was derived from an analysis of many vessel-based, full water column surveys of temperature and salinity over the entire Chatham Sound area in 1948: 19–21 May, 8–18 June, and 8–10 September, as well as surveys of southern Chatham Sound on 25–28 May and of northern Chatham Sound on 1–6 June, 3–5 August, and 16–19 August. In addition, in July and August repeated measurements of temperature and salinity with depth were made at seven individual sites over periods ranging from 10 to 40 hours, and current observations were obtained at three of the sites. The key results from the Trites (Citation1956) study were that the pathways of fresh water from the Skeena River are highly dependent on the Skeena River discharge values. Under average discharges, about 70% of the freshwater discharge leaves the eastern side of central and northern Chatham Sound where it merges with Nass River fresh water and exits via Dixon Entrance. Only 30% of the fresh water leaves Chatham Sound through the southern and central passages, with half of this being by way of Brown and Bell Passages on the west (). During the late May and early June peak discharges (freshet) of the Skeena and Nass Rivers, the freshwater concentration is three to four times the average value, and it leaves the Sound via all the passages, with the greatest flux being through Dundas Passage. During freshet, Nass River water extends as far south as Melville Island. Because of the large tides in Chatham Sound, the salinity, temperature, and freshwater time series at fixed locations were observed to exhibit variability at tidal periods. During periods of unsteady river discharges, large cells of relatively fresh water are discharged into the Sound from the Skeena River; these are gradually dispersed under the influence of the large tides, winds, and the kinetic and potential energy of the freshwater flows themselves.
Although oceanographic studies of Chatham Sound are very limited, historical oceanographic measurements in Chatham Sound have been made for many decades, starting with tide gauge measurements for the Port of Prince Rupert in 1903 (Birch, Luscombe, Fissel, & Giovando, Citation1985). The first temperature and salinity datasets were obtained in the 1930s at lighthouse stations and from fisheries research vessels through Canadian government programs. From the late 1940s to the 1960s, oceanographic measurement activity expanded as a result of increased government activities under the Pacific Oceanographic Group of the Pacific Biological Station who surveyed large areas of northern BC waterways (Benson & Rehbock, Citation2002), as well as oceanographic studies of the inlets and fjords conducted by the Institute of Oceanography of the University of British Columbia (Pickard, Citation1956, Citation1961). Starting in the late 1960s and continuing to the present, oceanographic programs related to assessing the potential environmental effects of proposed industrial activities, have been conducted. Many of the proposed industrial activities involved development and expansion at the Port of Prince Rupert, potential sites for ocean dumping, as well as other activities (e.g., the pulp mill at Port Edward near Prince Rupert). Some 26 oceanographic programs were conducted from 1968 to 1984 (Birch et al., Citation1985), and in the past decade there has been a resurgence of oceanographic data collection related to proposed expansion activities at the Port of Prince Rupert. Conductivity, temperature, and depth (CTD) data and bottle data have been collected for the Department of Fisheries and Oceans (DFO) database for BC coastal waters, especially in 1982. Since 2013, a marine environmental monitoring of the full area of the Port of Prince Rupert has been conducted on a quarterly basis (Port of Prince Rupert, Citation2017). Even more recently, starting in 2016, Ocean Networks Canada has installed an extensive array of ocean measurement systems in the Prince Rupert area (Ocean Networks Canada, Citation2017) including continuous measurements of water properties (temperature, salinity, dissolved oxygen, and fluorescence) at two sites and high-frequency radar measurements of surface currents and ocean waves from two sites.
The circulation of the larger areas of the BC north coast, adjoining Chatham Sound, including Queen Charlotte Sound, Hecate Strait, and Dixon Entrance has been studied using numerical modelling methods, as well as using direct observations. Early measurements of temperature and salinity, including circulation features inferred from these data, are presented in Crean (Citation1967) and Dodimead (Citation1980). The major circulation features of the north coast of BC were identified from moored current meters, as well as drifting buoys, operated in the 1980s (Crawford, Huggett, Woodward, & Daniel, Citation1985, Citation1988, Citation1995; Crawford & Greisman, Citation1987). Hannah, LeBlond, Crawford, and Budgell (Citation1991) described the wind-driven, depth-averaged circulation in Queen Charlotte Sound and Hecate Strait. Ballantyne, Foreman, Crawford, and Jacques (Citation1996) used a 3D finite element model to compute the buoyancy-driven flows, as well as the barotropic tides of the north coast of BC. The tidal currents of the north coast of BC have also been modelled by Flather (Citation1987) for the northeast Pacific Ocean; Foreman, Henry, Walters, and Ballantyne (Citation1993) for the barotropic tide along the north coast of BC; Cummins and Oey (Citation1997) for the barotropic and baroclinic tides of the north coast of BC; and Foreman, Crawford, Cherniawsky, Henry, and Tarbotton (Citation2000) for assimilating satellite altimeter observations into a barotropic tidal model over the northeast Pacific Ocean. However, as part of large-scale regional modelling studies, Chatham Sound was included in the much larger BC north coast model domains but the circulation results for Chatham Sound were compromised by the poor spatial resolution in both the horizontal and vertical. More recently, Wu, Hannah, O’Flaherty-Sproul, and Thupaki (Citation2017) applied an unstructured grid ocean model, with element sizes varying from approximately 2 km in the outer waters to 30 m within the kelp forests, to examine the influences of kelp beds on tidal-only circulation along the north coast of BC.
In this numerical modelling study, a much higher spatial resolution 3D finite-difference numerical model, Coastal Circulation Model for Sediment transport (COCIRM-SED; e.g., Jiang, Fissel, & Topham, Citation2003; Jiang & Fissel, Citation2006; Jiang, Fissel, & Borg, Citation2008; Jiang & Fissel, Citation2010; Jiang & Fissel, Citation2012)), is developed and applied to derive the tidal and wind-driven currents in Chatham Sound.
2 Oceanographic regime: Forcing mechanisms
The major oceanographic forcing mechanisms in Chatham Sound are the large tides, the seasonally large winds, and the major freshwater inputs from the two major rivers, the Skeena and Nass, which discharge into the area. Of lesser importance is the exchange of water masses with the adjoining waterways of Grenville Channel () to the south, Hecate Strait to the west, and Dixon Entrance to the north. We provide detailed information on these major oceanographic forcing mechanisms, which are important to the numerical modelling studies that follow in terms of both the inputs provided to force the model and the approach to the modelling conducted in this study.
a Tides
Within the context of the much larger BC coastal waters (Thomson, Citation1981), tidal heights are highest in eastern Dixon Entrance adjoining Chatham Sound in comparison with other areas (Godin, Citation1980). Barotropic tidal modelling (Cummins & Oey, Citation1997) reveals that the largest tidal constituent, the semi-diurnal M2 constituent exceeds 1.8 m in amplitude in Chatham Sound and 1.2 m in western Dixon Entrance and Queen Charlotte Sound, while the largest diurnal constituent, K1, has amplitudes greater than 0.52 m in Chatham Sound and eastern Dixon Entrance and 0.46 m in Queen Charlotte Sound and 0.50 m in western Dixon Entrance. A baroclinic tidal model (Cummins & Oey, Citation1997) reveals that the largest baroclinic tidal currents occur in Dixon Entrance and the entrance to Queen Charlotte Sound and are much smaller in Hecate Strait.
Tides in the Port of Prince Rupert are mixed mainly semi-diurnal (two high and two low waters per lunar day) (Stucchi & Orr, Citation1993) with tidal heights for Prince Rupert reaching a peak value of 7.7 m and an average tidal range of 4.9 m. Storm surges can also occur in conjunction with episodic strong winds, especially in the more exposed areas of Chatham Sound.
Six water level datasets throughout Chatham Sound were compiled and analyzed (). The Prince Rupert and Port Simpson () tide gauges have provided water level data for most of the last century, with the data collection at Prince Rupert continuing to the present. The other four datasets were deployed for shorter measurement time-spans of approximately one month. Tidal analysis was performed on the water level datasets in order to compute the major tidal constituents for each set. The number of solved tidal constituents ranged from 28 to 36 for short observations (Lawyer Islands, Qlawdzeet Anchorage, Moffatt Islands, and Brundige Inlet) and up to 68 for Prince Rupert. These tidal constituents were used to construct a water level time series representing only the tidal variations of the water levels. The maximum predicted tidal water level heights for the measurement time-spans at these four stations ranged from 6.17 to 7.04 m ().
b Winds
The regional meteorology of the ocean waters of northern BC result from its location between the extensive network of mountainous islands between the larger and more exposed open water areas around the Queen Charlotte Islands (Dixon Entrance and Hecate Strait; ) to the semi-enclosed more sheltered waters of Chatham Sound that adjoin the mountainous terrain of the BC mainland. West of Chatham Sound, the Dixon Entrance and Hecate Strait waterways are dominated by the Pacific marine climate characterized by moderate air temperatures and intense storms in fall and winter (Crawford et al., Citation2007). The energy levels of the marine winds in Chatham Sound are smaller than the more exposed and open waters to the southwest. Nevertheless, the marine winds can reach high speeds, exceeding 30 m s−1 or 58 knots, especially in the fall and winter and are important for generating upper-layer currents and waves.
To the east of Chatham Sound, temperatures exhibit a greater range, reflecting the increased influence of a continental climate. The marine storm winds are generally abated by the mountainous terrain. In winter, strong Arctic outflow winds occur as a result of the presence of a cold and dry continental Arctic high pressure system, which episodically extends into the interior of BC. The high atmospheric pressures in the interior can result in strong, low-temperature winds that flow into the inland fjords (Crawford et al., Citation2007). Arctic outflows are associated with strong winds from the northeast, moderate to heavy snowfalls and squalls, and the potential for increased wave heights in these sheltered regions and reduced visibility from the snowfall and squall activity.
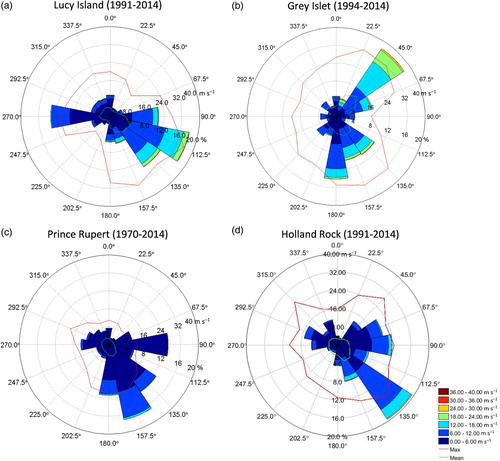
Wind speeds exhibit a distinct seasonal pattern with the highest wind speeds occurring in fall and winter and the lowest wind speeds in spring and summer. The largest measured wind speed in the area (35.6 m s−1) was observed at Lucy Island in central Chatham Sound although wind speeds at Lucy Island are generally at intermediate levels between the Prince Rupert Airport and Grey Islet observations. High wind speeds (maximum of 33.3 m s−1) are also observed in the north at Grey Islet. Winds speeds are also higher at the Environment and Climate Change Canada (ECCC) weather buoys in Dixon Entrance and North Hecate Strait.
The dominant wind directions in terms of frequency of occurrence and higher wind speeds are from the south to southeast at all locations (). However, at Grey Islet, winds also frequently occur from the northeast at high wind speeds; these winds are due to outflow from Portland Inlet, including strong Arctic outflow winds in winter.
Fig. 3 Compass rose plots for bivariate wind speed and direction distributions measured at (a) Lucy Island, (b) Grey Islet, (c) Prince Rupert Airport, and (d) Holland Rock. The wind datasets were obtained from the Meteorological Service of Canada, Environment and Climate Change Canada.
c River Discharges
Two major river systems discharge into the study area: the Skeena River into southern Chatham Sound and the Nass River into northern Chatham Sound via Nass Bay and Portland Inlet (). The Skeena River is the third largest river in BC (after the Columbia and Fraser Rivers) with an average annual discharge of 1760 m3 s−1 (Benke & Cushing, Citation2009). The annual fresh water discharged from the Skeena River represents about one-quarter of the total water volume of the semi-enclosed Chatham Sound, which is considerably larger than the one-tenth ratio of the Fraser River water discharge (112 km3; Cannings & Cannings, Citation1996) to the volume of the Strait of Georgia (1054 km3; Thomson, Citation1981; Benke & Cushing, Citation2009). The Strait of Georgia is a large semi-enclosed water body in southern BC.
Another large BC north coast river, the Nass River, discharges fresh water into Portland Inlet to the north, which is then advected into northern Chatham Sound and eastern Dixon Entrance (Fissel et al., Citation2017). Both the Skeena and Nass Rivers have their peak discharges or freshet in late May to early June due to snowmelt in the drainage area. During these freshet discharges, the concentration of fresh water in Chatham Sound is three to four times the annual average (Trites, Citation1956). As a result, the stratification of the ocean water column has a pronounced seasonal cycle with maximum stratification in late spring and summer and minimum stratification in winter and early spring.
The largest annual peak flows of the Skeena River, exceeding 3000 m3 s−1, occur from mid-May through June (). These peak annual discharges are a result of the melt of the winter snowpack in the drainage area augmented by rainfall events. The average discharge remains above 1000 m3 s−1 in July and decreases to levels of 800 m3 s−1 from August to mid-September. In early to mid-fall more frequent rainfall events lead to increased river discharges of about 1000 m3 s−1. By mid-November, as much of the precipitation turns from rain to snow, the discharges begin to decrease to much lower levels, typically 300 m3 s−1, through winter until they begin to rise again in mid-April. In the 81 years of Skeena River discharge measurements; there are only three years in which largest annual discharges occurred in the fall rather than in spring (De Groot, Citation2005).
Fig. 4 Daily discharge values of (a) the Skeena River measured at Usk and (b) the Nass River (derived from Water Survey of Canada datasets).
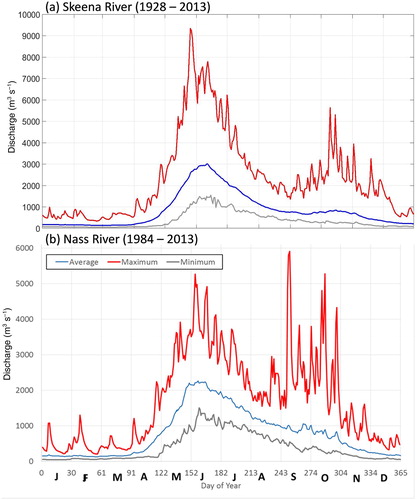
The Nass River discharge also affects Chatham Sound salinity, but its seasonal variability is very similar and highly correlated to Skeena River discharges, except during fall because of the higher precipitation (). The Nass River is 400 km long with an average annual discharge of 780 m3 s−1. During freshet in late May to early June, the peak annual discharge has typical values of 2200 m3 s−1. Its contribution to the regional oceanography is incorporated into the salinity datasets used in the modelling studies.
d Skeena River Plume in Chatham Sound
Suspended sediments in Chatham Sound due to natural processes originate from two primary mechanisms: the Skeena River discharge of fresh water combined with high concentrations of suspended sediments as the river enters southeastern Chatham Sound and the episodic resuspension of seabed sediments resulting from shear stress over the seabed due to large current and wave events. Once in suspension, the movement of suspended marine sediments is largely determined by currents driven by winds and tides and is influenced by river discharges. The suspended sediments gradually settle downward through the water column, with the rate of settling being largest for coarser sediments of larger particle size (e.g., sands) and lowest for the finer sediments of smaller particle size (i.e., silts and clays). Ultimately, the sediments of river or seabed resuspension origin are deposited onto the seabed in Chatham Sound.
The extent and spatial distribution of the surface expression of the sediment plume from the Skeena River was derived using historical 30 m resolution Landsat imagery (NASA, Citation2017; available on-line from the US Geological Survey at http://glovis.usgs.gov). An improved Landsat satellite, Landsat 8, became operational in 2012–2013. Overall, Landsat 8 has much better radiometric sensitivity than Landsat 7 and earlier satellites, which makes it more useful for water applications involving subtle signals, such as river plumes. One Landsat 8 scene, 28 August 2013 (Skeena River discharge of 665 m3 s−1, ebbing flow), was selected and enhanced (Fissel et al., Citation2017), as shown in () left panel. Even at these average Skeena River discharge levels, the satellite image scene reveals that the Skeena River plume is detectable along the eastern side of Chatham Sound into the northern half of Chatham Sound past Tugwell Island to the eastern waters off the Tsimpsean Peninsula (see ). However, commensurate with the relatively low discharges, the intense part of the Skeena River plume is confined to the southeastern part of Chatham Sound, near Smith Island with enhanced turbidity levels extending to the area as far north as the Kinahan Islands. For the comparatively low Skeena River discharges of early April ( right panel, flooding flow), the diffuse part of the Skeena River sediment plume is observed to extend north of Tugwell Island.
Fig. 5 Enhanced Landsat 8 satellite image for 28 August 2013 (left panel, ebb flow, 665 m3 s−1 river discharge) and 5 April 2015 (right panel, flood flow, 200 m3 s−1 river discharge) under low to moderate discharges from the Skeena River.
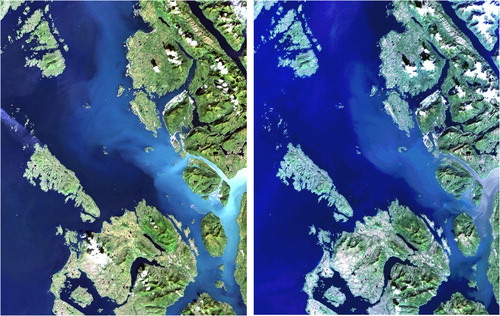
In summary, much of the surface area of the eastern half of Chatham Sound, from the southern end adjoining the Skeena River delta into the northern half of Chatham Sound appears to contain suspended Skeena River sediments at the surface. The largest levels of turbidity are in the southeast part of the Sound as far north as Ridley and Lelu Islands () along the east coast and offshore of the Kinahan Islands and at lower levels to the north.
High concentrations of suspended sediment occur in southeastern Chatham Sound including the nearshore areas of Ridley and Lelu Islands. The very turbid waters resulting from the Skeena River plume, especially during and after the Skeena River freshet, extend along the east coast of Chatham Sound past Smith Island into the coastal areas of Lelu and Ridley Islands as reported in nearshore ecological surveys (e.g., Ocean Ecology, Citation2009; Stantec, Citation2011) where the optical depth in the shallow waters is less than 1 m, roughly corresponding to turbidity levels of 25 NTU (Nephelometric Turbidity Unit) or more. In the more offshore waters further to the west, including Brown Passage, suspended sediment concentrations are much lower, as discussed below.
The delta of the Skeena River is unusual in that the oceanic basin receiving the sediment load is a complex of islands and channels. The delta is essentially “wrapped around” several islands, the largest of which are Kennedy and Smith islands, adjacent to the mainland (Conway, Bornhold, & Barrie, Citation1996). The River outflow is divided through three passages, with roughly one-quarter flowing through Inverness Passage () and the remainder divided equally between the passage to the west of Smith Island and the more southerly passage between Kennedy Island and the mainland.
Fine-grained sedimentation occurs over a wide area as a buoyant plume and is visible on air photos and satellite imagery (as discussed above), which is also supported by surficial sediment sampling off the seabed (Luternauer, Citation1976; McLaren, Citation2016). The delta front extends about 30 km from the vicinity of Ridley Island in the north to 12 km south of Kennedy Island (Luternauer, Citation1976; Conway et al., Citation1996).
e Seasonal Temperature-Salinity Profiles
The higher discharges of the Skeena River, especially from May through summer to fall, dominate the distribution of surface water properties in southern and central Chatham Sound during normal river conditions (Trites, Citation1956). Low salinity and high freshwater concentrations occur along eastern Chatham Sound in the south extending north to well beyond Digby Island (). The advection of Skeena River water into central and northern Chatham Sound results from the prevailing south to southeasterly winds that occur throughout the year. The tendency of Skeena River water to remain on the eastern side of the Sound results from the Coriolis effects associated with the rotation of the Earth.
To represent the variability of salinity both in time and space, historical CTD and bottle data from the DFO database (DFO, Citation2017) for BC coastal waters (from 183 sites as shown in ) were examined for the Chatham Sound domain. Each CTD and bottle site provided a vertical profile of temperature and salinity.
Fig. 6 Historical CTD and bottle data for BC coastal waters. Sites are grouped as southern (blue box), western (black box), and northern (red box) Chatham Sound. Data obtained in the earlier measurement period are from reversing bottle measurements, while most data in the latter period are obtained using CTD instruments.
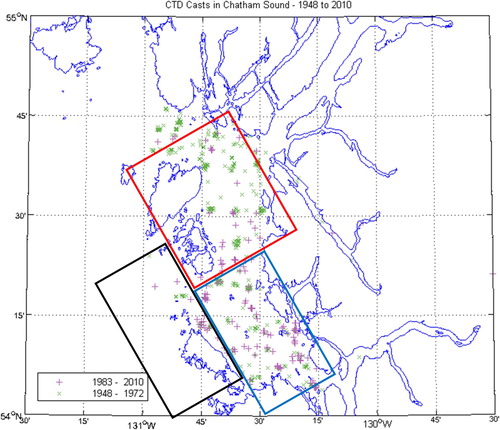
Data from CTD and bottle are separated into sub-areas of southern, western, and northern Chatham Sound as illustrated in (). Water properties are distinguished for the three sub-areas as presented in (). During the freshet season of Skeena River (i.e., June to August (summer)) southern Chatham Sound (a) features lower salinity and a wide temperature range from 6° to 15°C. During times of the year other than the freshet and summer seasons (winter: December to February, spring: March to May, and fall: September to November), southern Chatham Sound features higher surface salinity than during the freshet (summer) season. The salinity in the surface layer is lower than in the deep water. The surface water temperature range is small in seasons other than summer, from 7° to 8°C in winter, 6° to 7°C in spring, and 8° to 10°C in fall.
Fig. 7 Seasonal temperature and salinity plots based on CTD and bottle observations in (a) southern, (b) western, and (c) northern Chatham Sound as shown in .
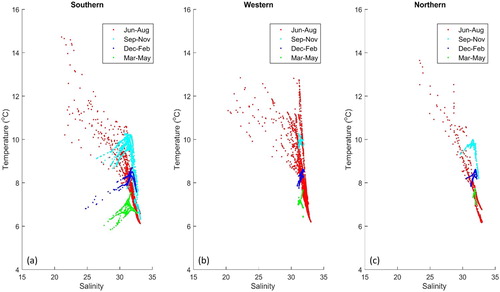
In western Chatham Sound (b), surface waters have lower temperatures than in southern Chatham Sound in summer. Western Chatham Sound exhibits higher salinity and temperature especially during seasons other than summer, which is indicative of the exchanges of water into Chatham Sound through Brown Passage in central Chatham Sound. The water column is mainly uniform in western Chatham Sound (which may also be affected by limited data availability).
As shown in (c) for the northern Chatham Sound area, the water temperature range is narrowed while the deeper water temperature range is similar to that of southern Chatham Sound, which is indicative of exchanges of water with Dixon Entrance to the north. The Nass River, which discharges fresh water into northern Chatham Sound through Portland Inlet, appears to have relatively less effect on salinity in Chatham Sound than it does in the Skeena River.
Regression analysis has been carried out to develop seasonal 3D salinity fields for modelling purposes. The CTD and bottle data sites are grouped into several discrete sub-areas (one for the western, three for the eastern coastal area, and five in the middle). At each sub-area (x,y) and depth (z), the salinity of each season (t) can be represented aswhere S is water salinity, R is Skeena River discharges; a and b are parameters derived from linear fitting of the observed CTD and bottle data in Chatham Sound.
3 Circulation modelling of Chatham Sound
The 3D COCIRM-SED model (Jiang et al., Citation2003, Citation2008; Jiang & Fissel, Citation2010, Citation2012) used in this numerical study represents a computational fluid dynamics, sediment transport, and water quality modelling approach for river, estuarine, and coastal applications. The model can explicitly simulate such natural forces as pressure heads, buoyancy or density differences due to temperature and salinity, river inflow, meteorological forcing, and bottom and shoreline drags. The model applies the fully 3D basic equations of motion and conservative mass transport, then solves for time-dependent, 3D velocities, temperature, salinity, turbulence kinetic energy and mixing length, horizontal and vertical diffusivities, and water surface elevation.
The model domain covers Chatham Sound and Brown Passage as shown in (). The model grid was generated using the Universal Transverse Mercator (UTM) coordinate system. The model was forced by tidal height elevations spanning three open boundaries, Skeena River and Nass River inputs, and surface winds. The salinity field is included in the hydrodynamic model. Temperature has a relatively smaller role in affecting the water density in this estuarine area so is not incorporated in the scope of the numerical study. The model results are used to study the hydrodynamics in Chatham Sound for the present study. They have also been used for the derivation of ocean current design criteria (such as for pipelines laid on the bottom within Chatham Sound; ISO, Citation2015), for the transport and fate of sediments released from marine construction activities, such as dredging, and for the selection of at-sea disposal sites in Chatham Sound.
a Model Setup
The COCIRM-SED model was implemented for Chatham Sound with forcing by winds and tides. The freshwater discharges of the Skeena River and the Nass River (via Nass Bay and Portland Inlet) are also represented in the model (). The model domain has a total length of 86 km and width of 47 km. In the horizontal, the model grid is 210 m by 210 m over the full domain. In the vertical, 18 z-coordinate layers are used, with emphasis on near-surface layers for better resolution of stratification. The vertical grid spacing varies from 2 m near the surface down to 50 m at 125 m depth. Below the depth of 200 m the vertical resolution is coarser than 100 m, and there is only one layer for depths greater than 400 m. Relatively coarse resolutions in the vertical below the depth of 100 m were used for deep areas which occur in only a small portion in the north (). The time step in the model was determined to be 80 s to preserve stability over the simulations. The Smagorinsky eddy parameterization (Smagorinsky, Citation1963) was used for horizontal diffusivity with coefficient C = 0.08. The background vertical diffusion and viscosity were set to 10−6 m2 s−1 with the Mellor–Yamada level 2.5 (MY2.5) turbulence closure (Mellor & Yamada, Citation1982). The bottom roughness parameter was set to 0.001 m with a constant value of 0.015 for the model bottom drag coefficient.
The bathymetric data for the model were derived from Canadian Hydrographic Service (CHS) nautical charts. The digital bathymetric dataset, in the format of UTM Easting, UTM Northing, and seabed elevation relative to chart datum, was gridded to provide suitable representation of the water depths in the model.
The three model open boundaries include Dundas Passage to the north, Brown Passage to the west, and the northward extensions of Ogden and Grenville Channels to the south ( and ). Water levels at open boundaries are reconstructed based on known tidal height constituents using Foreman’s tidal prediction program (Foreman, Citation1977). Tidal elevations at these three open boundaries were derived from seven major tidal height constituents obtained from the CHS (O1, P1, K1, N2, M2, S2, and K2) tidal analyses of water level observations obtained at locations in proximity to the model’s open boundaries. In the COCIRM-SED model, geostrophically balanced elevations due to the Coriolis force at each open boundary are calculated and superimposed on tidal components at every time step. The Skeena River and Nass River discharge data were obtained from the Canadian Hydrological Database, archived by ECCC.
At the surface, wind observations at Lucy Island and Grey Islet, as representative offshore sites for northern and southern Chatham Sound, were downloaded from ECCC and used to generate the surface stress forcing, using linear wind drag coefficients calculated as CD = 0.003 + 3.0 x 10⁻⁵ wind speed. Interpolation based on Inverse Distance Weighting (IDW) was used in the transition zones between these winds to seamlessly meld them together. A simple land effect weight function (decreased to two-thirds) was used for gridding the wind vectors over inland water channels to account for decreased wind speeds over water channels inland of Chatham Sound.
There are four separated seasonal model runs (December–February, March–May, June–August, and September–November), and each model run was initialized with temperature and salinity values derived from CTD data. Model runs start from a resting ocean with a spin-up period of three days. For the year-long analysis, model results are assembled using the four seasonal runs to which a linear interpolation is applied with a 10-day overlap as the transition period between connected seasons. The initial water properties (salinities) within the model domain and at the boundaries were derived using the approach described in Section 2 based on historical CTD and bottle data from the on-line DFO database for BC coastal waters.
b Model Verification
First the model was run for a 1.5 month period separately for summer 1993 () and winter 1991/92 () for model verification. Water levels produced by the model were compared with the predicted tidal elevation (PTE) derived from CHS tidal datasets at Moffatt Islands in northern Chatham Sound (see ). In southern Chatham Sound, model-generated water levels were compared with the PTE, as well as with observed water levels at the tidal gauge at Prince Rupert ().
Fig. 8 Model-generated water levels (MOD, blue solid lines) in the summer run (1993) at the two sites marked in , with comparisons to observational data (OBS, red dashed lines) from the predicted tidal elevations (PTE) derived from CHS tidal datasets and observed water levels at the Prince Rupert tidal gauge (TG). The water levels are plotted relative to chart datum (0).
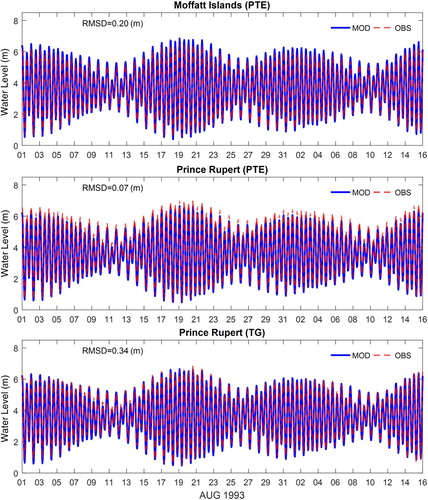
Fig. 9 Model-generated water levels (MOD, blue solid lines) in the winter run (1991/92) at the two sites marked in , with comparisons to observational data (OBS, red dashed lines) from the predicted tidal elevations (PTE) derived from CHS tidal datasets and observed water levels at the Prince Rupert tidal gauge (TG). The water levels are plotted relative to chart datum (0).
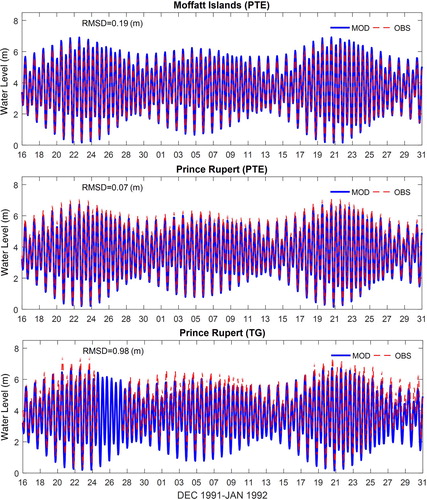
As shown in (), the model-generated water levels are in very good agreement with the PTE for the Moffatt Islands, with a root-mean-square difference (RMSD) of only 0.20 m, which is very small compared with the much larger RMSD of the full tidal elevations. The agreement between the model and the Prince Rupert PTE time series is even better, with an RMSD value of only 0.07 m. As to the observed water levels at the Prince Rupert tidal gauge, the RMSD value is somewhat larger at 0.34 m. This difference is still small compared with the full water level signal and, in part, is an indication that the model is constrained in its performance by the narrow inland passageway, relative to the model horizontal resolution, between Digby Island and the mainland leading to the waterfront area of the city of Prince Rupert.
Similar comparisons are presented in () for the winter of 1991/92 under the much larger winds of fall and winter. The comparison between the model and observations at Moffat Islands and Prince Rupert reveal very good agreement for the tidal heights (PTE) at nearly identical values to those for the summer of 1993 (). However, for the full water level signal at the tide gauge measurement site at the city of Prince Rupert, the differences are notably larger with an RMSD value of 0.98 m. In particular, the tide gauge observations reach notably larger water levels of 1 m or more at high tide. These larger differences are indicative of the model’s performance not being optimized at this location, especially for the subtidal response of water levels to the stronger winds at this time of year in the narrow inside passageways of the Port of Prince Rupert.
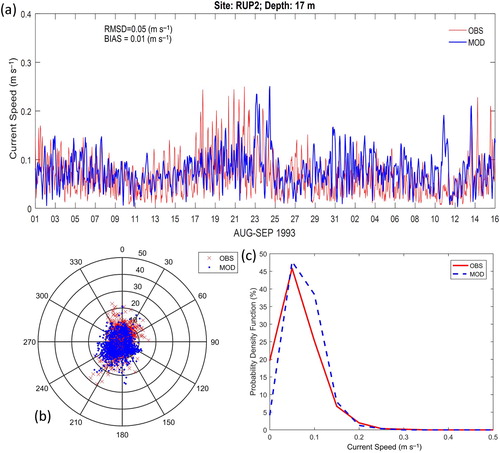
The circulation model was further verified using historical current meter measurements at DFO sites RUP2 and CP01S, as displayed in () and summarized in . The first verification case dealt with the 1.5-month summer period of August–September 1993. The hourly averaged results of modelled versus measured ocean current speed and direction for the near-surface observation depth of 17 m are compared in at the mooring site RUP2, off the west coast of Ridley Island (marked in ). This measurement site is more variable than other locations in southeastern Chatham Sound because of the proximity of the Kinahan Islands to the measurement location. However, generally good agreement is evident between the model and observed current speeds with small differences of 0.05 m s−1 RMSD in comparison with the total current speeds, as well as a bias difference of 0.01 m s−1 (slightly overestimated, a). The directional distributions of the model and observations both show a preference for the largest flows being aligned between southeast and southwest (b). The model also reproduced certain direction distributions of the north-northwest and northeast flow. The model results and observations have very similar current speed distributions (c). Both modelled and observed near-surface speeds occur mainly within the 0.05–0.15 m s−1 range. Both observations and model results demonstrate the dominance of tidal flows for the total currents in the southern Chatham Sound area.
Fig. 10 (a) Model-generated hourly averaged current speed in August–September 1993 (blue line) at a depth of 17 m at RUP2 marked in , with comparisons to observations (red line). (b) Model-generated current vectors (blue dots) are compared with observations (red crosses). The numbers on the outer ring represent current directions in degrees clockwise from true north while the row of numbers on the smaller to larger circles are current speeds (cm s−1). (c) Current speed histogram for model results (blue dashed line) and observations (red line).
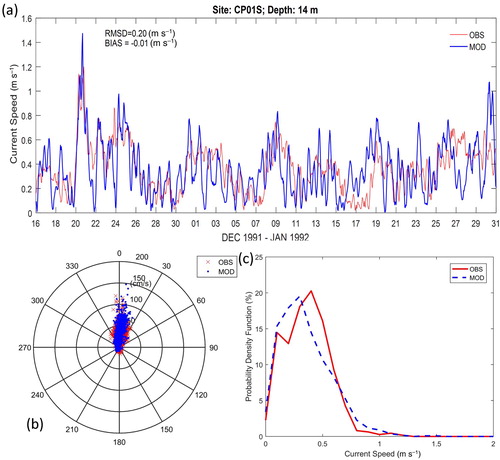
In northern Chatham Sound, the model was operated for a 1.5-month period from December 1991 to January 1992 and hourly averaged model results are compared with currents () observed at DFO site CP01S near Moffatt Islands (marked in ). The current speeds at 14 m depth during this period are very large, occasionally exceeding 1 m s−1 (a). Overall, the model results are in very good agreement with the observed ocean currents, as can be seen through differences of only 0.20 m s−1 in current speeds (RMSD) and a bias difference of -0.01 m s−1 (slightly underestimated). The primary direction of observed ocean currents is close to 0°, directed to the north, which is nearly parallel to the local bathymetry (b). The current speed distributions of model results and observations are very similar (c), occurring mainly within the 0.1–0.8 m s−1 range. It can be seen in both the model and observed currents that the subtidal currents, due to the episodic winds, play a much larger role than the tidal currents in this location compared with the more southerly location of ().
Fig. 11 (a) Model-generated hourly averaged current speed from December 1991 to January 1992 (blue line) at a depth of 14 m at CP01S marked in , with comparisons to observation (red line). (b) Model-generated current vectors (blue dots) are compared with observations (red crosses). The numbers on the outer ring represent current directions in degrees clockwise from true north, while the row of numbers on the smaller to larger circles are current speeds (cm s−1). (c) Current speed histogram for model results (blue dashed line) and observations (red line).
4 Variability of circulation in Chatham Sound
As indicated by the comparisons in Section 3, ocean circulation in the southern and northern Chatham Sound areas are affected differently by tidal and wind-driven flows. In this section, variability of the ocean currents, as influenced by tides, winds, and freshwater discharges (mainly for Skeena River) during different seasons, are further investigated.
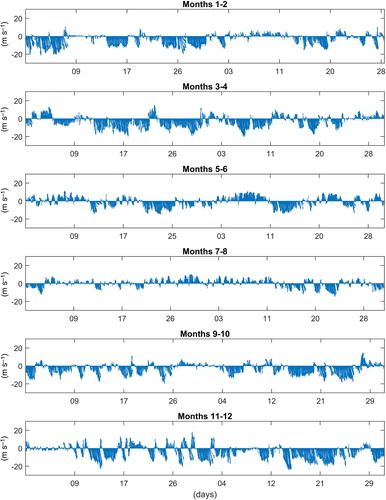
The Chatham Sound ocean circulation model was operated for a full year. The year was selected based on a review of recent 20-year records of wind data at Lucy Island and Grey Islet. Both data availability (i.e., missing records) and the 75% percentile values of wind speeds were considered, especially for the higher fall and winter winds. As a result, 2003 was selected as a reasonably representative year for marine winds with somewhat higher-than-average winds in the fall and winter (). The 2003 winds () follow a pronounced seasonal cycle with the highest winds blowing from the southeast in fall and winter, while the dominant winds in late spring through summer are from the northwest, albeit at moderate wind speeds by comparison with the fall and winter seasons.
Fig. 12 Hourly wind vectors (direction from) measured at Lucy Island in 2003.
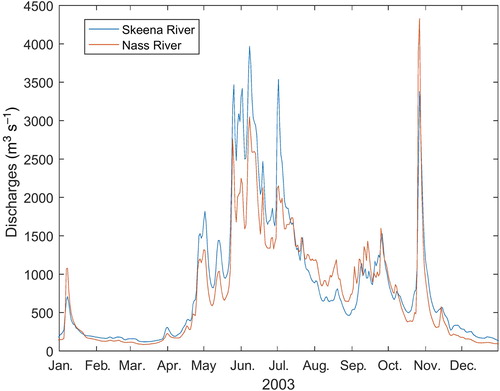
The 2003 Skeena River and Nass River discharges () were applied to the one-year model simulation. The discharge distribution during this year followed the seasonal patterns and flow ranges, with a peak value of about 4000 m3 s−1 for the Skeena River during the freshet season, which is only slightly larger than the multi-year mean values shown in . As shown in , more frequent rainfall events led to significantly increased river discharges in late October and early November 2003.
Fig. 13 Daily discharge values of the Skeena and Nass Rivers in 2003.
Hourly 3D current speed fields from the model were saved for analysis. Current speeds at surface, mid-depth, and near-bottom layers at each model grid were examined and analyzed. The middle layer is based on chart datum 0 m to the seabed so that it does not depend on tidal levels. It should be noted that the selection of the year is not sensitive to the study scope. The focus here is the variability of ocean current speeds, which vary from time scales of hours to the seasonal period. Interannual variability is not included in these numerical investigations.
a Tidal Currents
A tidal analysis was applied to the one-year simulation results for current speed fields, using Codiga’s Unified Tidal Analysis and Prediction program UTide (Codiga, Citation2011). This software is a suite of modern tidal analysis and prediction algorithms implemented in MATLAB and builds on the work of previous software packages, which include those from Foreman (Citation1977, Citation1978), Pawlowicz, Beardsley, and Lentz (Citation2002), Foreman, Cherniawsky, and Ballantyne (Citation2009), and Leffler and Jay (Citation2009). To complete the tidal analyses, UTide was run with ordinary least squares and linearized time for the nodal satellite correction. All other parameters were run at the default settings. Only the constituents that had a signal-to-noise ratio in excess of two and represented at least 0.1% of the fitted energy are presented.
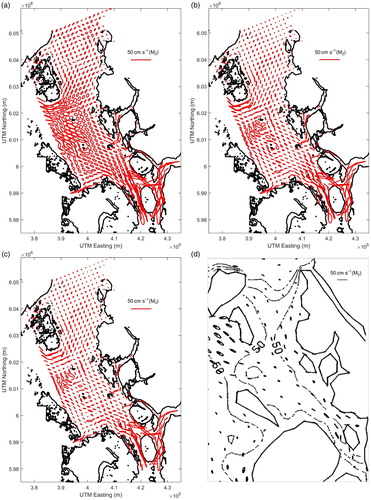
Because the M2 tidal constituent is dominant in this region (Foreman et al., Citation1993), the M2 tidal current ellipses derived from model results over Chatham Sound are illustrated for the near-surface, mid-depth, and near-bottom in a–c. For comparison, barotropic M2 ellipses adapted from Foreman et al. (Citation1993) based on a coarse-resolution model are shown in d.
In general, the model results for different layers demonstrate similar distribution features for M2 ellipses in Chatham Sound as discovered by Foreman et al. (Citation1993). In the Skeena River delta area, around Smith Island and Kennedy Island, the M2 semi-major axis magnitudes are relatively large. This increase is characterized as a uniform feature throughout the water columns as shown in a–c, indicating tidal current kinetic energy increases because of the topographic influence of the local narrow channels. Additional strong tidal currents are found through other narrow tidal channels, such as the one between Digby and Kaien Islands.
The semi-major axis magnitudes for the M2 tidal currents decrease with depth in the vertical from the surface to near-bottom layers, except for the shallow areas of southern Chatham Sound.
In the western part of Chatham Sound in Brown Passage, the M2 tidal currents are also large. Brown Passage is one of the two main channels allowing the exchange of water to Dixon Entrance and Hecate Strait. Thus, the large tidal currents in this area represent tidal flows from Hecate Strait (see Foreman et al., Citation1993).
The central area of Chatham Sound has relatively small surface tidal currents, as well as smaller surface flows in northern Chatham Sound shown in a. However, it is notable that there is a narrow pathway of strong M2 tidal flow in northern Chatham Sound, connecting mid-depth and deep flows from Brown Passage to Finlayson Island and Portland Inlet (see ), as shown in b and c. This feature also exists in Foreman et al. (Citation1993) although it is not as clearly resolved as in the higher resolution and baroclinic model results of the present study because of the significant baroclinic effects in the study region, which the barotropic model of Foreman et al. (Citation1993) could not reproduce.
In conclusion, tidal currents are strong in Chatham Sound, especially in the south and west areas and in an enhanced undersurface tidal flow in the deep corridor in northern Chatham Sound. Tidal currents for the surface flow in northern Chatham Sound are much weaker, as well as in broad shallow areas along the east coast zone off Dundas Island, Moffatt Islands, and Melville Island. The model results, in addition to the time series of current meter data collected at CP01S (marked in ), reveals the weak tidal variations shown in .
Fig. 14 M2 tidal ellipse plots (sub-sampled every seven model grids) of (a) surface (uppermost model layer), (b) mid-depth (middle model layer), and (c) near-bottom (deepest model layer) currents over Chatham Sound, during the one-year model simulation. (d) Barotropic M2 model current tidal ellipses adapted from in Foreman et al. (Citation1993). Contours are water depth (m).
b Variability of Residual Flow
In this section, current variability driven by dynamics other than tides is investigated. The residual flow for the analysis is obtained from model results by subtracting the tidal u and v components as described in Section 4.a.
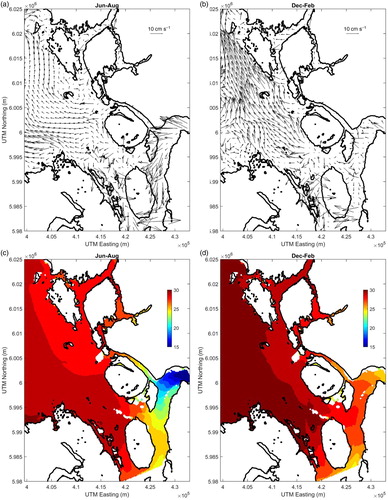
The temporally averaged total surface flow for late spring to mid-summer (June–August) and late fall to mid-winter (December–February) are shown in a and b. The outflow from the Skeena River is stronger in the summer associated with freshet discharges. In the main part of southern Chatham Sound, more distant from the Skeena River delta at Smith Island and northward, the surface flow is stronger during the winter because of the seasonally higher wind speeds. In the summer and winter, the seasonal mean total flow patterns have similar current directions (i.e., westerly outflow from the Skeena River) and flows generally to the northwest in southern Chatham Sound. The magnitude of the northwest surface flow is larger in winter because of the strong fall and winter winds blowing from the southeast () in contrast to summer conditions when winds are generally weak and include episodic winds blowing from the northwest. However, the much larger Skeena River discharge in early summer results in inertially driven northwestward surface flows in southern Chatham Sound. The larger Skeena River discharges, starting during the late May freshet and continuing through the summer months, are also evident in temporally averaged surface salinities for June–August (c). Surface salinities found on the eastern side of southern Chatham Sound are lower than those further to the west. This west-to-east gradient towards lower salinities is reduced in winter (December–February; d) because of the much-reduced discharges from the Skeena River.
Fig. 15 Temporally averaged total current vectors at the surface in (a) summer (June–August) and (b) winter (December–February) in southern Chatham Sound (sub-sampled every five model grids). Temporally averaged surface salinities for (c) June–August and (d) December–February.
After subtracting the annual mean and tidal flow from the total flow fields, the seasonal residual flow anomalies as shown in a and b. These represent the differences between the currents over the seasonal periods shown from the annual mean and tidal flow, rather than the absolute current fields. On the eastern side of southern Chatham Sound, the summer residual flow anomalies are directed from the northwest to the southeast, which is correlated with the summer seasonal wind patterns (; June–August) when winds blow from the northwest to the southeast episodically, albeit at lower wind speeds than the strong southeasterly winds of the fall and winter.
Fig. 16 Seasonal mean residual flow anomalies (annual mean values and tidal flow have been removed) at the surface in (a) summer (June–August) and (b) winter (December–February) in southern Chatham Sound (sub-sampled every five model grids). (c) Distribution of correlation coefficients between daily mean surface current speeds and wind speeds observed at Lucy Island. (d) Distribution of correlation coefficients between daily mean surface current speeds and Skeena River discharges measured at Usk (shifted 20 days later). Water depths (m) relative to chart datum are denoted by the numbered grey contours.
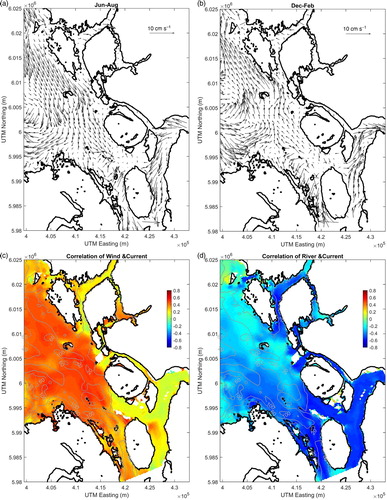
In the Skeena River delta area, deducting the annual mean and tidal flow reverses the direction of the winter flow anomalies (as indicated by upstream surface current anomalies in the Skeena River delta area to the east of Smith Island; b), which is associated with lower river discharges in the winter (numerically negative discharge variations).
c presents the distribution of correlation coefficients between daily residual current speeds and wind speeds for each model grid over the full annual cycle. Large positive correlation coefficients (>0.5), found on the eastern side of southern Chatham Sound, demonstrate that with stronger winds (i.e., in winter) the surface residual currents are also stronger. Large positive values of the correlation coefficient between residual current speeds and Lucy Island wind speeds were found to only occur near the surface. These large correlation coefficients are all above the 95% confidence interval.
Regression analysis was also conducted for daily mean surface residual current speeds over southern Chatham Sound, with Skeena River discharges measured separately at Usk. Skeena River discharges are shifted 20 days to reflect the optimal time lag before affecting the Chatham Sound area. The calculation of the correlation coefficients (d) is based on daily mean values over the one-year model simulation using the residual currents computed after detiding the model results. Large negative correlation coefficients (<-0.5) above the 95% confidence interval are present not only within the outer Skeena River delta in the vicinity of Smith and Kennedy Islands but also in the tidal channels along the southern coast of Chatham Sound, including Tuck Inlet and the Prince Rupert area. In these sub-areas, current variability is significantly affected by the Skeena River discharges. Negative correlation coefficients indicate that within the freshet period and in the early to mid-fall (more frequent rainfall events; see ), the residual surface flow anomalies in the Skeena River delta area are relatively weaker, while during the other seasons with lower freshwater discharges, the residual flow anomalies are stronger. This out-of-phase correlation between surface current anomalies and Skeena River discharges is believed to be associated with the presence and intensity of the convergence or divergence zone, and it may drive seasonal flow anomalies in the underlying deeper layer and/or laterally within this part of Chatham Sound. To fully understand this baroclinic effect caused by freshwater discharges, further numerical studies should be carried out.
One of the findings in the seasonal residual flow anomalies in a and b is that a convergent or zero surface horizontal flow zone is present in the summer and a divergent or zero surface horizontal flow zone occurs in the winter between the east coast of southern Chatham Sound off either side of Smith Island and between Smith Island and Kennedy Island. As indicated by c and d, this separation zone occurs between the currents affected by the Skeena River discharges and the east side of the southern Chatham Sound area, which is dominated by surface winds. The convergence zone in the summer and divergence zone in the winter are indicative of the seasonal baroclinic pattern changes that are illustrated in the schematic plots presented in . To ensure continuity of the flow transports, this seasonal anomaly would require an outflow (inflow) anomaly of surface waters from (to) the convergence (divergence) zone in summer (winter). The summer outflow anomaly may occur laterally towards the western side of southern Chatham Sound while the winter inflow anomaly may occur laterally from the western side of Chatham Sound into the separation zone, which would be consistent with the direction of the large-scale Ekman transport anomaly resulting from the seasonal wind patterns. However, the dynamics of these complex circulation features in southern Chatham Sound around the separation zone, particularly in relation to lateral and vertical transports, require further investigation to resolve.
Fig. 17 Schematic diagrams of two-layer flow anomalies in (a) the summer or freshet and (b) the winter or non-freshet season in southern Chatham Sound.
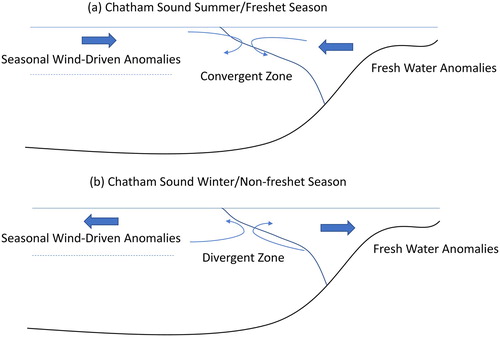
In summary, the seasonal flow variability is introduced by the different seasonal patterns of winds and freshwater discharges from the Skeena River. Surface winds and river discharges oppose each other but are balanced at the convergence/divergence zone for seasonal flow anomalies. This is related to the geographic features of Chatham Sound, which is a broad but shallow inland semi-enclosed sea with a large river influence (described in Section 1). Also, the Skeena River delta area around Smith and Kennedy Islands is sheltered by mountainous terrain from large-scale surface wind forcing. The low surface salinity values on the eastern side of southern Chatham Sound in June–August ( and Trites, Citation1956) result from the accumulation of Skeena River water at the surface due to the larger River discharges along with the summer wind patterns, which are generally weak with episodic northwest winds directed towards the Skeena River delta. In contrast, the large fall and winter winds advect the seasonally diminished Skeena River water discharges northward through Chatham Sound resulting in higher salinities, compared with summer conditions, in the upper layer of the eastern side of southern Chatham Sound.
c and d identify the dominant area of current anomalies affected by surface wind (area of large positive correlations in red shown in c) and river discharge (large negative correlations shown as the dark blue area in d), which can be relevant to developing an understanding of biophysical processes that could contribute to environmental assessments. The wind-dominated area is located mainly in the more central and northerly portions offshore from Chatham Sound. The southern and inshore coastal areas of Chatham Sound are mainly affected by river discharge variations including the Skeena River delta, in particular (Conway et al., Citation1996), and channels between islands, such as Tuck Inlet. The separation between the two forcing regimes is consistent with the convergence/divergence zone for seasonal flow anomalies found in a and b and illustrated schematically in .
It should be noted that if local winds are available (instead of Lucy Island winds) to better represent the topographically oriented surface winds, the very low correlation values over the Skeena River delta area, around Smith Island and Kennedy Island (shown in c) would be expected to increase to some extent.
Residual flows in northern Chatham Sound exhibit large variations constrained over the deep corridor area connecting Melville Island and Portland Inlet. Similar regression analyses have been carried out for daily mean surface current speeds over northern Chatham Sound, correlated to wind speeds observed at Lucy Island, as well as the Skeena River and Nass River discharges. No significant correlations have been found between residual flow and river discharges. The surface residual flow is mainly correlated with and dominated by surface winds, which is consistent with the variability exhibited in the current meter measurements at verification site CP01S in northern Chatham Sound (shown in ).
5 Summary and discussion
The ocean currents in Chatham Sound are highly variable due to a combination of forcing by wind, tides, and large freshwater discharges. The existing knowledge of oceanographic processes in Chatham Sound as a whole is still largely based on the pioneering work of Trites (Citation1952, Citation1956). However, since the study of Trites (Citation1956), there has been a considerable amount of oceanographic data collected for more local studies in Chatham Sound (Birch et al., Citation1985), and many field studies have been carried out over the past decade mostly around the Port of Prince Rupert, but there have not been any oceanographic studies published for the full area of Chatham Sound.
In this study, COCIRM-SED, a high-resolution 3D finite-difference model, was used to investigate tidal and wind-driven currents in Chatham Sound, supplemented with analysis of satellite imagery and historical oceanographic datasets. The model was verified using historical ocean current data collected by the Institute of Ocean Sciences, CHS, and DFO, at different locations and in different seasons. It has been shown that the model-simulated water levels and currents are in good agreement with observations.
The study shows the accumulation of lower salinity near-surface waters on the eastern side of southern Chatham Sound with more saline waters on the western side of the Sound especially in areas of exchanges through side channels with the waters of Hecate Strait. These surface circulation results are in good agreement with the large-scale representation of the outer diffuse Skeena River plume seen in high-resolution Landsat satellite imagery.
The model was operated for a representative year (2003) with four separate seasonal runs, and the hourly model results were analyzed to separate currents influenced by tides, winds, and river discharges. Chatham Sound is an area of very large tides compared with other areas of the BC coast, with tidal ranges reaching peak values of 7.7 m and an average tidal range of 4.9 m. Southern Chatham Sound was found to be dominated by tidal currents as shown by a tidal analysis using UTide tools (Codiga, Citation2011). Tidal currents are large in Chatham Sound, especially in the southern and western areas and in an enhanced undersurface tidal flow in the deep corridor in northern Chatham Sound. Tidal currents are much weaker for the surface flows in the deeper waters of northern Chatham Sound, as well as broad shallow areas along the east coast zones off Dundas Island, Moffatt Islands, and Melville Island. The model-derived weaker tidal currents in the northern and western portions of Chatham Sound are also exhibited in the current meter time series data collected at measurement site CP01S (see ).
Seasonal variations of residual flow were also investigated. Significant correlation between non-tidal current speeds and Skeena River discharges was found in the Skeena River delta area and through narrow tidal channels in southern Chatham Sound. In other offshore areas, detided residual currents were found to be constrained near the surface and driven mainly by winds. The seasonal flow variability is related to the different seasonal patterns of regional winds and Skeena River freshwater discharges. Surface winds and river discharges oppose each other at a convergence (divergence) zone for seasonal flow anomalies present in summer (winter) in the Skeena River delta portion of southern Chatham Sound. The knowledge gained about the circulation response to the dominant oceanographic forcing mechanisms in Chatham Sound can contribute to environmental assessment studies being conducted for proposed industrial developments in the area, mostly around the Port of Prince Rupert.
Further knowledge about the circulation of Chatham Sound could be gained by undertaking additional very high-resolution modelling studies using an unstructured grid, the Finite-volume Community Ocean Model (FVCOM; Chen et al., Citation2012). In addition, more work is needed to enhance the understanding of the ocean currents in the lower part of the water column, including the near-bottom currents, using high vertical resolution modelling (with sigma level vertical coordinates rather than the z-level coordinates of the present study).
Acknowledgements
We thank our colleagues at ASL: Keath Borg for help in using the UTide software, Jose Lim for examining Landsat 8 satellite images, and Ed Ross and Alex Slonimer for their contributions in analyzing the observational data.
Disclosure statement
No potential conflict of interest was reported by the author(s).
References
- Ballantyne, V. A., Foreman, M. G. G., Crawford, W. R., & Jacques, R. (1996). Three-dimensional model simulations for the north coast of British Columbia. Continental Shelf Research, 16(13), 1655–1682. doi: 10.1016/0278-4343(96)00006-4
- Benke, A. C., & Cushing, C. E. (2009). Field guide to rivers of North America (pp. 330–331, ISBN 978-0-12-378577-0). Burlington, MA: Academic Press.
- Benson, K. R., & Rehbock, P. F. (Eds.). (2002). Oceanographic history: The Pacific and beyond. Seattle: University of Washington Press.
- Birch, J. R., Luscombe, E. C., Fissel, D. B., & Giovando, L. F. (1985). West coast data inventory and appraisal. Vol. 1. Dixon Entrance, Hecate Strait, Queen Charlotte Sound and adjoining B.C. Coastal Waters: Physical oceanography temperature, salinity, currents, water levels and waves, 1903 through 1984. Canadian data reports of hydrography and Ocean Sciences 37. Dept. of Fisheries and Oceans, Ocean and science surveys, Ottawa, Canada. Part 1 and Part 2.
- Canadian Hydrographic Service. (2017). Nautical charts and services. Retrieved from http://www.charts.gc.ca
- Cannings, R., & Cannings, S. (1996). British Columbia: A natural history (p. 41). Vancouver: Greystone Books.
- Chen, C., Beardsley, R. C., Cowles, G., Qi, J., Lai, Z., Gao, G., … Lin, H. (2012). An unstructured-grid, Finite-volume Community Ocean model: FVCOM user manual. Sea Grant College Program, Massachusetts Institute of Technology. Retrieved from http://fvcom.smast.umassd.edu/wp-content/uploads/2013/11/MITSG_12-25.pdf
- Clarke, C. L., & Jamieson, G. S. (2006). Identification of ecologically and biologically significant areas in the Pacific North Coast Integrated Management Area: Phase II – final report. Canadian Technical Report of Fisheries and Aquatic Sciences 2686. Nanaimo, British Columbia: Fisheries and Oceans Canada.
- Codiga, D. L. (2011). Unified tidal analysis and prediction using the UTide Matlab functions (Technical Report 2011-01). Graduate School of Oceanography, University of Rhode Island, Narragansett, RI. Retrieved from ftp://www.po.gso.uri.edu/pub/downloads/codiga/pubs/2011Codiga-UTide-Report.pdf
- Conway, K. W., Bornhold, B. D., & Barrie, J. V. (1996). Surficial geology and sedimentary processes, Skeena River delta, British Columbia. In Current research:1996-E (pp. 23–32). Ottawa, Ontario: Available from Geological Survey of Canada, Natural Resources Canada.
- Crawford, W., Johannessen, D., Whitney, F., Birch, R., Borg, K., Fissel, D., & Vagle, S. (2007). Appendix C: Physical and chemical oceanography. In Lucas B. G., Verrin, S., & Brown, R. (Eds.), Ecosystem overview: Pacific North Coast Integrated Management Area (PNCIMA), Canadian Technical Report of Fisheries and Aquatic Sciences 2667. Sidney, British Columbia: Department of Fisheries and Oceans.
- Crawford, W. R., & Greisman, P. (1987). Investigation of permanent eddies in Dixon Entrance, British Columbia. Continental Shelf Research, 7, 851–870. doi: 10.1016/0278-4343(87)90002-1
- Crawford, W. R., Huggett, W. S., & Woodward, M. J. (1988). Water transport through Hecate Strait, British Columbia. Atmosphere-Ocean, 26(3), 301–320. doi: 10.1080/07055900.1988.9649305
- Crawford, W. R., Huggett, W. S., Woodward, M. J., & Daniel, P. (1985). Summer circulation of the waters in Queen Charlotte Sound. Atmosphere-Ocean, 23(4), 393–413. doi: 10.1080/07055900.1985.9649235
- Crawford, W. R., Woodward, M. J., Foreman, M. G. G., & Thomson, R. E. (1995). Oceanographic features of Hecate Strait and Queen Charlotte Sound in summer. Atmosphere-Ocean, 33(4), 639–681. doi: 10.1080/07055900.1995.9649549
- Crean, P. B. (1967). Physical oceanography of Dixon Entrance, British Columbia. Fisheries Research Board of Canada, Ottawa. Retrieved from http://www.dfo-mpo.gc.ca/Library/9972.pdf
- Cummins, P. F., & Oey, L. Y. (1997). Simulation of barotropic and baroclinic tides off northern British Columbia. Journal of Physical Oceanography, 27(5), 762–781. doi: 10.1175/1520-0485(1997)027<0762:SOBABT>2.0.CO;2
- De Groot, A. (2005). Review of the hydrology, geomorphology, ecology and management of the Skeena River floodplain. Prepared for Bulkley Valley Centre for Natural Resources Research & Management Smithers, BC by Drosera Ecological Consulting, Smithers BC. Retrieved from http://bvcentre.ca/files/research_reports/04-03SkeenaIslandsReview.pdf
- DFO. (2017). About the data archive. Retrieved from http://www.pac.dfo-mpo.gc.ca/science/oceans/data-donnees/index-eng.html
- Dodimead, A. J. (1980). A general review of the oceanography of the Queen Charlotte Sound-Hecate Strait-Dixon Entrance region (Canadian manuscript report of fisheries and aquatic sciences No. 1574). Department of Fisheries and Oceans.
- Fissel, D. B., Lin, A., Lim, J., Scoon, A., Lim, J., Brown, L., & Clouston, R. (2017). The variability of the sediment plume and ocean circulation features of the Nass River Estuary, British Columbia. Satellite Oceanography and Meteorology, 2(2), 316. doi: 10.18063/som.v2i2.316
- Flather, R. A. (1987). A tidal model of the northeast Pacific. Atmosphere-Ocean, 25(1), 22–45. doi: 10.1080/07055900.1987.9649262
- Foreman, M. G. G. (1977). Manual for tidal heights analysis and prediction (Pacific Marine Science Report 77-10), Institute of Ocean Sciences, Patricia Bay. Retrieved from http://www.dfo-mpo.gc.ca/Library/54866.pdf
- Foreman, M. G. G. (1978). Manual for tidal currents analysis and prediction (Pacific Marine Science Report 78-6), Institute of Ocean Sciences, Patricia Bay. Retrieved from http://www.pac.dfo-mpo.gc.ca/SCI/osap/publ/online/heights.pdf (Revised 2004)
- Foreman, M. G. G., Cherniawsky, J. Y., & Ballantyne, V. A. (2009). Versatile harmonic tidal analysis: Improvements and applications. Journal of Atmospheric and Oceanic Technology. 26, 806–817. doi:810.1175/2008JTECHO1615.1171 doi: 10.1175/2008JTECHO615.1
- Foreman, M. G. G., Crawford, W. R., Cherniawsky, J. Y., Henry, R. F., & Tarbotton, M. R. (2000). A high-resolution assimilating tidal model for the northeast Pacific Ocean. Journal of Geophysical Research: Oceans (1978–2012), 105(C12), 28629–28651. doi: 10.1029/1999JC000122
- Foreman, M. G. G., Henry, R. F., Walters, R. A., & Ballantyne, V. A. (1993). A finite element model for tides and resonance along the north coast of British Columbia. Journal of Geophysical Research: Oceans, 98(C2), 2509–2531. doi: 10.1029/92JC02470
- GEBCO. (2014). Gridded bathymetry data. Retrieved from the website of the British Oceanographic Data Centre: https://www.gebco.net/data_and_products/gridded_bathymetry_data
- Godin, G. (1980). Cotidal charts for Canada (Manuscript Report Series, 55), Ottawa, Canada: Marine Science and Information Directorate, Department of Fisheries and Oceans.
- Gottesfeld, A. S., & Rabnett, K. A. (2007). Skeena fish populations and their habitat. Retrieved from http://www.dfo-mpo.gc.ca/Library/327687.pdf
- Hannah, C. G., LeBlond, P. H., Crawford, W. R., & Budgell, W. P. (1991). Wind-driven depth-averaged circulation in Queen Charlotte Sound and Hecate Strait. Atmosphere-Ocean, 29(4), 712–736. doi: 10.1080/07055900.1991.9649427
- ISO (International Organization for Standardization). (2015). Petroleum and natural gas industries — Specific requirements for offshore structures — Part 1: Metocean design and operating considerations. ISO 19901-1:2015. Retrieved from https://www.iso.org/standard/60183.html
- Jiang, J., & Fissel, D. B. (2006). 3D hydrodynamic modeling of sediment dynamics on Roberts Bank Fraser River foreslope, Strait of Georgia, Canada. In M. L. Spaulding (Ed.), Estuarine and coastal modeling: Proceedings of the ninth international conference (pp. 806–823). Charleston, CA: American Society of Civil Engineers.
- Jiang, J., & Fissel, D. B. (2010). 3D hydrodynamic modeling of sediment dynamics on Roberts Bank Fraser River foreslope, Strait of Georgia, Canada. In M. L. Spaulding (Ed.), Estuarine and coastal modeling: Proceedings of the eleventh international conference (pp. 478–493). Seattle, WA: American Society of Civil Engineers.
- Jiang, J., & Fissel, D. B. (2012). Modeling sediment disposal in inshore waterways of British Columbia, Canada. In M.L. Spaulding (Ed.), Estuarine and coastal modeling: Proceedings of the twelfth international conference (pp. 392–414). St. Augustine, FL: American Society of Civil Engineers. doi:10.1061/9780784412411.00024.
- Jiang, J., Fissel, D. B., & Borg, K. (2008). Sediment plume and dispersion modeling of removal and installation of underwater electrical cables on Roberts Bank, Strait of Georgia, British Columbia, Canada. In M. L. Spaulding (Ed.), Estuarine and coastal modeling: Proceedings of the tenth international conference (pp. 1019–1034). Newport, RI: American Society of Civil Engineers.
- Jiang, J., Fissel, D. B., & Topham, D. (2003). 3D numerical modeling of circulations associated with a submerged buoyant jet in a shallow coastal environment. Estuarine, Coastal and Shelf Science, 58, 475–486. doi: 10.1016/S0272-7714(03)00114-8
- Leffler, K. E., & D. A. Jay. (2009). Enhancing tidal harmonic analysis: Robust (hybrid L-1/L-2) solutions. Continental Shelf Research. 29, 78–88. doi:10.1016/j.csr.2008.1004.1011 doi: 10.1016/j.csr.2008.04.011
- Lucas, B. G., Verrin, S., & Brown, R. (Eds). (2007). Ecosystem overview: Pacific North Coast Integrated Management Area (PNCIMA) (Canadian Technical Report of Fisheries and Aquatic Sciences 2667). Retrieved from http://www.pncima.org/media/documents/pdf/ecosystem-overview-pncima.pdf
- Luternauer, J. L. (1976). Fraser delta sedimentation, Vancouver, British Columbia. In Report of activities, Part B (Geological Survey of Canada, Paper no. 76-1B, pp. 169-171). doi:10.4095/104098.
- McLaren, P. (2016). The environmental implications of sediment transport in the waters of Prince Rupert, British Columbia, Canada: A comparison between kinematic and dynamic approaches. Journal of Coastal Research, 319(3), 465–482. doi: 10.2112/JCOASTRES-D-15-00134.1
- Mellor, G. L., & Yamada, T. (1982). Development of a turbulence closure model for geographical fluid problems. Review of Geophysics, 20(4), 851–875. doi: 10.1029/RG020i004p00851
- NASA. (2017). Landsat. Retrieved from https://www.nasa.gov/mission_pages/landsat/main/index.html
- Ocean Ecology. (2009). Flora bank eelgrass survey. Prince Rupert, BC: Ocean Ecology.
- Ocean Networks Canada. (2017). Observatories: Prince Rupert. Retrieved from http://www.oceannetworks.ca/observatories/pacific/prince-rupert
- Pawlowicz, R., Beardsley, B., & Lentz, S. (2002). Classical tidal harmonic analysis including error estimates in MATLAB using T-TIDE. Computers & Geosciences, 28, 929–937. doi: 10.1016/S0098-3004(02)00013-4
- Pickard, G. L. (1956). Physical features of British Columbia inlets. Trans. Roy. Soc. Canada, Ser. III, 50, 47–58.
- Pickard, G. L. (1961). Oceanographic features of inlets in the British Columbia mainland coast. Journal of the Fisheries Research Board of Canada, 18(6), 907–999. doi: 10.1139/f61-062
- Port of Prince Rupert. (2016). Future growth. Retrieved from http://www.rupertport.com/future
- Port of Prince Rupert. (2017). Water quality: Preserving the integrity of our marine environment. Retrieved from http://www.rupertport.com/port-authority/sustainability/water-sampling
- Smagorinsky, J. (1963). General circulation experiments with the primitive equations: I. The basic experiment. Monthly Weather Review, 91, 99–164. doi: 10.1175/1520-0493(1963)091<0099:GCEWTP>2.3.CO;2
- Stantec. (2011). CANPOTEX potash export terminal and Ridley Island road, rail, and utility corridor. Aquatic Environment Technical Data Report. Burnaby, BC: Stantec. Retrieved from http://www.ceaa.gc.ca/050/documents/53478/53478E.pdf
- Statistics Canada. (2012). Shipping in Canada, 2011. Retrieved from http://www.statcan.gc.ca/pub/54-205-x/54-205-x2011000-eng.pdf
- Stucchi, D. J., & Orr, U. (1993). Circulation and water property study of Prince Rupert Harbour, summer 1992. Canadian Technical Report on Hydrography and Ocean Sciences (No. 154). Ottawa, ON: Dept. of Fisheries and Oceans.
- Thomson, R. E. (1981). Oceanography of the British Columbia coast. Canadian Special Publication of Fisheries and Aquatic Sciences (56). Ottawa, ON: Fisheries and Oceans Canada.
- Trites, R. W. (1952). The oceanography of Chatham Sound, British Columbia (M.A. thesis). University of British Columbia, Vancouver, BC, Canada. Retrieved from https://open.library.ubc.ca/cIRcle/collections/ubctheses/831/items/1.0085414
- Trites, R. W. (1956). The oceanography of Chatham Sound, British Columbia. Journal of the Fisheries Research Board of Canada, 13(3), 385–434. doi: 10.1139/f56-026
- Wu, Y., Hannah, C. G., O’Flaherty-Sproul, M., & Thupaki, P. (2017). Representing kelp forests in a tidal circulation model. Journal of Marine Systems, 169, 73–86. doi: 10.1016/j.jmarsys.2016.12.007