
ABSTRACT
In the past decade, floating macroalgae blooms have been increasing on a global scale. Sub-pixel coverage of floating macroalgae in a remote-sensing image is a crucial parameter for the estimation of biomass. In this study, in situ spectra of green macroalgae (Ulva prolifera), brown macroalgae (Sargassum horneri), and sea water were collected, and they were used to simulate the spectra of macroalgae–seawater mixtures in a linear mixing way. Three algae indices, normalized difference of vegetation index (NDVI), difference of vegetation index (DVI), and virtual-baseline reflectance height for floating algae (VB-FAH) derived from the spectra, were examined with the coverage of macroalgae. The results show that all three indices increase monotonically with increasing sub-pixel coverage of macroalgae: VB-FAH and DVI increase linearly, while NDVI shows a logarithmic increase. Based on this characteristic, two sub-pixel coverage models were proposed (i.e., a linear model based on VB-FAH (or DVI) and an exponential model based on NDVI). These models were then applied to the multiple-spectral GaoFen-1 (GF-1, 16 m resolution) satellite image to examine the sub-pixel coverage of green tide in the Yellow Sea caused by the bloom of floating green macroalgae (U. prolifera). The results show that the relative differences between the two models are no more than 5%, indicating good consistency between the two models. Taking into account the sensitivity of these models (or indices) to the coverage of macroalgae, as well as atmospheric and sea surface conditions and their simplicity, we suggest using the linear model based on VB-FAH, DVI, or a similar band-difference index to estimate sub-pixel coverage of floating macroalgae.
Résumé
[Traduit par la rédaction] Ces dix dernières années, la prolifération d’algues macroscopiques flottantes a augmenté à l’échelle mondiale. L’étendue des macroalgues flottantes inférieure au pixel dans une image de télédétection s’avère un paramètre essentiel à l’estimation de la biomasse. Dans cette étude, les spectres de macroalgues vertes (Ulva prolifera), de macroalgues brunes (Sargassum horneri) et d’eau de mer ont été recueillis in situ. Nous les utilisons pour simuler les spectres de macroalgues et d’eau de mer mélangés linéairement. Nous examinons ici, avec l’étendue des macroalgues, l’indice de végétation par différence normalisée (NDVI), l’indice de végétation par différence (DVI) et la hauteur de la réflectance de référence virtuelle des algues flottantes, que nous dérivons des spectres. Les résultats montrent que les trois indices augmentent de façon monotone avec l’augmentation de l’étendue des macroalgues inférieure au pixel : la hauteur de réflectance et le DVI augmentent linéairement, tandis que le NDVI suit une augmentation logarithmique. Sur la base de cette caractéristique, nous proposons deux modèles d’étendue sous-pixel, soit un modèle linéaire fondé sur la hauteur de réflectance (ou sur le DVI) ou un modèle exponentiel fondé sur le NDVI. Nous appliquons ensuite ces modèles à l’imagerie satellitaire multispectrale issue de GaoFen-1 (GF-1, résolution de 16 m) afin d’examiner pour la mer Jaune l’étendue sous-pixel de la marée verte que cause la prolifération de macroalgues vertes flottantes (U. prolifera). Les résultats montrent que les différences relatives entre les deux modèles ne dépassent pas 5%, ce qui indique une bonne cohérence entre ceux-ci. En tenant compte de la sensibilité de ces modèles (ou indices) à l’étendue des macroalgues, ainsi que des conditions atmosphériques et de la surface de la mer, et de leur simplicité, nous suggérons d’utilizer le modèle linéaire fondé sur la hauteur de réflectance, le DVI ou un indice de différence de bande similaire pour estimer l’étendue des macroalgues flottantes inférieure au pixel.
1 Introduction
The marine ecological phenomena caused by macroalgae blooms have been increasing all over the world during the last decade (Smetacek & Zingone, Citation2013), bringing increasing concern about resultant impacts on the marine ecosystem and human activities (Hu et al., Citation2016; Lyons et al., Citation2014; Xing, Hu, et al., Citation2015). The green tide caused by an Ulva prolifera bloom in the Yellow Sea was the world’s largest macroalgae bloom event since 2007 (Liu, Keesing, Xing, & Shi, Citation2009; Qi, Hu, Xing, & Shang, Citation2016; Xing, Tosi, Braga, Gao, & Gao, Citation2015). Expansion of floating Sargassum blooms were observed in the Gulf of Mexico and the Atlantic Ocean (Gower, Young, & King, Citation2013). In recent years, floating S. horneri off the Chinese coast also increased significantly (Mizuno et al., Citation2014; Qi, Hu, Wang, Shang, & Wilson, Citation2017; Xing et al., Citation2017; Xing & Hu, Citation2016). These macroalgae blooms exerted adverse influences on the economy at local to regional scales, as well as on the environment (Hu et al., Citation2016; Xing, Hu, et al., Citation2015).
Because of the large expansion of floating macroalgae on the sea surface, remote detection by satellite is the most effective way of identifying and assessing macroalgae distributions. The floating macroalgae on the water surface could change the surface roughness. Therefore, microwave remote sensing, which is able to measure sea surface roughness under all weather conditions, can be used to monitor floating macroalgae (Jiang et al., Citation2009; Shen, Perrie, Liu, & He, Citation2014). However, microwave remote sensing cannot identify small patches, especially under rough sea surface conditions. Similar to floating oil slicks on the sea surface (Xing, Li, et al., Citation2015), macroalgae have different thermal emissivities from sea water. As a result, thermal infrared remote sensing can be employed for its identification. The limitation being that the thermal infrared technique is sensitive to clouds and water vapour. In addition, macroalgae pixels with a high portion of sea water do not have a strong thermal infrared signal, thus decreasing the chance of detection from thermal infrared images. Compared with the above-mentioned methods, optical remote sensing is the most common way of monitoring floating macroalgae. The spectral characteristics of macroalgae are similar to those for leaves of higher-order plants. Some remote-sensing algorithms for terrestrial vegetation can also be applied to the identification of macroalgae, such as the widely used normalized difference vegetation index (NDVI; Cui et al., Citation2012; Xing et al., Citation2011). The NDVI has limitations under certain circumstances, such as a high sensitivity to aerosols and sun glitter on the sea surface. To overcome such limitations, new algorithms were proposed, for example the floating algae index (FAI; Hu, Citation2009; Wang & Hu, Citation2016; Xu, Zhang, Cheng, Zhang, & Zhang, Citation2016) and the virtual-baseline reflectance height for floating algae (VB-FAH; Xing & Hu, Citation2016).
So far, most of the satellite remote sensing work on floating macroalgae has been to detect and identify macroalgae patches in the images. There are two main quantitative measures: the area impacted by macroalgae blooms and the number of pixels containing macroalgae. The size of macroalgae patches can vary from several centimetres to several kilometres; thus, pixel-mixing is common for most remote-sensing images containing floating macroalgae. So, the first step in using remote sensing to estimate the biomass of floating macroalgae is to measure the sub-pixel macroalgae coverage pixel by pixel. Li et al. (Citation2018) showed that this linear mixing method is feasible for simulating the spectrum-mixing hehaviour between sea water and floating macroalgae. Ding et al. (Citation2015) used satellite images to investigate the effect of sub-pixel macroalgae coverage on the estimation of the area of a green tide based on the NDVI index. Qi et al. (Citation2016) proposed a linear mixing method for the estimation of sub-pixel coverage using in situ measured spectra and the FAI index. Further studies need to be done to explore whether these methods produce consistent results.
In this study, the in situ measured reflectance spectra of floating macroalgae and sea water served as an endmember for spectra-mixing simulations, and the responses of existing algae indices (VB-FAH, DVI, and NDVI) to the sea surface coverage of macroalgae were modelled and analyzed. Then, the corresponding models for the estimation of sub-pixel macroalgae coverage were proposed and examined using satellite images.
2 Data and methods
a Collection of Endmember Reflectance Spectra
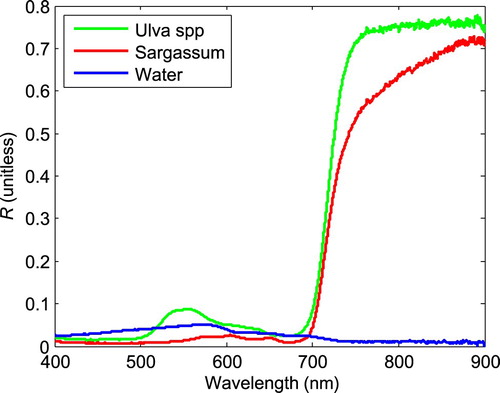
The reflectance spectra of sea water and macroalgae, including S. horneri and U. prolifera, were measured over the coastal waters of Shandong Peninsula from May to July 2016. The floating macroalgae rafts were collected and confined to a smaller area to ensure that the viewing field of the optical probe was free of the water surface. A portable spectroradiometer (USB4000) produced by Ocean Optics was used for field reflectance measurements. It has a spectral range of 345.30–1046.12 nm with an average spectral resolution of 0.2 nm. For the measurements, the viewing field of the fibre optic probe was set to 10°; the fibre optic probe was positioned to look down on the targets from a height of 1 m; and the radiance spectra of the macroalgae, seawater, and a calibrated reference plate were measured. Then, the reflectance (R, dimensionless) was calculated as the ratio of the target radiance spectra to the plate radiance spectra divided by the calibrated plate reflectance (Xing & Hu, Citation2016; Xing, Lou, Chen, & Shi, Citation2013). The reflectance spectra of the three endmember targets are shown in .
Fig. 1 In situ measured reflectance of macroalgae (U. prolifera and S. horneri) and sea water.
b Spectral-Mixing Experiments
The full range of the sub-pixel portion of macroalgae (POM, 0%–100%) was divided into 250 levels with an interval of 0.4%. The mixed reflectance spectra (Rmx) were obtained by the linear combination of different portions of macroalgae reflectance (Rma) and seawater reflectance (Rsw) (i.e., Rmx(λ) = POM Rma(λ)+ (1−POM) Rsw(λ), where λ is the wavelength). The mixed spectra were then re-sampled using the arithmetic average according to the band settings of the HuanJing-1 charge-coupled device (HJ-1 CCD) and the GaoFen-1 wide view field (GF-1 WVF) (Xing & Hu, Citation2016). Finally, the NDVI, DVI, and VB-FAH were calculated using Eqs (1), (2), and (3). The relations between the three indices and POM were obtained by regression analysis.(1)
(2)
(3) where the subscripts NIR, RED, and G denote near-infrared, red, and green bands, respectively, and they correspond to bands 4, 3, and 2 of HJ-1 CCD and GF-1 WVF, respectively.
c Validations Based on High-Resolution Satellite Images
Multiband GF-1 satellite images with a resolution of 16 m were used for validation of the NDVI, DVI, and VB-FAH indices. The GF-1 images were collected in the west of the southern Yellow Sea in the morning (10:53 local time, 02:53 utc), 17 July 2016. During the acquisition of GF-1 images on that date, the green tide caused by U. prolifera had fully developed, and the macroalgae mat extended several kilometres. Therefore, it is reasonable to assume that there were pure macroalgae pixels in the 16 m resolution images. The Fast Line of Sight Atmospheric Analysis of Spectral Hypercubes atmospheric correction module of the ENVI software was applied to the images (Xing & Hu, Citation2016). The sea surface reflectance (R, dimensionless) was derived and used to calculate the VB-FAH, DVI, and NDVI indices. These indices were further used to evaluate the spatial characteristics of the U. prolifera mats and to validate the POM models. Meanwhile, the NDVI-based POM estimation model proposed by Ding et al. (Citation2015) was also examined and compared with our models.
3 Results and discussion
a Linear Mixing Reflectance Spectra of the Sea Surface and Macroalgae
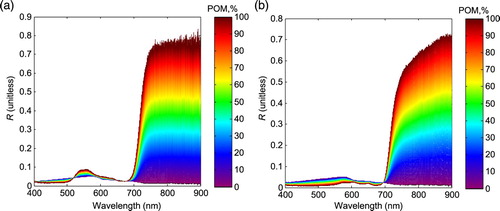
shows the linearly mixed reflectance spectra of the sea surface and macroalgae based on the endmembers as shown in . In the 400–900 nm spectral range, for both U. prolifera and S. horneri, when POM increases from 0% to 100%, the near-infrared (NIR) band reflectance (R) increases and has a much larger variation than in the blue, green, and red bands. This feature of high sensitivity of the NIR reflectance to changes in POM is important for identifying floating macroalgae and estimating the biomass; it also enables VB-FAH, DVI, and NDVI to monitor macroalgae. From , we can see that there is a critical point at 650–700 nm in the spectrum and that U. prolifera and S. horneri show different changes with increases in POM, which may be used to differentiate between the two different macroalgae species. The difference in reflectance for U. prolifera and S. horneri is not the focus of our study and, thus, is not discussed further.
Fig. 2 Linear mixing reflectance spectra of the sea surface and floating macroalgae for (a) U. prolifera and (b) S. horneri.
b Models for Sub-Pixel Macroalgae Coverage Estimation
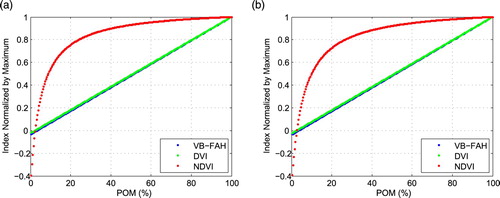
shows that VB-FAH, DVI, and NDVI increase monotonically with increasing POM. Among them, NDVI shows an approximate logarithmic increase (R2 = 0.82), namely, an accelerated increase at the start followed by a decelerated increase. When POM increases from 25% to 100%, the NDVI increases by only 20%. The relations between DVI and VB-FAH with POM are linear (R2 = 1). The two different response types of the macroalgae indices to POM are represented by Eqs (4) and (5), respectively:(4)
(5) where y is the sub-pixel coverage of macroalgae (%); x are the macroalgae indices (NDVI, DVI, or VB-FAH) normalized by their respective maxima (i.e., the values of pure macroalgae spectra). As shown in a and b, the changes in the macroalgae indices for U. prolifera and S. horneri with changes in POM are very similar. Therefore, Eqs (4) and (5) can be a general model for both U. prolifera and S. horneri. Use of the linear mixing approach and normalization by the maxima reduce the impacts of the different reflectance of macroalgae (U. prolifera and S. horneri). Similarly, we can also expect very low variations in the two derived models when different types of water reflectance are used in the mixing experiments (see Section 2.b), which implies that these two models can also be used with multi-spectral images even if the imagery reflectances are different from the in situ ones.
Fig. 3 Changes in indices of VB-FAH, DVI, and NDVI normalized by their maxima versus increases in the portion of macroalgae (POM) for (a) U. prolifera and (b) S. horneri.
Once the biomass in a unit area has been determined, these models can be used to estimate the total macroalgae biomass quantitatively. For Eq. (4), when the coverage is more than 25%, a small variation of NDVI may result in a larger estimation error in POM. For the full POM range of 0%–100%, the averages of relative errors in POM estimation based om NDVI are 27.8% and 33.5% for U. prolifera and S. horneri, respectively, while the error is less than 6% when Eq. (5) is used for the two types of macroalgae. As a result, it is recommended that the linear function based on DVI or VB-FAH (Eq. (5)) be used in practice.
Another index could also be used to estimate coverage, such as FAI (Hu, Citation2009; Qi et al., Citation2016). The FAI index is in the same band-difference category as VB-FAH and DVI. As test results with remote-sensing images show, the FAI is linearly related to both VB-FAH and the DVI (Xing & Hu, Citation2016). It is expected that the FAI would have a similar linear relationship with POM and that the POM model, as shown by Eq. (5), would also work for the FAI index.
c Sub-Pixel Coverage Estimation of U. prolifera Using GF-1 Images
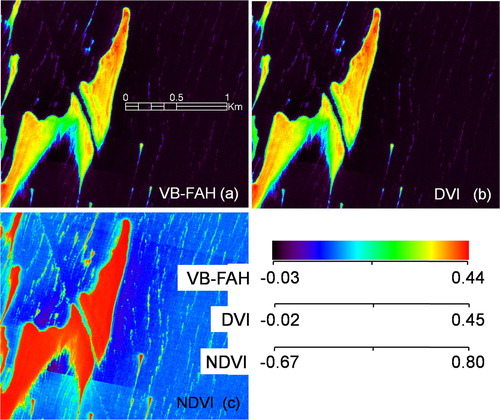
shows maps of VB-FAH, DVI, and NDVI for a U. prolifera bloom in the Yellow Sea. These macroalgae index maps were derived from GF-1 satellite images that have a high ground resolution of 16 x 16 m per pixel. Similar to the modelled results in , the NDVI index is colour saturated in those zones with a high macroalgae density, showing low sensitivity to the variations in the sub-pixel macroalgae coverage (as indicated by the red area in c), while VB-FAH and DVI are more sensitive. As shown in a and b, distinct spatial variations occurred even in the zones with high macroalgae density, indicating the mixture of floating macroalgae and sea water. Therefore, the effect of sub-pixel spectral mixing should be taken into account for estimating the coverage (POM) even when high-resolution images are utilized. When NDVI is used to determine macroalgae pixels from remote-sensing images, pixels with high NDVI values tend to be mistaken for those of pure macroalgae. When medium-low resolution satellite images are used in practice, pure macroalgae pixels do not necessarily exist. Therefore, it is reasonable to use the in situ measured endmember spectra of macroalgae and the index, as with the 250 m Moderate Resolution Imaging Spectroradiometer (MODIS) images as in Qi et al. (Citation2016).
Fig. 4 Indices for a high density of macroalgae (U. prolifera) for (a) VB-FAH, (b) DVI, and (c) NDVI.
The U. prolifera patches shown in were extracted by means of a threshold value (VB-FAH > 0.025; Xing & Hu, Citation2016) then the pixel numbers of these patches were summed resulting in 61,768 pixels of macroalgae in total (about 0.802 km2). The index values for the group of 61,768 pixels were further normalized by their corresponding maxima, and the sub-pixel macroalgae coverage (POM) for each pixel was estimated using Eqs (4) and (5). Then, the POMs derived from each index were summed, and the results for DVI, VB-FAH, and NDVI are 41,098 (0.534 km2), 40,960 (0.532 km2), and 43,018 pixels (0.559 km2), respectively. The difference between the total pure macroalgae coverage estimated by DVI and VB-FAH is only 0.3%; the difference between that estimated by NDVI and DVI (or VB-FAH) is relatively larger, but still only 5%. The low relative differences indicate that the two different models, Eqs (4) and (5), produce highly consistent results.
Ding et al. (Citation2015) developed an estimation model for U. prolifera coverage based mainly on a quadratic function of NDVI, in which pixels with an NDVI > 0.715 are regarded as pure macroalgae pixels. According to Ding’s model, there are a total of 47,627 pixels of pure macroalgae in the same group of 61,768 macroalgae-contaning pixels, and 14,141 non-pure pixels, which results in 58,788 total pure macroalgae coverage by pixel number and an area of 0.763 km2. This result from Ding’s model is 36.7% higher than those estimated by Eqs (4) and (5) in the current paper. This discrepancy may be mainly due to the results of Ding et al. (Citation2015) identifying all macroalgae pixels as pure pixels from the 30 m resolution HJ-1 images using the NDVI index, which is far from realistic. As indicated by the VB-FAH or DVI in a and b, the macroalgae patches which appeared to be saturated in the NDVI image (c) were actually not pure pixels, and, in fact, the spatial variation of the sub-pixel coverage is significant. If NDVI is used to estimate POM, Eq. (4) is recommended or the use of a look-up table implied in , which can reduce the impact resulting from the low-fitting accuracy in Eq. (4).
In all, if NDVI is used to estimate sub-pixel coverage of macroalgae and the effects of aerosol and sea surface factors are not taken into account, then we suggest applying a simplified model, such as Eq. (4), or a look-up-table model as shown in . In practice, use of a model based on VB-FAH or DVI as in Eq. (5) is recommended for its conciseness and robustness (e.g., in the estimation of green macroalgae biomass (Xing et al., Citation2018)).
4 Conclusions
Floating macroalgae are distributed in a multi-fractional and irregular way. Therefore, most patches of macroalgae are unavoidably mixed with the sea surface in satellite images. The estimation of macroalgae coverage in a pixel is the first step in estimating biomass. In this study, we collected the endmember reflectance spectra of floating macroalgae (U. prolifera and S. horneri) and sea water and investigated the responses of different macroalgae indices to the changes in the POM using a linear spectral-mixing method. Then, two models for estimating sub-pixel macroalgae coverage were proposed: the first model is based on NDVI, and the second is based on DVI or VB-FAH. The two models worked well for U. prolifera and S. horneri. The validation using GF-1 satellite images with U. prolifera indicates good agreement between the two types of models. In practical applications, it is recommended that a linear model based on DVI, VB-FAH, or comparable indices (such as FAI) be used to estimate the sub-pixel macroalgae coverage and from that the biomass, which is crucial for management of floating macroalgae blooms and the use of the massive macroalgae (e.g., as a source of food, fertilizers, and biofuels).
The proposed models can be extended to other satellite sensors with similar bands, even with different resolutions, such as Landsat and MODIS. A practical procedure for the identification of floating macroalgae needs to be developed because of the impacts from variations in atmospheric and sea-surface environmental optics, as well as instrumental noise. Therefore, our macroalgae coverage estimation models need to be combined with macroalgae identification models. In order to estimate the actual biomass, the weight per unit area and the model for differentiating the green macroalgae and S. horneri should be included.
Acknowledgements
The authors would like to thank two anonymous reviewers and Dr. Xiaochun Wang for their comments and help on this manuscript.
Disclosure statement
No potential conflict of interest was reported by the authors.
Additional information
Funding
References
- Cui, T., Zhang, J., Sun, L., Jia, Y., Zhao, W., Wang, Z., & Meng, J. (2012). Satellite monitoring of massive green macroalgae bloom (GMB): Imaging ability comparison of multi-source data and drifting velocity estimation. International Journal of Remote Sensing, 33, 5513–5527. doi: 10.1080/01431161.2012.663112
- Ding, Y., Huang, J., Cui, T., Wang, Z., Zhang, Y., Cao, C., … Xiao, Y. (2015). The decomposition method of MODIS images Enteromorpha mixed pixels based on the relation of NDVI to abundance. Acta Oceanologica Sinica, 37(7), 123–131.
- Gower, J., Young, E., & King, S. (2013). Satellite images suggest a new Sargassum source region in 2011. Remote Sensing Letters, 4, 764–773. doi: 10.1080/2150704X.2013.796433
- Hu, C. (2009). A novel ocean color index to detect floating algae in the global oceans. Remote Sensing of Environment, 113, 2118–2129. doi: 10.1016/j.rse.2009.05.012
- Hu, C., Murch, B., Barnes, B. B., Wang, M., Maréchal, J.-P., Franks, J., … Siuda, A. N. S. (2016). Sargassum watch warns of incoming seaweed. Eos, 97. doi: 10.1029/2016EO058355
- Jiang, X., Liu, J., Zou, B., Wang, Q., Zeng, T., Guo, M., … Tang, J. (2009). The satellite remote sensing system used in emergency response monitoring for Entermorpha prolifera disaster and its application. Acta Oceanologica Sinica, 31(1), 52–64.
- Li, L., Xing, Q., Li, X., Yu, D., Zhang, J., & Zou, J. (2018). Assessment of the impacts from the world’s largest floating macroalgae blooms on the water clarity at the west Yellow Sea using MODIS data (2002–2016). IEEE Journal of Selected Topics in Applied Earth Observations and Remote Sensing, 11, 1397–1402. doi: 10.1109/JSTARS.2018.2806626
- Liu, D., Keesing, J. K., Xing, Q., & Shi, P. (2009). World’s largest macroalgal bloom caused by expansion of seaweed aquaculture in China. Marine Pollution Bulletin, 58, 888–895. doi: 10.1016/j.marpolbul.2009.01.013
- Lyons, D. A., Arvanitidis, C., Blight, A. J., Chatzinikolaou, E., Guy-Haim, T., Kotta, J., … Crowe, T. P. (2014). Macroalgal blooms alter community structure and primary productivity in marine ecosystems. Global Change Biology, 20(9), 2712–2724. doi: 10.1111/gcb.12644
- Mizuno, S., Ajisaka, T., Lahbib, S., Kokubu, Y., Alabsi, M. N., & Komatsu, T. (2014). Spatial distributions of floating seaweeds in the East China Sea from late winter to early spring. Journal of Applied Phycology, 26(2), 1159–1167. doi: 10.1007/s10811-013-0139-8
- Qi, L., Hu, C., Wang, M., Shang, S., & Wilson, C. (2017). Floating algae blooms in the East China Sea. Geophysical Research Letters, 44(22), 11501–11509. doi: 10.1002/2017GL075525
- Qi, L., Hu, C., Xing, Q., & Shang, S. (2016). Long-term trend of Ulva prolifera blooms in the western Yellow Sea. Harmful Algae, 58, 35–44. doi: 10.1016/j.hal.2016.07.004
- Shen, H., Perrie, W., Liu, Q., & He, Y. (2014). Detection of macroalgae blooms by complex SAR imagery. Marine Pollution Bulletin, 78, 190–195. doi: 10.1016/j.marpolbul.2013.10.044
- Smetacek, V., & Zingone, A. (2013). Green and golden seaweed tides on the rise. Nature, 504, 84–88. doi: 10.1038/nature12860
- Wang, M., & Hu, C. (2016). Mapping and quantifying Sargassum distribution and coverage in the central West Atlantic using MODIS observations. Remote Sensing of Environment, 183, 350–367. doi: 10.1016/j.rse.2016.04.019
- Xing, Q., Guo, R., Wu, L., Cong, M., An, D., Qin, S., & Li, X. (2017). High-resolution satellite observations of a new hazard of golden tides caused by floating Sargassum in winter in the Yellow Sea. IEEE Geoscience and Remote Sensing Letters, 14(10), 1815–1819. doi: 10.1109/LGRS.2017.2737079
- Xing, Q., & Hu, C. (2016). Mapping macroalgal blooms in the Yellow Sea and East China Sea using HJ-1 and Landsat data: Application of a virtual baseline reflectance height technique. Remote Sensing of Environment, 178, 113–126. doi: 10.1016/j.rse.2016.02.065
- Xing, Q., Hu, C., Tang, D., Tian, L., Tang, S., Wang, X. H., … Gao, X. (2015). World’s largest macroalgal blooms altered phytoplankton biomass in summer in the Yellow Sea: Satellite observations. Remote Sensing, 7, 12297–12313. doi: 10.3390/rs70912297
- Xing, Q., Li, L., Lou, M., Bing, L., Zhao, R., & Li, Z. (2015). Observation of oil spills through Landsat thermal infrared imagery: A case of Deepwater Horizon. Aquatic Procedia, 3, 151–156. doi: 10.1016/j.aqpro.2015.02.205
- Xing, Q., Lou, M., Chen, C., & Shi, P. (2013). Using in situ and satellite hyperspectral data to estimate the surface suspended sediments concentrations in the Pearl River estuary. IEEE Journal of Selected Topics in Applied Earth Observations and Remote Sensing, 6, 731–738. doi: 10.1109/JSTARS.2013.2238659
- Xing, Q., Tosi, L., Braga, F., Gao, X., & Gao, M. (2015). Interpreting the progressive eutrophication behind the world’s largest macroalgal blooms with water quality and ocean color data. Natural Hazards, 78, 7–21. doi: 10.1007/s11069-015-1694-x
- Xing, Q., Wu, L., Tian, L., Cui, T., Li, L., Kong, F., … Wu, M. (2018). Remote sensing of early-stage green tide in the Yellow Sea for floating-macroalgae collecting campaign. Marine Pollution Bulletin, 133, 150–156. doi: 10.1016/j.marpolbul.2018.05.035
- Xing, Q., Zheng, X., Shi, P., Hao, J., Yu, D., Liang, S., … Zhang, Y. (2011). Monitoring “GreenTide” in the Yellow Sea and the East China Sea using multi-temporal and multi-source remote sensing images. Spectroscopy and Spectral Analysis, 31, 1644–1647.
- Xu, Q., Zhang, H., Cheng, Y., Zhang, S., & Zhang, W. (2016). Monitoring and tracking the green tide in the Yellow Sea with satellite imagery and trajectory model. IEEE Journal of Selected Topics in Applied Earth Observations and Remote Sensing, 9(11), 5172–5181. doi: 10.1109/JSTARS.2016.2580000