
ABSTRACT
Trends in indices based on daily temperature and precipitation are examined for two periods: 1948–2016 for all stations in Canada and 1900–2016 for stations in the south of Canada. These indices, a number of which reflect extreme events, are considered to be impact relevant. The results show changes consistent with warming, with larger trends associated with cold temperatures. The number of summer days (when daily maximum temperature >25°C) has increased at most locations south of 65°N, and the number of hot days (daily maximum temperature >30°C) and hot nights (daily minimum temperature >22°C) have increased at a few stations in the most southerly regions. Very warm temperatures in both summer and winter (represented by the 95th percentile of their daily maximum and minimum temperatures, respectively) have increased across the country, with stronger trends in winter. Warming is more pronounced for cold temperatures. The frost-free season has become longer with fewer frost days, consecutive frost days, and ice days. Very cold temperatures in both winter and summer (represented by the 5th percentile of their daily maximum and minimum temperatures, respectively) have increased substantially across the country, again with stronger trends in the winter. Changes in other temperature indices are consistent with warming. The growing season is now longer, and the number of growing degree-days has increased. The number of heating degree-days has decreased across the country, while the number of cooling degree-days has increased at many stations south of 55°N. The frequency of annual and spring freeze–thaw days shows an increase in the interior provinces and a decrease in the remainder of the country. Changes in precipitation indices are less spatially coherent. An increase in the number of days with rainfall and heavy rainfall is found at several locations in the south. A decrease in the number of days with snowfall and heavy snowfall is observed in the western provinces, while an increase is found in the north. There is no evidence of significant changes in the annual highest 1-day rainfall and 1-day snowfall. The maximum number of consecutive dry days has decreased, mainly in the south.
Résumé
[Traduit par la rédaction] Nous examinons les tendances d’indices fondés sur les températures et les précipitations quotidiennes pour deux périodes : de 1948 à 2016, pour toutes les stations au Canada, et de 1900 à 2016, pour les stations du sud du pays. Ces indices, dont certains représentent des événements extrêmes, sont considérés comme pertinents sur le plan des impacts. Les résultats montrent des changements en accord avec un réchauffement et des tendances prononcées associées à des températures froides. Le nombre de jours estivaux (lorsque la température quotidienne maximale > 25°C) a augmenté à la plupart des sites au sud de 65° N, et les nombres de jours chauds (température quotidienne maximale >30°C) et de nuits chaudes (température quotidienne minimale >22°C) ont augmenté à quelques stations, dans les régions les plus au sud. Les températures très chaudes, tant en été qu’en hiver (représentées respectivement par les 95e centiles des températures maximales et minimales quotidiennes), ont augmenté partout au pays, avec des tendances plus fortes en hiver qu’en été. Le réchauffement est plus prononcé dans le cas des températures froides. La saison sans gel s’est allongée: il y a aussi moins de jours de gel, de jours de gel consécutifs et de jours sans dégel. Les températures très froides, tant en hiver qu’en été (représentées respectivement par les 5e centiles des températures maximales et minimales quotidiennes), ont augmenté considérablement partout au pays, encore une fois avec des tendances plus fortes en hiver qu’en été. L’évolution d’autres indices de température concorde avec un réchauffement. La saison de croissance s’est allongée et le nombre de degrés-jours de croissance a augmenté. Les degrés-jours de chauffe ont diminué dans l’ensemble du pays, tandis que les degrés-jours de refroidissement ont augmenté à de nombreuses stations au sud de 55° N. Les fréquences annuelles et printanières des jours de gel-dégel montrent une augmentation dans les provinces centrales et une diminution dans le reste du pays. L’évolution des indices de précipitations est moins cohérente sur le plan spatial. Nous constatons une hausse du nombre de jours avec pluie et forte pluie à plusieurs endroits dans le sud. Nous observons une baisse des nombres de jours avec chute de neige et forte chute de neige dans les provinces de l’ouest, et une augmentation dans le nord. Il n’y a aucune preuve de changements significatifs de la quantité quotidienne de pluie ou de neige la plus élevée sur une année. Le nombre maximal de jours secs consécutifs a diminué, principalement dans le sud.
1 Introduction
Canada's climate is changing. Surface air temperature has risen; spring precipitation has been shifting from snow to rain; and the duration of snow cover has been decreasing (Brown, Derksen, & Wang, Citation2010; Mekis & Vincent, Citation2011; Vincent et al., Citation2015). The directions of change are consistent with what would be expected from a warming climate, and many of the observed trends are projected to continue into the future under scenarios of further emissions of greenhouse gases (Bush, Loder, James, Mortsch, & Cohen, Citation2014; Collins et al., Citation2013; Kirtman et al., Citation2013; Seneviratne et al., Citation2012). Canada is a vast country, and changes in Canada's climate are not spatially uniform. In addition, climate trends in Canada are not temporally consistent. Therefore, it is important to closely monitor changes in temperature and precipitation conditions using long-term climate data in order to determine whether the trends continue when reliable data for more locations and longer periods of time become available.
Canada is becoming warmer. The annual mean temperature averaged over land has increased by 1.7°C from 1948 to 2012 (Vincent et al., Citation2015). Although warming occurs everywhere across the country, stronger trends were found during winter and spring in western and northern regions. Daily minimum temperatures have been rising slightly faster than daily maximum temperatures (Vincent et al., Citation2012). Canada's precipitation has also increased. The increase in precipitation amounts is dominated by large changes observed in British Columbia, southern Ontario, southern Quebec, and Atlantic Canada (Mekis & Vincent, Citation2011). Snowfall amounts have decreased in southern regions of the country from British Columbia to southern Quebec, while they have increased in Atlantic Canada and in the north (north of 60°N). These changes in temperature and precipitation conditions have led to a shorter snow-cover season, mainly in response to earlier snowmelt resulting from warmer spring temperatures (Brown et al., Citation2010; Mudryk et al., Citation2018).
A changing climate can have both positive and negative effects on Canada's communities and economies (Warren & Lemmen, Citation2014). Some regions could benefit from milder and shorter winters because this could diminish the demand for heating buildings and thus reduce energy consumption. Fewer extreme cold days and frost days could result in easier conditions for road transportation and fewer weather-related injuries. A longer growing season could be beneficial for agriculture, and more summer days could result in an extended outdoor recreational season. However, a warmer climate is also associated with an increase in the frequency of hot days and hot nights that can adversely affect the health and well-being of Canadians (Casati, Yagouti, & Chaumont, Citation2013). Warmer temperatures are generally accompanied by less snowfall, and less snow on the ground can reduce winter activities and have a negative impact on agriculture because of lower water availability (Blankinship & Hart, Citation2012).
Several studies have already examined trends in indices based on daily and extreme temperature and precipitation in Canada. Data coverage for the entire country has been available since 1948. Fewer cold nights, cold days, and frost days and conversely more warm nights, warm days, and summer days were found across the country (Vincent & Mekis, Citation2006). Trends in the 5th and 95th percentiles of the daily maximum and minimum temperatures show fewer days with extreme low temperatures and more days with extreme high temperatures (Bonsal, Zhang, Vincent, & Hogg, Citation2001). The number of growing and cooling degree-days has increased, whereas the number of heating degree-days has decreased (Bonsal et al., Citation2001). There has been a significant lengthening of the growing season because of an earlier start and a later end to the season (Qian, Zhang, Chen, Feng, & O’Brien, Citation2010). Fewer freeze–thaw days were found in southern Quebec (Yagouti, Boulet, Vincent, Vescovi, & Mekis, Citation2008). More days with precipitation and a decrease in the maximum number of consecutive dry days have been observed for Canada (Vincent & Mekis, Citation2006). No consistent trends were found in extreme precipitation, whereas increases in total precipitation have been found, mainly because of an increase in the number of small to moderate precipitation events (Zhang, Hogg, & Mekis, Citation2001). These results for Canada are in general agreement with global-scale studies that have indicated widespread warming trends in temperature indices and changes in precipitation indices that are spatially more complex but show a tendency toward wetter conditions (Donat et al., Citation2013).
The purpose of this study is to present an updated analysis of the trends in indices based on daily temperature and precipitation for monitoring climate change impacts in Canada. It updates some of the previous work presented in Vincent and Mekis (Citation2006), Bonsal et al. (Citation2001), and Zhang et al. (Citation2001) by using the latest version of the homogenized daily temperatures and adjusted daily precipitation, now available at more locations, and by examining the trends over a longer period of time, which includes at least an additional 10 years of recent data. The indices were selected for their relevance to social and economic impact assessment in Canada and for the insights they could provide regarding changes in extreme climate conditions. Historical changes are also useful benchmarks for evaluating climate models. In this paper, the trends are first examined at individual stations and then they are analyzed for six sub-regions as well as the entire country. Section 2 describes the data and methodologies. The trends are presented in Section 3. Section 4 provides a discussion of the relevance of these changes to the health of Canadians and to some of the important sectors of the Canadian economy (e.g., tourism, agriculture, energy, and shipping). A summary and conclusions follow in Section 5.
2 Data and methodologies
a Temperature Indices
The temperature indices were computed from homogenized daily maximum and minimum temperatures at 338 locations across the country (Vincent et al., Citation2012). Homogeneity issues related to station relocation, changes in observing time, and joining of observations from co-located sites were addressed using regression models and the observations of neighbouring stations (Vincent, Zhang, Bonsal, & Hogg, Citation2002; Wang, Feng, & Vincent, Citation2014). A set of 21 temperature indices was selected for this study (). Some of these indices are based on fixed thresholds (e.g., summer days) because these are easily understood; however, they may not be applicable in every region of the country (e.g., hot days are rare in the Arctic). Other indices are based on percentiles (e.g., 95th percentile of the daily maximum temperature) to facilitate the comparison of long-term changes between different climatic regions. Some of the indices are computed on an annual basis and others on a seasonal basis (). Monthly values are set to missing when the values for more than three consecutive days or more than five random days are missing in the month; annual and seasonal values are missing when the value for any month is missing in the year or season.
Table 1. Definition of the temperature indices.
The indices describe warm and cold conditions along with other climatic conditions that are impact relevant, such as frost-free season, growing season, degree-days, and freeze–thaw days. The threshold of 25°C is used to define summer days because warm-weather seasons can be beneficial to Canadian tourism (Kovacs & Thistlethwaite, Citation2014). Thresholds of 30°C and 22°C are chosen to define hot days and hot nights, respectively, and, along with the summer 95th percentile of the daily temperatures, were used by Health Canada experts to characterize the occurrence of warm-weather events that can result in negative outcomes for Canadian communities (Casati et al., Citation2013). Frost days, consecutive frost days, ice days, and the winter 5th percentile of the daily temperatures are used to characterize cold conditions. The length of the frost-free season is important to agriculture and shipping (Andrey, Kertland, & Warren, Citation2014). A daily mean temperature above 5°C was chosen to define the growing season and growing degree-days, which are important indicators of crop viability (Bootsma, Anderson, & Gameda, Citation2011). Cooling and heating degree-days can be used to evaluate energy consumption (Instanes, Citation2005). Degree-days are based on departures of the daily mean temperature from a threshold (), which are summed on a yearly basis to determine the annual number of degree-days. Freeze–thaw days can have a significant effect on road maintenance (Hershfield, Citation1979; Ho & Gough, Citation2006; Schmidlin, Derthier, & Eggleston, Citation1987) and can play an important role in the production of maple syrup in Ontario and Quebec (Duchesne, Houle, Côté, & Logan, Citation2009; Pothier, Citation1995). In this study, the 95th and 5th percentiles of the daily temperature are often referred to as very warm and very cold days, respectively; the daily minimum and maximum temperatures are also referred to as the nighttime and daytime temperatures, respectively.
b Precipitation Indices
The precipitation indices were computed from daily rainfall, daily snowfall, and daily total precipitation amounts at 464 stations across the country. Daily total precipitation (called daily precipitation hereafter) is the sum of the daily rainfall and snowfall water equivalent amounts. These data have been adjusted to address known measurement issues (Mekis & Vincent, Citation2011). Daily rainfall was corrected for wetting losses associated with different types of manual rain gauges used in the past (Devine & Mekis, Citation2008). Daily snowfall, taken from snow ruler measurements, were converted to appropriate snow water equivalent amounts (Mekis & Brown, Citation2010). Adjustments for trace observations (smaller than the minimum measurable amount) were also added to daily rainfall and snowfall depending on the station location and measurement program (Mekis & Hogg, Citation1999; Mekis & Vincent, Citation2011). A set of 10 precipitation indices was chosen for this study ().
Table 2. Definition of the precipitation indices.
The indices describe wet, very wet, highest 1-day events, and dry conditions. A threshold of 1 mm was chosen (instead of zero or trace) to identify days with rainfall, snowfall, and precipitation because trace observations have not been recorded consistently in time and across the country. However, it is important to note that trace observations are important for properly computing precipitation accumulation on a monthly or seasonal basis, especially in dry regions like the Arctic. For very wet conditions, the 90th percentile reference value was calculated from all daily events greater than or equal to 1 mm within the 1961–1990 period and the number of days with rainfall, snowfall, and precipitation above their respective 90th percentiles was obtained each year. The highest 1-day rainfall, snowfall, and precipitation amounts were retrieved each year to provide some insights into changes in extreme precipitation amounts. The maximum number of consecutive dry days was calculated using daily total precipitation less than the trace amount to characterize the length of dry spells. Similar to the temperature indices, the monthly values, and consequently the annual values, were set to missing when the value for precipitation was missing for more than three consecutive days or more than five random days in a given month.
c Trend Estimation
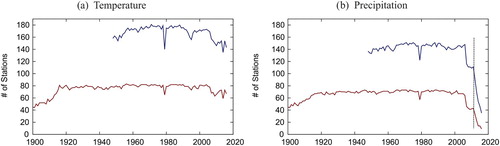
Because very few stations in the northern regions reported climate observations prior to 1948, trends in temperature and precipitation indices were first examined for two time periods: 1948–2016 for all stations to provide a national picture and 1900–2016 for stations in the south for a longer perspective. The trends were computed for stations with less than 10% missing years in the respective periods. shows the number of stations for which trends could be calculated: it decreases after 2005 mainly because of the downsizing of the traditional manual observing network and the introduction of automated systems (Milewska & Vincent, Citation2016). Because the reduction in the number of stations with precipitation trends is substantial after 2012 (also shown in Mekis et al., Citation2018), the trends for the precipitation indices were re-computed for the shorter periods 1948–2012 and 1900–2012.
Fig. 1 Number of stations that reported trends in (a) temperature and (b) precipitation indices during the 1948–2016 period (blue) and 1900–2016 period (red). The vertical black dashed line indicates the year 2012.
The trend calculation followed the methodology presented in Zhang, Vincent, Hogg, and Niitsoo (Citation2000). The estimated magnitude of the trend is based on the slope estimator of Sen (Citation1968), and the statistical significance of the trend is based on the nonparametric Kendall's τ-test (Kendall, Citation1955). Because serial correlation is occasionally present in the climatological time series, the method also uses an iterative procedure to account for the lag-1 autocorrelation of the time series (Wang & Swail, Citation2001). Trends were computed for individual stations, and the statistical significance of the trends was assessed at the 5% level. Trends for threshold-based indices (e.g., number of hot days) were computed only for stations where the temperature threshold is exceeded regularly (for at least five years in the period of analysis). The tables and figures presented in this paper show the 1948–2016 trends for the temperature indices and the 1948–2012 trends for the precipitation indices; the table and figures for the longer periods are provided in Tables S1 and S2 and Figs S1 to S4 (supplemental tables and figures can be accessed at http://dx.doi.org/10.1080/07055900.2018.1514579). The values of trend given in the text are all statistically significant.
d Regional and National Time Series
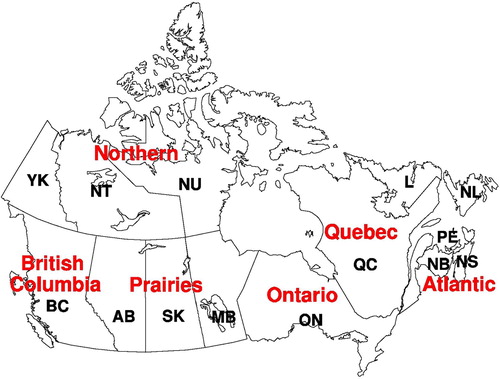
Canada is a vast country with many different climatic regions (Gullett & Skinner, Citation1992) and ecozones (Zhang et al., Citation2011). In this study, the country was divided into six broad regions based on provincial boundaries () to compare observed regional changes with those projected in the future. Because stations reporting climate observations are not evenly distributed in every region, with more stations in most populated areas, the following procedure was used to produce the regional and national time series. The country was first divided into 5° by 5° grid boxes. The anomalies (differences between the annual or seasonal values and their average over the reference period 1961–1990) were obtained at individual stations and were averaged within each grid box. The regional and national time series were then obtained by calculating the average of all boxes reporting within each region and the entire country. Because the annual highest 1-day rainfall, snowfall, and precipitation amounts can be very different from one station to another, the anomalies were further divided by the 1961–1990 average and multiplied by 100 to normalize the values for these indices. The trends for the temperature indices were computed for the 1948–2016 period for each region and Canada (the entire country) and for the 1900–2016 period for the southern regions and southern Canada (south of 60°N). The trends for the precipitation indices were computed similarly but for the 1948–2012 and 1900–2012 periods respectively.
Fig. 2 The six regions (in red) used in this study: British Columbia region includes all stations in British Columbia (BC); Prairies region – all stations in Alberta (AB), Saskatchewan (SK) and Manitoba (MB); Ontario region – all stations in Ontario (ON); Quebec region – all stations in Quebec (QC); Atlantic region – all stations in New Brunswick (NB), Prince Edward Island (PE), Nova Scotia (NS), and Newfoundland and Labrador (NL-L); and Northern region – all stations in Yukon (YK), Northwest Territories (NT), and Nunavut (NU).
3 Results
a Changes in Warm Conditions
Summer days (defined in ) have significantly increased at most stations across the southern regions (a); this condition does not occur frequently in the north. The number of summer days averaged over the nation (south of 65°N) increased by 6.9 days during the 1948–2016 period (). The trends are significant in every southern region with the exception of the Prairies. During the 1900–2016 period (Table S1 and Fig. S1), the increase in summer days is more evident at stations in southern Ontario, southern Quebec, and the Maritime provinces (New Brunswick, Nova Scotia, and Prince Edward Island). The change in the number of summer days is not monotonic over the past 117 years: there is a small decreasing trend from the 1930s to the 1970s (a), probably because of the very hot daytime temperatures that occurred in the 1930s and 1940s in the Prairies (Bonsal et al., Citation2001).
Fig. 3 Trends in warm and cold conditions during the 1948–2016 period. Filled triangles indicate trends significant at the 5% level. Black dots indicate that the condition does not frequently occur at the location (less than 5 years over the 1948–2016 period).
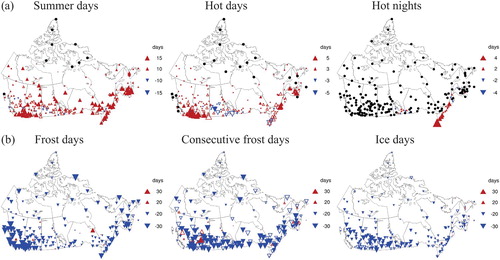
Fig. 4 Average anomalies of the number of (a) summer days and (b) frost days over Canada during the 1948–2016 period (blue) and southern Canada for the 1900–2016 period (red).
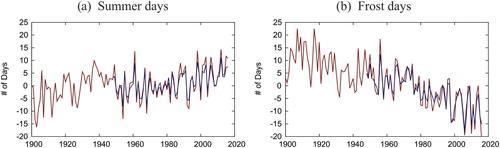
Table 3. Regional trends for temperature indices for the 1948–2016 period.
Hot days are not commonly observed in regions north of 60°N or at locations on the Pacific and Atlantic coasts. Significant increasing trends of about 1–3 days are found at a handful of stations over the 1948–2016 period, mainly in southern British Columbia (BC), southern Quebec, and the Maritimes (a); decreasing trends are also observed in the Prairies. Similar results are noticed for the 1900–2016 period.
Hot nights are usually only observed in the southern areas of Manitoba, Ontario, and Quebec because other parts of Canada are not generally warm enough to experience nighttime temperatures above 22°C. In these areas, the number of hot nights has significantly increased at a few stations: by about 6 nights during the 1948–2016 period in Windsor and by 1–3 nights in London, Hamilton, Toronto, and Montréal (a). During the past 117 years, the number of hot nights has significantly increased by about 1–3 nights in London, Toronto, and Montréal.
The summer 95th percentile of the daily maximum temperatures (tmax) and of the daily minimum temperatures (tmin) indicate significant increasing trends over the 1948–2016 period at many locations across the country (a, right panels); however, decreasing trends are also found in the summer 95th percentile of tmax, mainly in the Prairies. Averaged over the country, the summer 95th percentile of tmax has increased by 0.9°C for the 1948–2016 period, whereas the summer 95th percentile of tmin has increased by 1.3°C (). Therefore, very warm nighttime temperatures have increased more than very warm daytime temperatures during the summer. This is observed in every region although the trends in the summer very warm tmax are not significant in BC, the Prairies, and Ontario.
Fig. 5 Trends in the 5th and 95th percentiles of the daily maximum and minimum temperatures during the 1948–2016 period for (a) summer and (b) winter (°C per 69 years). Filled triangles indicate trends significant at the 5% level. The largest triangles represent trends of about 4°C per 69 years.
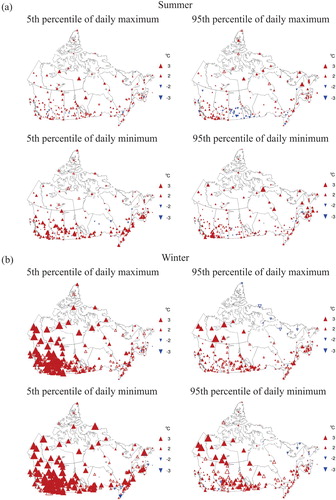
The winter 95th percentiles (warmest 5th percentile) for both tmax and tmin show significant increasing trends over the 1948–2016 period at most locations across the country (b, right panels). Averaged over the country, the winter 95th percentile of tmax has increased by 1.4°C for the 1948–2016 period, while the winter 95th percentile of tmin has increased by 2.1°C (). As seen during the summer, the trends are more pronounced in nighttime temperatures than in daytime temperatures; this is observed in every region with the exception of BC and the Atlantic region. In addition, the trends in the winter 95th daily temperature percentile (b, right panels) are generally more pronounced than those in the summer 95th percentile temperatures (a, right panels).
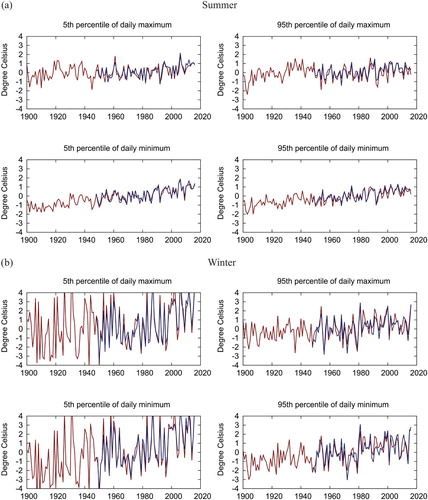
Similar results were found for the longer 1900–2016 period for southern Canada (Table S1 and Fig. S2); these include a larger increase in the 95th percentile of tmin than in the 95th percentile of tmax and stronger trends in the winter than in the summer. Winter temperatures appear to have greater interannual variability than summer temperatures (). The summer 95th percentile of tmax (a, top right panel) indicates a slight decrease from the 1930s to the 1970s, which can be attributed to the very hot daytime temperatures observed in the Prairies in the 1930s and 1940s (Bonsal et al., Citation2001).
Fig. 6 5th and 95th percentiles of the daily maximum and minimum temperature anomalies averaged over Canada during the 1948–2016 period (blue) and southern Canada during the 1900–2016 period (red) for (a) summer and (b) winter.
b Changes in Cold Conditions
Cold conditions have become less cold across the country. The number of frost days has decreased at almost every station across the country and in the north (b). Averaged over the country, it has decreased by 15.0 days over the 1948–2016 period (). Regionally, the greatest reduction occured in BC. The decrease during the 1900–2016 period is greater than the decrease during the 1948–2016 period in every region. Averaged over southern Canada, the number of frost days has decreased by 22.9 days during the 1900–2016 period (b).
These results are consistent with the trends in other indices of cold conditions (b). Averaged over the country and for the 1948–2016 period, the number of consecutive frost days has decreased by 18.6 days while the number of ice days has decreased by 11.7 days (). Regionally, the largest decrease in the number of consecutive frost days and ice days over the past 69 years occurred in the Prairies. During the 1900–2016 period, the number of consecutive frost days has decreased by 26.7 days while the number of ice days has decreased by only 8.6 days (Table S1) probably because of the warm daytime temperatures observed in the 1930s and 1940s.
The winter 5th percentile of tmax and tmin has warmed more substantially than other similar indices (b, left panels). Averaged over the country, the winter 5th percentile of tmax has increased by 3.2°C for the 1948–2016 period, whereas the winter 5th percentile of tmin has increased by 3.5°C (). As seen before, the trends are more pronounced for nighttime temperatures than for daytime temperatures. Spatially, the warming is greater in the west and north: regionally, trends greater than 3°C are found in BC, the Prairies, and Northern region. The warming is more pronounced in the very cold winter temperatures (b, left panels) than in the very warm winter temperatures (b, right panels), and the warming is greater in the winter (b) than the summer (a).
The summer 5th percentile of tmax, averaged over the country, has increased by 1.2°C for the 1948–2016 period, whereas the summer 5th percentile of tmin has increased by 1.4°C (). The change in the summer 5th percentiles of tmax and tmin (a) are consistent across the country, whereas those observed in the winter are more pronounced in western and northern regions (b).
The results are similar for the longer 1900–2016 period; the 5th percentile of tmin has increased more than the 5th percentile of tmax, and the trends are generally more pronounced in winter than summer. The warming is more pronounced in the very cold temperatures (5th percentile of tmax and tmin) during winter in southwestern regions (Fig. S2, left panels). Even if the time series for Canada (1948–2016) and southern Canada (1900–2016) show considerable interannual variability in the winter 5th percentiles compared with the winter 95th percentiles and to the summer 5th and 95th percentiles, statistically significant trends are still detectable in the winter very cold temperatures ().
c Changes in Frost-Free Season, Growing Season, Degree-Days, and Freeze–Thaw Days
The warming observed in winter mean temperatures has shortened the cold season in Canada. As a result, the frost-free season was extended by more than 20 days, on average, during the 1948–2016 period, starting earlier by about 9 days and ending later by about 12 days (). These changes are seen at most stations across the country (a). Regionally, BC has had the greatest lengthening of the frost-free season. Over the longer 1900–2016 period, the trends are more pronounced in BC and the Prairies (Fig. S3). Averaged over southern Canada, the length of the frost-free season increased by about 25 days during the 1900–2016 period (a).
Fig. 7 Trends in (a) frost-free season, (b) growing season, (c) degree-days, and (d) freeze–thaw days during the 1948–2016 period. Filled triangles indicate trends significant at the 5% level. “DD” is used for degree-days. Black dots indicate that the condition does not occur frequently at the location (less than 5 years over the 1948–2016 period).
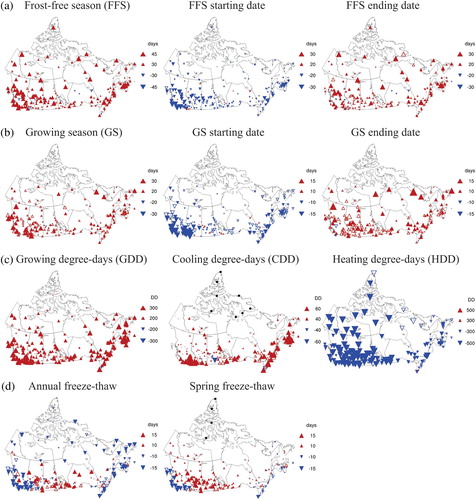
Fig. 8 (a) Frost-free season, (b) growing season, (c) degree-days, and (d) freeze–thaw day anomalies averaged over Canada during the 1948–2016 period (blue) and southern Canada during the 1900–2016 period (red).
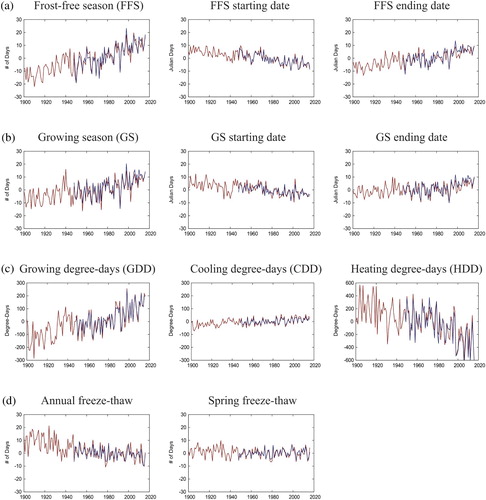
The length of the growing season averaged over Canada lengthened by about 15 days during the 1948–2016 period, starting 6 days earlier and ending 9 days later (). These changes are observed at most stations across the country (b); however, an earlier start to the growing season has not been observed at many locations in the Canadian Prairies, and the change in the starting date is not significant in the Prairies (). The strongest changes in the growing season occurred in BC and Quebec during the 1948–2016 period (). Averaged over southern Canada, the length of the growing season also increased by about 15 days during the 1900–2016 period, and the increase is more pronounced from the 1970s to recent years (b).
The number of growing degree-days (GDD) has increased at most stations across the country (c) and the increase is significant in all regions for the 1948–2016 period (); for the longer 117-year period, significant increasing trends are found in every region with the exception of the Prairies. The number of cooling degree-days (CDD) has increased at many stations located south of 55°N (c): over the 1900–2016 period, the trends are significant in every southern region. Conversely, the number of heating degree-days (HDD) has decreased at all stations across the country, including in the north (c), and the trends are significant in every region for the 1948–2016 and 1900–2016 periods. The time series for Canada and southern Canada show a gradual increase in the number of GDDs and CDDs and a gradual decrease in HDDs with more interannual variability (c).
Changes in the annual and spring number of freeze–thaw days are not consistent across the country. The annual number of freeze–thaw days decreased at many locations in BC, southern Ontario, southern Quebec, the Maritimes, and the north during the 1948–2016 period; however, it has increased at most locations in the interior provinces (d). The number of spring freeze–thaw days follows a similar pattern of change across the country. Therefore, warming in central Canada has resulted in more days with daytime temperatures above zero while the nighttime temperatures remain below zero during the year and spring. Results are similar for the 1900–2016 period.
d Changes in Wet Days
The number of days with rainfall (≥1 mm) has increased in Canada. Although increasing trends are found at most locations across the country, they are more pronounced in the southern areas of BC and Ontario (a). The national series indicate that, on average, there has been an increase of 7.4 days with rainfall in Canada over the 1948–2012 period (). Regionally, the greatest increase occurred again in BC and Ontario. Averaged over southern Canada and for the 1900–2012 period, the number of days with rainfall has increased by about 8 days (Table S2). The time series for southern Canada shows a marked increase from the 1920s to the 1950s, followed by a smaller increase from the 1960s to 2012 (a).
Fig. 9 Trends in precipitation indices during the 1948–2012 period. Filled triangles indicate trends significant at the 5% level.
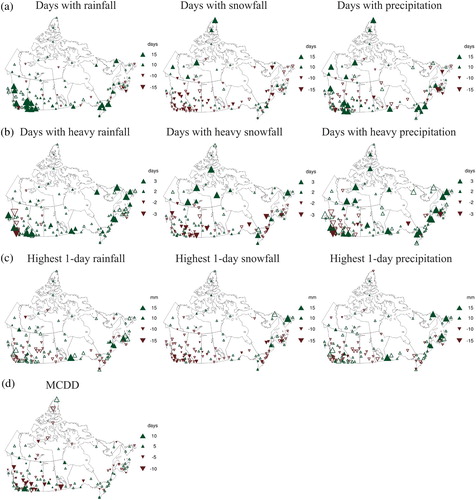
Fig. 10 Anomalies in precipitation indices averaged over Canada during the 1948–2012 period (blue) and southern Canada during the 1900–2012 period (red).
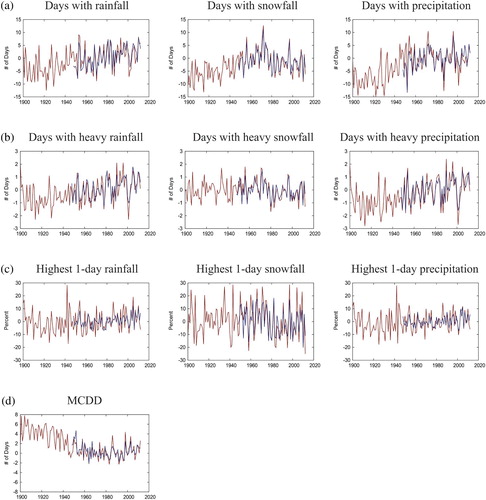
Table 4. Regional trends for precipitation indices for the 1948–2012 period.
Decreasing trends are found in the number of days with snowfall (≥1 mm) at most stations in the western provinces (BC to Manitoba) and at several stations in the east (from Ontario to the Maritimes); however, increasing trends are also found in the eastern regions and in the north (a). Regionally, BC has experienced a decrease of 6.3 days with snowfall for the 1948–2012 period, whereas the Northern region has seen an increase of 7.3 days (). During the 1900–2012 period, a positive trend is observed at most locations in the southern areas. The time series for southern Canada shows an increase from the 1900s to the mid-1970s, followed by a decrease to 2012 (a); the decreasing trend from the mid-1970s to 2012 is also evident over the shorter period for Canada as a whole.
The number of days with precipitation generally shows a mix of positive and negative trends, with some locations showing significant increasing trends (a). Regionally, the greatest increase occurs in the Northern region (). During the 1900–2012 period, the number of days with precipitation averaged over southern Canada has increased by 10.4 days (Table S2), and the increase is more pronounced from the 1900s to the 1950s (a).
e Changes in Very Wet Days
The number of days with heavy rainfall has increased by 2–3 days over the 1948–2012 period at several locations in BC, southern Ontario, southern Quebec, and in the eastern provinces (b). The national average shows an increase of 1.3 days during the same period (). Regionally, the greatest increase occurs in the Atlantic region. During the 1900–2012 period, the number of days with heavy rainfall also increased by 2–3 days in BC and the Maritimes: the southern Canada series show a gradual increase of 1.6 days over the past 113 years (b).
Decreasing trends of about 2–3 days are found in the number of days with heavy snowfall at many locations in the western provinces and at a few locations in Ontario, Quebec, and the Maritimes; increasing trends are also observed at a few locations in the eastern regions and at several locations in the north (b). Regionally, BC experienced a decrease of 1.3 days over the 1948–2012 period, whereas the Northern region saw an increasing trend of 2.2 days (). The time series for southern Canada indicates a small increase from 1900 to the 1970s, followed by a decrease to 2012 (b).
The number of days with heavy precipitation generally shows a mix of positive and negative trends: however, several locations across the country show a significant increase of 3 days or more during the 1948–2012 period (b). Regionally, the greatest increase occured in the Northern region (). The time series for southern Canada indicate a significant increase of 1.9 days with heavy precipitation over the past 113 years.
f Changes in the Highest 1-Day Precipitation Events
The annual highest 1-day rainfall, snowfall, and precipitation amounts have not changed considerably at most locations during either the 1948–2012 or 1900–2012 periods; a significant increasing trend was found at only a handful of stations (c). None of the regions indicate a significant change during the 1948–2012 or 1900–2012 periods. The time series for southern Canada shows an increasing (but not significant) trend in the annual highest 1-day rainfall and 1-day precipitation, whereas the time series for the annual 1-day snowfall shows a small increase from the beginning of the period to the 1970s followed by a decrease to 2012 (c); this time series also has considerable interannual variability.
g Changes in Dry Conditions
The maximum number of consecutive dry days (MCDD) shows a mix of positive and negative trends across the country (d). This index significantly decreased by 6–9 days at several locations in the southwest regions during the 1948–2012 period. Averaged over the country, the MCDD has not changed significantly during the past 65 years (). During the 1900–2012 period, the MCDD decreased at most locations in BC and the Prairies (Fig. S4). Averaged over southern Canada, the MCDD has decreased by about 6 days over the past 113 years: the time series shows a decreasing trend which is more pronounced from 1900 to the 1960s (d).
4 Discussion
Changes in Canada's climate are evident. The indices examined in this study were chosen to provide insights into current and potential future impacts of ongoing climate change on Canadians and sectors of the Canadian economy.
a Health
Hot days have increased by 1–3 days at a handful of stations in southern BC, Quebec, and the Maritimes. Hot nights have increased by 1–3 nights at a few stations in southern Ontario and Quebec. The summer 95th percentile of tmax and tmin, averaged over the country, has increased by 0.9° and 1.3°C, respectively, for the 1948–2016 period, and increasing trends were found across the nation. These very warm temperature conditions have the potential to have serious effects on human health and well-being in Canada (Berry, Clarke, Fleury, & Parker, Citation2014), and their occurrence is expected to increase as the climate continues to warm in these regions (Casati et al., Citation2013).
b Tourism
Summer days have increased at most stations south of 65°N: the national average indicates an increase of 6.9 more summer days during the 1948–2016 period. This change in warm conditions can be beneficial for summer tourism activities including golfing, fishing, canoeing, and camping because these activities will profit from a longer warm-weather season (Kovacs & Thistlethwaite, Citation2014). Conversely, days with snowfall and heavy snowfall have decreased by 2–3 days at many locations in the western provinces and at a few locations in Ontario, Quebec, and the Maritimes. As temperature continues to increase and days with snowfall and heavy snowfall continue to decrease, tourism based on winter sports, such as skiing and snowmobiling, will suffer from warmer temperatures and less snow on the ground (Kovacs & Thistlethwaite, Citation2014).
c Agriculture
The growing season has become longer by an average of more than 15 days over Canada during the past 69 years and an increase in GDDs has been observed at most stations across the country. Longer and warmer growing seasons would allow crops to be grown farther north, where soil conditions permit, and lengthen outdoor feeding seasons for livestock (Campbell, Durant, Hunter, & Hyatt, Citation2014). However, there will be new pests and diseases, as well as other challenges that could negatively affect agricultural sectors (Campbell et al., Citation2014). Fewer days with snowfall and heavy snowfall resulting in less snow on the ground during the spring could also have a negative impact on agriculture as water availability decreases (Blankinship & Hart, Citation2012).
d Energy Consumption
The winter 5th percentiles of tmax and of tmin, averaged over the country, have increased by 3.2° and 3.5°C, respectively, during the 1948–2016 period, and HDDs have substantially decreased at all stations. This reduction in HDDs along with fewer very cold days and frost days could reduce the demand for heating buildings and energy consumption (Instanes, Citation2005). However, many stations located south of 55°N have indicated an increase in CDDs, which can also affect the demand for energy (Instanes, Citation2005).
e Shipping Industry
Fewer frost days and consecutive frost days have been observed at almost all stations across the country. The number of frost days and consecutive frost days, averaged over the nation, decreased by more than 15 and 18 days, respectively, during the 1948–2016 period, resulting in a longer frost-free season by more than 20 days. A longer frost-free season can affect the shipping industry because ships will be able to travel on the Great Lakes and St. Lawrence Seaway for a longer period of time if water levels permit (Andrey et al., Citation2014). In addition, the shipping season in the Arctic will become longer assuming favourable ice conditions (Weller, Citation2005).
f Road Maintenance and Production of Maple Syrup
The annual and spring number of freeze–thaw days decreased at many locations in BC, southern Ontario, southern Quebec, and in the Maritimes during the 1948–2016 period, whereas it has increased in the interior provinces. The warming in central Canada has resulted in more days with daytime temperatures above zero, while nighttime temperatures remain below zero. This change in weather conditions can have a negative impact on road maintenance (Hershfield, Citation1979; Ho & Gough, Citation2006; Schmidlin et al., Citation1987). Fewer freeze–thaw days during the spring can negatively influence the production of maple syrup in the southern regions of Ontario and Quebec (Duchesne et al., Citation2009; Pothier, Citation1995).
5 Conclusions
This study presents observed trends in several indices relevant to climate change impacts based on daily temperature and precipitation data. The indices are computed using the latest version of the daily homogenized temperature and adjusted precipitation, and the analyses presented here update some previous work by examining trends over a longer period of time. The number of stations with temperature and precipitation observations decreased considerably after 2005, mainly as a result of relocation and closure of traditional manual observation stations and the introduction of automated systems. Work is in progress for joining past manual and current automated weather observations in order to preserve continuity for climate trends and monitoring (Milewska et al., Citation2018; Milewska & Hogg, Citation2002; Milewska & Vincent, Citation2016; Vincent, Milewska, Wang, & Hartwell, Citation2018).
Results regarding the changes in very warm and very cold temperatures (defined by the summer and winter 95th and 5th percentiles of tmax and tmin) have revealed three important pieces of information. First, very cold temperatures have increased more than very warm temperatures. This is evident in stronger warming trends at the lower end of the daily temperature distribution than at the higher end (the 5th percentile has increased more than the 95th percentile). Second, nighttime very warm and very cold temperatures have warmed more than daytime very warm and very cold temperatures, both in the cold and warm seasons. This result is consistent with greater warming observed at nighttime than during daytime (Vincent et al., Citation2012). Finally, the trends are more pronounced during winter than during summer. Overall, these results are consistent with earlier publications (Bonsal et al., Citation2001; Wang et al., Citation2014) that have shown fewer days with low temperatures and more days with high temperatures, which together depict Canada's climate as becoming not only warmer but also much less cold. These results are also in agreement with those of the Fifth Assessment Report from the Intergovernmental Panel on Climate Change, which states that this kind of response should be expected in a warmer world (Collins et al., Citation2013; Kirtman et al., Citation2013). Explaining the causes of the diurnal asymmetry in Canada's warming is beyond the scope of the paper; however, a recent study has suggested that the diurnal asymmetry in observed global warming could be a result of shallow boundary layers forming at night (Davy, Esau, Chernokulsky, Outten, & Zilitinkevich, Citation2017).
The changes in precipitation indices show considerable spatial and temporal variability, and the trends at regional and national scales are based on a limited number of stations. Overall, the number of days with rainfall and heavy rainfall has increased in the southern regions, while the number of days with snowfall and heavy snowfall has decreased in the western regions and increased in the north during the past 65 years. It is possible that at a number of stations in the south, the precipitation type changed from solid to liquid around the 1970s because of warmer spring temperatures resulting in fewer days with snowfall and heavy snowfall in the southern regions. The number of days with precipitation and with heavy precipitation has increased at several stations across the country. While significant increasing trends in the annual highest 1-day rainfall, 1-day snowfall, and 1-day precipitation can be found at some isolated stations, the spatial distribution of these stations does not form a spatial clustering pattern and the percentage of stations showing significant trends is not larger than would be expected by chance. It is concluded that there is no evidence of significant change in this type of extreme precipitation for Canada as a whole. The lack of a detectable significant change in extreme precipitation for the country means that changes in extreme precipitation, if they exist, may still be too small to be distinguishable from natural climatic variability. These findings are also in agreement with the trends observed in short-duration (a day or shorter) extreme rainfall amounts (Mekis, Vincent, Shephard, & Zhang, Citation2015; Shephard et al., Citation2014).
Most of the findings regarding trends in indices based on daily temperature and precipitation reported in previous studies are supported by the current analysis that included more recent years and used the best available data for trend analysis. The consistency of these results indicates that the detected trends are robust and are not caused by non-climatic factors, such as relocation of observing sites and changes in observing procedures. However, some of the results are different. This includes the trends in winter 5th and 95th percentiles of tmax and tmin in the northeast region of the country which show an increase over the 1948–2016 period and a decrease over the 1950–1998 period (Bonsal et al., Citation2001). An additional 17 years of recent data have reversed the trends from negative to positive at most stations in this region. This suggests the importance of low-frequency modes of climate variability, such as the North Atlantic Oscillation (Yu, Lin, Wu, & Merryfield, Citation2017), affecting the long-term climate trend. Another important difference is the trend in the number of days with rainfall. Averaged over the country, the current study has found an increase of about 7 days over the 1948–2012 period, whereas Vincent and Mekis (Citation2006) show a much larger increase, of about 20 days, for the 1950–2003 period. The difference is largely due to a difference in the definition of a day with rainfall. In Vincent and Mekis (Citation2006), days with rainfall greater than the trace amount were first used. It was then recognized that the trace events have not been reported consistently in the past, leading to potential inhomogeneities in the annual number of days with rainfall. In the current study, days with rainfall greater than or equal to 1 mm were used instead to avoid these inhomogeneities. Despite the different definitions and possible inhomogeneities in Vincent and Mekis (Citation2006), the conclusion of an increase in the number of days with rainfall is robust.
In conclusion, this study improves our knowledge of trends in climate conditions affecting Canadians. The results are consistent with expectations based on a warming climate, and Canada has already warmed substantially over the past century. The lack of increasing trends in summer very warm temperature in the Prairies and no consistently observed changes in the annual highest 1-day precipitation amount for the country as a whole are noted, but a warming climate does not necessarily mean that all regions will warm at the same rate and that precipitation will change similarly. Further research is needed to understand the causes of changes at regional levels because these indices demonstrate a high degree of spatial variability. Further research is also needed to better understand how changes in daily temperature and precipitation conditions can affect Canada's economy and ecological systems, as well as the everyday lives of Canadians.
Supplemental Data
Supplemental information for this article can be accessed at http://dx/doi.org/10.1080/07055900.2018.1514579.
Supplemental Material
Download PDF (491.4 KB)Acknowledgements
The authors would like to thank Sharon Stone and Robert Whitewood from Environment and Climate Change Canada and two anonymous reviewers for their useful comments and suggestions that helped improve the manuscript.
Disclosure statement
No potential conflict of interest was reported by the authors.
Related Research Data
References
- Andrey, J., Kertland, P., & Warren, F. J. (2014). Water and transportation infrastructure. In F. J. Warren, & D. S. Lemmen (Eds.), Canada in a changing climate: Sector perspectives on impacts and adaptation (pp. 233–252). Ottawa, Ontario: Natural Resources Canada, Government of Canada.
- Berry, P., Clarke, K. L., Fleury, M. D., & Parker, S. (2014). Human health. In F. J. Warren, & D. S. Lemmen (Eds.), Canada in a changing climate: Sector perspectives on impacts and adaptation (pp. 191–232). Ottawa, Ontario: Natural Resources Canada, Government of Canada.
- Blankinship, J. C., & Hart, S. C. (2012). Consequences of manipulated snow cover on soil gaseous emission and N retention in the growing season: A meta-analysis. Ecosphere, 3(1), 1–20. doi: 10.1890/ES11-00225.1
- Bonsal, B. R., Zhang, X., Vincent, L. A., & Hogg, W. D. (2001). Characteristics of daily and extreme temperatures over Canada. Journal of Climate, 14, 1959–1976. doi: 10.1175/1520-0442(2001)014<1959:CODAET>2.0.CO;2
- Bootsma, A., Anderson, D., & Gameda, S. (2011). Potential impacts of climate change on agroclimatic indices in southern regions of Ontario and Quebec (Technical Bulletin, ECORC Contribution No. 03-284). Ottawa, Ontario: Agriculture and Agri-Food Canada, Research Branch, Eastern Cereal and Oilseed Research Centre.
- Brown, R., Derksen, C., & Wang, L. (2010). A multi-dataset analysis of variability and change in Arctic spring snow cover extent, 1967–2008. Journal of Geophysical Research, 115, 3673. doi:10.1029/2010JD013975 doi: 10.1029/2009JE003333
- Bush, E. J., Loder, J. W., James, T. S., Mortsch, L. D., & Cohen, S. J. (2014). An overview of Canada’s changing climate. In F. J. Warren, & D. S. Lemmen (Eds.), Canada in a changing climate: Sector perspectives on impacts and adaptation (pp. 23–64). Ottawa, Ontario: Natural Resources Canada, Government of Canada.
- Campbell, I. D., Durant, D. G., Hunter, K. L., & Hyatt, K. D. (2014). Food production. In F. J. Warren, & D. S. Lemmen (Eds.), Canada in a changing climate: Sector perspectives on impacts and adaptation (pp. 99–134). Ottawa, Ontario: Natural Resources Canada, Government of Canada.
- Casati, B., Yagouti, A., & Chaumont, D. (2013). Regional climate projections of extreme heat events in nine pilot Canadian communities for public health planning. Journal of Applied Meteorology and Climatology, 52, 2669–2698. doi: 10.1175/JAMC-D-12-0341.1
- Collins, M., Knutti, R., Arblaster, J., Dufresne, J.-L., Fichefet, T., Friedlingstein, P., … Wehner, M. (2013). Long-term climate change: Projections, commitments and irreversibility. In T. F. Stocker, D. Qin, G.-K. Plattner, M. Tignor, S. K. Allen, J. Boschung, A. Nauels, Y. Xia, V. Bex, & P. M. Midgley (Eds.), Climate change 2013: The physical science basis. Contribution of Working Group I to the Fifth Assessment Report of the Intergovernmental Panel on Climate Change (pp. 1029–1136). Cambridge, United Kingdom and New York, NY: Cambridge University Press. doi: 10.1017/CBO9781107415324.024
- Davy, R., Esau, I., Chernokulsky, A., Outten, S., & Zilitinkevich, S. (2017). Diurnal asymmetry to the observed global warming. International Journal of Climatology, 37, 79–93. doi: 10.1002/joc.4688
- Devine, K. A., & Mekis, É. (2008). Field accuracy of Canadian rain measurements. Atmosphere-Ocean, 46(2), 213–227. doi: 10.3137/ao.460202
- Donat, M. G., Alexander, L. V., Yang, H., Durre, I., Vose, R., Dunn, R. J. H., … Kitching, S. (2013). Updated analyses of temperature and precipitation extreme indices since the beginning of the twentieth century: The HadEX2 dataset. Journal of Geophysical Research: Atmospheres, 118, 2098–2118. doi: 10.1002/jgrd.50150
- Duchesne, L., Houle, D., Côté, M.-A., & Logan, T. (2009). Modelling the effect of climate on maple syrup production in Québec, Canada. Forest Ecology and Management, 258, 2683–2689. doi: 10.1016/j.foreco.2009.09.035
- Gullett, D. W., & Skinner, W. R. (1992). The state of Canada‘s climate: Temperature change in Canada 1895–1991 (SOE Report no. 92-2. Catalogue No. En 1-11/92-2E.A), State of the Environment Report, ISSN 0843-6193. Toronto, ON: Environment Canada.
- Hershfield, D. M. (1979). Freeze-thaw cycles, potholes, and the winter of 1977–78. Journal of Applied Meteorology, 18, 1003–1007. doi: 10.1175/1520-0450(1979)018<1003:FTCPAT>2.0.CO;2
- Ho, E., & Gough, W. A. (2006). Freeze thaw cycles in Toronto, Canada in a changing climate. Theoretical and Applied Climatology, 83, 203–210. doi: 10.1007/s00704-005-0167-7
- Instanes, A. (2005). Infrastructure: Buildings, support systems, and industrial facilities. In Arctic climate impact assessment (pp. 907–944). New York: Cambridge University Press.
- Kendall, M. G. (1955). Rank correlation methods (2nd ed.). London, UK: Charles Griffin and Company.
- Kirtman, B., Power, S. B., Adedoyin, J. A., Boer, G. J., Bojariu, R., Camilloni, I., … Wang, H. J. (2013). Near-term climate change: Projections and predictability. In T. F. Stocker, D. Qin, G.-K. Plattner, M. Tignor, S. K. Allen, J. Boschung, A. Nauels, Y. Xia, V. Bex, & P. M. Midgley (Eds.), Climate change 2013: The physical science basis. Contribution of Working Group I to the Fifth Assessment Report of the Intergovernmental Panel on Climate Change (pp. 1029–1136). Cambridge, United Kingdom and New York, NY: Cambridge University Press. doi: 10.1017/CBO9781107415324.024
- Kovacs, P., & Thistlethwaite, J. (2014). Industry. In F. J. Warren, & D. S. Lemmen (Eds.), Canada in a changing climate: Sector perspectives on impacts and adaptation (pp. 135–158). Ottawa, Ontario: Government of Canada.
- Mekis, É., & Brown, R. (2010). Derivation of an adjustment factor map for the estimation of the water equivalent of snowfall from ruler measurements in Canada. Atmosphere-Ocean, 48(4), 284–293. doi: 10.3137/AO1104.2010
- Mekis, É., Donaldson, N., Reid, J., Hoover, J., Zucconi, A., Li, Q., … Melo, S. (2018). An overview of surface-based precipitation observations at Environment and Climate Change Canada. Atmosphere-Ocean, 56(2), 71–95. doi: 10.1080/07055900.2018.1433627
- Mekis, É., & Hogg, W. D. (1999). Rehabilitation and analysis of Canadian daily precipitation time series. Atmosphere-Ocean, 37(1), 53–85. doi: 10.1080/07055900.1999.9649621
- Mekis, É., & Vincent, L. A. (2011). An overview of the second generation adjusted daily precipitation dataset for trend analysis in Canada. Atmosphere-Ocean, 49(2), 163–177. doi: 10.1080/07055900.2011.583910
- Mekis, É., Vincent, L. A., Shephard, M. W., & Zhang, X. (2015). Observed trends in severe weather conditions based on humidex, wind chill, and heavy rainfall events in Canada for 1953–2012. Atmosphere-Ocean, 53(4), 383–397. doi: 10.1080/07055900.2015.1086970
- Milewska, E., & Hogg, W. D. (2002). Continuity of climatological observations with automation – temperature and precipitation amounts from AWOS (Automated Weather Observing System). Atmosphere-Ocean, 40(3), 333–359. doi: 10.3137/ao.400304
- Milewska, E. J., & Vincent, L. A. (2016). Preserving continuity of long-term daily maximum and minimum temperature observations with automation of reference climate stations using overlapping data and meteorological conditions. Atmosphere-Ocean, 54(1), 32–47. doi: 10.1080/07055900.2015.1135784
- Milewska, E.J., Vincent, L.A., Hartwell, M., Charlesworth, K., & Mekis, É. (2018). Adjusting precipitation amounts from Geonor and Pluvio automated weighing gauges to preserve continuity of observations in Canada. Canadian Water Resources Journal. Advance online publication. doi:10.1080/07011784.2018.1530611
- Mudryk, L. R., Derksen, C., Howell, S., Laliberté, F., Thackeray, C., Sospedra-Alfonso, R., … Brown, R. (2018). Canadian snow and sea ice: Historical trends and projections. The Cryosphere, 12, 1157–1176. doi: 10.5194/tc-12-1157-2018
- Pothier, D. (1995). Effets des coupes d’éclaircie et des variations climatiques interannuelles sur la production et la teneur en sucre de la sève d’une érablière [Effects of tree clearing and interannual climate variability on the production and sugar content of sap from maple trees]. Canadian Journal of Forest Research, 25, 1815–1820. doi: 10.1139/x95-196
- Qian, B., Zhang, X., Chen, H., Feng, Y., & O’Brien, T. (2010). Observed long-term trends for agroclimatic conditions in Canada. Journal of Applied Meteorology and Climatology, 49, 604–618. doi: 10.1175/2009JAMC2275.1
- Schmidlin, T. W., Derthier, B. E., & Eggleston, K. L. (1987). Freeze-thaw days in the northeastern United States. Journal of Climate and Applied Meteorology, 26, 142–155. doi: 10.1175/1520-0450(1987)026<0142:FTDITN>2.0.CO;2
- Sen, P. K. (1968). Estimates of the regression coefficient based on Kendall’s tau. Journal of the American Statistical Association, 63, 1379–1389. doi: 10.1080/01621459.1968.10480934
- Seneviratne, S. I., Nicholls, N., Easterling, D., Goodess, C. M., Kanae, S., & Zhang, X. (2012). Changes in climate extremes and their impacts on the natural physical environment. In C. B. Field, V. Barros, T. F. Stocker, D. Qin, D. J. Dokken, K. L. Ebi, M. D. Mastrandrea, K. J. Mach, G.-K. Plattner, S. K. Allen, M. Tignor, & P. M. Midgley (Eds.), Managing the risks of extreme events and disasters to advance climate change adaptation. A special report of Working Groups I and II of the Intergovernmental Panel on Climate Change (IPCC) (pp. 109–230). Cambridge, UK, and New York, NY: Cambridge University Press.
- Shephard, M. W., Mekis, E., Morris, R. J., Feng, Y., Zhang, X., Kilcup, K., & Fleetwood, R. (2014). Trends in Canadian short-duration extreme rainfall: Including an intensity-duration-frequency perspective. Atmosphere-Ocean, 52(5), 398–417. doi: 10.1080/07055900.2014.969677
- Vincent, L. A., & Mekis, É. (2006). Changes in daily and extreme temperature and precipitation indices for Canada over the twentieth century. Atmosphere-Ocean, 44(2), 177–193. doi: 10.3137/ao.440205
- Vincent, L. A., Milewska, E. J., Wang, X. L., & Hartwell, M. M. (2018). Uncertainty in homogenized daily temperatures and derived indices of extremes illustrated using parallel observations in Canada. International Journal of Climatology, 38(2), 692–707. doi: 10.1002/joc.5203
- Vincent, L. A., Wang, X. L., Milewska, E. J., Wan, H., Yang, F., & Swail, V. (2012). A second generation of homogenized Canadian monthly surface air temperature for climate trend analysis. J. Geophys. Res, 117, D18110. doi: 10.1029/2012JD017859
- Vincent, L. A., Zhang, X., Bonsal, B. R., & Hogg, W. D. (2002). Homogenization of daily temperatures over Canada. Journal of Climate, 15, 1322–1334. doi: 10.1175/1520-0442(2002)015<1322:HODTOC>2.0.CO;2
- Vincent, L. A., Zhang, X., Brown, R. D., Feng, Y., Mekis, É., Milewska, E. J., … Wang, X. L. (2015). Observed trends in Canada’s climate and influence of low-frequency variability modes. Journal of Climate, 28, 4545–4560. doi: 10.1175/JCLI-D-14-00697.1
- Wang, X. L., Feng, Y., & Vincent, L. A. (2014). Observed changes in one-in-20 year extremes of Canadian surface air temperatures. Atmosphere-Ocean, 52(3), 222–231. doi: 10.1080/07055900.2013.818526
- Wang, X. L., & Swail, V. R. (2001). Changes of extreme wave heights in northern hemisphere oceans and related atmospheric circulation regimes. Journal of Climate, 14, 2204–2221. doi: 10.1175/1520-0442(2001)014<2204:COEWHI>2.0.CO;2
- Warren, F. J., & Lemmen, D. S. (Eds.). (2014). Canada in a changing climate: Sector perspectives on impacts and adaptation (Cat. No.: M174-2/2014E), Ottawa, Ontario: Government of Canada. Retrieved from adaptation.nrcan.gc.ca
- Weller, G. (2005). Summary and synthesis of the ACIA. In Arctic climate impact assessment (pp. 989–1020). New York: Cambridge University Press.
- Yagouti, A., Boulet, G., Vincent, L. A., Vescovi, L., & Mekis, E. (2008). Observed changes in daily temperature and precipitation indices for southern Québec, 1960–2005. Atmosphere-Ocean, 46(2), 243–256. doi: 10.3137/ao.460204
- Yu, B., Lin, H., Wu, Z. W., & Merryfield, W. J. (2017). The Asian-Bering-North American teleconnection: Seasonality, maintenance and climate impact on North America. Climate Dynamics. doi: 10.1007/s00382-017-3734-6
- Zhang, X., Brown, R., Vincent, L., Skinner, W., Feng, Y., & Mekis, É. (2011). Canadian climate trends, 1950–2007. Canadian biodiversity: Ecosystem status and trends 2010 (Technical Thematic Report No. 5). Ottawa, Ontario: Canadian Councils of Resource Ministers. Retrieved from http://www.biodivcanada.ca/default.asp?lang=En&n=137E1147-0
- Zhang, X., Hogg, W. D., & Mekis, É. (2001). Spatial and temporal characteristics of heavy precipitation events over Canada. Journal of Climate, 14, 1923–1936. doi: 10.1175/1520-0442(2001)014<1923:SATCOH>2.0.CO;2
- Zhang, X., Vincent, L. A., Hogg, W. D., & Niitsoo, A. (2000). Temperature and precipitation trends in Canada during the 20th Century. Atmosphere-Ocean, 38, 395–429. doi: 10.1080/07055900.2000.9649654